Embed Size (px)
Citation preview

NREL is a national laboratory of the U.S. Department of Energy Office of Energy Efficiency & Renewable Energy Operated by the Alliance for Sustainable Energy, LLC
This report is available at no cost from the National Renewable Energy Laboratory (NREL) at www.nrel.gov/publications.
Contract No. DE-AC36-08GO28308
Chapter 6: Residential Lighting Evaluation Protocol The Uniform Methods Project: Methods for Determining Energy Efficiency Savings for Specific Measures Created as part of subcontract with period of performance September 2011 – December 2014
This version supersedes the version originally published in April 2013. The content in this version has been updated.
Scott Dimetrosky, Katie Parkinson, and Noah Lieb Apex Analytics, LLC Boulder, Colorado
NREL Technical Monitor: Charles Kurnik
Subcontract Report NREL/SR-7A40-68562 October 2017

NREL is a national laboratory of the U.S. Department of Energy Office of Energy Efficiency & Renewable Energy Operated by the Alliance for Sustainable Energy, LLC
This report is available at no cost from the National Renewable Energy Laboratory (NREL) at www.nrel.gov/publications.
Contract No. DE-AC36-08GO28308
National Renewable Energy Laboratory 15013 Denver West Parkway Golden, CO 80401 303-275-3000 • www.nrel.gov
Chapter 6: Residential Lighting Evaluation Protocol The Uniform Methods Project: Methods for Determining Energy Efficiency Savings for Specific Measures Created as part of subcontract with period of performance September 2011 – December 2014 This version supersedes the version originally published in April 2013. The content in this version has been updated.
Scott Dimetrosky, Katie Parkinson, and Noah Lieb Apex Analytics, LLC Boulder, Colorado
NREL Technical Monitor: Charles Kurnik
Prepared under Subcontract No. LGJ-1-11965-01
Subcontract Report NREL/SR-7A40-68562 October 2017

This publication was reproduced from the best available copy submitted by the subcontractor.
NOTICE
This report was prepared as an account of work sponsored by an agency of the United States government. Neither the United States government nor any agency thereof, nor any of their employees, makes any warranty, express or implied, or assumes any legal liability or responsibility for the accuracy, completeness, or usefulness of any information, apparatus, product, or process disclosed, or represents that its use would not infringe privately owned rights. Reference herein to any specific commercial product, process, or service by trade name, trademark, manufacturer, or otherwise does not necessarily constitute or imply its endorsement, recommendation, or favoring by the United States government or any agency thereof. The views and opinions of authors expressed herein do not necessarily state or reflect those of the United States government or any agency thereof.
This report is available at no cost from the National Renewable Energy Laboratory (NREL) at www.nrel.gov/publications.
Available electronically at SciTech Connect http:/www.osti.gov/scitech
Available for a processing fee to U.S. Department of Energy and its contractors, in paper, from:
U.S. Department of Energy Office of Scientific and Technical Information P.O. Box 62 Oak Ridge, TN 37831-0062 OSTI http://www.osti.gov Phone: 865.576.8401 Fax: 865.576.5728 Email: [email protected]
Available for sale to the public, in paper, from:
U.S. Department of Commerce National Technical Information Service 5301 Shawnee Road Alexandria, VA 22312 NTIS http://www.ntis.gov Phone: 800.553.6847 or 703.605.6000 Fax: 703.605.6900 Email: [email protected]
Cover Photos by Dennis Schroeder: (left to right) NREL 26173, NREL 18302, NREL 19758, NREL 29642, NREL 19795.
NREL prints on paper that contains recycled content.

iii
This report is available at no cost from the National Renewable Energy Laboratory at www.nrel.gov/publications.
Disclaimer These methods, processes, or best practices (“Practices”) are provided by the National Renewable Energy Laboratory (“NREL”), which is operated by the Alliance for Sustainable Energy LLC (“Alliance”) for the U.S. Department of Energy (the “DOE”).
It is recognized that disclosure of these Practices is provided under the following conditions and warnings: (1) these Practices have been prepared for reference purposes only; (2) these Practices consist of or are based on estimates or assumptions made on a best-efforts basis, based upon present expectations; and (3) these Practices were prepared with existing information and are subject to change without notice.
The user understands that DOE/NREL/ALLIANCE are not obligated to provide the user with any support, consulting, training or assistance of any kind with regard to the use of the Practices or to provide the user with any updates, revisions or new versions thereof. DOE, NREL, and ALLIANCE do not guarantee or endorse any results generated by use of the Practices, and user is entirely responsible for the results and any reliance on the results or the Practices in general.
USER AGREES TO INDEMNIFY DOE/NREL/ALLIANCE AND ITS SUBSIDIARIES, AFFILIATES, OFFICERS, AGENTS, AND EMPLOYEES AGAINST ANY CLAIM OR DEMAND, INCLUDING REASONABLE ATTORNEYS' FEES, RELATED TO USER’S USE OF THE PRACTICES. THE PRACTICES ARE PROVIDED BY DOE/NREL/ALLIANCE "AS IS," AND ANY EXPRESS OR IMPLIED WARRANTIES, INCLUDING BUT NOT LIMITED TO THE IMPLIED WARRANTIES OF MERCHANTABILITY AND FITNESS FOR A PARTICULAR PURPOSE ARE DISCLAIMED. IN NO EVENT SHALL DOE/NREL/ALLIANCE BE LIABLE FOR ANY SPECIAL, INDIRECT OR CONSEQUENTIAL DAMAGES OR ANY DAMAGES WHATSOEVER, INCLUDING BUT NOT LIMITED TO CLAIMS ASSOCIATED WITH THE LOSS OF PROFITS, THAT MAY RESULT FROM AN ACTION IN CONTRACT, NEGLIGENCE OR OTHER TORTIOUS CLAIM THAT ARISES OUT OF OR IN CONNECTION WITH THE ACCESS, USE OR PERFORMANCE OF THE PRACTICES.
iv
This report is available at no cost from the National Renewable Energy Laboratory at www.nrel.gov/publications.
Preface This document was developed for the U.S. Department of Energy Uniform Methods Project (UMP). The UMP provides model protocols for determining energy and demand savings that result from specific energy-efficiency measures implemented through state and utility programs. In most cases, the measure protocols are based on a particular option identified by the International Performance Verification and Measurement Protocol; however, this work provides a more detailed approach to implementing that option. Each chapter is written by technical experts in collaboration with their peers, reviewed by industry experts, and subject to public review and comment. The protocols are updated on an as-needed basis.
The UMP protocols can be used by utilities, program administrators, public utility commissions, evaluators, and other stakeholders for both program planning and evaluation.
To learn more about the UMP, visit the website, https://energy.gov/eere/about-us/ump-home, or download the UMP introduction document at http://www.nrel.gov/docs/fy17osti/68557.pdf.
v
This report is available at no cost from the National Renewable Energy Laboratory at www.nrel.gov/publications.
Acknowledgments The chapter authors wish to thank and acknowledge the following individuals for their thoughtful comments and suggestions on drafts of this protocol:
• Jennifer Conseco and Mimi Goldberg, DNV GL
• David Barclay and Kiersten von Trapp, NMR
• Dick Spellman, GDS Associates
• M. Sami Khawaja and Scott Walker, Cadmus.
Suggested Citation Dimetrosky, S.; Parkinson, K.; Lieb, N. (2017). Chapter 6: Residential Lighting Evaluation Protocol, The Uniform Methods Project: Methods for Determining Energy-Efficiency Savings for Specific Measures. Golden, CO; National Renewable Energy Laboratory. NREL/SR-7A40-68562. http://www.nrel.gov/docs/fy17osti/68562.pdf

vi
This report is available at no cost from the National Renewable Energy Laboratory at www.nrel.gov/publications.
Acronyms CFL compact fluorescent lamp
CV coefficient of variation
DOE U.S. Department of Energy
EISA Energy Information and Security Act
EUL effective useful life
GISL general service incandescent lamp
GSL general service lamp
HOU hours of use
HVAC heating, ventilating, and air conditioning
ISR in-service rate
LED light-emitting diode
NTG net-to-gross
PCF peak coincidence factor
TRM technical reference manual
UMP Uniform Methods Project
W watt

vii
This report is available at no cost from the National Renewable Energy Laboratory at www.nrel.gov/publications.
Protocol Updates The original version of this protocol was published in April 2013 and revised in January 2015. This chapter has been updated to incorporate the following revisions:
1. Shift the focus to light-emitting diodes (LEDs). The previous (2015) chapter language and guidance focused almost exclusively on compact fluorescent lamps (CFLs). Due to the ubiquity of LEDs coupled with the removal of CFLs from both manufacturer and program administrator offerings, the current chapter has updated the guidance to reflect this transition to LEDs.
2. Addressed Energy Information and Security Act changes. Incorporated discussion of the U.S. Department of Energy (DOE) Final Rules on General Service Lamps (GSL) for the second phase of EISA, which includes expansion of GSLs, reflectors, and lifetime of lamps given post-2020 changes.
3. Updated in-service rate (ISR). The focus of the ISR section shifted to reflect LEDs and was simplified for lifetime ISR.
4. Hours of use. Included new metering studies as examples.
5. Value line LEDs. This new section includes a discussion on whether to address value line LEDs as a baseline or net-to-gross issue.

viii
This report is available at no cost from the National Renewable Energy Laboratory at www.nrel.gov/publications.
Table of Contents 1 Measure Description ............................................................................................................................ 1 2 Application Conditions of Protocol .................................................................................................... 3 3 Savings Calculations ........................................................................................................................... 4 4 Measurement and Verification Plan .................................................................................................... 5
4.1 Number of Measures Sold or Distributed ........................................................................................ 5 4.2 Delta Watts ...................................................................................................................................... 6
4.2.1 Approaches for Estimating Baseline Wattage ................................................................... 6 4.2.2 Recommended Approach .................................................................................................. 9
4.3 Calculating Lifetime Savings Post-2020........................................................................................ 12 4.3.1 Changes to the EISA Post-2020 Legislation ................................................................... 12 4.3.2 Calculating Post-2020 Savings ....................................................................................... 13
4.4 Value Line LEDs ........................................................................................................................... 14 4.5 Annual Operating Hours ................................................................................................................ 14 4.6 Peak Coincidence Factor ................................................................................................................ 16 4.7 Metered Data Collection Method ................................................................................................... 16
4.7.1 Logger Type .................................................................................................................... 16 4.7.2 Length of Metering Period .............................................................................................. 16 4.7.3 Information Collected On-Site ........................................................................................ 17 4.7.4 Data Integrity .................................................................................................................. 17 4.7.5 Metering Sample Design ................................................................................................. 17
4.8 Using Secondary Data.................................................................................................................... 19 4.8.1 Similarities in Service Territories ................................................................................... 20 4.8.2 Sample Size ..................................................................................................................... 20 4.8.3 Length of Metering Period .............................................................................................. 20 4.8.4 Adjustments to Reflect Hours of Use by Room Type ..................................................... 20
4.9 Snapback/Rebound or Conservation Effect ................................................................................... 20 4.10 In-Service Rate ........................................................................................................................ 21 4.11 Interactive Effects with Heating, Ventilating, and Air Conditioning ...................................... 24
5 Other Evaluation Issues ..................................................................................................................... 25 5.1 Sales to Nonresidential Customers ................................................................................................ 25 5.2 Cross-Service Area Sales (Leakage) .............................................................................................. 26 5.3 Estimating Cross-Customer Class and Cross-Service Area Sales ................................................. 27
6 Looking Forward................................................................................................................................. 28 7 References .......................................................................................................................................... 29 8 Resources ........................................................................................................................................... 33

ix
This report is available at no cost from the National Renewable Energy Laboratory at www.nrel.gov/publications.
List of Figures Figure 1. Example of manufacturer-rated baseline wattage ................................................................... 7 Figure 2. Baseline wattage by lumens, EISA versus ENERGY STAR .................................................... 9
List of Tables Table 1. Strengths and Limitations of Alternative Delta Watts Estimation Approaches ..................... 8 Table 2. GSL Estimated Baseline Wattage for Lumen Equivalencies ................................................. 11 Table 3. Specialty Lamp Estimated Baseline Wattage for Lumen Equivalencies .............................. 11 Table 4. Directional (Reflector) Lamp Estimated Calculation for Baseline Wattage and Lumen
Equivalencies .............................................................................................................................. 12 Table 5. Estimated Efficient Lighting HOU From Recent Metering Studies ........................................ 15 Table 6. Example of Calculated CV From a Recent Lighting Metering Study ..................................... 18 Table 7. Estimated First-Year ISRs From Recent Evaluations of LED Upstream Lighting
Programs ..................................................................................................................................... 21 Table 8. Estimated First-Year ISRs From Recent Evaluations of LED Upstream Lighting
Programs ..................................................................................................................................... 23

1
This report is available at no cost from the National Renewable Energy Laboratory at www.nrel.gov/publications.
1 Measure Description Despite increasing market and regulatory uncertainty, residential lighting continues to represent a significant share of ratepayer-funded energy efficiency electricity savings. Up until a few years ago, program administrators achieved most of these savings by promoting the purchase and installation of compact fluorescent lamps (CFLs), both standard “twist/spiral” bulbs and specialty CFLs such as reflectors, A-Lamps, globes, and dimmable bulbs. In the past several years, most energy efficiency programs have transitioned to promoting solid-state light-emitting diode (LED) lamps instead of CFLs. This transition will probably accelerate in 2017 and subsequent years because of the new ENERGY STAR® v2.0 lighting specifications that are effectively limited to LED lamps.1
The 2007 Energy Independence and Security Act (EISA) required that, from 2012 through 2014, the energy efficiency of most types of screw-base light bulbs improve by approximately 28%, as measured by the efficacy in units of lumens per watt (lm/W). EISA requirements took effect in phases, beginning with 100-watt equivalents in 2012, 75-watt equivalents in 2013, and 60-watt and 40-watt equivalents in 2014, eliminating the domestic manufacturing or importation of legacy incandescent lamps. The legislation also has a second phase (backstop) provision ensuring that the previous EISA requirements produce savings equal to or greater than an efficiency standard of 45 lm/W by January 1, 2020.
On January 18, 2017, the U.S. Department of Energy (DOE) issued the Final Rules on General Service Lamps (GSL) for the second phase of EISA (U.S. Department of Energy 2016).2 These rules, in general, expand the definition of GSLs, extending the covered lumen range, base types, and shapes, as well as reducing the types of bulbs exempted. According to the rulings, these expanded bulbs will be subject to GSL efficiency standards, including the 2020 backstop, starting January 1, 2020. DOE did not, however, address whether the 45 lm/W will remain the 2020 standard or if a different standard will be applied.
Since EISA took effect in 2012, many lighting efficiency programs have continued to realize significant savings, but evaluating these programs has become increasingly complex since—as a phased-in legislation—EISA makes it difficult to determine the baseline as well as the measure lifetime (that is, whether or not savings will be realized after 2020).
Given new regulations, increased complexity in the market, and the general shift from CFLs to LEDs, this evaluation protocol was updated in 2017 to shift the focus of the protocols toward LEDs and away from CFLs and to resolve evaluation uncertainties affecting residential lighting incentive programs, including these:
1 As of early 2017, the vast majority of the qualified lamps on the ENERGY STAR Lighting v2.0 product list were LEDs, and a number of manufacturers (for example, GE) had stated that they were exiting the CFL market. (ENERGY STAR 2016) 2 According to the Department of Energy, General Service Lamps are defined as General Service Lamps (GSLs) include general service incandescent lamps (GSILs), CFLs, general service LED lamps, organic light-emitting diode lamps, and any other lamps that are used to satisfy lighting applications traditionally served by GSILs. GSLs are used in general lighting applications and account for the majority of installed lighting in the residential sector.

2
This report is available at no cost from the National Renewable Energy Laboratory at www.nrel.gov/publications.
• Incorporation of the latest DOE rulings on GSLs, including impacts on baselines, exemptions, and measure lifetime
• In-service rates (ISRs)
• Cross-sector sales and leakage.

3
This report is available at no cost from the National Renewable Energy Laboratory at www.nrel.gov/publications.
2 Application Conditions of Protocol Program administrators typically deliver residential lighting measures through these four mechanisms:
• Upstream buy-down/markdown. The most common approach to achieving residential lighting savings is to offer “upstream” incentives to manufacturers (buy-down) or to retailers (markdown) that reduce the cost of CFLs and LEDs for consumers. Because this delivery mechanism offers the discount at the time of purchase (that is, at the point of sale), the customers are not required to complete an application or any paperwork.
• Direct install. Many program administrators who offer residential audit programs include the direct installation of CFLs or LEDs at the time of an audit. Most programs offer audits at either no cost or at a highly-discounted cost to the customer, and there is usually no additional cost for the installed bulbs.
• Giveaways. Several program administrators have provided CFLs or LEDs free of charge to residential customers through the mail, at customer service offices, or at events organized by community, religious organizations, or local government agencies. In some programs, the CFLs or LEDs are mailed to customers only upon request. In other programs, the CFLs or LEDs are distributed without prior customer request. The amount of customer information collected at the time of the giveaway events varies; some program administrators require full name and contact information and others require no information.
• Coupons. Some program administrators have relied on instant (point-of-sale) or mail-in coupons as the incentive mechanism for residential lighting products. These coupons typically require that customers provide their names and contact information to obtain the product at the discounted price or to receive the rebate.
Although this Residential Lighting Evaluation Protocol applies to all of these delivery mechanisms, the strategies for collecting and analyzing the data necessary to calculate the savings tend to vary. This protocol highlights and provides details about the strategies and approaches to data collection and analysis.3
Also, program administrators may need to prioritize their evaluation resources to determine combinations of measures and delivery strategies, based on criteria such as the contribution to savings and the assessed uncertainty of those savings estimates. (For example, uncertainty can occur with programs that have not been evaluated for a while or that have shifting baselines.)
3 As discussed in Considering Resource Constraints in the Introduction chapter to this UMP report, small utilities (as defined under the U.S. Small Business Administration regulations) may face additional constraints in undertaking this protocol. Therefore, alternative methodologies should be considered for such utilities.
4
This report is available at no cost from the National Renewable Energy Laboratory at www.nrel.gov/publications.
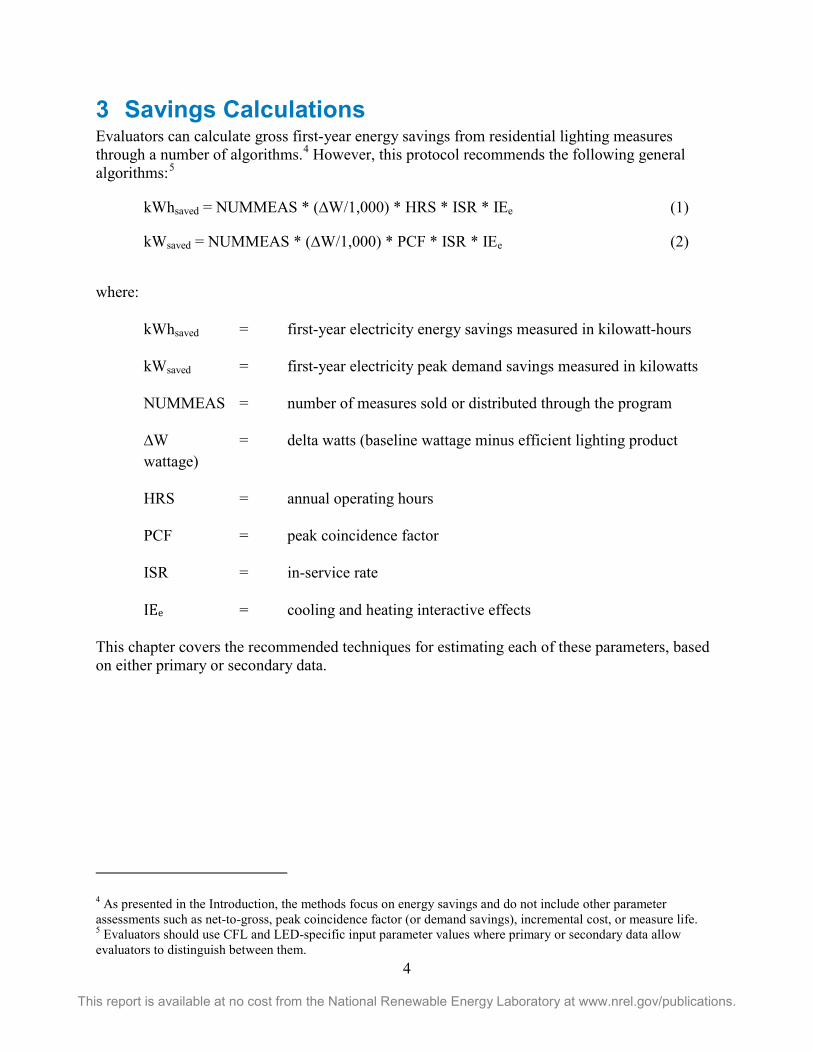
3 Savings Calculations Evaluators can calculate gross first-year energy savings from residential lighting measures through a number of algorithms.4 However, this protocol recommends the following general algorithms:5
kWhsaved = NUMMEAS * (∆W/1,000) * HRS * ISR * IEe (1)
kWsaved = NUMMEAS * (∆W/1,000) * PCF * ISR * IEe (2)
where:
kWhsaved = first-year electricity energy savings measured in kilowatt-hours
kWsaved = first-year electricity peak demand savings measured in kilowatts
NUMMEAS = number of measures sold or distributed through the program
∆W = delta watts (baseline wattage minus efficient lighting product wattage)
HRS = annual operating hours
PCF = peak coincidence factor
ISR = in-service rate
IEe = cooling and heating interactive effects
This chapter covers the recommended techniques for estimating each of these parameters, based on either primary or secondary data.
4 As presented in the Introduction, the methods focus on energy savings and do not include other parameter assessments such as net-to-gross, peak coincidence factor (or demand savings), incremental cost, or measure life. 5 Evaluators should use CFL and LED-specific input parameter values where primary or secondary data allow evaluators to distinguish between them.
5
This report is available at no cost from the National Renewable Energy Laboratory at www.nrel.gov/publications.
4 Measurement and Verification Plan Evaluators should calculate the savings from residential lighting measures through a mix of measured and estimated parameters. This protocol recommends this approach, which is similar to Option A of the International Performance Measurement and Verification Protocol (National Renewable Energy Laboratory 2002), because the values for some parameters (such as annual hours of use [HOU]) can be directly measured through metering. However, evaluators should estimate other parameters (such as delta watts for upstream lighting programs) through other techniques.
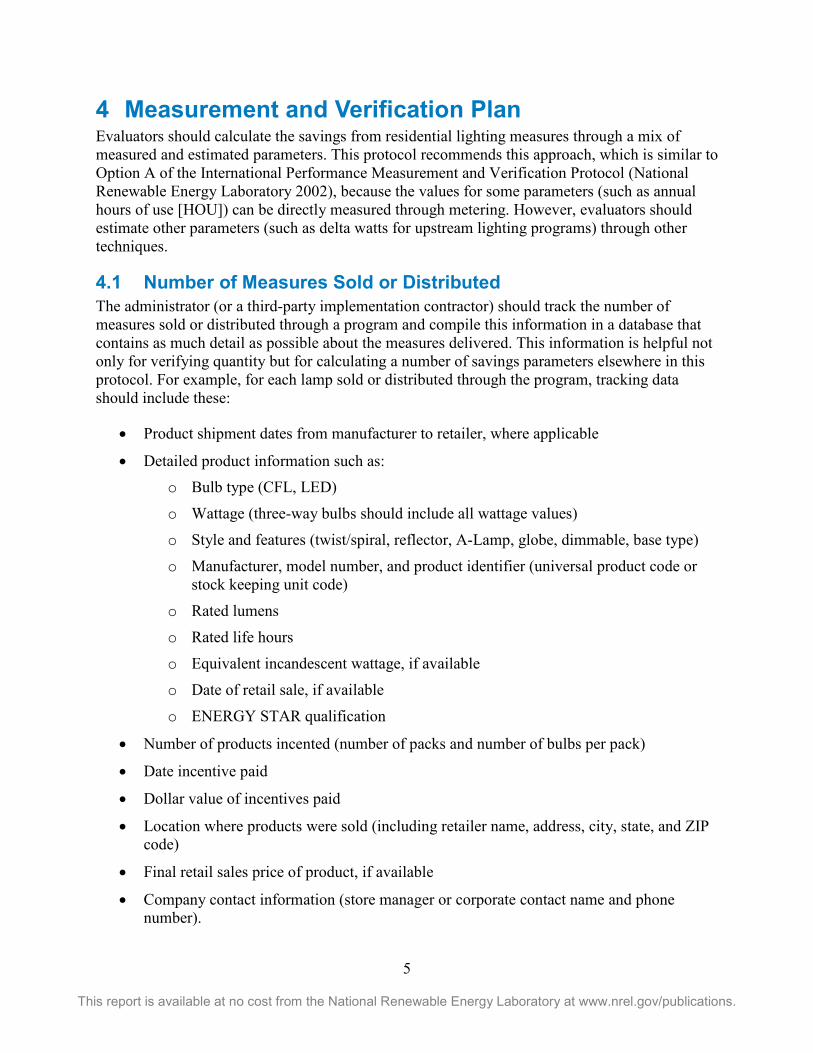
4.1 Number of Measures Sold or Distributed The administrator (or a third-party implementation contractor) should track the number of measures sold or distributed through a program and compile this information in a database that contains as much detail as possible about the measures delivered. This information is helpful not only for verifying quantity but for calculating a number of savings parameters elsewhere in this protocol. For example, for each lamp sold or distributed through the program, tracking data should include these:
• Product shipment dates from manufacturer to retailer, where applicable
• Detailed product information such as: o Bulb type (CFL, LED)
o Wattage (three-way bulbs should include all wattage values)
o Style and features (twist/spiral, reflector, A-Lamp, globe, dimmable, base type)
o Manufacturer, model number, and product identifier (universal product code or stock keeping unit code)
o Rated lumens
o Rated life hours
o Equivalent incandescent wattage, if available
o Date of retail sale, if available
o ENERGY STAR qualification
• Number of products incented (number of packs and number of bulbs per pack)
• Date incentive paid
• Dollar value of incentives paid
• Location where products were sold (including retailer name, address, city, state, and ZIP code)
• Final retail sales price of product, if available
• Company contact information (store manager or corporate contact name and phone number).

6
This report is available at no cost from the National Renewable Energy Laboratory at www.nrel.gov/publications.
For programs using other delivery strategies, administrators should collect similar details. For example:
• An audit program would typically require the numbers and types of products installed, the wattage of the replaced bulb and location (room type), the date of installation, and customer contact information.
• A giveaway program would typically require at least the customer contact information, the quantity and type of product given away, and the detailed product information previously listed.
At a minimum, the evaluation should include a basic verification of savings, whereby the evaluator first sums the detailed transactions then attempts to replicate the calculation of total claimed savings for the specific period, such as a program year or cycle, during which the savings were claimed.
Evaluators should treat discrepancies between the claimed and verified number of measures as adjustments to the number of program measures. In other words, if the number of measures claimed by a program administrator does not match the detailed tracking data, the evaluator should first attempt to resolve the discrepancy with the administrator (perhaps the evaluator received incomplete records) and, if unable to resolve, should regard the amount recorded in the tracking data as the correct number.
4.2 Delta Watts The difference between the wattage of the efficient lighting measure and the wattage of the assumed baseline measure is the delta watts. As noted, administrators should enter the wattage of the efficient measure in the program tracking database regardless of the program delivery mechanism.
Where possible―such as with direct install programs―the implementation contractor should record the wattage of the particular lamp that the program measure replaces.6 Typically, this is done at the time of the audit, when auditors replace the existing measure with the efficient measure. However, this is not possible for most program delivery strategies, so evaluators often need to estimate baseline wattage. The baseline assumptions need to incorporate the transition to EISA standards that began in 2012 and further revised based on the DOE Final Rules on GSLs, issued January 18, 2017.
4.2.1 Approaches for Estimating Baseline Wattage Recent studies have used these approaches for estimating baseline wattage:
• Self-report. Evaluators use customer surveys conducted after the installation to collect information about the wattage that consumers used before installation of the energy-efficient lighting.
6 The baseline lamp typically has a much shorter lifetime than the retrofit lamp and the baseline may shift over the life of the retrofit lamp (particularly because of EISA).

7
This report is available at no cost from the National Renewable Energy Laboratory at www.nrel.gov/publications.
• In-home inspections to examine wattage of lamps in equivalent fixtures. The implementation contractor examines the labeled wattage of bulbs in similar fixtures in each home to estimate the wattage the consumer used before the energy-efficient lighting was installed.
• Multipliers. Evaluators assume the baseline to be a multiple—for example, three or four times the wattage—of the efficient measure; thus, the evaluator will use one value (a single multiplier) across all program bulbs.
• EISA lumen equivalence.7 EISA standards require that lumen ranges and assumptions about the equivalent wattage of incandescent lamps be specified on all retail lamp packaging (see Figure 1). Evaluators use the EISA-based lumen equivalency tables to determine the baseline wattage (examples are provided in Section 4.2.2).
• ENERGY STAR lumen equivalence (manufacturer rating).8 Most energy-efficient lighting products prominently list replacement wattage assumptions on the box (Figure 1), and ENERGY STAR guidelines require these bulbs to use specific baseline wattages based on lumen bins.9 The Energy Labeling Rule requires manufacturers to include detailed information about lamp brightness (lumens) and efficacy as part of the “Lighting Facts” label.10 Evaluators use the actual equivalent rated wattage on the packaging.
Figure 1. Example of manufacturer-rated baseline wattage
7 EISA bins are provided in the legislation online at Lightopedia. http://www.lightopedia.com/_files/eisa/energy-independence-and-security-act-of-2007.pdf. 8 ENERGY STAR bins are provided on page 13 of the ENERGY STAR Lamp Specifications. https://www.energystar.gov/sites/default/files/ENERGY%20STAR%20Lamps%20V2_0%20Revised%20OCT-2016_1.pdf, page 13 9 ENERGY STAR Lamps V1.0 requires a standard manufacturer baseline rating scale based on brightness (lumens) and bulb shape. Detailed specifications are available online. ENERGY STAR. “Certified Products.” Available online: https://www.energystar.gov/products/specs/lamps_specification_version_1_0_pd 10 Information about this rule is available online at: http://www.energystar.gov/index.cfm?c=cfls.pr_cfls_lumens. (Federal Trade Commission 2013).
Equivalent wattage

8
This report is available at no cost from the National Renewable Energy Laboratory at www.nrel.gov/publications.
Table 1 lists the strengths and limitations of each of these approaches.
Table 1. Strengths and Limitations of Alternative Delta Watts Estimation Approaches
Approach for Estimating Baseline Wattage Strengths Limitations
Customer self-report Captures customer intentions and bin shifting*
Potentially low recall and social desirability bias
In-home inspections examining equivalent fixtures
Actual recording of baseline wattage for existing measures
Difficult to identify equivalent fixtures and high cost to conduct statistically representative on-site study. In addition, the existing in-home stock of lighting may not represent the actual delta watts that are available through retail purchases
Multipliers
Low effort and low cost; accuracy derived from empirical program data and, perhaps, better funded studies
Determining the appropriate multiplier for the program is difficult without basing it on another approach, or relying on other studies. The resulting estimate can be biased depending on the distribution of bulb type and wattages
EISA lumen equivalence
Widely available and relatively inexpensive to implement. In some cases, matches the marketed baseline wattage or matches up with EISA standards
May provide conservative estimate in cases where marketed baseline wattage exceeds rated lumen output
ENERGY STAR lumen equivalence (manufacturer-rated baseline wattage)
Widely available and relatively inexpensive to implement. Data based off wattage rating on package, which is often prominently displayed on the product. Approach is consistent with ENERGY STAR v2.0 specification
May not match the EISA lumen bins or be adjusted for EISA (that is, uses legacy bulb wattages)
*Bin shifting occurs when consumers do not replace bulbs with the same comparable wattage as the previous bulb (see Section 4.4).
The lumen equivalency bins for EISA legislation do not align with the ENERGY STAR lumen bins, further complicating the assessment of baseline wattages. This inconsistency results in EISA baselines varying from those noted on bulb packaging (see Figure 2). The recommended approach with how to deal with this inconsistency is reviewed in Section 4.4.

9
This report is available at no cost from the National Renewable Energy Laboratory at www.nrel.gov/publications.
Figure 2. Baseline wattage by lumens, EISA versus ENERGY STAR
4.2.2 Recommended Approach Consumers are more likely to purchase bulbs based on the rated baseline equivalent wattage rather than on the lumens.11 Thus, for direct-install programs, the implementation contractor should collect baseline wattage information when the measure is installed. Where baseline information cannot be collected, the Residential Lighting Evaluation Protocol recommends using an adjusted ENERGY STAR lumen equivalency rating (manufacturer-rated baseline wattage) and then adjusting these estimates for the EISA requirements. The protocol recommends this approach because the manufacturer-rated baseline wattage for an ENERGY STAR bulb must be based on ENERGY STAR lumen categories. This approach incorporates EISA requirements, which are based on lumen output.
For studies that have sufficient budget to screen for a statistical sample of recent CFL or LED purchasers, evaluators may use the self-report approach to estimate delta watts (as well as other purchase attributes including location and price). This protocol recommends, however, that the customer self-report approach apply these time limits (from the time the consumer purchased the bulb):
11 Recent studies have shown that consumers are still largely unaware of lumens. For example, a study from New York (NMR Group, Inc. 2014, NYSERDA) found that only 57% of respondents had even heard of the term lumens and, of those, more than 80% could not say how many lumens a 60-W bulb uses. A 2015 NMR study (NMR Group, Inc., 2015) from Connecticut demonstrated that only 54% of respondents had heard of lumens.

10
This report is available at no cost from the National Renewable Energy Laboratory at www.nrel.gov/publications.
• A maximum three-month window for standard spiral CFLs or standard A-lamp LEDs
• Up to six months for specialty CFLs and LEDs, as these have far lower purchase incidence but represent larger purchase decisions.
When consumers do not replace bulbs with the same comparable wattage as the previous bulbs, this is called bin shifting. For example, a consumer may replace a 60-watt bulb with a 75-watt equivalent. Consumers can bin shift to higher- or lower-than-expected wattages. The self-report sampling approach offers the advantage of capturing consumer bin shifting, although there is little evidence that consumers bin shift when purchasing efficient lamps (Navigant et al. 2012).12
EISA legislation, as originally drafted, did not apply to all bulb types, which required evaluators to establish whether a bulb is exempt from EISA requirements. Therefore, to calculate savings prior to 2020, evaluators need to classify bulbs by shape, base type, lumens, and specialty features. Commonly used pre-2020 EISA-exempt bulbs include:
• Three-way bulbs
• Globes with ≥ 5-in. diameter or ≤ 749 lumens
• Candelabra base bulbs with ≤ 1049 lumens.13,14 The baselines for exempt bulbs should match the manufacturer-rated wattage (Column C in Table 2 and Table 3).
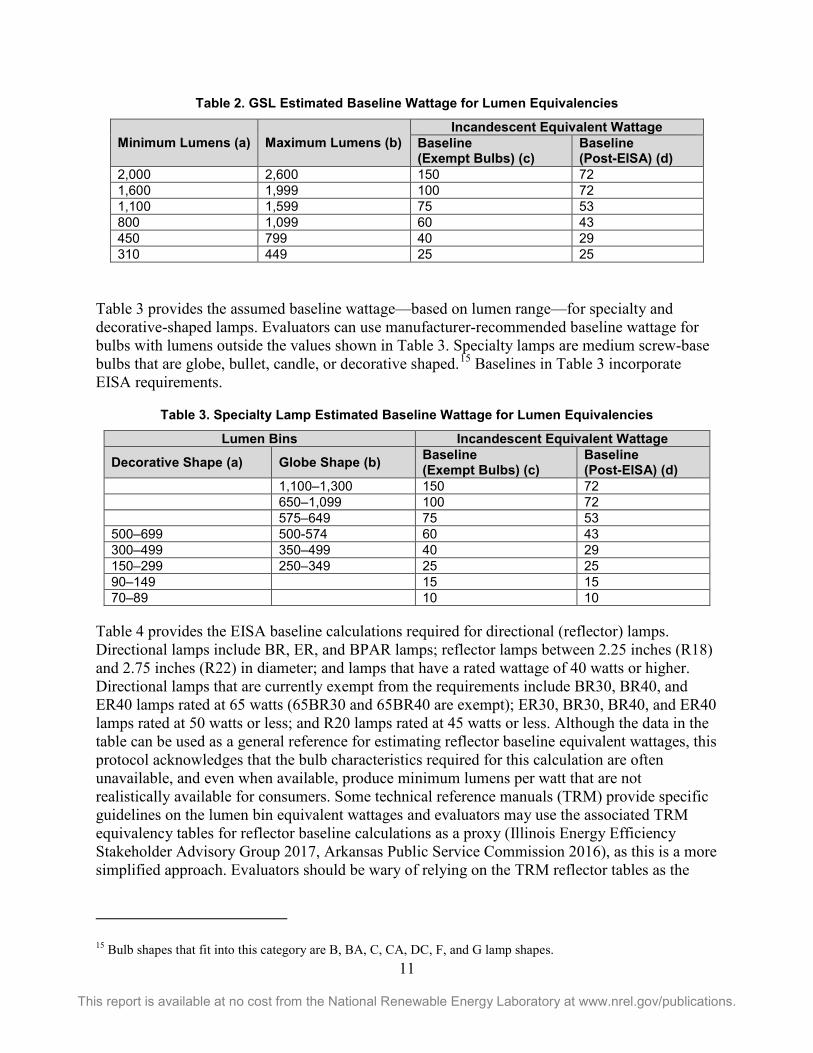
When synchronizing evaluated baselines to those noted on bulb packaging, it is important to be aware that the recommended lumen equivalencies differ for standard and specialty bulb shapes, in line with ENERGY STAR labeling requirements. Table 2 provides the assumed baseline wattage based on lumen range for GSL lamps (medium screw-base bulbs that are not globe, bullet, candle, flood, reflector, or decorative shaped). Evaluators can use the manufacturer-recommended baseline wattage for bulbs with lumens outside the lumen values shown in the table. Baselines in Table 2 apply to twist/spiral lamps and A-Lamps, and incorporate EISA phase-in periods through 2014. The baseline wattages listed in these tables reflect first-year savings, as well as savings up through 2020. The protocol recommendations for handling post-2020 savings are discussed in greater detail below.
12 Navigant et al. (2012) found that only 2.6% of purchased CFLs might have been a different equivalent wattage than the incandescent bulbs they replaced. 13 See EISA legislation for the full list of exemptions. 14 Flood and reflector lamps have separate EISA requirements that took effect in July 2012. The flood- and reflector-specific lm/W requirements should be used as the baseline for any program equivalent lamps.
11
This report is available at no cost from the National Renewable Energy Laboratory at www.nrel.gov/publications.
Table 2. GSL Estimated Baseline Wattage for Lumen Equivalencies
Minimum Lumens (a) Maximum Lumens (b) Incandescent Equivalent Wattage
Baseline (Exempt Bulbs) (c)
Baseline (Post-EISA) (d)
2,000 2,600 150 72 1,600 1,999 100 72 1,100 1,599 75 53 800 1,099 60 43 450 799 40 29 310 449 25 25
Table 3 provides the assumed baseline wattage—based on lumen range—for specialty and decorative-shaped lamps. Evaluators can use manufacturer-recommended baseline wattage for bulbs with lumens outside the values shown in Table 3. Specialty lamps are medium screw-base bulbs that are globe, bullet, candle, or decorative shaped.15 Baselines in Table 3 incorporate EISA requirements.
Table 3. Specialty Lamp Estimated Baseline Wattage for Lumen Equivalencies
Lumen Bins Incandescent Equivalent Wattage
Decorative Shape (a) Globe Shape (b) Baseline (Exempt Bulbs) (c)
Baseline (Post-EISA) (d)
1,100–1,300 150 72 650–1,099 100 72 575–649 75 53 500–699 500-574 60 43 300–499 350–499 40 29 150–299 250–349 25 25 90–149 15 15 70–89 10 10
Table 4 provides the EISA baseline calculations required for directional (reflector) lamps. Directional lamps include BR, ER, and BPAR lamps; reflector lamps between 2.25 inches (R18) and 2.75 inches (R22) in diameter; and lamps that have a rated wattage of 40 watts or higher. Directional lamps that are currently exempt from the requirements include BR30, BR40, and ER40 lamps rated at 65 watts (65BR30 and 65BR40 are exempt); ER30, BR30, BR40, and ER40 lamps rated at 50 watts or less; and R20 lamps rated at 45 watts or less. Although the data in the table can be used as a general reference for estimating reflector baseline equivalent wattages, this protocol acknowledges that the bulb characteristics required for this calculation are often unavailable, and even when available, produce minimum lumens per watt that are not realistically available for consumers. Some technical reference manuals (TRM) provide specific guidelines on the lumen bin equivalent wattages and evaluators may use the associated TRM equivalency tables for reflector baseline calculations as a proxy (Illinois Energy Efficiency Stakeholder Advisory Group 2017, Arkansas Public Service Commission 2016), as this is a more simplified approach. Evaluators should be wary of relying on the TRM reflector tables as the
15 Bulb shapes that fit into this category are B, BA, C, CA, DC, F, and G lamp shapes.

12
This report is available at no cost from the National Renewable Energy Laboratory at www.nrel.gov/publications.
most critical factor for reflector baselines are the general on-the-shelf availability of the lumen-equivalent bulbs.
Table 4. Directional (Reflector) Lamp Estimated Calculation for Baseline Wattage and Lumen Equivalencies
Lamp Wattage Lamp Type Diameter Voltage Calculation
Minimum Lumens per Watt
40W-205W Standard spectrum
> 2.5" (PAR30, PAR38, BR30, BR40, ER30, ER40)
≥125 (130V) 6.8 x (Lamp watts ^0.27) 18.4 - 28.6
<125 (120V) 5.9 x (Lamp watts ^0.27) 16.0 - 24.8
40W-205W Modified spectrum
> 2.25" & 2.5" R20 & PAR20)
≥125 (130V) 5.7 x (Lamp watts ^0.27) 15.4 - 24.0
<125 (130V) 5.0 x (Lamp watts ^0.27) 13.5 - 21.0
Evaluators should calculate baseline wattage for each lamp in the tracking database. Therefore, an evaluator should calibrate the total estimated delta watts to the actual type and number of measures sold or distributed through the program.
4.3 Calculating Lifetime Savings Post-2020 4.3.1 Changes to the EISA Post-2020 Legislation The DOE Final Rules on GSLs, issued January 18, 2017, include two primary sets of rules: one that focused solely on reflector bulbs, and one focused more generally on GSLs (U.S. Department of Energy 2016). These rulings serve to update the definition of GSLs and assess the types of bulbs exempted in the current efficiency legislation. At a high level, these rulings expand the definition of GSLs, extending the covered lumen range, base types, and shapes, as well as reduce the types of bulbs exempted. According to the rulings, these expanded bulbs will be subject to GSL efficiency standards, including the 2020 backstop, starting January 1, 2020. Specifically, the ruling includes the following:
• Reflector exemptions: Reflector bulbs will no longer be exempt. The following three reflector lamp types (which represent the vast majority of reflectors) are no longer exempt from GSL standards: lamps rated at 50 watts or less that are ER30, BR30, BR40, or ER40 lamps; lamps rated at 65 watts that are BR30, BR40, or ER40 lamps; or R20 incandescent reflector lamps rated 45 watts or less.
• Lumen maximums: The lumen maximum subject to the EISA GSL definition has been expanded to 3,300 lumens (previously 2,600).
• Base-type exemptions: All standard bulb bases will be included (small screw-base and candelabra).
• Other exemptions: Three-way, decorative (including globes <5 inch, flame shapes, and candelabra shape), T-lamps (≤40w OR ≥ 10 inch), vibration service, rough service, and shatter-resistant bulb exemptions are to be discontinued. These bulbs will be subject to GSL efficiency regulations starting January 1, 2020.

13
This report is available at no cost from the National Renewable Energy Laboratory at www.nrel.gov/publications.
These rules do not impose or amend efficacy standards for general service lamps; they are not addressing the 45 lumen/watt backstop requirement at this time, but maintain the option to do so later. The new ruling also made clear that a sell-through period may be expected, stating that: “it shall not be unlawful for a manufacturer to sell a lamp which is in compliance with the law at the time such lamp was manufactured. DOE expects it would interpret and apply the backstop with [this]… in mind” (U.S. Department of Energy 2016).
4.3.2 Calculating Post-2020 Savings Bulbs expected to be in use in 2020 and beyond will be affected by the EISA backstop provision mentioned in Section 1. The life-cycle savings of efficient lamps, therefore, needs to account for a dual baseline:
• Period 1: Savings prior to the EISA backstop provision, which are based on the assumptions outlined above
• Period 2: Savings after the backstop provision, which are currently based on the 45 lm/W efficacy standard, and include many of the previously exempt lamps.
Although there are a few ways to account for this baseline shift, the Uniform Methods Project (UMP) protocols recommend applying a “sunset” year where savings can be claimed, to be determined by the period in which consumers are unlikely to find an alternative other than LED lamps. This sunset year could exceed 2020 for a few reasons, including:
• Sell-through: Although the original EISA provision had a hard stop on sales on January 1, 2020, as noted above, the latest rulemaking implies a sell-through period will be allowed.
• Enforcement: The federal government prohibited any funds being used for the EISA 2012–2014 phase-in enforcement, and similarly it is unlikely the 2020 provision will have enforcement.
• Political uncertainty: The entire EISA 2020 backstop could be overturned depending on which parties control the executive and legislative branches of government in the future.
• Halogen burn-out period: Even if the January 1, 2020 EISA backstop remains in place with enforcement, in theory an EISA compliant halogen could still be purchased in 2019, and that halogen lamp would likely last for at least two to three years (depending on the hours of use), extending into the early 2020s. Incenting a customer to instead install an LED lamp would thus achieve savings into the early 2020s.
This approach (or a modified approach that effectively derives the same sunset-year outcome) is currently being used in a number of states, such as:
• Massachusetts: Uses a market adoption model to model decreasing savings over time. For Program Year 2016, this effectively allowed savings through 2021 for lamps subject to the 2012–2014 EISA GSL requirements, and 2022 for previously exempt lamps that are subject to the EISA requirements in 2020.
• Arkansas: Allows savings to be claimed through 2022 for all CFLs and LEDs.
14
This report is available at no cost from the National Renewable Energy Laboratory at www.nrel.gov/publications.
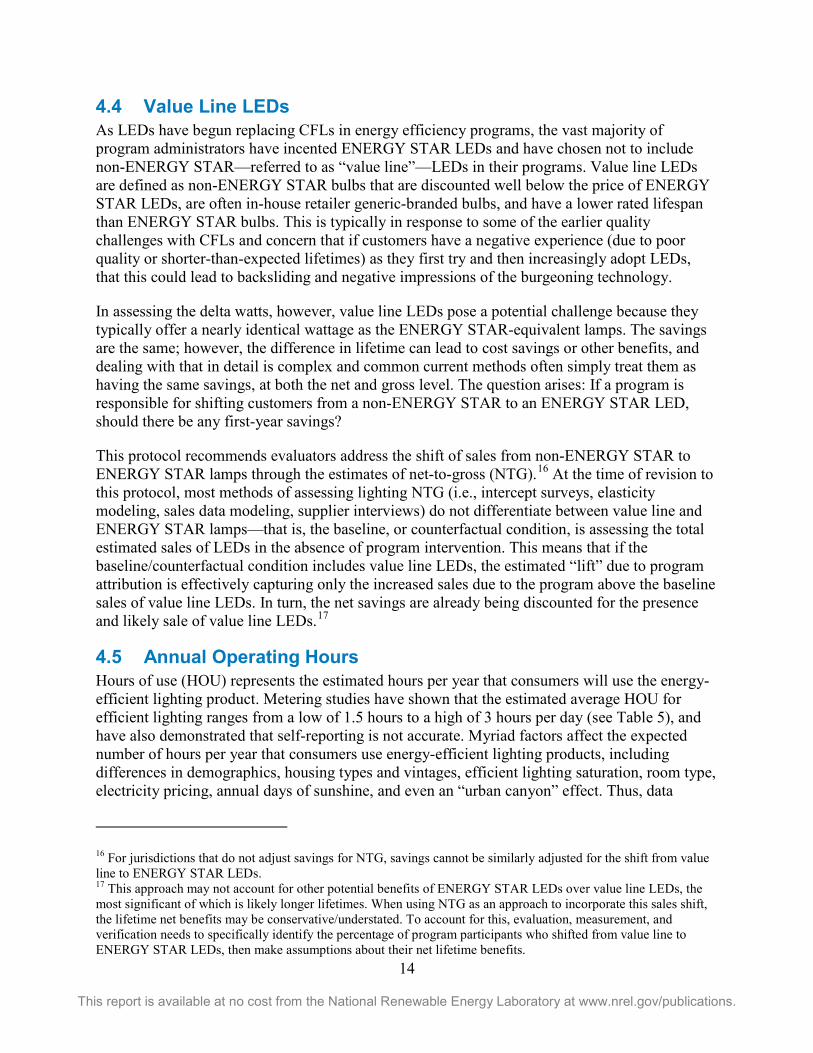
4.4 Value Line LEDs As LEDs have begun replacing CFLs in energy efficiency programs, the vast majority of program administrators have incented ENERGY STAR LEDs and have chosen not to include non-ENERGY STAR—referred to as “value line”—LEDs in their programs. Value line LEDs are defined as non-ENERGY STAR bulbs that are discounted well below the price of ENERGY STAR LEDs, are often in-house retailer generic-branded bulbs, and have a lower rated lifespan than ENERGY STAR bulbs. This is typically in response to some of the earlier quality challenges with CFLs and concern that if customers have a negative experience (due to poor quality or shorter-than-expected lifetimes) as they first try and then increasingly adopt LEDs, that this could lead to backsliding and negative impressions of the burgeoning technology.
In assessing the delta watts, however, value line LEDs pose a potential challenge because they typically offer a nearly identical wattage as the ENERGY STAR-equivalent lamps. The savings are the same; however, the difference in lifetime can lead to cost savings or other benefits, and dealing with that in detail is complex and common current methods often simply treat them as having the same savings, at both the net and gross level. The question arises: If a program is responsible for shifting customers from a non-ENERGY STAR to an ENERGY STAR LED, should there be any first-year savings?
This protocol recommends evaluators address the shift of sales from non-ENERGY STAR to ENERGY STAR lamps through the estimates of net-to-gross (NTG).16 At the time of revision to this protocol, most methods of assessing lighting NTG (i.e., intercept surveys, elasticity modeling, sales data modeling, supplier interviews) do not differentiate between value line and ENERGY STAR lamps—that is, the baseline, or counterfactual condition, is assessing the total estimated sales of LEDs in the absence of program intervention. This means that if the baseline/counterfactual condition includes value line LEDs, the estimated “lift” due to program attribution is effectively capturing only the increased sales due to the program above the baseline sales of value line LEDs. In turn, the net savings are already being discounted for the presence and likely sale of value line LEDs.17
4.5 Annual Operating Hours Hours of use (HOU) represents the estimated hours per year that consumers will use the energy-efficient lighting product. Metering studies have shown that the estimated average HOU for efficient lighting ranges from a low of 1.5 hours to a high of 3 hours per day (see Table 5), and have also demonstrated that self-reporting is not accurate. Myriad factors affect the expected number of hours per year that consumers use energy-efficient lighting products, including differences in demographics, housing types and vintages, efficient lighting saturation, room type, electricity pricing, annual days of sunshine, and even an “urban canyon” effect. Thus, data
16 For jurisdictions that do not adjust savings for NTG, savings cannot be similarly adjusted for the shift from value line to ENERGY STAR LEDs. 17 This approach may not account for other potential benefits of ENERGY STAR LEDs over value line LEDs, the most significant of which is likely longer lifetimes. When using NTG as an approach to incorporate this sales shift, the lifetime net benefits may be conservative/understated. To account for this, evaluation, measurement, and verification needs to specifically identify the percentage of program participants who shifted from value line to ENERGY STAR LEDs, then make assumptions about their net lifetime benefits.

15
This report is available at no cost from the National Renewable Energy Laboratory at www.nrel.gov/publications.
extrapolation from one region to another has not successfully accounted for these influencing factors (Navigant Consulting and Cadmus 2011).18 If extrapolation must be done (because a program was recently launched or because insufficient resources are available to conduct a metering study), evaluators may use secondary data from other metering studies (discussed in greater detail in Section 4.10). Based on these disparate results, this protocol recommends that program administrators—either on their own or through collaborations with neighboring utilities—collect primary data through a metering study of residential lighting measures.
Table 5. Estimated Efficient Lighting HOU From Recent Metering Studies
Region Author Sample
Size (Homes)
# of Efficient
Bulbs Metered
Estimated Average
Daily HOU Inclusive of LEDs
Maine NMR Group, Nexant (2015) 67 488 2.0 Yes Pennsylvania (All EDCs)
GDS, Nexant, RIA, Apex Analytics (2014) 216 518 3.0 Yes
California (PG&E, SCE, and SDG&E service areas)
KEMA, Inc. and Cadmus (2010), DNV GL (2014) ≈1,200 N/A
1.9 (2006-2008 cycle) 1.7 (2010-2012 cycle)
No
Georgia (Georgia Power Company)
Nexant and Apex Analytics LLC (2013) 125 594 2.8 No
Massachusetts, Rhode Island, Vermont, Connecticut
Nexus Market Research, Inc. et al. (2009) 157 657 2.8 No
Massachusetts, Rhode Island, Connecticut, New York
NMR Group and DNV GL (2014) 848 5,730*
2.9 (efficient bulbs) 2.7 (all bulbs)
Yes
Michigan Opinion Dynamics and Cadmus (2012) 153 710 2.26 No
Illinois Navigant Consulting (2012) 67 527 2.7 No North Carolina (Duke Energy Progress)
Navigant Consulting, Apex Analytics, LLC (2012) 100 413 2.9 No
Maryland (EmPOWER)
Cadmus and Navigant Consulting (2011) 61 222 3.0 No
North Carolina, South Carolina
TecMarket Works and Building Metrics (2011) 34 156 2.5 (NC)
2.7 (SC) No
Ohio Vermont Energy Investment Corporation (from Duke Energy)
N/A N/A 2.8 No
Pacific Northwest
Northwest Regional Technical Forum, based on California, KEMA, Inc., and Cadmus (2010)
N/A N/A 1.9 (existing homes), 1.5 (new homes)
No
*Indicates count for both efficient and inefficient bulbs metered.
18 This study revealed a significant difference in average daily HOU compared to extrapolating the HOU from the ANCOVA model (KEMA and Cadmus, 2010).

16
This report is available at no cost from the National Renewable Energy Laboratory at www.nrel.gov/publications.
Although primary data collection through a metering study of residential lighting measures is the preferred approach, these analyses are usually limited to estimating operating hours for efficient versus inefficient lighting types. With the advent of LEDs into program administrator offerings, there has been interest in attempting to estimate the annual operating hours for both CFLs and LEDs. Unfortunately, most program administrators do not have the budget and resources required to meet statistical significance by sampling for each efficient bulb type. Therefore, one approach some jurisdictions have used to estimate CFL versus LED operating hours is to develop room-based annual operating hours and use the room-based saturations (NMR Group 2016). Overall bulb-type weighted operating hours can be estimated by evaluating the operating hours by each room’s bulb-specific saturations. Until such time as administrators have the resources to meter at the specific bulb-type level, this protocol recommends using the room-based saturation approach as the best alternative.
4.6 Peak Coincidence Factor Peak coincidence factor is typically defined as the fraction of the peak demand of a population that is in operation at the time of system peak. Thus, it is the ratio of the population’s demand at the time of the system peak to its demand at the time of its own peak. For residential lighting, it represents the amount of time lights are on during the peak period, divided by the total time in the peak defined period (that is, the percentage of time that lights are on during the peak period). Note that although the methods below focus on HOU, the same principles apply to the estimate of the peak coincidence factor (including using the room-based saturations to develop bulb-specific peak coincidence factors as noted above for annual operating hours). For more information on the definition of peak demand, see the UMP Chapter 10: Peak Demand and Time-Differentiated Energy Savings Cross-Cutting Protocols.
4.7 Metered Data Collection Method The metering approach needs to specify and manage the following factors and associated guidelines:
• Logger type
• Length of metering period
• Information collected on-site
• Data integrity.
4.7.1 Logger Type This protocol recommends change-of-state loggers over periodic readings for standard bulbs as they can capture short intervals and switch rates (the number of times lights are turned on and off). For dimmable and three-way bulbs, the protocol recommends using light-intensity loggers. Current-sensing meters (rather than light-sensing meters) are an effective approach for outdoor conditions where ambient light can potentially inflate the estimated HOU.
4.7.2 Length of Metering Period The length of the metering period depends on the focus of and available resources for the study. For example:
17
This report is available at no cost from the National Renewable Energy Laboratory at www.nrel.gov/publications.
• If the intent of the study is to measure energy usage without concern for estimating summer peak demand (coincidence factor), use a limited metering period. Evaluators can limit the metering period to several weeks before and after the equinox (spring or fall). The general premise supporting annualizing metering periods shorter than one year is that the annual average use occurs precisely on the equinox; in fact, the equinox represents the annualization equation’s intercept. A 2013 study demonstrated the precision of relying on a short period surrounding the equinox relative to using a complete 12 months of metering data (Shepherd et al. 2013).
• If the metering study in question is concerned with both energy and demand, conduct logging for at least six months and capture summer, winter, and at least one shoulder season (fall or spring). Ideally, evaluators should install loggers immediately preceding either the summer or winter solstice to capture a complete six months of data. In this case, an annualization adjustment is not required. If the metering period is shorter than six months and the meter placement is not coincident with the solstice, annualize the data—using techniques such as sinusoidal modeling—to reflect a full year of usage (DNV GL 2014).19
4.7.3 Information Collected On-Site Conduct a complete inventory of lighting at all homes participating in the metering study. To allow for an estimate of saturation of high-efficiency lighting, the auditors should record the number and types of high-efficiency lighting by fixture and room type, and conduct a full inventory of sockets. Evaluators should collect on-site information specifically related to the logger placements that details room type, window orientation, fixture type, notes about possible ambient light issues, etc.
4.7.4 Data Integrity Clean and thoroughly check all metered data for errant and erroneous observations. For example, at the moments of installation and removal, clip the downloaded data to eliminate extraneous readings. Also, omit data from broken loggers or loggers removed by residents. Also omit data from loggers suspected to have metered daylight/ambient light. Finally, examine the data for “flicker” (that is, very frequent on/off cycling) and clean the raw data to correct for flicker. Evaluators can perform computer programming via R, SAS, or other statistical software that allows data from flickering bulbs to effectively remain on for the duration of the flickering event, rather than appear to be repeated on/off events.
4.7.5 Metering Sample Design Ideally, evaluators should conduct metering for large samples of all major lighting types (including incandescent or halogen baseline bulbs); however, in practice, most evaluators do not have adequate resources for a scope of this size. Consequently, to optimize the allocation of moderate evaluation resources, it is important to target the metering to select lighting measures—typically CFLs or LEDs—that represent the greatest savings in a residential lighting program. (This is especially true for retrospective program savings). Where savings are used prospectively,
19 Sinusoidal modeling assumes that HOU will vary inversely with hours of daylight over the course of a year. Sinusoid modeling shows that HOU change by season, reflective of changes in the number of daylight hours and weather, and that these patterns will be consistent year to year, in the pattern of a sine wave.

18
This report is available at no cost from the National Renewable Energy Laboratory at www.nrel.gov/publications.
it is important to attempt to meter all lighting types, as studies have found that efficient bulbs tend to be installed in higher-use fixtures first and therefore have higher HOU than average bulb types (KEMA and Cadmus, 2010, NMR Group and DNV GL 2014)).20
Given the difficulty of identifying program bulbs in an upstream program, field technicians may place loggers on energy-efficient bulbs in a random sample of homes that have installed similar measures, even if those measures are not definitely known to be part of a markdown or buy-down program. For homes that have many energy-efficient lighting products, evaluators may meter a subsample of bulbs, if they are selected randomly within the home. For example, if a home has LEDs in 10 fixtures, place meters on three to five randomly selected fixtures (DNV GL 2014).21 This placement will minimize the invasiveness in homes that are highly saturated with energy-efficient lighting products and be cost effective, enabling metering of a larger sample of bulbs in an equivalent number of homes.
Understanding that any metering study is likely constrained by resource and budget limitations, as noted above, evaluators should set expectations for the desired levels of statistical confidence and precision based on the likely number of meters deployed in the field, and assume a coefficient of variation (CV) based on recent studies of programs with similar CFL or LED saturation (using the maturity of program as a proxy, if necessary) and housing characteristics (Cadmus 2010; Navigant Consulting and Cadmus 2011). Historically, the CV has been assumed (and sometimes reported) as approximately 0.5 or 0.6. However, this CV may be considerably too low when accounting for the serial correlation of usage (and error) across light circuits within a home. For example, a recent lighting HOU study from New England, based on more than 800 homes and 5,700 loggers, recommends that evaluators use a CV of 1.2 for all rooms combined, with CVs ranging from 0.89 to as high as 1.6 by room type, as shown in Table 6 (NMR Group and DNV GL 2014).
Table 6. Example of Calculated CV from a Lighting Metering Study
Room Type CV Sample Size for 90/10 Confidence/Precision
(# of Loggers) Bathroom 1.38 515 Bedroom 1.15 358 Dining Room 1.10 327 Exterior 0.89 214 Kitchen 0.93 233 Living Space 1.04 293 Other 1.60 693 Household 1.20 390
This protocol recommends that, at a minimum, room type be considered as a within-home
20 For example, the NMR metering study from New England estimated daily HOU for all bulbs at 2.7 hours/day, but 3.0 hours/day for efficient bulbs. However, the authors do not believe this difference is due to saturation, but rather to a combination of selective installation (that is, higher use sockets and fixture use) and potentially to snapback (see Section 4.9). 21 A number of studies, including the evaluation of the 2006–2008 California Upstream Lighting Program, provide publicly available examples of how to randomly select fixtures for metering.

19
This report is available at no cost from the National Renewable Energy Laboratory at www.nrel.gov/publications.
sampling stratum as room type is one of the most important determinants of HOU. Therefore, the program administrator should work with the program evaluator to establish well-defined targets for the total number of room types to meter. Stratifying by room types (rather than by home type) allows for a potentially more homogeneous population unit because of more consistent usage within room types. It is also important to estimate the HOU by room type because direct-install programs often target higher-use fixtures and sockets in higher-use rooms. If program administrators track the room types associated with the installation of efficient lighting products, evaluators can then base HOU on room type.
When calculating the HOU from the meter data collected, the precision estimates should take into account the primary sampling unit (household) and other subsample units (room type). Most statistical packages used for HOU estimation allow for clustering of the sampling unit (household) to account for correlation.
The confidence and precision of the HOU estimate is not simply a factor of the variance across each hour for each logger. Using these units would lead to grossly overestimated precision (i.e., appears more precise) if based on every hour across the metering period. Furthermore, the evaluator’s calculations should not ignore the error inherent in the HOU from an annualization model. Rather, when estimating the overall HOU, any evaluator’s model or calculation should estimate the annualized HOU for each logger across all hours and treat this as one observation, account for the error across all loggers, and then use these estimates as the starting point for the room- and household-based averages.
Following the metering effort and the annualization of results, weight the HOU to reflect the actual distribution of lighting products by room type. For example, if 10% of the loggers are installed in kitchen fixtures, but the audit data reveal that 15% of all CFLs are installed in kitchens, weight the data from the loggers in kitchens up by 1.5 when calculating total HOU.22
It is also important to estimate the HOU by room type because direct-install programs often target higher-use fixtures and sockets in higher-use rooms. If administrators of these programs track the room types associated with the installation of efficient lighting products, evaluators can then base HOU on room type.
Evaluators should also compare the demographic and household characteristics of the metering sample with the characteristics of the total population of households believed to have purchased energy-efficient lighting products. (Evaluators can collect this information through telephone or web-based surveys.) If significant differences appear and there is a large enough sample to support reweighting based on such characteristics, evaluators should weight the results to reflect these differences.
4.8 Using Secondary Data Metering is the recommended approach; however, program administrators who are just launching a program—or who do not have sufficient resources to conduct a metering study—
22 If there are differential sampling rates within a room type, the sampling rates also need to be accounted for in the weighting.
20
This report is available at no cost from the National Renewable Energy Laboratory at www.nrel.gov/publications.
may use secondary data from other metering studies. This protocol recommends using the following criteria when selecting and using secondary data to estimate HOU:
• Similarities in service territories
• Adequate sample size for reasonable confidence/precision levels
• Length of metering period
• Adjustments to reflect hours of use by room type.
4.8.1 Similarities in Service Territories Selecting a similar service territory based on geographic proximity or latitude and as many common demographic and household characteristics as possible will increase the likelihood that the secondary data will provide a valid, reasonable, and accurate estimate.
4.8.2 Sample Size The number of observations varies considerably between studies, so evaluators should compare the sample size, standard errors, and precision levels at equivalent confidence levels across studies to ensure a selected study has reasonable confidence and precision levels.
4.8.3 Length of Metering Period The protocol recommends selecting studies that capture both winter and summer usage to estimate summer and winter peak demand, when demand is a critical factor, or may select studies that captured usage over a shorter period when energy is the only variable of interest (see Section 4.8.2 above).
4.8.4 Adjustments to Reflect Hours of Use by Room Type To extrapolate HOU from one region to another, one approach is to calibrate the HOU based on the efficient bulb saturation by room type. If possible, weight the HOU by room type from a secondary data source by the room type distribution of efficient lighting for the region under study.
4.9 Snapback/Rebound or Conservation Effect Snapback or rebound refers to changes in use patterns that occur after an energy-efficient product is installed, resulting in reducing the overall measure savings. For example, when residential lighting customers use a CFL or LED for more hours per day than they had used the replaced incandescent bulb, without a corresponding reduction in use of another less efficient lamp, this constitutes snapback. This behavior change may be because of factors such as the cost savings per unit of time from the CFL or LED or a concern that turning CFLs or LEDs on and off shortens their effective useful life (although most consumers are probably unaware of this effect). Some customers, however, might have lower HOU after installing a CFL or LED because they also want to reduce energy consumption or are dissatisfied with the quality of light.
Residential lighting programs do not typically allow metering to be conducted both before and after the installation of energy-efficient lighting. However, a recent lighting study in the Northeast found that the HOU were higher for sockets with efficient bulbs compared to all sockets in the house (NMR Group and DNV GL 2014). The difference was believed to be for

21
This report is available at no cost from the National Renewable Energy Laboratory at www.nrel.gov/publications.
these three reasons: 1) differential socket selection (households selecting higher use locations for their high-efficiency light bulbs), 2) shifting usage (households install an efficient bulb in a socket and then begin to use that socket in lieu of sockets containing inefficient bulbs), and/or 3) snapback. However, this evaluation did not collect any data to determine which of these three theories is correct or the proportion of the difference between efficient and inefficient HOU attributable to each type of behavior. Unfortunately, this protocol cannot recommend researching for snapback/rebound effects as there is currently no way to estimate other than the highly unreliable self-report approach.
4.10 In-Service Rate The ISR represents the percentage of incented residential lighting products that are ultimately installed by program participants. ISRs vary substantially based on the program delivery mechanism, but they are particularly important in giveaway or upstream programs where the customer is responsible for installation.
For the upstream programs shown in Table 7, three factors have led to first-year ISRs (LEDs installed within the first year after acquisition) below 100%:
• Often deeply discounted prices
• Inclusion of program multipacks
• Consumers commonly waiting until a bulb burns out before replacing it.
Table 7. Estimated First-Year ISRs from Recent Evaluations
of LED Upstream Lighting Programs
Region Author Percentage of LEDs
Installed the First Year After Purchase*
Massachusetts NMR Group, Inc. (2016) 84% Connecticut NMR Group, Inc. (2016) 95% Colorado Cadmus (2016) 84% Maine NMR Group, Inc., and Nexant (2016) 94% (phone) Wisconsin Apex Analytics and Cadmus (2016) 99%
*Based on program year only, not years subsequent to the program year or several years in a multiyear program cycle.
This protocol recommends that evaluators use the methods appropriate to the specific delivery mechanism to estimate ISRs:
• For direct-install programs, conduct verification (such as telephone survey or site visits) to assess installation and early removal (that is, removal prior to failure).
• For giveaway or coupon programs, conduct verification when customer contact information is available. Also, ask respondents whether the installation location was within the relevant service territory and whether the measure was installed in a home or a business. If the installation was in a business, ask about the type of business.

22
This report is available at no cost from the National Renewable Energy Laboratory at www.nrel.gov/publications.
• If customer information is not available, rely on either secondary data (such as those from a similar program where customer information was collected) or on the in-home audit approach (described in the next bullet).
• For upstream programs, calculate ISRs through in-home audits. Because program bulbs cannot be easily identified, evaluators can calculate the ISR as the number of installed bulbs purchased in a recent 12-month period divided by the total number of bulbs purchased in the same 12-month period. If the sample size of homes with bulbs purchased in a recent 12-month period is insufficient to provide the necessary levels of confidence and precision, apply a long-term ISR using all bulbs, regardless of the time of purchase.
• Although the in-home audit is the recommended approach, evaluators can use a telephone survey when program administrators are just launching a program or have insufficient resources to conduct an in-home audit. To minimize recall bias, the callers should focus questions only on products purchased in a recent 12-month period rather than the period covering the long-term ISR. (Respondents are expected to have better recall about the percentage of bulbs purchased and installed within the past 12 months compared to the percentage of bulbs they have ever purchased and installed.)
Although first-year ISRs for upstream programs are less than 100%, recent studies have demonstrated that consumers plan to install most of the incented bulbs; however, consumers often wait until an existing bulb burns out (Navigant and Itron 2010).23 As a result, for savings that occur in years following the year that the incentive was paid, program administrators have used the following approaches to account for bulbs that are subsequently installed:24
• Stagger the timing of savings claims. In this method, all the program expenses are claimed during the program year, but the savings (and therefore the accompanying avoided-cost benefits) are claimed in the years during which the program measures are estimated to be installed. This approach more accurately captures the anticipated timing and quantity for the realized savings.
• Discount future savings. In this method, all the costs and benefits are claimed during the program year, but the savings (in terms of avoided costs, kilowatt-hours, or kilowatts) from the expected future installation of stored program bulbs are discounted back to the program year using a societal or utility discount rate.25 This method offers the simplicity of claiming all benefits and costs during the program year and thus not having to track and claim future installations.
To calculate the installation rate trajectories, this protocol recommends using the findings from a Massachusetts panel study (NMR Group 2017). The Massachusetts study included 105 homes
23 For example, the evaluation in the Navigant and Itron study (2010) found that about 90% of customers were waiting until an incandescent or CFL burned out before they installed a stored CFL (Table 3 through Table 6). 24 The selection of approach depends on the study’s purpose and regulatory requirements. 25 Energy or demand savings are not normally discounted; however, this approach provides simplicity for calculating program benefit/cost ratios and the actual net present value of avoided costs, which often are used for cost recovery. For programs that want to bid into capacity markets (for example, PJM), the staggered approach is recommended because it more accurately captures the actual timing and cumulatively increasing nature of the demand savings.

23
This report is available at no cost from the National Renewable Energy Laboratory at www.nrel.gov/publications.
with 991 LEDs and looked at ISRs for up to two years (including lamps that were initially placed in storage the first year after purchase).
The Massachusetts study found that 24% of the LEDs that went into storage in year 1 were installed in year two. Although the study is expected to have a three-year ISR available in early 2018, only two years of data were available at the time this protocol was being revised. Therefore, to estimate the lifetime ISR, evaluators can assume customers continue to install LEDs in storage at a rate of 24% of stored bulbs each year.
Evaluators can follow this trajectory and calibrate to individual service territories using the example below. As outlined in Table 8, program administrators use their researched value for the Year 1 ISR and determine the percentage of stored bulbs installed in each of the next few years:
• Year 2 installation of stored bulbs is calculated by multiplying the percentage of bulbs in storage by 24% and adding that to the first-year ISR. In this example, 24% of the stored LEDs (24%*25%=6%) will be installed in Year 2, bringing the Year 2 ISR to 81%
• Year 3 installation of stored bulbs is calculated by multiplying the percent of bulbs still in storage after Year 2 by 24% (24%*19%=5%) and adding that to the second year ISR, bringing the cumulative ISR in this example up to 86%.
Table 8. Estimated Cumulative 3-Year ISR Calculations
Year Cumulative ISR*
Cumulative Storage Rate
Year 1 75% 25%
Year 2 81% 19%
Year 3 86% 14%
*This rate represents the percentage of bulbs purchased in Year 1 and installed by the end of each following year. The first year ISR of 75% is only an example, and evaluators should use researched values for the first-year ISR.
However, it is recognized that bulbs may continue to be installed for multiple years and that estimating the lifetime ISR also requires consideration of the effective useful life (EUL) of the lamp. In the example above, a 2017 program would have 25% of the program LEDs initially go into storage but then would continue to have program-incented lamps installed into the early 2020s. As noted above in the lifetime savings discussion, however, programs may be truncating the EUL of LEDs to account for the EISA backstop provision.
This protocol, therefore, recommends also truncating the ISR trajectory year at the year in which the EUL of lamps is reduced. In other words, lamps installed after that year can no longer claim savings if the baseline becomes an efficient lamp. Using the example above, assume that Year 1 is 2017 and that the cumulative ISR was extended out five years (to 2021), which would increase the cumulative ISR to 92%. If 2021 is assumed to be the “sunset year” for claiming savings on LEDs, lamps installed after 2021 would not claim any additional savings, and thus the ISR

24
This report is available at no cost from the National Renewable Energy Laboratory at www.nrel.gov/publications.
would be capped at 92%. As noted above, however, if the future installations are claimed in the year in which the bulbs are incented, the future installations should be discounted back to the program year using a societal or utility discount rate. This could have the effect of decreasing the cumulative ISR.
4.11 Interactive Effects with Heating, Ventilating, and Air Conditioning
CFLs and LED lamps emit less waste heat than incandescent bulbs, which affects heating, ventilating, and air conditioning (HVAC) energy requirements. These effects vary based on space conditioning mode, saturation of space heating and cooling technologies and their relative efficiencies, and climate zones. The influence of climate zone on interactive effects depends on a variety of house-specific factors.
Taking all of these factors into account, the net impact on lighting energy cost savings could be positive, negative, or neutral (Parekh 2008, Parekh et al. 2005). In cooling-dominated climates, the interactive effects are positive, resulting in additional savings from decreased cooling load. However, in heating-dominated climates, the interactive effects are negative, with decreased savings from increased heating load.
Because of the potential impacts of interactive effects, the Residential Lighting Evaluation Protocol recommends including these effects in evaluations of residential lighting programs.26 One common approach is to estimate these effects with simulation models, examining a mix of typical housing types (such as different vintages) and reflecting the estimated saturation, fuel shares, and size/efficiency of HVAC equipment. (That is, the percentage of homes that have air conditioning or electric versus gas heat.) If necessary, use secondary sources—such as the Residential Energy Consumption Study (U.S. Department of Energy 2015)—to estimate these inputs.
Some regions have developed interactive effects calculators based on such simulations (for example, in California, the Database for Energy Efficiency Resources and the Regional Technical Forum in the Northwest.27 Such regional collaboration can minimize the cost of determining the interactive effects for regions that do not already have such a tool.
If regional collaboration is not an option and the program administrator does not have the resources to complete the simulations, the Residential Lighting Evaluation Protocol recommends using a value from an existing resource. It recommends that the value used reflects key similarities between the program administrator’s territory and the territory from which the data are taken. At a minimum, these key similarities should be the climate (heating and cooling degree days and, ideally, the latitude), HVAC system types, HVAC fuel types, and HVAC system saturations.
26 Interactive effects are relevant for bulbs installed in conditioned spaces only. Thus, exterior lights will not have HVAC interactive effects. 27 http://www.deeresources.com/files/DEER2013codeUpdate/download/DEER2014-Lighting-IE_and_Adjustment-Factor-Tables-17Feb2014.xlsx
25
This report is available at no cost from the National Renewable Energy Laboratory at www.nrel.gov/publications.
5 Other Evaluation Issues The incentive structure of upstream lighting programs does not inherently allow for assurances that each purchaser of a program bulb is a residential customer in the sponsoring program administrator’s service territory. Therefore, some program bulbs may be purchased by nonresidential customers or by customers served by other utilities. This section discusses these parameters; Section 5.3 provides recommended approaches.
5.1 Sales to Nonresidential Customers Nonresidential customers typically use lighting products for more hours per day than residential customers. Typically, nonresidential customers also have higher peak coincidence factors. Therefore, the lighting products incentivized through a residential lighting program but installed in nonresidential sockets may lead to higher savings than those assumed through the previously discussed methods. A recent literature review of 23 cross-sector sales studies found that average cross-sector sales for upstream programs was approximately 7% (Cadmus 2015).
Evaluators estimate this parameter via several different methods, including:
• Customer intercept surveys: At the time of sale, customers who purchase lighting products participate in a short survey about intended installation location and facility type
• Surveys with store managers: Asking managers to estimate the percentage of bulbs sold to nonresidential customers
• Residential customers: Asking customers if they purchased discounted lighting products and installed them in businesses
• Owners of small businesses: Asking business owners where they typically purchase lighting products.
Key limitations in estimating this parameter are recognized in this protocol:
• Customer intercepts may not represent all program sales. Conducting customer intercept surveys can be expensive, and evaluators may conduct them only in high-volume stores (such as Home Depot, Lowe’s, and Walmart) to minimize the cost per survey. In some cases, these surveys are conducted only during high-volume promotions. Also, because some retailers refuse to allow the surveys on their premises, the surveys may not be representative of total program sales.
• Accuracy from intercepts is further challenged because business owners and contractors may be a minority of purchasers, leading to smaller respondents in the sample. This challenge may be heightened because nonresidential customers may not purchase during the same timeframes as the average residential purchaser, and they may purchase significantly larger quantities (thus, a small number of respondents may skew the results).
• Surveys lack high reliability. Store managers usually do not have detailed information about program bulb purchasers, so their estimates of sales to nonresidential customers may be unreliable. There are also challenges when surveying small business customers, such as nonresponse bias (that is, calling a small business and not getting cooperation

26
This report is available at no cost from the National Renewable Energy Laboratory at www.nrel.gov/publications.
from the business decision-maker to take a survey). Recall bias among survey participants may also make quantifying the number and type of bulbs acquired by nonresidential purchasers difficult.
5.2 Cross-Service Area Sales (Leakage) Recent studies have also attempted to estimate the number of program bulbs sold to customers outside the program administrator’s service territory. This is commonly referred to as leakage or spillage.
The most common approaches to determining leakage are clearly delineated in the Arkansas TRM (Arkansas Public Service Commission 2016),28 cited below in per order of that TRM.
• Customer intercept surveys. This is the preferred method of primary data collection for actual participants, although it can be very difficult to receive permission from participating retailers. The sampling strategy used should attempt a random mix of entities (geographic, retailer, day of week, and avoiding promotional events only).
• Geo-mapping with general population surveys. This method involves modeling leakage scores based on the geographic proximity of participating retailers to sponsoring utility customers relative to other utility customers (non-sponsoring). Evaluators can refine the model by using general population telephone surveys to confirm purchasing behavior for sponsoring and non-sponsoring utilities in the region.
• Opt-in surveys. This involves including a label or note with each incented product among all participating retailers with instructions about how to participate in survey. (Ideally, the survey should be multimodal: reply card, online, and phone number.) Low response rates and nonresponse bias are drawbacks.
Estimated leakage could vary substantially based on the service territory and program design, with recent estimates as high as 65.4% (Cadmus 2014), and as low as 2.1% (Illinois Energy Efficiency Stakeholder Advisory Group 2017) or < 1% (KEMA and DNV-GL 2014).
Key limitations in estimating leakage are recognized in this protocol:
• Cross-region sales. Many neighboring service territories are now targeted by residential lighting programs; thus, there is a lesser incentive to shop outside one’s own service territory to purchase less expensive lighting products. In some cases, program bulbs cross over in both directions across service boundaries, which may offset the effect in either or both territories.
• Many programs now limit the number of participating retailers, so leakage is minimized. Many program administrators now require retailers participating in upstream programs to be located far enough within the service territory or to be surrounded by a certain percentage of program customers to minimize potential leakage.
28 See “Protocol K: Leakage” in the Arkansas 2013 TRM.

27
This report is available at no cost from the National Renewable Energy Laboratory at www.nrel.gov/publications.
5.3 Estimating Cross-Customer Class and Cross-Service Area Sales In addition to the limitations presented above, these parameters may also at least partially offset each other. That is, the increased savings of sales to nonresidential customers may be at least partially offset by leakage.29 Given this, it is reasonable to exclude these parameter estimates from impact evaluations of upstream residential lighting programs. In addition, given the opposing directions of these parameters, either both—or none—of these parameters should be incorporated. Thus, do not claim increased savings from sales to business customers without also adjusting for leakage, and do not decrement program savings from leakage without also incorporating sales to business customers.30
29 These protocols do not imply that these effects will offset exactly, only that they work in opposite directions; sales to nonresidential customers will typically lead to greater savings, and cross-service area sales will lead to lower savings in the sponsor’s service territory. Note also that the longer HOU for commercial installations may, in fact, more than offset reduced savings from leakage. For example, if nonresidential HOU were shown to be four times the residential HOU in a given jurisdiction, a rate of 5% nonresidential installations would have an amplified effect of generating close to 20% of the overall energy savings for the program. 30 Exceptions can be made in cases where program administrators are surrounded by other service territories offering similar programs. In these cases, sales to business customers can be claimed without reducing sales from leakage. An example of this is in Pennsylvania where the Phase II Evaluation Framework recommends that evaluation contractors assume that leakages into and out of each utility territory effectively offset each other because they offer the same or similar upstream lighting programs (Pennsylvania Public Utilities Commission 2013).

28
This report is available at no cost from the National Renewable Energy Laboratory at www.nrel.gov/publications.
6 Looking Forward Residential lighting programs offer a range of measures through multiple delivery strategies; the upstream LED program is currently the most ubiquitous. Program administrators who offer a variety of measures and rely on multiple delivery strategies may need to prioritize their evaluation resources based on criteria such as contribution to savings and assessed uncertainty. Evaluators should assess savings through a mix of primary and secondary data, using International Performance Measurement and Verification Protocol Option A (Retrofit Isolation: Key Parameter Estimates).
A key area that needs additional research involves the assumptions about the EISA backstop provision. This is an evolving area, with tremendous uncertainty over the regulations. Even if the regulations were to be fully repealed, however, LEDs have gained a tremendous amount of momentum and increasing market share, while future CFL production is increasingly unlikely. These factors should be considered when estimating lifetime savings for current programs.
In addition, the lifetime ISR trajectory is based only on a single panel study that offered two years of ISRs. Additional primary data on the ISR trajectory will be helpful to test the assumptions of a fixed trajectory beyond the second year.

29
This report is available at no cost from the National Renewable Energy Laboratory at www.nrel.gov/publications.
7 References Arkansas Public Service Commission (August 31, 2016). Arkansas Technical Reference Manual Version 6.0, pp. 204-205, Tables 192, 193. Available online: http://www.apscservices.info/EEInfo/TRM6.pdf
Cadmus (January 14, 2016). Colorado Lighting Market Study. Prepared for Xcel Energy. https://www.xcelenergy.com/staticfiles/xe/PDF/Regulatory/CO-DSM/CO-Regulatory-DSM-Lighting-Market-Study.pdf
Cadmus (March 2015). Massachusetts Residential Lighting Cross-Sector Sales Research. Prepared for the Massachusetts Program Administrators and Energy Efficiency Advisory Council.
Cadmus (March 12, 2014). SWEPCO Energy-Efficiency Portfolio Evaluation Report 2013 Program Year. Prepared for SWEPCO. http://www.apscservices.info/EEInfo/EEReports/SWEPCO%202013.pdf
Cadmus and NMR Group, Inc. (June 8, 2013). Residential Lighting Shelf Survey and Pricing Analysis, Final Report. Prepared for Cape Light Compact, National Grid, NSTAR Electric, Unitil, Western Massachusetts Electric Company, and Energy Efficiency Advisory Council Consultants.
Cadmus (December 2010). Lighting and Appliance Evaluation—PY 2. Prepared for Ameren Illinois.
DNV GL (August 4, 2014). California Upstream and Residential Lighting Impact Evaluation: Work Order 28 (WO28) Final Report. Prepared for California Public Utilities Commission, Energy Division.
ENERGY STAR. “Certified Products.” Available online: https://www.energystar.gov/products/specs/lamps_specification_version_1_0_pd
ENERGY STAR Program Requirements for Lamps (Light Bulbs) (October 2016). Available online: https://www.energystar.gov/sites/default/files/ENERGY%20STAR%20Lamps%20V2_0%20Revised%20OCT-2016_1.pdf
Federal Trade Commission (May 2013). “The FTC ‘Lighting Facts’ Label: Questions and Answers for Manufacturers.” Available online: http://www.business.ftc.gov/documents/bus26-lighting-facts-questions-and-answers-manufacturers
GDS Associates Inc.; (January 13, 2014). Pennsylvania Statewide Act 129 2014 Commercial and Residential Lighting Metering Study. Prepared for the Pennsylvania Public Utilities Commission by the Statewide Evaluator Team (GDS Associates and Nexant)
30
This report is available at no cost from the National Renewable Energy Laboratory at www.nrel.gov/publications.
Illinois Energy Efficiency Stakeholder Advisory Group (February 8, 2017). IL Statewide Technical Reference Manual, Version 6.0. Page 243-245. Available online: http://www.ilsag.info/il_trm_version_6.html.
KEMA, Inc., and DNV-GL (August 4, 2014). California Upstream and Residential Lighting Impact Evaluation. Prepared for California Public Utilities Commission, Energy Division. http://www.calmac.org/publications/WO28_-_California_Upstream_and_Residential_Lighting_Impact_Evaluation_Final_Report.pdf
KEMA, Inc., and Cadmus (February 8, 2010). Final Evaluation Report: Upstream Lighting Program. Vol. 2. Prepared for California Public Utilities Commission, Energy Division. http://www.calmac.org/publications/FinalUpstreamLightingEvaluationReport_Vol2_CALMAC.pdf
KEMA, Inc. (February 25, 2005). CFL Metering Study. Prepared for California’s Investor-Owned Utilities (Pacific Gas & Electric Company [PG&E], Southern California Edison [SCE], and San Diego Gas and Electric [SDG&E]).
Lightopedia. United States Congress. Energy Independence and Security Act of 2006. H.R.6. Available online: http://www.lightopedia.com/_files/eisa/energy-independence-and-security-act-of-2007.pdf Navigant Consulting and Apex Analytics, LLC (November 7, 2013). Storage Log Study of CFL Installation Rate Trajectory. Prepared for Duke Energy Progress.
Navigant Consulting, Itron, Opinion Dynamics, and Michaels Energy (October 23, 2013). Residential ENERGY STAR Lighting PY5 Evaluation Report. Presented to Commonwealth Edison Company. http://www.ilsag.info/comed_eval_reports.html
Navigant Consulting and Apex Analytics, LLC (September 5, 2012). Preliminary Shelf-Stocking Study Results for the Residential ENERGY STAR Lighting Program. Prepared for Progress Energy Carolinas.
Navigant Consulting, Cadmus, and Apex Analytics LLC (June 27, 2012). EM&V Report for the 2010-2011 Residential ENERGY STAR Lighting Program. Prepared for Duke/Progress Energy Carolinas.
Navigant Consulting and Cadmus (January 15, 2011). EmPOWER Maryland 2010 Interim Evaluation Report. Prepared for Baltimore Gas and Electric, Potomac Electric Power Company, Delmarva Power and Light (DPL), Southern Maryland Electric Cooperative (SMECO), and Allegheny Power (AP).
Navigant Consulting and Itron (December 21, 2010). Plan Year 2 Evaluation Report: Residential ENERGY STAR Lighting. Prepared for Commonwealth Edison Company.
Nexant, Inc. and Apex Analytics LLC (October 4, 2013). Georgia Power Company Residential Lighting Saturation and Metering Study. Prepared for Georgia Power Company.
31
This report is available at no cost from the National Renewable Energy Laboratory at www.nrel.gov/publications.
Nexus Market Research, Inc.; RLW Analytics, Inc., and GDS Associates (January 20, 2009). Residential Lighting Markdown Impact Evaluation. Prepared for Markdown and Buydown Program Sponsors in Connecticut, Massachusetts, Rhode Island, and Vermont. http://www.env.state.ma.us/dpu/docs/electric/09-64/12409nstrd2ae.pdf.
NMR Group (April 7, 2017). RLPNC 16-7: 2016-17 Lighting Market Assessment Consumer Survey and On-site Saturation Study. Prepared for The Electric and Gas Program Administrators of Massachusetts. http://ma-eeac.org/wordpress/wp-content/uploads/Lighting-Market-Assessment-Consumer-Survey-and-On-Site-Saturation-Study.pdf
NMR Group (November 7, 2016). Residential Lighting Hours-of-Use Update. Memorandum to Massachusetts Electric PAs and EEAC Consultants. Available online: http://ma-eeac.org/wordpress/wp-content/uploads/Residential-Lighting-Hours-of-Use-Update.pdf
NMR Group (January 28, 2016). Connecticut LED Lighting Study Report (R154). Prepared for Connecticut Energy Efficiency Board (EEB). https://www.energizect.com/sites/default/files/R154%20-%20CT%20LED%20Lighting%20Study_Final%20Report_1.28.16.pdf
NMR Group and Nexant (April 16, 2015). Efficiency Maine Retail Lighting Program Overall Evaluation Report. Prepared for Efficiency Maine. http://www.efficiencymaine.com/docs/Efficiency-Maine-Retail-Lighting-Program-Evaluation-Report-2015.pdf
NMR Group and Apex Analytics, LLC (May 22, 2014). Market Effects, Market Assessment, Process and Impact Evaluation of the NYSERDA Statewide Residential Point-of-Sale Lighting Program: 2010-2012. Prepared for NYSERDA. https://www.nyserda.ny.gov/-/media/Files Publications/PPSER/Program-Evaluation/2014ContractorReports/2014-EMEP-pos-lighting-program.pdf
NMR Group and DNV GL (May 5, 2014). Northeast Residential Lighting Hours-of-Use Study. Prepared for Connecticut Energy Efficiency Board, Cape Light Compact, Massachusetts Energy Efficiency Advisory Council, National Grid Massachusetts, National Grid Rhode Island, New York State Energy Research and Development Authority.
Opinion Dynamics and Cadmus (August 7, 2012). Michigan CFL Hours of Use Study.
Parekh, A. (2008). “Do CFLs Save Whole-House Energy?” Home Energy Magazine, November/December 2008. pp. 20–22.
Parekh, A., Swinton, M.C., Szadkowski, F., and Manning, M. (2005). Benchmarking of Energy Savings Associated with Energy Efficient Lighting in Houses. National Research Council Canada. NRCC-50874. http://nparc.cisti-icist.nrc-cnrc.gc.ca/npsi/ctrl?action=shwart&index=an&req=20377557
Shepherd, B., Rambo, E., and Busker, M. (2013). Annualization of Results of Residential Lighting Meter Data, presented at 2013 International Energy Program Evaluation Conference, August 2013, Chicago, IL.

32
This report is available at no cost from the National Renewable Energy Laboratory at www.nrel.gov/publications.
TecMarket Works; Building Metrics (February 15, 2011). Duke Energy Residential Smart $aver CFL Program in North Carolina and South Carolina: Results of a Process and Impact Evaluation.
U.S. Department of Energy (December 29, 2016). Energy Conservation Program: Energy Conservation Standards for General Service Lamps. Definition. 10 CFR Part 430. Docket Number EERE-2013-BT-STD-0051. RIN 1904-AD09. Available online: https://energy.gov/sites/prod/files/2017/01/f34/gsl_definition_finalrule_2016-12-29_0.pdf Vermont Energy Investment Corporation (July 2011). Mid-Atlantic Technical Reference Manual, Version 2.0. Facilitated and Managed by Northeast Energy Efficiency Partnerships. http://neep.org/uploads/EMV%20Forum/EMV%20Products/A5_Mid_Atlantic_TRM_V2_FINAL.pdf
Vermont Energy Investment Corporation (August 6, 2010). State of Ohio Energy Efficiency Technical Reference Manual. Prepared for the Public Utilities Commission of Ohio. http://amppartners.org/pdf/TRM_Appendix_E_2011.pdf

33
This report is available at no cost from the National Renewable Energy Laboratory at www.nrel.gov/publications.
8 Resources American Society of Heating, Refrigerating and Air-Conditioning Engineers (ASHRAE) (2000). Research Project 1093 Compilation of Diversity Factors and Schedules for Energy and Cooling Load Calculations. ASHRAE Research Report.
ASHRAE (2002). Guideline 14-2002: Measurement of Energy and Demand Savings.
ASHRAE (2010). Performance Measurement Protocols for Commercial Buildings.
ASHRAE. (TBD). Guideline 14-2002R (Revision of Guideline 14, currently in process, publication date TBD).
Glacier Consulting (March 6, 2008). Analysis of Delta Watts Values for CFLs Rewarded Through the Residential Lighting Program During FY07. Prepared for the State of Wisconsin Public Service Commission. Available online: http://www.cee1.org/eval/db_pdf/1215.pdf.
National Renewable Energy Laboratory (March 2002). International Performance Measurement & Verification Protocol: Concepts and Options for Determining Energy and Water Savings. Volume I. Available online: http://www.nrel.gov/docs/fy02osti/31505.pdf
Pennsylvania Public Utilities Commission (May 31, 2013). Evaluation Framework for Pennsylvania Act 129 Phase II Energy Efficiency and Conservation Programs. Prepared by the Statewide Evaluation Team: GDS Associates, Nexant, Research Into Action, and Apex Analytics.
PA Consulting Group and NMR Group (April 22, 2010). Focus on Energy Evaluation 2009 CFL Savings Analysis.
RLW Analytics, Inc., Nexus Market Research (April 22, 2005). Extended Residential Logging Results. Prepared for National Grid.