Embed Size (px)
Citation preview
1 | P a g e Province – Mathematics Department – Southwest Tennessee Community College
Chapter 6
Section 6.1 -Confidence Intervals for the Mean (Large Samples)
Objectives:
• Find a point estimate and a margin of error
• Construct and interpret confidence intervals for the population mean
• Determine the minimum sample size required when estimating μ
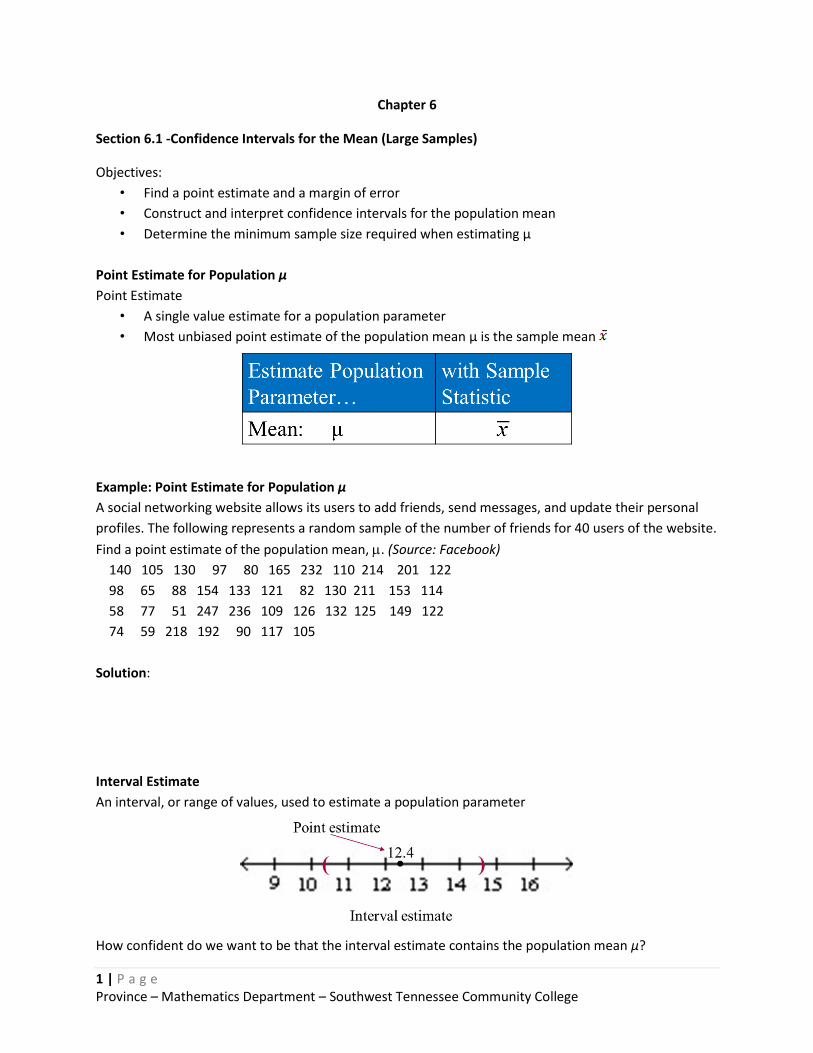
Point Estimate for Population μ
Point Estimate
• A single value estimate for a population parameter
• Most unbiased point estimate of the population mean μ is the sample mean
Example: Point Estimate for Population μ
A social networking website allows its users to add friends, send messages, and update their personal
profiles. The following represents a random sample of the number of friends for 40 users of the website.
Find a point estimate of the population mean, . (Source: Facebook)
140 105 130 97 80 165 232 110 214 201 122
98 65 88 154 133 121 82 130 211 153 114
58 77 51 247 236 109 126 132 125 149 122
74 59 218 192 90 117 105
Solution:
Interval Estimate
An interval, or range of values, used to estimate a population parameter
How confident do we want to be that the interval estimate contains the population mean μ?
2 | P a g e Province – Mathematics Department – Southwest Tennessee Community College
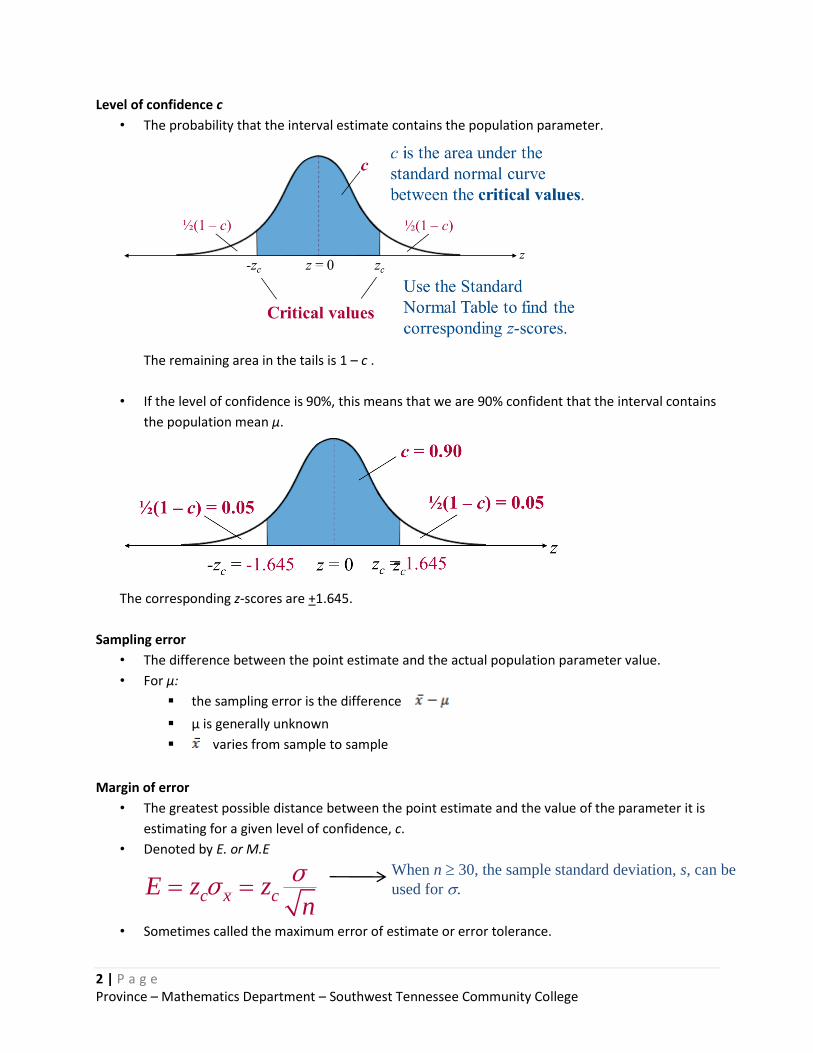
Level of confidence c
• The probability that the interval estimate contains the population parameter.
The remaining area in the tails is 1 – c .
• If the level of confidence is 90%, this means that we are 90% confident that the interval contains
the population mean μ.
The corresponding z-scores are +1.645.
Sampling error
• The difference between the point estimate and the actual population parameter value.
• For μ:
the sampling error is the difference
μ is generally unknown
varies from sample to sample
Margin of error
• The greatest possible distance between the point estimate and the value of the parameter it is
estimating for a given level of confidence, c.
• Denoted by E. or M.E
• Sometimes called the maximum error of estimate or error tolerance.
c x cE z zn
σ
σWhen n 30, the sample standard deviation, s, can be
used for .

3 | P a g e Province – Mathematics Department – Southwest Tennessee Community College
Example: Finding the Margin of Error
Use the social networking website data and a 95% confidence level to find the margin of error for the
mean number of friends for all users of the website. Assume the sample standard deviation is about
53.0.
Solution
4 | P a g e Province – Mathematics Department – Southwest Tennessee Community College
Confidence Intervals for the Population Mean
A c-confidence interval for the population mean μ. The probability that the confidence interval contains
μ is c.
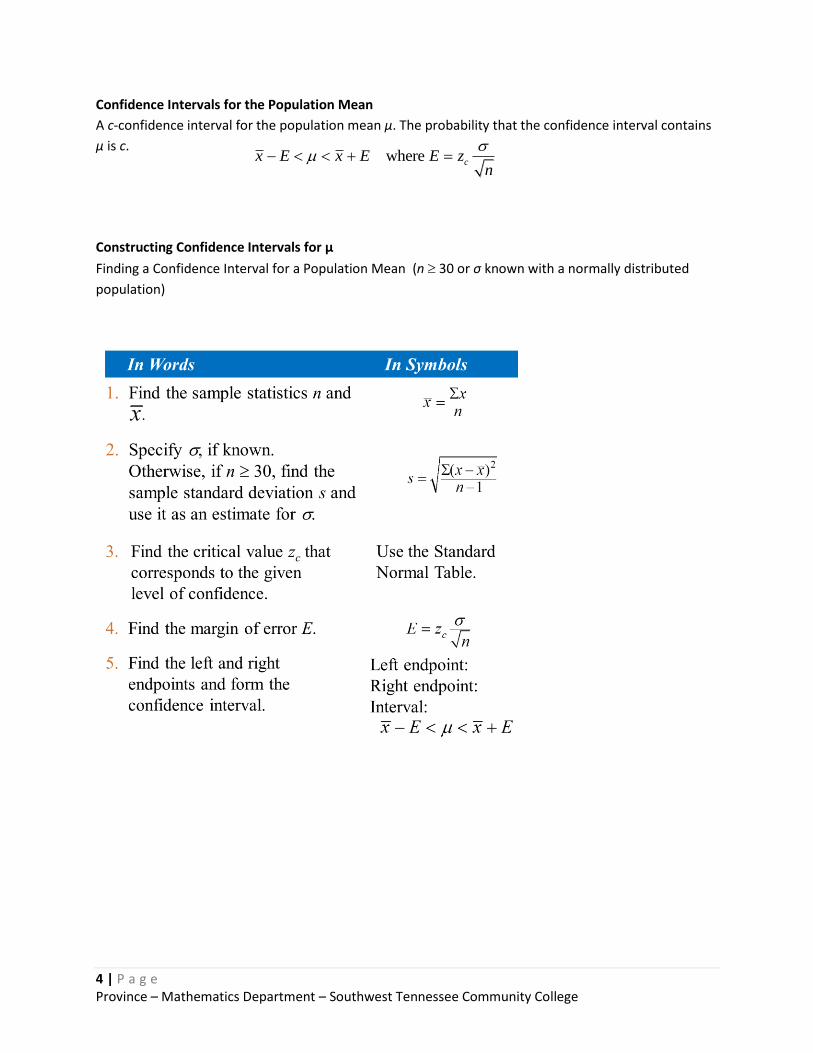
Constructing Confidence Intervals for μ
Finding a Confidence Interval for a Population Mean (n 30 or σ known with a normally distributed
population)
where cx E x E E zn
5 | P a g e Province – Mathematics Department – Southwest Tennessee Community College
Example: Constructing a Confidence Interval
A social networking website allows its users to add friends, send messages, and update their personal
profiles. The following represents a random sample of the number of friends for 40 users of the website.
140 105 130 97 80 165 232 110 214 201 122
98 65 88 154 133 121 82 130 211 153 114
58 77 51 247 236 109 126 132 125 149 122
74 59 218 192 90 117 105
Construct a 95% confidence interval for the mean number of friends for all users of the website.
Solution:

6 | P a g e Province – Mathematics Department – Southwest Tennessee Community College
Example: Constructing a Confidence Interval σ Known
A college admissions director wishes to estimate the mean age of all students currently enrolled. In a
random sample of 20 students, the mean age is found to be 22.9 years. From past studies, the standard
deviation is known to be 1.5 years, and the population is normally distributed. Construct a 90%
confidence interval of the population mean age.
Solution:
7 | P a g e Province – Mathematics Department – Southwest Tennessee Community College
Interpreting the Results
• μ is a fixed number. It is either in the confidence interval or not.
• Incorrect: “There is a 90% probability that the actual mean is in the interval (22.3, 23.5).”
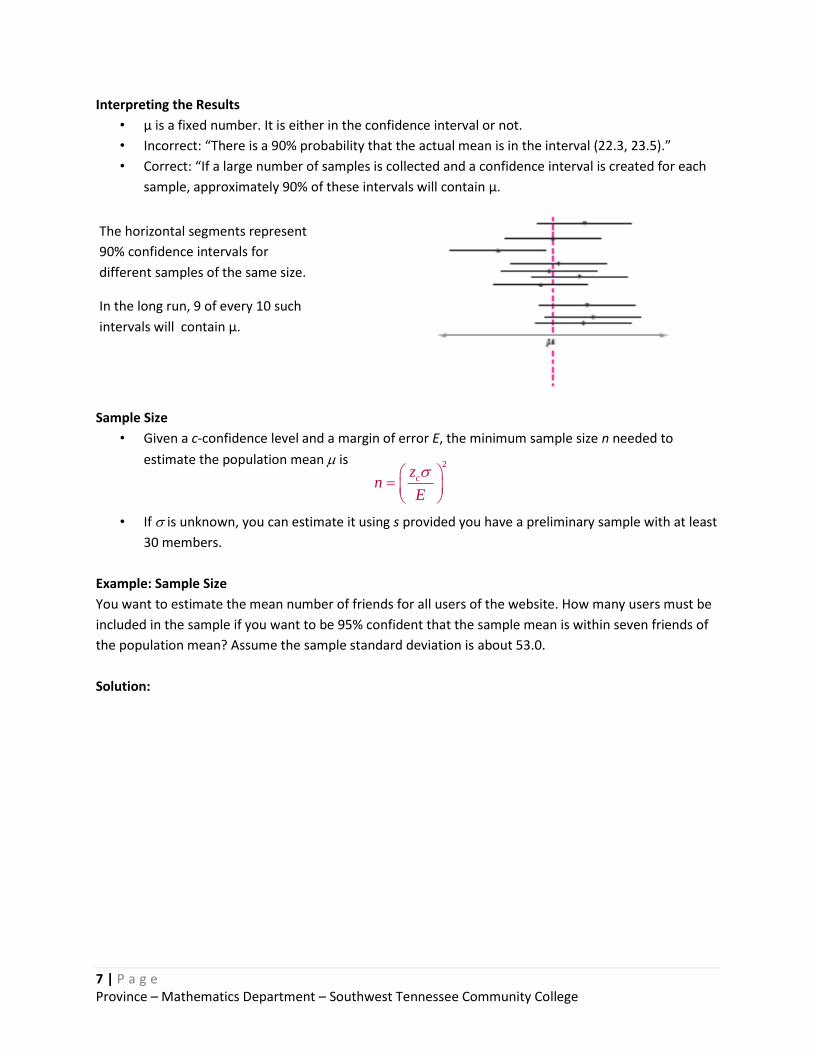
• Correct: “If a large number of samples is collected and a confidence interval is created for each
sample, approximately 90% of these intervals will contain μ.
Sample Size
• Given a c-confidence level and a margin of error E, the minimum sample size n needed to
estimate the population mean is
• If is unknown, you can estimate it using s provided you have a preliminary sample with at least
30 members.
Example: Sample Size
You want to estimate the mean number of friends for all users of the website. How many users must be
included in the sample if you want to be 95% confident that the sample mean is within seven friends of
the population mean? Assume the sample standard deviation is about 53.0.
Solution:
The horizontal segments represent
90% confidence intervals for
different samples of the same size.
In the long run, 9 of every 10 such
intervals will contain μ.
2
czn
E
8 | P a g e Province – Mathematics Department – Southwest Tennessee Community College
Section 6.2 - Confidence Intervals for the Mean (Small Samples)
Objectives:
• Interpret the t-distribution and use a t-distribution table
• Construct confidence intervals when n < 30, the population is normally distributed, and σ is
unknown
The t-Distribution
• When the population standard deviation is unknown, the sample size is less than 30, and the
random variable x is approximately normally distributed, it follows a t-distribution.
• Critical values of t are denoted by tc.
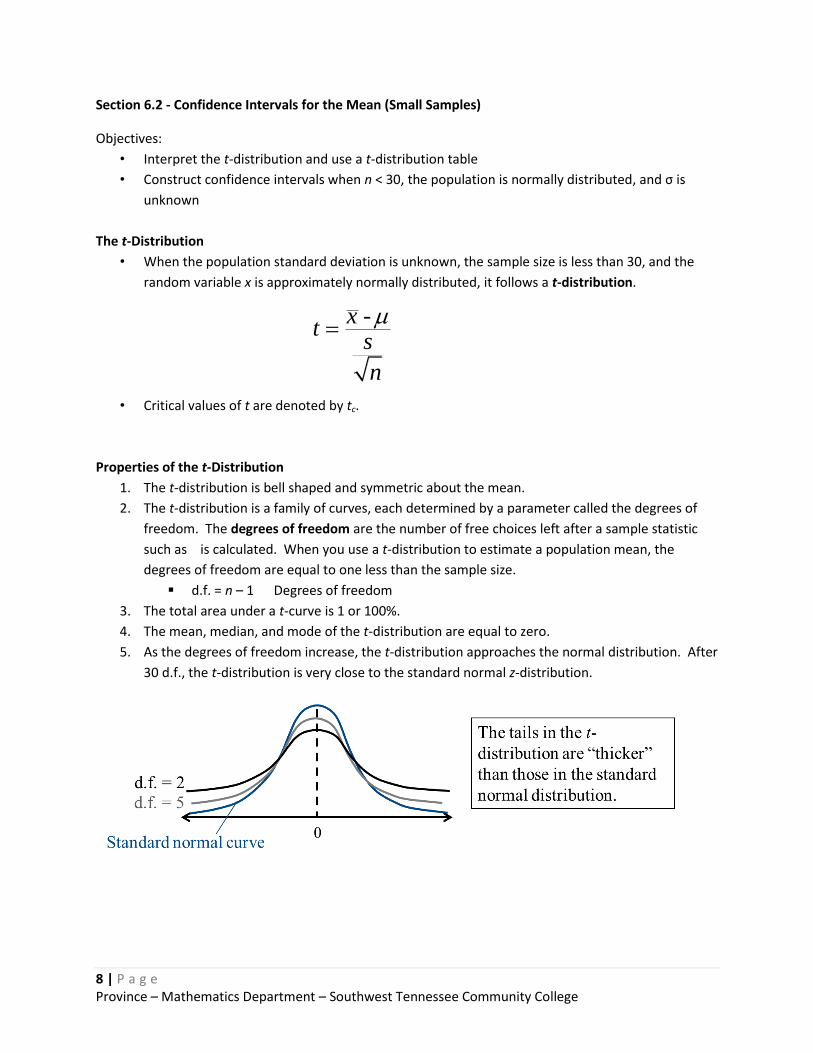
Properties of the t-Distribution
1. The t-distribution is bell shaped and symmetric about the mean.
2. The t-distribution is a family of curves, each determined by a parameter called the degrees of
freedom. The degrees of freedom are the number of free choices left after a sample statistic
such as is calculated. When you use a t-distribution to estimate a population mean, the
degrees of freedom are equal to one less than the sample size.
d.f. = n – 1 Degrees of freedom
3. The total area under a t-curve is 1 or 100%.
4. The mean, median, and mode of the t-distribution are equal to zero.
5. As the degrees of freedom increase, the t-distribution approaches the normal distribution. After
30 d.f., the t-distribution is very close to the standard normal z-distribution.
-xt
s
n
9 | P a g e Province – Mathematics Department – Southwest Tennessee Community College
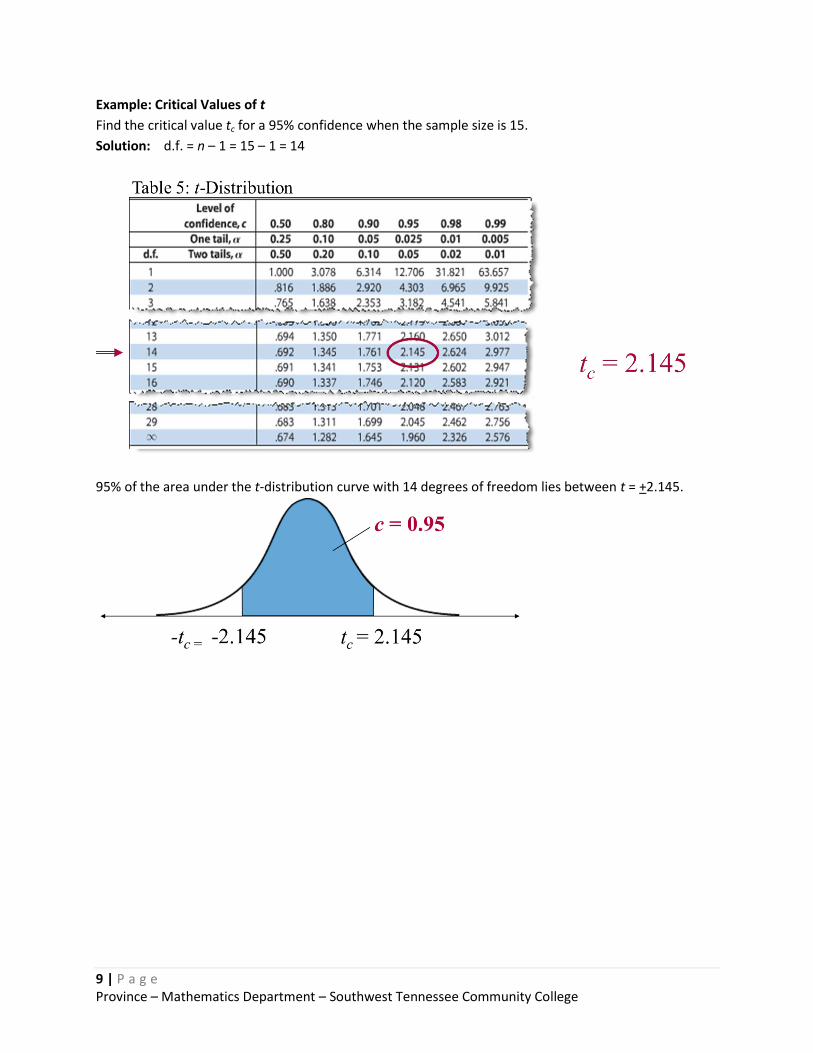
Example: Critical Values of t
Find the critical value tc for a 95% confidence when the sample size is 15.
Solution: d.f. = n – 1 = 15 – 1 = 14
95% of the area under the t-distribution curve with 14 degrees of freedom lies between t = +2.145.
10 | P a g e Province – Mathematics Department – Southwest Tennessee Community College
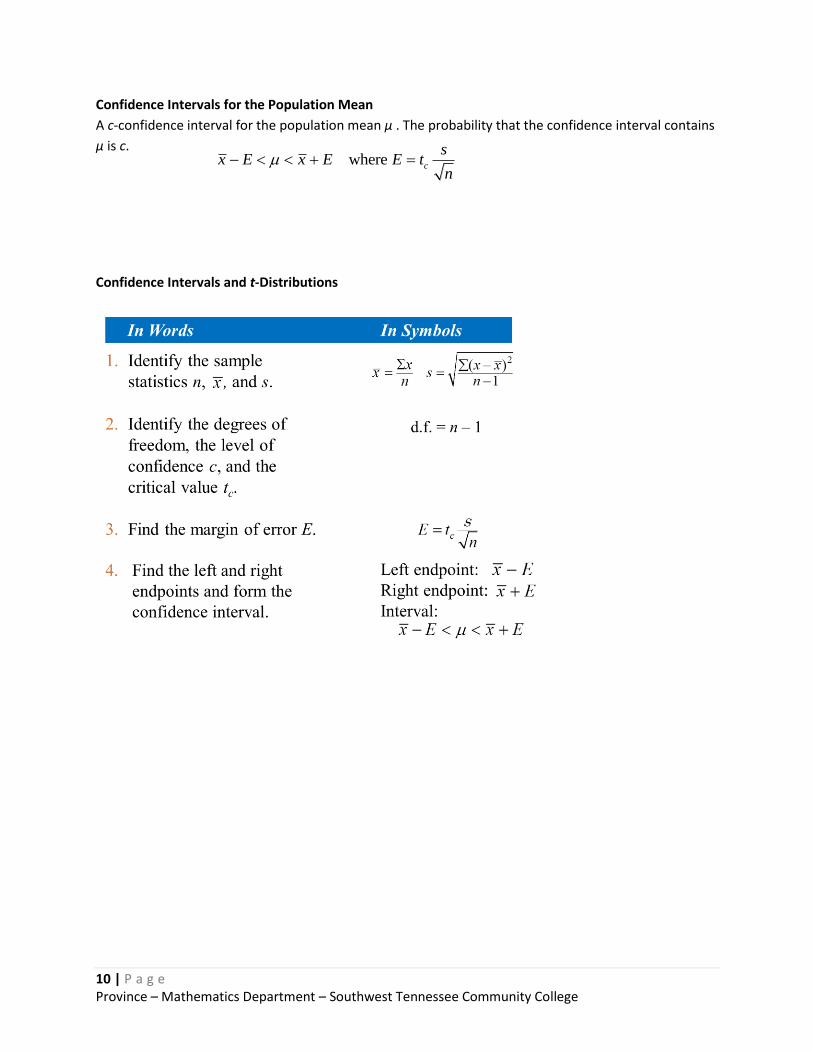
Confidence Intervals for the Population Mean
A c-confidence interval for the population mean μ . The probability that the confidence interval contains
μ is c.
Confidence Intervals and t-Distributions
where c
sx E x E E t
n

11 | P a g e Province – Mathematics Department – Southwest Tennessee Community College
Example: Constructing a Confidence Interval
You randomly select 16 coffee shops and measure the temperature of the coffee sold at each. The
sample mean temperature is 162.0ºF with a sample standard deviation of 10.0ºF. Find the 95%
confidence interval for the mean temperature. Assume the temperatures are approximately normally
distributed.
Solution:
12 | P a g e Province – Mathematics Department – Southwest Tennessee Community College
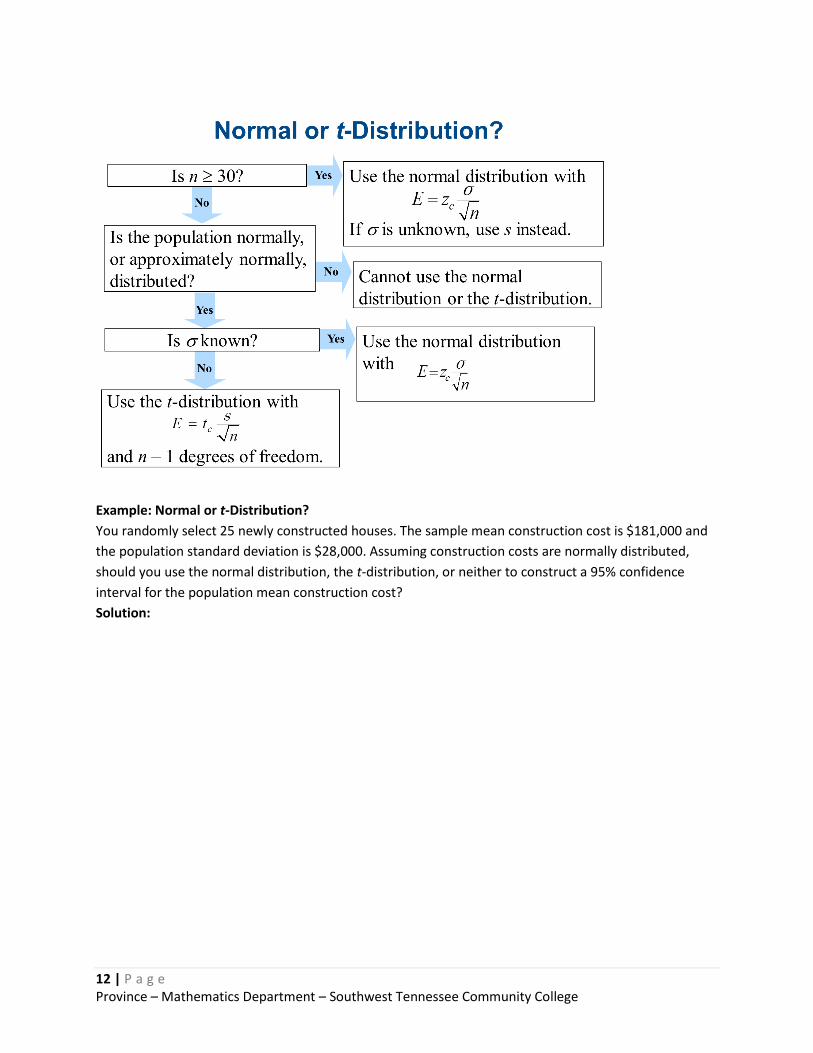
Example: Normal or t-Distribution?
You randomly select 25 newly constructed houses. The sample mean construction cost is $181,000 and
the population standard deviation is $28,000. Assuming construction costs are normally distributed,
should you use the normal distribution, the t-distribution, or neither to construct a 95% confidence
interval for the population mean construction cost?
Solution: