Embed Size (px)
Citation preview

93
South AmericaAt A Glance
Population: 351 million
Percent of World’s Population: 5.72%
Land area: 17,819,000 sq km
Percent of Earth’s Land: 12%
Key Environmental Issues:Land degradationDeforestationForest degradationHabitat conversion and destructionOver-exploitation of resources and illegal tradeDecreasing water available per capitaWater qualityDegradation of coastal and marine areas
Sites for South America
Brasilia, Brazil
Gulf of Guayaquil, Ecuador
Iquazú National Park, Argentina
Manaus, Brazil
Rondônia, Brazil
Santa Cruz, Bolivia
Santiago, Chile

rasila, Brazil’s new capital, wasinaugurated on April 21, 1960 with apopulation of 140,000 and a master
plan for only 500,000 inhabitants. The citywas a landmark in the history of town plan-ning, and was recognised as a world heritagesite in 1987. Urban planner Lucio Costa andarchitect Oscar Niemeyer intended that everyelement—from the layout of the residentialand administrative districts to the symmetryof the buildings themselves—should be inharmony with the city’s overall design. Theofficial buildings, in particular, are innovativeand imaginative. Plans were first proposed tomove the capital of Brazil to the interiorhighlands in 1789. The new location pro-motes the development of the interior andunifies the country.
The satellite images show the dramaticgrowth and transformation of Brasilia. Thedark green color in the images representsforest, agriculture appears light green, brightwhite spots represents planned areas forinfrastructure and pink shows urban growth.
Brasilia, Brazil
Growth of a Capitol
B

95
1973 (left)
The Pilot Plan of Brasilia consistssolely of the bird shaped core areaand residential areas between thearms of the Lake Paranoå. Theurban developments away from thecore are the initially unplannedsatellite cities. The population ofBrasilia and its satellite cities in1970 was about 500,000.
2000 (right)
Due to population influx, currentlymore than 2,000,000 inhabitantsnow live in Brasilia and its satellitetowns. The 2000 image shows fairamount of urban growth inplanned areas and in the satellitecities. The National Park of Brasiliaclearly stands out in 2000 asdensely vegetated dark green.Several new reservoirs have alsobeen constructed.
Photo Credits:UNESCO—Roger DominiqueUNESCO

uayaquil is Ecuador’s main Pacificport located on the northern sideof the Gulf of Guayaquil. The Gulf
of Guayaquil is the largest estuarine ecosys-tem on the Pacific coast of South America.The low topography of the coastal regioncombined with high tides allows salt water topenetrate far inland, which helps to produceshrimp. Ecuador is the world’s second largestproducer of shrimp grown in captivity.Shrimp farming in Ecuador began in theGuayaquil region over thirty years ago.Many of the shrimp farms in this area havebeen abandoned with the shrimp farmingactivity moving to other stretches of thecoast. Knowledge and awareness of theimpact of shrimp farming on traditionalagriculture, fisheries and wetlands is begin-ning to result in better regulation of shrimpfarming in Ecuador. Many of the unregu-lated and often illegal shrimp farms wereextremely destructive to the coastal ecosys-tem. Newer, ecologically sound shrimp farmsare under development in 2000. Theirdesign enables them to be less destructiveand more sustainable. The tan color in theimage shows shrimp-farming areas, wheregreen represents natural vegetation and bluerepresents water.
Gulf of Guayaquil, Ecuador
Expansion of Shrimp Culture
G

97
1985 (left)
The satellite image of 1985 showsagricultural and mangrove areas inthe Gulf of Guayaquil region. Farmerswere converting to shrimp farmingfrom agriculture at that time.
2000 (right)
The satellite image of 2000 shows thedramatic expansion of shrimp farms.Agricultural and mangrove areas havebeen converted to shrimp farms. It isestimated that in 1984 there were893.68 sq. km. of shrimp ponds, whilein 2000, with the expansion of shrimpbreeding, the area increased to1,176.31 sq. km.
Photo Credits:FAO Image—G. BizzarriNOAA/NERR

guazú National Park is located in Argen-tina on the border with Brazil andParaguay. This world heritage site covers
a total area of 555 sq. km.: the National Parkcovers 492 sq. km. and the National Reservecovers 63 sq. km. Conservation of this park iscritical because it harbours one of the mostcomplete remnant patches of the highlyendangered Paranaense forest. The park isrich in fauna and includes 68 species ofmammals, 422 of birds, 38 of reptiles and 18of amphibians, a large number of which arethreatened or vulnerable.
The Iguazú Falls, among the most impres-sive in the world, are on the Iguazú River,which serves as the border between Braziland Argentina. The Itaipu Dam is on theParaná River north of its confluence with theIguzú. This dam is presently the largest in theworld, prior to the completion of the ThreeGorges Dam. In 1995, it provided 25% and78% of the energy supply to Brazil andParaguay respectively.
The satellite images show how landclearing and logging have opened up apreviously forested landscape.
Iguazú National Park, Argentina
Vulnerable Paranaense Forest
I

99
1973 (left)
The image shows extensive forestcover throughout the image.
2000 (right)
The protected area of Iguazú Na-tional Park, located in Argentina onthe border with Brazil and Paraguay,is sharply defined as the dark greenenclave on the right of the imagesand is the only remaining originalforest in the region. A new reservoir isvisible inside the Park. On the Brazil-ian side of the Iguazú River is theIguaçú National Park, which by 2000has returned to a more vegetatedcondition. The Itaipu Reservoir isvery visible in the top-center of theimage. The three towns of Cuidad delEste in Paraguay, Foz do Iguaçú inBrazil and Puerto Iguazu in Argentinahave grown substantially since theconstruction of the dam and presentlyare reliant on tourism.
Photo Credits:UNESCO—Roger Dominiqu

anaus, the capital of the state ofAmazonia, is located on thenorth bank of the River Negro
and its confluence with the Solimões River,which extends eastward as the AmazonRiver. Manaus was settled in 1669 and was arubber boomtown between 1890 and 1920.Commercial activity in Manaus presently islargely in forest and petroleum products.The Pan American highway meets the riverhere and connects Manaus to Caracas. Nopaved roads connect Manaus to othercities. Oceangoing shippers have access tothe port of Manaus. Air and river transpor-tation connect Manaus to the outside. Thecity population grew by more than 65 percent to 1.5 million in the past decade.
These two Landsat images documentthe conversion of forest areas due tologging and urbanization between 1987and 1999.
Manaus, Brazil
Conversion of Brazilian Rainforest
M

101
1987 (left)
Manaus appears as tan/white color atthe right corner of the image. About 15kilometers from Manaus, Rio Negro(Black River) meets Rio Solimoes tocreate an amazing confluence ofbrownish white water from theSalaomes joining black water (causedby the very high acidity from tannin)from the Rio Negro. The Rio Negroflows 2,300 km from Colombia, and isthe dark current forming the northside of the river. It gets its color fromthe high tannin content in the water.The Rio Solimoes appears blue in thisimage. The black waters of the RioNegro are not completed absorbeduntil many miles after the confluence.
1999 (right)
The image shows the expansion oflogging and road construction north ofManaus between 1987 and 1999.Manaus has grown to meet the borderof the rectangular Adolpho DuckeForest Reserve (100 sq. km.). Matureforest appears as green. The white/purple color shows convertedurban areas.
Photo Credits:http://www.manaus10.hpg.ig.com.br/http://www.geosc.psu.edu/~pwilf/—Peter Wilf
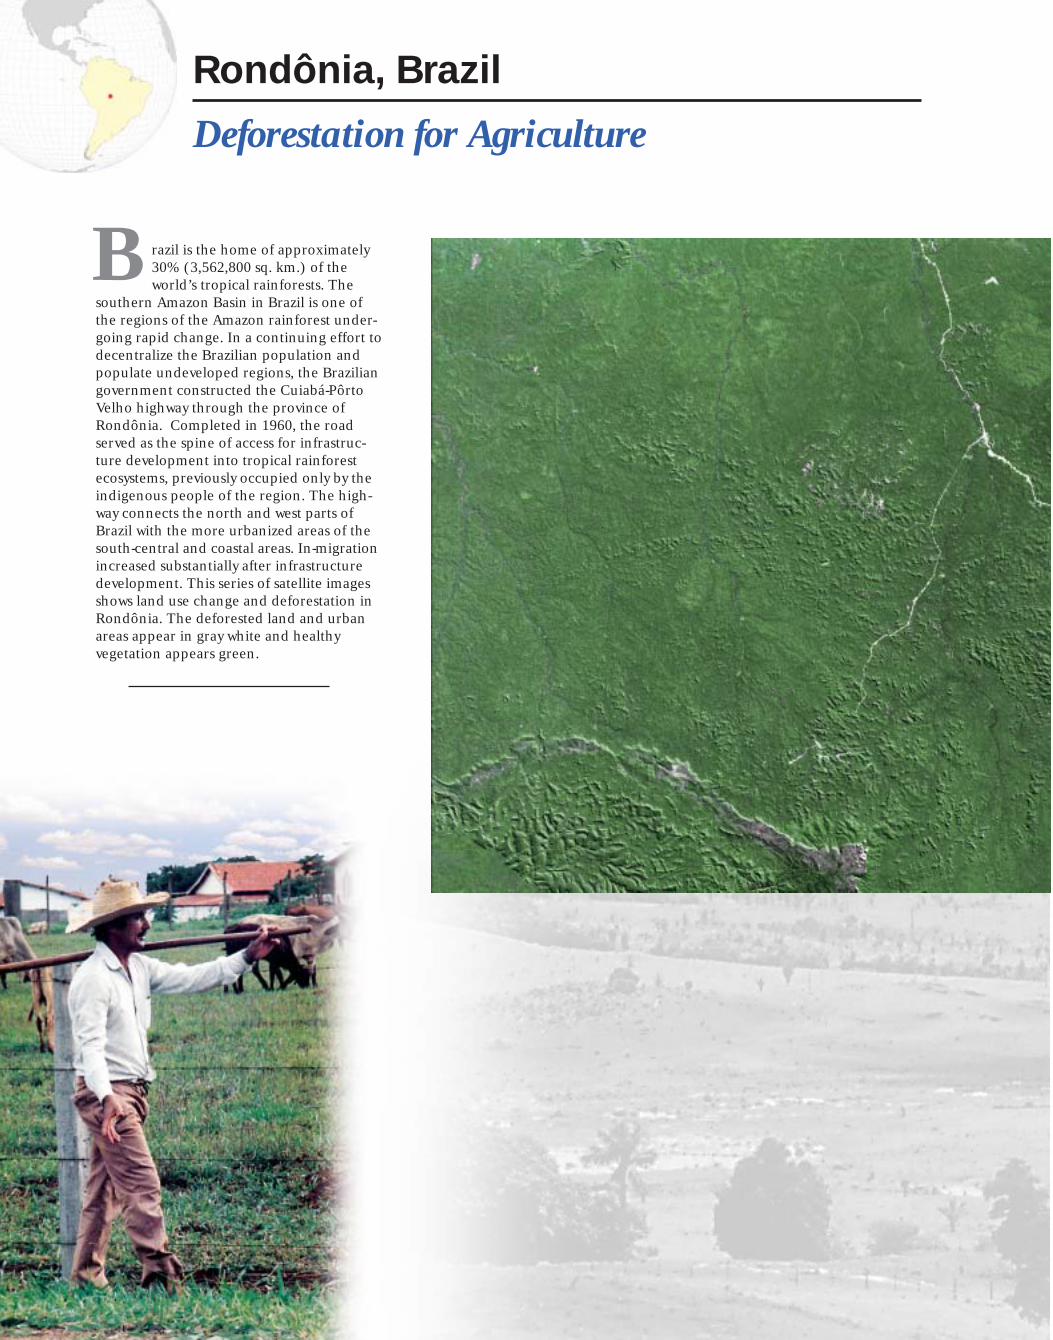
razil is the home of approximately30% (3,562,800 sq. km.) of theworld’s tropical rainforests. The
southern Amazon Basin in Brazil is one ofthe regions of the Amazon rainforest under-going rapid change. In a continuing effort todecentralize the Brazilian population andpopulate undeveloped regions, the Braziliangovernment constructed the Cuiabá-PôrtoVelho highway through the province ofRondônia. Completed in 1960, the roadserved as the spine of access for infrastruc-ture development into tropical rainforestecosystems, previously occupied only by theindigenous people of the region. The high-way connects the north and west parts ofBrazil with the more urbanized areas of thesouth-central and coastal areas. In-migrationincreased substantially after infrastructuredevelopment. This series of satellite imagesshows land use change and deforestation inRondônia. The deforested land and urbanareas appear in gray white and healthyvegetation appears green.
Rondônia, Brazil
Deforestation for Agriculture
B
103
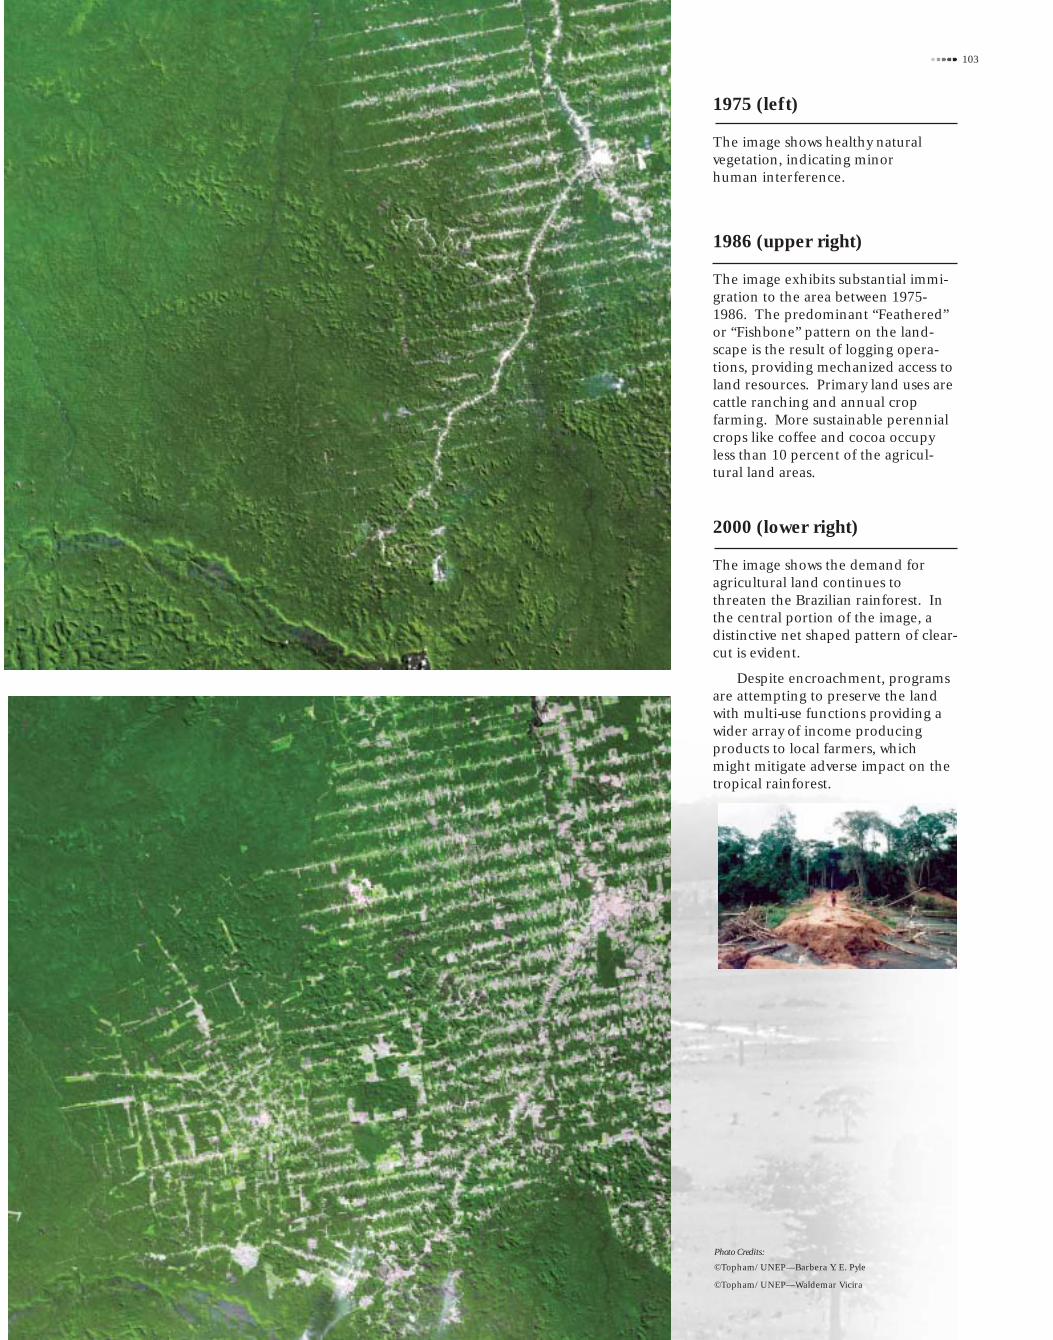
1975 (left)
The image shows healthy naturalvegetation, indicating minorhuman interference.
1986 (upper right)
The image exhibits substantial immi-gration to the area between 1975-1986. The predominant “Feathered”or “Fishbone” pattern on the land-scape is the result of logging opera-tions, providing mechanized access toland resources. Primary land uses arecattle ranching and annual cropfarming. More sustainable perennialcrops like coffee and cocoa occupyless than 10 percent of the agricul-tural land areas.
2000 (lower right)
The image shows the demand foragricultural land continues tothreaten the Brazilian rainforest. Inthe central portion of the image, adistinctive net shaped pattern of clear-cut is evident.
Despite encroachment, programsare attempting to preserve the landwith multi-use functions providing awider array of income producingproducts to local farmers, whichmight mitigate adverse impact on thetropical rainforest.
Photo Credits:
©Topham/UNEP—Barbera Y. E. Pyle
©Topham/UNEP—Waldemar Vicira
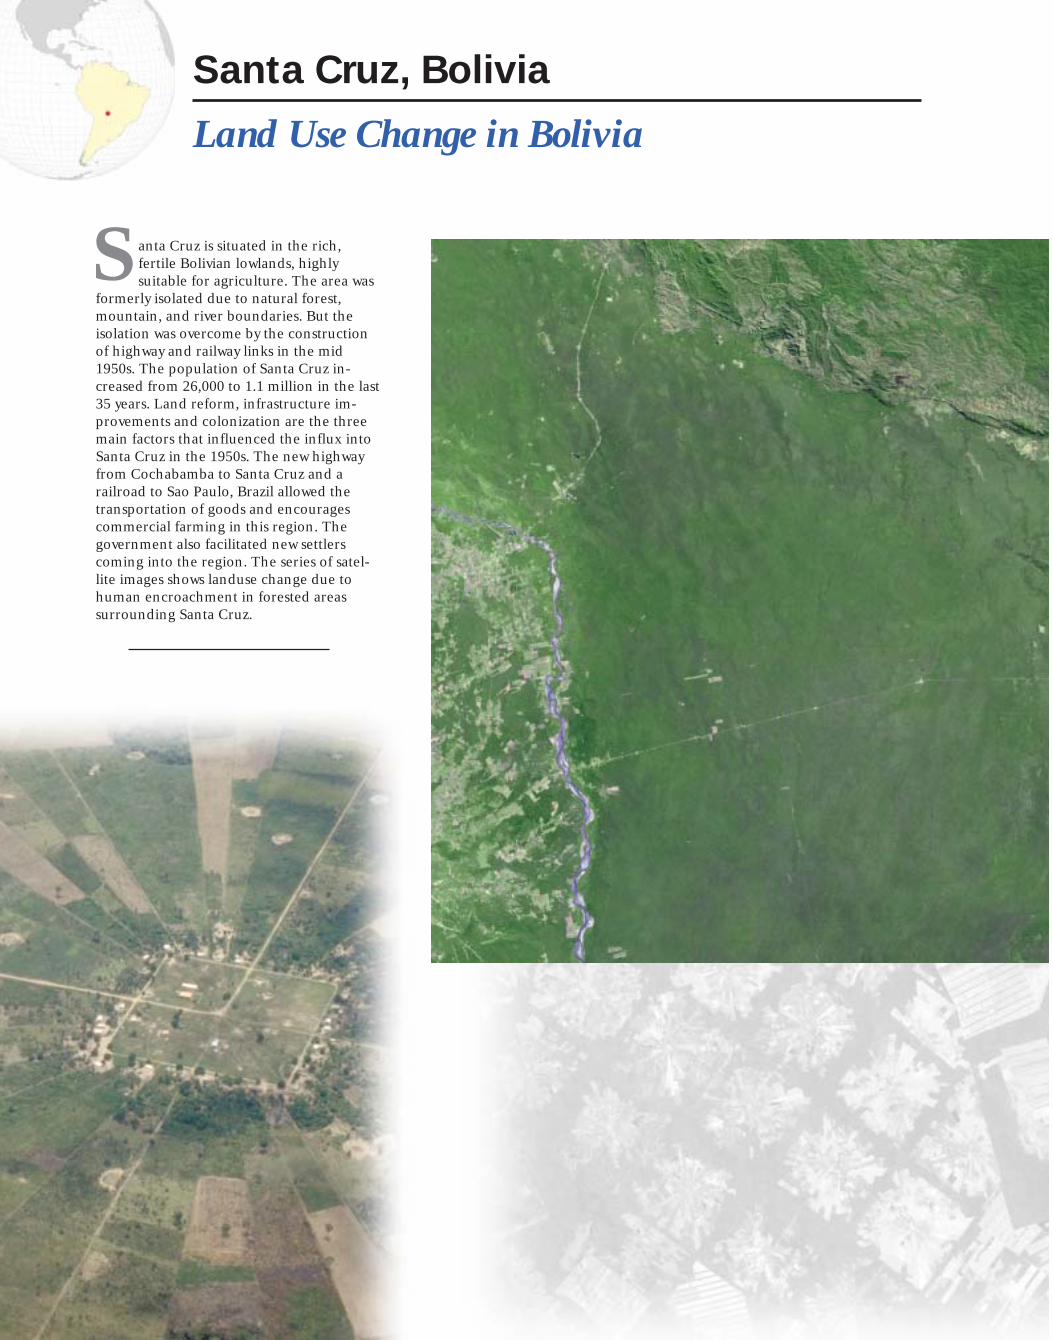
anta Cruz is situated in the rich,fertile Bolivian lowlands, highlysuitable for agriculture. The area was
formerly isolated due to natural forest,mountain, and river boundaries. But theisolation was overcome by the constructionof highway and railway links in the mid1950s. The population of Santa Cruz in-creased from 26,000 to 1.1 million in the last35 years. Land reform, infrastructure im-provements and colonization are the threemain factors that influenced the influx intoSanta Cruz in the 1950s. The new highwayfrom Cochabamba to Santa Cruz and arailroad to Sao Paulo, Brazil allowed thetransportation of goods and encouragescommercial farming in this region. Thegovernment also facilitated new settlerscoming into the region. The series of satel-lite images shows landuse change due tohuman encroachment in forested areassurrounding Santa Cruz.
Santa Cruz, Bolivia
Land Use Change in Bolivia
S
105
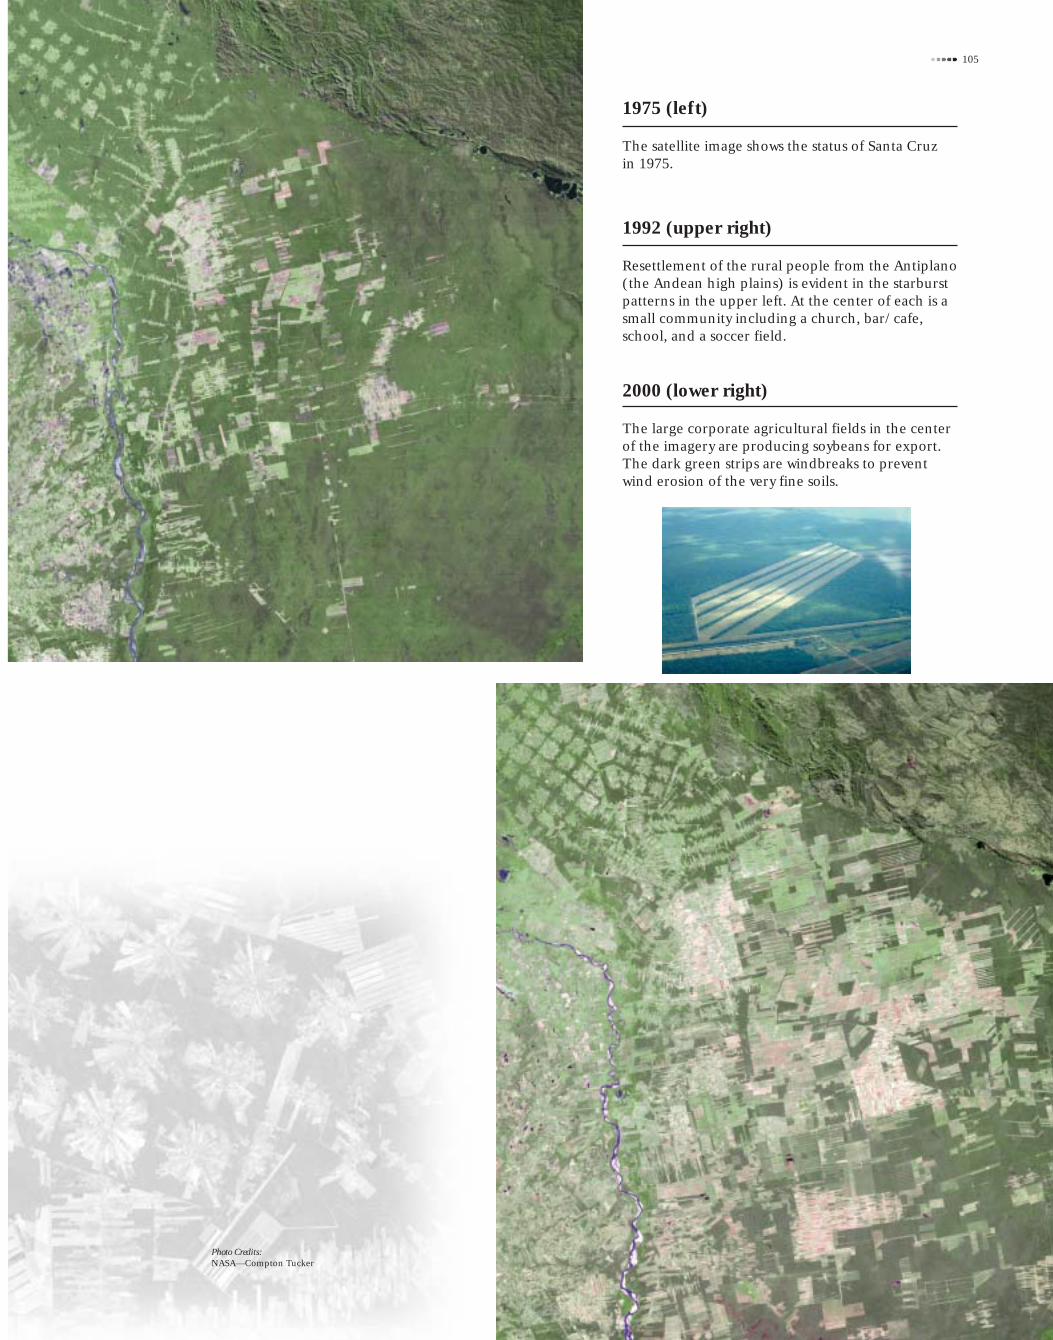
1975 (left)
The satellite image shows the status of Santa Cruzin 1975.
1992 (upper right)
Resettlement of the rural people from the Antiplano(the Andean high plains) is evident in the starburstpatterns in the upper left. At the center of each is asmall community including a church, bar/cafe,school, and a soccer field.
2000 (lower right)
The large corporate agricultural fields in the centerof the imagery are producing soybeans for export.The dark green strips are windbreaks to preventwind erosion of the very fine soils.
Photo Credits:NASA—Compton Tucker

antiago is the capital of Chile and hasmore than one third (35.2%) of thecountry’s total population of 5 mil-
lion. The exponential population growth ofSantiago is part of a national trend but alsoresults from the city’s ability to attract immi-grants. Santiago’s population growth has ledto the horizontal expansion of the city.Chilean urban scholars speak of this expan-sion as the “urban stain” which, through aprocess of sub-urbanization, continuallyexceeds and expands the limits of the Metro-politan Region of Santiago (MRS), incorpo-rating previously rural areas into the MRS.The salient characteristics of this urbansprawl are haphazard growth, low densityhousing, excessive public costs, poor trans-portation and air pollution.
Between 1970 and 2000, Santiago’spopulation increased from 2.7 million toover 5.1 million. In spite of a population thathas nearly doubled, these satellite imagesshow surprisingly little growth in geographicurban area. In the image, green showsnatural vegetation and dark pink showsurban areas in the center.
Santiago, Chile
Urban Growth in Chile
S

107
1975 (left)
The 1975 image shows the status of Santiagowith a population of 2.9 million.
2000 (right)
The 2000 image shows expansion of urbanareas in the city, now with a population of 5million. This population growth has led tothe horizontal expansion of the city princi-pally towards the south and southeast.
Photo Credits:Earthshots: Satellie Images of Enviromental Change