Embed Size (px)
Citation preview

Chapter 6
Teachers of Science
To help place students’ science achievement in the context of their school and classroom situations, the science teachers of the students tested were asked to complete questionnaires about their experience and education. This chapter presents teachers’ reports about their background characteristics, education and training in teaching science, and about how well prepared they feel to teach science. It is important to note that the data shown are the percentages of students whose teachers reported on various characteristics. That is, the student is the unit of analysis so that TIMSS can describe the classroom contexts of the students.
The teachers who completed the questionnaires were the science teachers of the students who took the TIMSS 2007 test. At the eighth grade, the general sampling procedure was to sample a mathematics class from each participating school, administer the test to those students, and ask both their mathematics and science teachers to complete the questionnaire. In countries where science is taught as separate subjects, all science subject teachers of the students in the sampled mathematics classes were asked to complete a questionnaire. At the fourth grade, students often only have one teacher for all subjects, so this teacher is their science teacher and the one who completed the questionnaire. In either grade, the information about teachers’ characteristics and instruction is tied directly to the students tested.
The exhibits have special notations when relatively large percentages of students did not have teacher questionnaire information. For a country where teacher responses were available for 70 to 84 percent of the students,

260 chapter 6: teachers of science
an “r” is included next to its data.� Where teacher responses were available for 50 to 69 percent of students, an “s” is included. Where teacher responses were available for less than 50 percent, an “x” replaces the data.
What Are the Background Characteristics of Science Teachers?
This section presents information about the background characteristics of the teachers of science, including gender, age, and years teaching experience. As shown in Exhibit 6.�, in many countries, most fourth-grade students were taught science by females (international average of 79%). This was less so at the eighth grade (international average of 59%), although the majority of students had female teachers in more than two-thirds of the countries.
Exhibit 6.� also presents teachers’ reports about their age and teaching experience. At both the fourth and eighth grades, the majority of students were taught science by teachers in their 30s and 40s. Relatively few students, �6 to 2� percent on average internationally, were taught by younger teachers. Several countries did have the majority of their students taught by younger teachers (for example, Kuwait at the fourth grade, and Ghana and Oman at the eighth grade). Although about one-fourth of the students internationally (2�–24%) were taught by teachers age 50 or older, the teaching force was older in some countries. For example, half or more of the students had teachers 50 years or older in Georgia at the fourth grade and in Italy at the eighth grade. Older teachers can have more experience and as would be expected from their ages, on average internationally, science teachers at both the fourth and eighth grades were relatively experienced, with �5 to �7 years of teaching. Increases in years of teaching experience were noted at the fourth grade in Armenia, Hungary, Latvia, and Lithuania, and at the eighth grade in Bahrain, Cyprus, Egypt, Romania, the Russian Federation, and the Basque Country in Spain. The only decreases were at the eighth grade in Singapore and the benchmarking provinces of Ontario and Quebec.
� Althoughcountriesworkedhardtomaximizeparticipationbyteachers,sometimesthiswasaffectedbyexternalfactors.Forexample,ateacherstrikeledtosomewhatreducedteacherparticipationinIsrael.

261chapter 6: teachers of science
Exhibit 6.1: Science Teachers’ Gender, Age, and Number of Years Teaching with Trends
Country
Percentage of Students by Teacher Characteristics Trends in Average Number of Years TeachingGender Age
Female Male 29 Years or Under 30–39 Years 40–49 Years 50 Years
or Older 2007 Difference from 2003
Algeria 58 (4.5) 42 (4.5) 6 (1.9) 45 (4.6) 44 (4.4) 5 (1.8) 17 (0.6) ◊ ◊Armenia 85 (3.3) 15 (3.3) 15 (3.0) 20 (3.2) 26 (3.2) 39 (4.4) s 22 (0.8) 7 (1.4) h
Australia 77 (3.7) 23 (3.7) 21 (3.8) 17 (3.0) 30 (3.9) 32 (3.3) 17 (0.9) 0 (1.2)Austria 88 (2.2) 12 (2.2) 9 (2.1) 19 (2.5) 37 (3.0) 34 (2.9) 22 (0.7) ◊ ◊Chinese Taipei 65 (4.5) 35 (4.5) 15 (3.3) 41 (4.2) 38 (4.1) 6 (2.0) 12 (0.7) –1 (1.2)Colombia 77 (3.4) 23 (3.4) 18 (4.0) 28 (5.1) 33 (4.1) 22 (4.1) 18 (1.1) ◊ ◊Czech Republic 91 (2.1) 9 (2.1) 11 (2.5) 26 (2.8) 38 (3.1) 25 (3.0) 17 (0.8) ◊ ◊Denmark 45 (4.4) 55 (4.4) 9 (2.0) 30 (4.4) 27 (4.2) 33 (4.2) 15 (1.0) ◊ ◊El Salvador 72 (4.1) 28 (4.1) 14 (2.8) 38 (3.8) 39 (3.7) 9 (2.6) 14 (0.7) ◊ ◊England 70 (3.3) 30 (3.3) 31 (3.8) 28 (3.3) 25 (3.5) 16 (2.9) r 11 (0.7) –2 (1.2)Georgia 99 (0.6) 1 (0.6) 7 (2.2) 16 (2.3) 27 (3.9) 50 (4.4) 25 (1.1) ◊ ◊Germany 86 (2.3) 14 (2.3) 9 (1.9) 25 (2.7) 22 (2.8) 44 (3.1) 19 (0.7) ◊ ◊Hong Kong SAR 71 (3.7) 29 (3.7) 38 (4.4) 33 (4.4) 18 (3.3) 11 (2.9) 11 (0.8) –2 (1.3)Hungary 95 (1.7) 5 (1.7) 5 (1.9) 20 (2.7) 45 (3.3) 30 (3.5) 23 (0.7) 3 (1.1) h
Iran, Islamic Rep. of 53 (2.7) 47 (2.7) 14 (2.4) 40 (4.1) 40 (3.9) 7 (1.6) 16 (0.6) 0 (0.9)Italy 97 (0.9) 3 (0.9) 4 (1.4) 20 (2.3) 37 (3.0) 39 (3.1) 21 (0.6) 0 (0.9)Japan 62 (3.6) 38 (3.6) 14 (2.8) 18 (3.0) 41 (3.9) 27 (3.4) 19 (0.8) –1 (1.1)Kazakhstan 94 (1.7) 6 (1.7) 11 (3.0) 34 (3.7) 34 (5.2) 22 (4.6) 18 (0.9) ◊ ◊Kuwait r 88 (2.6) 12 (2.6) r 55 (4.8) 37 (4.7) 7 (2.4) 1 (0.8) r 7 (0.5) ◊ ◊Latvia 100 (0.0) 0 (0.0) 6 (1.7) 31 (3.6) 34 (3.1) 29 (3.4) 21 (0.8) 3 (1.3) h
Lithuania 98 (0.8) 2 (0.8) 1 (0.6) 34 (3.0) 39 (3.5) 26 (3.3) 21 (0.6) 2 (0.9) h
Morocco 47 (3.8) 53 (3.8) 16 (3.0) 29 (3.5) 36 (3.9) 18 (3.0) s 17 (0.6) 2 (1.1)Netherlands 58 (4.1) 42 (4.1) 24 (3.5) 19 (3.1) 15 (3.0) 42 (3.9) 18 (1.0) 2 (1.5)New Zealand 76 (2.4) 24 (2.4) 28 (2.6) 28 (2.3) 23 (2.1) 20 (2.4) r 11 (0.6) 0 (0.9)Norway 82 (2.4) 18 (2.4) 10 (2.0) 28 (2.8) 20 (2.6) 42 (2.9) 17 (0.8) 1 (1.3)Qatar 92 (0.1) 8 (0.1) 30 (0.1) 50 (0.2) 17 (0.1) 3 (0.0) 10 (0.0) ◊ ◊Russian Federation 99 (0.9) 1 (0.9) 7 (2.3) 34 (3.3) 37 (3.6) 22 (2.4) 21 (0.5) 1 (0.9)Scotland 92 (2.2) 8 (2.2) 23 (3.7) 21 (2.8) 23 (2.8) 33 (3.4) r 15 (0.9) 0 (1.3)Singapore 72 (2.3) 28 (2.3) 42 (3.0) 35 (3.1) 16 (2.3) 7 (1.5) 9 (0.6) –1 (1.0)Slovak Republic 94 (1.5) 6 (1.5) 10 (2.1) 31 (3.4) 29 (3.4) 29 (2.9) 19 (0.7) ◊ ◊Slovenia 98 (0.7) 2 (0.7) 14 (1.9) 21 (2.4) 48 (3.0) 17 (2.5) 19 (0.6) 1 (1.0)Sweden 81 (2.8) 19 (2.8) 8 (1.8) 27 (3.1) 26 (2.7) 39 (3.1) 17 (0.8) ◊ ◊Tunisia 56 (3.9) 44 (3.9) 8 (2.0) 40 (4.2) 39 (3.6) 13 (2.7) r 19 (0.7) 1 (1.0)Ukraine 100 (0.0) 0 (0.0) 8 (1.8) 32 (3.7) 38 (3.9) 22 (2.8) 22 (0.6) ◊ ◊United States 88 (1.7) 12 (1.7) 19 (2.0) 31 (2.6) 21 (2.3) 29 (2.3) 13 (0.5) 0 (0.8)Yemen 24 (3.7) 76 (3.7) 29 (4.5) 66 (4.9) 3 (1.9) 1 (0.9) 12 (0.5) ◊ ◊International Avg. 79 (0.5) 21 (0.5) 16 (0.5) 30 (0.6) 30 (0.6) 24 (0.5) 17 (0.1)
Benchmarking ParticipantsAlberta, Canada 81 (3.0) 19 (3.0) 16 (3.1) 27 (3.9) 29 (4.2) 28 (3.5) 14 (0.8) ◊ ◊British Columbia, Canada r 82 (3.0) 18 (3.0) r 10 (2.8) 33 (4.1) 21 (3.0) 35 (3.8) r 15 (0.8) ◊ ◊Dubai, UAE s 81 (3.4) 19 (3.4) s 27 (4.2) 42 (3.9) 26 (4.7) 6 (2.9) s 9 (0.8) ◊ ◊Massachusetts, US 91 (3.1) 9 (3.1) 21 (3.7) 27 (6.0) 24 (5.5) 28 (5.9) 13 (1.0) ◊ ◊Minnesota, US 75 (6.7) 25 (6.7) 13 (3.8) 24 (5.7) 23 (7.3) 40 (7.5) 18 (1.4) ◊ ◊Ontario, Canada 83 (3.3) 17 (3.3) 14 (3.2) 34 (5.0) 29 (5.0) 23 (4.3) 13 (0.8) 0 (1.3)Quebec, Canada 88 (3.1) 12 (3.1) 14 (2.8) 30 (3.8) 33 (4.2) 23 (3.5) r 15 (0.8) –1 (1.3)
2007 significantly higher h
2007 significantly lower I
Background data provided by teachers.( ) Standard errors appear in parentheses. Because results are rounded to the nearest
whole number, some totals may appear inconsistent. A dash (–) indicates comparable data are not available.
An “r” indicates data are available for at least 70 but less than 85% of the students. An “s” indicates data are available for at least 50 but less than 70% of the students. A diamond (◊) indicates the country did not participate in the assessment.
SOU
RCE:
IEA
’s Tr
ends
in In
tern
atio
nal M
athe
mat
ics
and
Scie
nce
Stud
y (T
IMSS
) 200
7
Exhibit 6.1 Science Teachers’ Gender, Age, and Number of Years Teaching with Trends

262 chapter 6: teachers of science
Exhibit 6.1: Science Teachers’ Gender, Age, and Number of Years Teaching with Trends (Continued)
Country
Percentage of Students by Teacher Characteristics Trends in Average Number of Years TeachingGender Age
Female Male 29 Years or Under 30–39 Years 40–49 Years 50 Years
or Older 2007 Difference from 2003
Algeria 54 (3.6) 46 (3.6) 7 (1.9) 35 (3.0) 52 (3.3) 6 (1.5) r 17 (0.6) ◊ ◊Armenia 88 (2.3) 12 (2.3) 10 (1.6) 27 (2.2) 32 (2.5) 31 (2.0) r 19 (0.4) 0 (0.7)Australia 50 (3.6) 50 (3.6) 23 (2.6) 24 (3.0) 26 (2.8) 27 (2.9) r 14 (0.7) –1 (1.1)Bahrain 50 (0.9) 50 (0.9) 18 (2.3) 53 (2.5) 28 (2.6) 2 (0.9) 12 (0.4) 3 (0.7) h
Bosnia and Herzegovina 62 (2.0) 38 (2.0) 10 (1.5) 21 (1.8) 25 (1.9) 44 (2.3) 20 (0.6) ◊ ◊Botswana 42 (4.2) 58 (4.2) 42 (4.7) 53 (4.4) 4 (1.8) 1 (0.3) r 7 (0.4) 1 (0.7)Bulgaria 84 (1.7) 16 (1.7) 4 (1.5) 25 (2.6) 30 (2.5) 41 (2.5) 20 (0.6) – –Chinese Taipei 37 (3.7) 63 (3.7) 15 (3.1) 40 (4.2) 35 (4.1) 9 (2.5) 12 (0.7) –1 (1.1)Colombia 64 (4.9) 36 (4.9) 15 (3.0) 29 (4.4) 29 (4.0) 27 (5.4) 18 (1.4) ◊ ◊Cyprus r 62 (1.3) 38 (1.3) r 13 (0.6) 15 (0.9) 47 (0.9) 25 (0.8) r 10 (0.2) 1 (0.4) h
Czech Republic 70 (2.3) 30 (2.3) 15 (1.9) 20 (1.9) 25 (1.7) 40 (2.3) 19 (0.7) ◊ ◊Egypt 41 (4.2) 59 (4.2) 20 (3.5) 39 (3.9) 38 (4.0) 2 (1.3) 14 (0.7) 2 (0.8) h
El Salvador 49 (4.4) 51 (4.4) 14 (2.9) 51 (4.1) 29 (3.5) 6 (1.6) 13 (0.5) ◊ ◊England 55 (2.9) 45 (2.9) 26 (3.0) 28 (2.5) 21 (2.1) 26 (2.7) s 12 (0.6) 0 (1.3)Georgia 92 (1.2) 8 (1.2) 5 (1.2) 23 (2.3) 33 (2.3) 40 (3.1) 21 (0.7) ◊ ◊Ghana 8 (2.1) 92 (2.1) 52 (3.9) 32 (4.1) 8 (2.1) 8 (2.3) 7 (0.6) –1 (0.9)Hong Kong SAR 37 (4.7) 63 (4.7) 23 (4.0) 39 (4.5) 27 (4.3) 12 (3.2) 14 (0.9) 2 (1.2)Hungary 76 (2.0) 24 (2.0) 7 (1.3) 17 (1.7) 39 (2.2) 37 (2.3) 22 (0.5) 1 (0.7)Indonesia 56 (3.8) 44 (3.8) 20 (2.3) 44 (3.2) 31 (3.0) 5 (1.2) 12 (0.6) 0 (0.8)Iran, Islamic Rep. of 42 (2.1) 58 (2.1) 14 (2.5) 53 (3.4) 24 (3.0) 9 (1.9) 15 (0.5) 0 (0.8)Israel 78 (3.1) 22 (3.1) 16 (3.1) 29 (3.2) 34 (3.5) 21 (2.9) r 16 (0.8) 0 (1.1)Italy 81 (2.8) 19 (2.8) 2 (1.1) 10 (1.9) 22 (2.3) 67 (2.9) 23 (0.7) 0 (0.9)Japan 16 (3.0) 84 (3.0) 19 (3.1) 25 (3.6) 32 (4.0) 25 (3.7) 17 (0.9) –1 (1.2)Jordan 53 (2.1) 47 (2.1) 44 (4.4) 36 (4.0) 14 (2.9) 6 (1.9) 9 (0.6) –2 (1.0)Korea, Rep. of 63 (3.4) 37 (3.4) 21 (3.1) 26 (3.3) 41 (3.3) 12 (2.8) r 13 (0.7) 1 (0.9)Kuwait r 50 (3.0) 50 (3.0) r 23 (3.7) 42 (4.3) 27 (3.2) 9 (2.4) s 13 (0.8) ◊ ◊Lebanon 64 (3.6) 36 (3.6) 42 (4.1) 33 (3.6) 17 (2.3) 9 (2.2) 11 (0.6) 1 (0.8)Lithuania 81 (1.7) 19 (1.7) 7 (1.3) 17 (1.6) 40 (2.1) 36 (2.1) 22 (0.6) 2 (0.9)Malaysia 75 (3.3) 25 (3.3) 23 (3.5) 49 (4.4) 23 (3.5) 6 (2.0) 11 (0.6) 0 (0.9)Malta 57 (0.3) 43 (0.3) 47 (0.3) 30 (0.2) 14 (0.2) 8 (0.2) 10 (0.1) ◊ ◊Norway 39 (3.2) 61 (3.2) 10 (2.5) 40 (3.6) 14 (2.3) 35 (3.1) 15 (0.8) 0 (1.3)Oman 51 (2.4) 49 (2.4) 76 (3.5) 18 (3.2) 5 (1.6) 1 (0.8) 6 (0.5) ◊ ◊Palestinian Nat’l Auth. 53 (2.5) 47 (2.5) 36 (3.9) 26 (3.4) 27 (3.9) 11 (2.6) 11 (0.8) 1 (1.1)Qatar 49 (0.2) 51 (0.2) 22 (0.1) 51 (0.2) 18 (0.1) 9 (0.1) 11 (0.0) ◊ ◊Romania 72 (2.2) 28 (2.2) 13 (1.5) 22 (1.9) 23 (1.9) 42 (2.6) 21 (0.6) 2 (0.9) h
Russian Federation 92 (1.1) 8 (1.1) 10 (1.3) 21 (1.4) 32 (2.0) 36 (1.9) 22 (0.4) 2 (0.7) h
Saudi Arabia 49 (2.0) 51 (2.0) 24 (3.3) 63 (3.8) 13 (3.0) 1 (0.7) 10 (0.4) – –Scotland r 51 (2.3) 49 (2.3) r 20 (2.0) 15 (1.7) 26 (2.5) 38 (2.1) s 17 (0.6) –1 (0.9)Serbia 74 (1.9) 26 (1.9) 4 (0.7) 26 (1.9) 26 (1.6) 44 (2.2) 18 (0.6) –1 (0.7)Singapore 64 (2.4) 36 (2.4) 44 (2.5) 29 (2.3) 13 (1.5) 14 (1.6) 10 (0.5) –2 (0.8) i
Slovenia 82 (1.7) 18 (1.7) 9 (1.6) 24 (2.0) 43 (2.4) 24 (2.4) 19 (0.5) 1 (0.8)Sweden 52 (3.0) 48 (3.0) 12 (2.0) 33 (3.0) 21 (2.1) 34 (2.7) 14 (0.7) 1 (1.0)Syrian Arab Republic 68 (3.0) 32 (3.0) 35 (3.2) 26 (2.7) 33 (3.2) 6 (1.5) 11 (0.7) ◊ ◊Thailand 68 (3.9) 32 (3.9) 23 (3.6) 29 (3.6) 27 (3.8) 21 (3.5) 14 (0.7) ◊ ◊Tunisia 65 (3.9) 35 (3.9) 17 (3.2) 48 (3.7) 25 (3.1) 10 (2.6) r 11 (0.7) 0 (1.0)Turkey 49 (4.4) 51 (4.4) 33 (3.6) 36 (4.0) 17 (3.4) 14 (3.2) 12 (0.8) ◊ ◊Ukraine 86 (1.7) 14 (1.7) 12 (1.7) 26 (2.2) 29 (1.9) 33 (2.1) 21 (0.5) ◊ ◊United States 58 (3.0) 42 (3.0) 15 (2.4) 30 (2.7) 25 (2.4) 30 (3.0) 13 (0.6) –1 (0.9)
¶ Morocco 39 (4.3) 61 (4.3) 9 (2.3) 25 (3.2) 39 (3.3) 28 (3.1) r 17 (1.1) – –International Avg. 59 (0.4) 41 (0.4) 21 (0.4) 32 (0.4) 27 (0.4) 21 (0.3) 15 (0.1)
Benchmarking ParticipantsBasque Country, Spain 56 (4.8) 44 (4.8) 5 (2.3) 20 (3.4) 47 (4.6) 28 (4.1) 20 (1.0) 3 (1.4) h
British Columbia, Canada 46 (4.2) 54 (4.2) 15 (2.6) 41 (3.5) 24 (3.7) 20 (3.1) r 13 (0.7) ◊ ◊Dubai, UAE s 62 (4.1) 38 (4.1) s 15 (2.9) 49 (4.6) 23 (5.5) 13 (4.3) s 14 (0.6) ◊ ◊Massachusetts, US 57 (5.1) 43 (5.1) 25 (5.9) 22 (6.1) 29 (6.1) 24 (6.5) 10 (1.1) ◊ ◊Minnesota, US 42 (6.0) 58 (6.0) 30 (6.1) 16 (4.7) 26 (7.1) 28 (6.1) 13 (1.1) ◊ ◊Ontario, Canada 55 (4.1) 45 (4.1) 24 (4.3) 45 (4.4) 20 (3.9) 12 (2.8) 9 (0.7) –3 (1.1) i
Quebec, Canada 52 (4.2) 48 (4.2) 35 (4.8) 34 (5.0) 23 (4.4) 8 (2.7) r 9 (0.8) –3 (1.1) i
2007 significantly higher h
2007 significantly lower IBackground data provided by teachers.¶ Did not satisfy guidelines for sample participation rates (see Appendix A). ( ) Standard errors appear in parentheses. Because results are rounded to the nearest
whole number, some totals may appear inconsistent. A dash (–) indicates comparable data are not available.
An “r” indicates data are available for at least 70 but less than 85% of the students. An “s” indicates data are available for at least 50 but less than 70% of the students. A diamond (◊) indicates the country did not participate in the assessment.
SOU
RCE:
IEA
’s Tr
ends
in In
tern
atio
nal M
athe
mat
ics
and
Scie
nce
Stud
y (T
IMSS
) 200
7
Exhibit 6.1 Science Teachers’ Gender, Age, and Number of Years Teaching with Trends (Continued)

263chapter 6: teachers of science
What Education and Training Do Teachers Have for Teaching Science?
Exhibit 6.2 presents teachers’ highest level of education. On average internationally, 70 percent of the fourth grade students and 8� percent of the eighth grade students had teachers who had completed a university degree. However, at the fourth grade, there was some variation across countries, with the majority of students in Algeria, Italy, Morocco, and Tunisia having teachers that had completed only secondary school.
Exhibit 6.3 contains information about teachers’ educational emphasis in science and teaching. Most countries have a national or regional science curriculum, and most countries reported that teachers received specific preparation in how to teach the science curriculum as part of pre-service education. However, in a number of countries the teachers of the fourth grade students reported little specific training or specialized education in science. Countries where 80 percent or more of the fourth grade students had teachers who studied primary/elementary education without a major or specialization in mathematics or science included Australia, Austria, Hungary, Lithuania, and the Slovak Republic as well as the benchmarking province of Quebec. In contrast, 83 percent of the fourth grade students in Kazakhstan had teachers with primary/elementary education and a major or specialization in science. In Armenia, almost all teachers had a science major or specialization (90%), but few had studied primary/elementary education. At the eighth grade, on average internationally, 8� percent of students had teachers who had studied science (biology, physics, chemistry, or earth science), but only 39 percent had teachers whose major area of study was in science education.
To provide more information about the branches of science that science teachers studied during their postsecondary education, Exhibit 6.4 presents the percentage of eighth-grade students whose teachers reported majoring in biology, physics, chemistry, or earth science. Teachers could major in more than one of these subjects, and the percentages in the exhibit reflect this. On average, biology was the most frequently reported major (42%), followed by chemistry (40%), physics (32%), and earth science (�9%).

264 chapter 6: teachers of science
Exhibit 6.2: Highest Educational Level of Science Teachers*
Country
Percentage of Students by Their Teachers’ Educational Level
Completed Postgraduate
University Degree**
Completed University but Not
a Postgraduate Degree
Completed Post-secondary
Education but Not University
Completed Upper-secondary
School
Did Not Complete Upper-secondary
School
Algeria 0 (0.5) 19 (3.3) 5 (2.1) 69 (3.8) 7 (1.9)Armenia 0 (0.0) 98 (1.2) 2 (1.2) 0 (0.0) 0 (0.0)Australia 41 (4.3) 52 (4.6) 8 (1.5) 0 (0.0) 0 (0.0)Austria 3 (1.0) 1 (0.5) 93 (1.8) 3 (1.1) 0 (0.0)Chinese Taipei 23 (3.4) 65 (4.3) 3 (1.2) 9 (2.7) 0 (0.0)Colombia 9 (2.5) 70 (5.0) 11 (3.7) 9 (2.8) 1 (0.0)Czech Republic 80 (3.1) 3 (1.4) 6 (2.1) 10 (2.4) 0 (0.0)Denmark 3 (1.4) 84 (3.5) 9 (2.8) 4 (1.5) 0 (0.0)El Salvador 0 (0.0) 21 (3.3) 64 (4.0) 13 (3.2) 2 (1.2)England 34 (4.2) 56 (4.6) 10 (2.2) 0 (0.0) 0 (0.0)Georgia 90 (1.9) 9 (1.7) 0 (0.0) 1 (0.7) 0 (0.0)Germany 0 (0.0) 100 (0.1) 0 (0.0) 0 (0.0) 0 (0.0)Hong Kong SAR 13 (2.5) 68 (3.8) 18 (3.5) 1 (0.8) 0 (0.0)Hungary – – – – – – – – – –Iran, Islamic Rep. of 1 (0.6) 27 (4.1) 44 (4.2) 28 (3.9) 0 (0.0)Italy 2 (0.7) 19 (2.5) 6 (1.5) 73 (3.0) 0 (0.0)Japan 3 (1.3) 90 (2.2) 7 (1.8) 0 (0.0) 0 (0.0)Kazakhstan 24 (3.4) 40 (5.3) 35 (5.3) 0 (0.0) 0 (0.0)Kuwait r 2 (1.2) 94 (2.0) 4 (1.8) 0 (0.0) 0 (0.0)Latvia 0 (0.0) 98 (1.0) 1 (0.0) 2 (0.8) 0 (0.0)Lithuania 18 (2.5) 60 (3.1) 22 (2.9) 0 (0.0) 0 (0.0)Morocco 0 (0.0) 27 (3.9) 3 (1.4) 55 (4.2) 14 (2.8)Netherlands 2 (1.4) 96 (1.7) 0 (0.0) 1 (1.0) 0 (0.0)New Zealand 10 (1.7) 65 (2.8) 25 (2.2) 0 (0.0) 0 (0.0)Norway 1 (0.5) 71 (3.3) 27 (3.2) 1 (0.7) 1 (0.4)Qatar 10 (0.1) 84 (0.2) 3 (0.1) 3 (0.1) 0 (0.0)Russian Federation 36 (3.4) 35 (3.5) 29 (3.1) 0 (0.0) 0 (0.0)Scotland r 26 (3.5) 74 (3.5) 0 (0.0) 0 (0.0) 0 (0.0)Singapore 4 (1.0) 54 (2.7) 40 (2.5) 2 (1.1) 0 (0.0)Slovak Republic 96 (1.3) 0 (0.0) 0 (0.0) 3 (1.4) 0 (0.0)Slovenia 0 (0.0) 50 (2.6) 49 (2.6) 0 (0.4) 0 (0.0)Sweden 12 (2.2) 58 (3.8) 30 (3.4) 0 (0.0) 0 (0.0)Tunisia 0 (0.0) 8 (2.3) 32 (3.8) 60 (3.5) 0 (0.0)Ukraine 1 (0.6) 81 (3.1) 18 (3.1) 0 (0.0) 0 (0.0)United States 54 (2.7) 45 (2.7) 0 (0.2) 0 (0.0) 0 (0.0)Yemen 0 (0.0) 26 (4.1) 44 (4.9) 28 (4.7) 2 (1.7)International Avg. 17 (0.3) 53 (0.5) 18 (0.4) 11 (0.3) 1 (0.1)
Benchmarking ParticipantsAlberta, Canada 12 (2.4) 86 (2.7) 1 (1.0) 0 (0.0) 0 (0.0)British Columbia, Canada r 18 (2.3) 82 (2.3) 0 (0.0) 0 (0.0) 0 (0.0)Dubai, UAE s 3 (0.2) 97 (0.2) 0 (0.0) 0 (0.0) 0 (0.0)Massachusetts, US 80 (4.5) 20 (4.5) 0 (0.0) 0 (0.0) 0 (0.0)Minnesota, US r 75 (5.1) 25 (5.1) 0 (0.0) 0 (0.0) 0 (0.0)Ontario, Canada 29 (4.5) 69 (4.6) 2 (0.9) 1 (0.6) 0 (0.0)Quebec, Canada 10 (2.6) 89 (2.8) 2 (1.2) 0 (0.0) 0 (0.0)
Background data provided by teachers.* Based on countries’ categorizations to UNESCO’s International Standard Classification
of Education (Operational Manual for ISCED-1997).** For example, doctorate, master’s, other postgraduate degree or diploma.( ) Standard errors appear in parentheses. Because results are rounded to the nearest
whole number, some totals may appear inconsistent.
A dash (–) indicates comparable data are not available. An “r” indicates data are available for at least 70 but less than 85% of the students. An “s” indicates data are available for at least 50 but less than 70% of the students.
SOU
RCE:
IEA
’s Tr
ends
in In
tern
atio
nal M
athe
mat
ics
and
Scie
nce
Stud
y (T
IMSS
) 200
7
Exhibit 6.2 Highest Educational Level of Science Teachers*

265chapter 6: teachers of science
Exhibit 6.2: Highest Educational Level of Science Teachers* (Continued)
Country
Percentage of Students by Their Teachers’ Educational Level
Completed Postgraduate
University Degree**
Completed University but Not
a Postgraduate Degree
Completed Post-secondary
Education but Not University
Completed Upper-secondary
School
Did Not Complete Upper-secondary
School
Algeria 1 (0.0) 17 (2.6) 62 (3.2) 17 (2.5) 3 (1.0)Armenia 94 (1.0) 5 (0.8) 0 (0.3) 1 (0.3) 0 (0.0)Australia 63 (3.4) 35 (3.6) 2 (1.0) 0 (0.0) 0 (0.0)Bahrain 8 (1.0) 91 (1.1) 0 (0.0) 0 (0.0) 0 (0.0)Bosnia and Herzegovina 0 (0.0) 19 (1.8) 79 (1.8) 1 (0.4) 1 (0.3)Botswana 1 (0.9) 29 (3.6) 70 (3.7) 0 (0.0) 0 (0.0)Bulgaria 70 (2.9) 15 (1.9) 14 (2.5) 0 (0.0) 0 (0.1)Chinese Taipei 30 (3.8) 57 (4.1) 3 (1.5) 10 (2.3) 0 (0.0)Colombia 20 (5.9) 79 (5.8) 0 (0.2) 0 (0.0) 0 (0.5)Cyprus r 31 (1.0) 69 (1.0) 0 (0.0) 0 (0.0) 0 (0.0)Czech Republic 95 (1.0) 1 (0.4) 1 (0.5) 3 (0.8) 0 (0.0)Egypt 7 (2.1) 91 (2.6) 1 (1.0) 1 (1.0) 1 (0.6)El Salvador 1 (0.0) 32 (4.1) 60 (4.0) 7 (2.2) 0 (0.0)England 39 (2.8) 56 (2.9) 4 (1.3) 0 (0.0) 0 (0.2)Georgia 94 (1.4) 6 (1.3) 0 (0.0) 1 (0.2) 0 (0.0)Ghana 0 (0.0) 10 (2.1) 76 (3.2) 13 (2.7) 1 (0.6)Hong Kong SAR 28 (3.6) 64 (4.0) 8 (2.3) 0 (0.0) 0 (0.0)Hungary – – – – – – – – – –Indonesia 1 (0.7) 76 (2.8) 19 (2.6) 4 (1.3) 0 (0.0)Iran, Islamic Rep. of 1 (0.6) 53 (4.1) 47 (4.2) 0 (0.0) 0 (0.0)Israel 33 (3.1) 65 (3.2) 2 (0.8) 0 (0.0) 0 (0.0)Italy 14 (2.4) 86 (2.4) 0 (0.0) 0 (0.0) 0 (0.0)Japan 15 (2.9) 83 (2.9) 2 (1.1) 0 (0.0) 0 (0.0)Jordan 9 (2.2) 86 (2.9) 4 (1.8) 0 (0.0) 0 (0.0)Korea, Rep. of 29 (3.7) 71 (3.7) 0 (0.0) 0 (0.0) 0 (0.0)Kuwait r 6 (2.1) 94 (2.1) 0 (0.0) 0 (0.0) 0 (0.0)Lebanon 7 (1.9) 79 (3.6) 0 (0.0) 14 (3.2) 0 (0.0)Lithuania 40 (2.8) 47 (2.7) 12 (1.7) 1 (0.4) 0 (0.0)Malaysia 2 (1.0) 79 (3.0) 16 (2.6) 2 (1.2) 1 (0.0)Malta 15 (0.2) 76 (0.3) 4 (0.2) 5 (0.1) 0 (0.0)Norway 12 (2.7) 76 (3.4) 10 (2.2) 0 (0.0) 2 (1.0)Oman 2 (0.4) 97 (0.8) 1 (0.4) 1 (0.0) 0 (0.0)Palestinian Nat'l Auth. 6 (2.0) 84 (3.0) 10 (2.3) 0 (0.0) 0 (0.0)Qatar 12 (0.1) 86 (0.1) 1 (0.0) 0 (0.0) 0 (0.0)Romania 12 (1.2) 71 (1.6) 16 (1.7) 1 (0.6) 0 (0.0)Russian Federation 90 (1.1) 9 (1.1) 1 (0.4) 1 (0.5) 0 (0.0)Saudi Arabia 0 (0.0) 96 (1.9) 2 (1.6) 1 (0.0) 0 (0.0)Scotland r 38 (2.4) 62 (2.4) 0 (0.0) 0 (0.0) 0 (0.0)Serbia 2 (0.6) 57 (2.5) 40 (2.5) 0 (0.2) 0 (0.0)Singapore 6 (1.0) 87 (1.6) 7 (1.4) 0 (0.0) 0 (0.0)Slovenia 2 (0.8) 44 (2.9) 52 (2.8) 1 (0.5) 0 (0.0)Sweden 56 (2.4) 39 (2.4) 5 (1.2) 1 (0.7) 0 (0.0)Syrian Arab Republic 1 (0.5) 2 (0.9) 95 (1.5) 2 (0.8) 0 (0.5)Thailand 11 (2.5) 86 (2.8) 4 (1.5) 0 (0.0) 0 (0.0)Tunisia 13 (2.9) 70 (3.8) 17 (3.0) 0 (0.0) 1 (0.0)Turkey 5 (2.2) 75 (3.9) 21 (3.5) 0 (0.0) 0 (0.0)Ukraine 2 (0.6) 96 (0.8) 2 (0.5) 1 (0.3) 0 (0.0)United States 60 (2.8) 40 (2.8) 0 (0.0) 0 (0.0) 0 (0.0)
¶ Morocco 3 (0.8) 34 (3.9) 16 (2.6) 42 (3.7) 5 (2.1)International Avg. 23 (0.3) 58 (0.4) 16 (0.3) 3 (0.2) 0 (0.1)
Benchmarking ParticipantsBasque Country, Spain 55 (4.3) 45 (4.3) 0 (0.0) 0 (0.0) 0 (0.0)British Columbia, Canada 57 (3.9) 39 (4.3) 1 (1.0) 0 (0.3) 2 (0.1)Dubai, UAE s 4 (1.2) 90 (1.4) 5 (0.5) 0 (0.0) 1 (0.7)Massachusetts, US 66 (7.9) 34 (7.9) 0 (0.0) 0 (0.0) 0 (0.0)Minnesota, US 63 (6.9) 37 (6.9) 0 (0.0) 0 (0.0) 0 (0.0)Ontario, Canada 80 (3.6) 19 (3.5) 1 (0.9) 0 (0.0) 0 (0.0)Quebec, Canada 15 (2.9) 81 (3.4) 1 (1.0) 2 (1.9) 0 (0.0)
Background data provided by teachers.* Based on countries’ categorizations to UNESCO’s International Standard Classification
of Education (Operational Manual for ISCED-1997).** For example, doctorate, master’s, other postgraduate degree or diploma.¶ Did not satisfy guidelines for sample participation rates (see Appendix A).
( ) Standard errors appear in parentheses. Because results are rounded to the nearest whole number, some totals may appear inconsistent.
A dash (–) indicates comparable data are not available. An “r” indicates data are available for at least 70 but less than 85% of the students. An “s” indicates data are available for at least 50 but less than 70% of the students.
SOU
RCE:
IEA
’s Tr
ends
in In
tern
atio
nal M
athe
mat
ics
and
Scie
nce
Stud
y (T
IMSS
) 200
7
Exhibit 6.2 Highest Educational Level of Science Teachers* (Continued)

266 chapter 6: teachers of science
Exhibit 6.3: Teachers' Educational Emphasis on Science and Teaching
Country
Teachers Receive Specific Preparation in How to Teach the
Science Curriculum as Part of Pre-service
Education
Percentage of Students by Their Teachers’ Major Area of Study in Their Post-secondary Education
Primary/Elementary Education with a
Major or Specialization
in Science
Primary/Elementary
Education with a Major or
Specialization in Mathematics
but Not in Science
Science or Mathematics Major
or Specialization Without a Major
in Primary/Elementary Education
Primary/Elementary
Education Without a Major or
Specialization in Science
or Mathematics
Other
Algeria k r 15 (3.5) 3 (1.3) 14 (3.4) 46 (4.9) 22 (3.8)Armenia j 6 (2.1) 3 (1.1) 90 (2.4) 1 (0.5) 1 (0.6)Australia k 12 (2.5) 2 (0.6) 2 (0.8) 82 (2.9) 2 (1.0)Austria k 1 (0.5) 3 (1.1) 0 (0.0) 95 (1.2) 0 (0.2)Chinese Taipei k 39 (4.2) 6 (2.0) 17 (2.9) 25 (3.5) 14 (2.9)Colombia j 20 (4.6) 5 (2.8) 14 (3.2) 40 (3.9) 20 (4.2)Czech Republic k 1 (1.0) 2 (1.2) 5 (1.6) 73 (3.7) 19 (3.0)Denmark k r 14 (2.9) 8 (2.3) 33 (4.8) 17 (3.0) 28 (3.9)El Salvador j 11 (2.7) 3 (1.5) 12 (2.9) 34 (4.3) 40 (4.3)England k 16 (2.5) 5 (1.5) 10 (2.4) 49 (3.7) 20 (3.2)Georgia j 45 (4.3) 10 (3.9) 12 (3.3) 23 (3.3) 11 (2.8)Germany k 69 (2.8) 16 (2.2) 2 (1.0) 10 (1.7) 3 (0.9)Hong Kong SAR j 27 (4.1) 13 (3.0) 10 (2.4) 39 (4.6) 12 (2.6)Hungary k 4 (1.5) 3 (2.2) 0 (0.0) 93 (2.6) 0 (0.0)Iran, Islamic Rep. of k 43 (4.0) 7 (2.3) 10 (2.0) 28 (3.0) 13 (2.9)Italy j 0 (0.0) 0 (0.0) 2 (0.7) 4 (1.2) 94 (1.4)Japan k 15 (2.4) 6 (2.0) 5 (1.8) 55 (3.8) 18 (2.9)Kazakhstan k 83 (3.6) 7 (2.2) 3 (1.3) 6 (2.5) 1 (0.4)Kuwait k r 32 (4.3) 19 (3.8) 38 (4.1) 8 (2.4) 3 (1.2)Latvia k 71 (3.7) 5 (1.5) 1 (0.6) 24 (3.5) 0 (0.0)Lithuania k 7 (1.8) 1 (1.1) 2 (0.7) 85 (2.3) 5 (1.7)Morocco k r 12 (2.6) 1 (0.8) 19 (2.6) 42 (4.0) 26 (3.4)Netherlands k 21 (3.8) 16 (3.2) 0 (0.0) 61 (4.5) 2 (1.2)New Zealand k 10 (1.5) 9 (1.6) 3 (1.1) 72 (2.5) 6 (1.4)Norway k – – – – – – – – – –Qatar k 14 (0.1) 0 (0.0) 55 (0.2) 14 (0.1) 16 (0.1)Russian Federation k 48 (3.2) 9 (2.0) 6 (1.4) 35 (2.8) 2 (1.0)Scotland k 9 (2.1) 6 (1.7) 3 (1.2) 73 (3.5) 10 (2.2)Singapore k 41 (2.9) 15 (2.0) 13 (1.8) 16 (2.0) 15 (2.0)Slovak Republic k 2 (1.0) 0 (0.2) 13 (2.8) 80 (3.1) 4 (1.4)Slovenia k 54 (3.3) 4 (1.2) 0 (0.0) 42 (3.1) 0 (0.4)Sweden k 39 (3.4) 8 (1.5) 5 (1.0) 42 (3.6) 7 (1.8)Tunisia k r 7 (2.1) 0 (0.0) 12 (2.8) 19 (3.9) 62 (4.9)Ukraine k 20 (3.2) 4 (1.4) 2 (1.3) 68 (3.6) 6 (1.7)United States k 9 (1.4) 4 (0.8) 3 (1.0) 70 (2.3) 13 (1.7)Yemen k 12 (3.6) 2 (1.2) 38 (4.8) 16 (3.5) 32 (4.4)International Avg. 24 (0.5) 6 (0.3) 13 (0.4) 42 (0.5) 15 (0.4)
Benchmarking ParticipantsAlberta, Canada k 9 (2.2) 3 (1.2) 3 (1.0) 71 (3.5) 14 (3.1)British Columbia, Canada j r 10 (2.6) 2 (1.6) 2 (0.8) 72 (4.2) 15 (3.4)Dubai, UAE k s 18 (2.4) 1 (0.7) 69 (3.5) 7 (1.7) 5 (1.9)Massachusetts, US – 8 (2.6) 8 (3.5) 7 (3.0) 63 (4.9) 15 (3.7)Minnesota, US k 19 (7.6) 5 (2.3) 0 (0.0) 76 (7.6) 0 (0.0)Ontario, Canada k 6 (1.8) 5 (2.8) 3 (1.5) 65 (4.2) 21 (3.2)Quebec, Canada k 4 (1.6) 4 (1.7) 1 (0.7) 82 (3.3) 9 (2.7)
Background data provided by National Research Coordinators and by teachers.( ) Standard errors appear in parentheses. Because results are rounded to the nearest
whole number, some totals may appear inconsistent.
A dash (–) indicates comparable data are not available. An “r” indicates data are available for at least 70 but less than 85% of the students. An “s” indicates data are available for at least 50 but less than 70% of the students.
k Yes j No
SOU
RCE:
IEA
’s Tr
ends
in In
tern
atio
nal M
athe
mat
ics
and
Scie
nce
Stud
y (T
IMSS
) 200
7
Exhibit 6.3 Teachers’ Educational Emphasis on Science and Teaching

267chapter 6: teachers of science
Exhibit 6.3: Teachers' Educational Emphasis on Science and Teaching (Continued)
Country
Teachers Receive Specific Preparation in How to Teach the
Science Curriculum as Part of Pre-service
Education
Percentage of Students by Their Teachers’ Major Area of Study in Their Post-secondary Education1
Education –Science
Biology, Physics, Chemistry, or Earth Science
Education –Mathematics Mathematics Education –
General Other
Algeria j r 26 (2.8) 83 (2.2) r 10 (2.2) r 15 (2.3) r 13 (2.2) r 16 (2.4)Armenia j 37 (2.5) 99 (0.4) 22 (2.3) 47 (2.3) 49 (2.4) 42 (2.8)Australia k 63 (3.3) 85 (2.4) 16 (2.3) 22 (2.6) 39 (4.1) r 30 (3.3)Bahrain k 48 (2.7) 91 (1.5) 2 (0.6) 9 (1.8) 20 (2.1) 12 (1.5)Bosnia and Herzegovina k 28 (2.6) 96 (0.9) 7 (0.9) 15 (1.1) 26 (2.4) 19 (2.0)Botswana k 71 (4.1) 69 (4.8) 19 (3.4) 28 (4.1) 27 (4.0) r 16 (3.3)Bulgaria j 57 (2.8) 97 (0.9) 15 (1.4) 26 (1.9) 54 (2.8) 35 (3.8)Chinese Taipei k 38 (3.9) 96 (1.7) 6 (1.7) 16 (2.6) 42 (4.3) r 9 (2.8)Colombia j 42 (5.8) 93 (2.2) 2 (1.0) 14 (5.5) 34 (5.4) r 16 (3.6)Cyprus j r 13 (0.6) 96 (0.6) r 2 (0.3) r 13 (0.7) r 9 (0.5) r 10 (0.7)Czech Republic k 45 (2.4) 84 (1.8) 20 (1.6) 20 (1.8) 22 (2.0) 39 (2.0)Egypt j 46 (3.9) 87 (2.4) 2 (1.1) 4 (1.5) 16 (3.1) 7 (2.3)El Salvador k 41 (4.6) 58 (3.9) 19 (3.6) 34 (4.3) 48 (5.0) 47 (5.0)England k r 43 (2.8) 93 (1.4) r 2 (0.8) r 15 (1.7) r 24 (2.4) r 17 (2.2)Georgia j 10 (1.4) 91 (1.6) 3 (0.8) 5 (1.0) 5 (1.3) 8 (1.5)Ghana k 59 (4.4) 60 (4.2) 43 (3.9) 55 (4.0) 58 (4.0) r 40 (4.3)Hong Kong SAR j 45 (5.1) 70 (4.3) 23 (3.8) 22 (3.9) 31 (4.1) 30 (4.6)Hungary k 94 (1.3) 95 (1.3) 29 (1.6) 30 (1.6) 5 (1.3) 34 (2.3)Indonesia k 29 (3.2) 74 (2.9) 4 (1.0) 4 (1.2) 10 (2.2) 12 (2.3)Iran, Islamic Rep. of k 84 (2.9) 35 (3.4) 3 (1.0) 7 (1.9) 7 (1.4) 12 (2.4)Israel k r 59 (3.5) r 90 (2.1) r 1 (0.7) r 7 (2.0) r 19 (2.7) r 12 (2.3)Italy j – – 67 (3.1) – – 16 (2.4) – – 17 (2.6)Japan k 35 (3.9) 90 (2.6) 1 (0.7) 2 (1.3) 14 (2.9) 11 (2.6)Jordan j 37 (3.9) 86 (2.8) 6 (1.9) 53 (4.1) 20 (3.7) 16 (3.2)Korea, Rep. of k 13 (2.5) 92 (2.1) 0 (0.0) 0 (0.0) 1 (0.6) 6 (1.9)Kuwait k r 37 (4.6) r 71 (4.4) r 8 (2.8) r 6 (1.7) r 18 (4.0) r 9 (2.9)Lebanon k 25 (3.5) 93 (1.6) 6 (1.2) 29 (3.2) 12 (2.2) r 11 (2.2)Lithuania k 16 (1.6) 93 (1.4) 1 (0.5) 7 (1.1) 23 (2.0) r 19 (2.2)Malaysia k 49 (4.2) 64 (4.3) 18 (2.9) 36 (4.0) 28 (3.8) 29 (3.3)Malta k 25 (0.2) 83 (0.2) 14 (0.2) 24 (0.2) 39 (0.3) 26 (0.3)Norway k 11 (2.8) s 49 (3.8) 7 (2.2) 39 (3.8) 44 (4.1) r 53 (4.2)Oman k 42 (4.4) 95 (1.8) 5 (2.3) 8 (2.6) 15 (3.3) 3 (1.4)Palestinian Nat'l Auth. k 29 (3.9) 83 (3.1) 2 (1.1) 6 (2.0) 20 (2.8) 9 (2.5)Qatar j 22 (0.1) 91 (0.1) 1 (0.0) 6 (0.1) 10 (0.1) 10 (0.1)Romania k 42 (2.6) 96 (1.0) 4 (1.0) 21 (2.2) 54 (2.3) 25 (2.6)Russian Federation k 50 (2.5) 97 (0.6) 8 (0.8) 14 (0.9) 47 (2.8) 20 (1.9)Saudi Arabia k 31 (4.1) 89 (2.8) 1 (0.7) 0 (0.0) 16 (3.0) 3 (1.2)Scotland k r 44 (2.0) r 98 (0.6) r 9 (1.3) r 27 (2.2) r 23 (1.9) r 14 (2.1)Serbia j 24 (2.0) 99 (0.3) 1 (0.4) 6 (0.9) 18 (1.8) 12 (1.4)Singapore k 49 (2.8) 94 (0.9) 31 (2.5) 58 (2.4) 40 (2.2) r 31 (2.4)Slovenia k 90 (1.2) 8 (1.3) 17 (1.4) 2 (0.5) – – 16 (2.0)Sweden k 63 (2.7) 77 (2.9) 55 (2.7) 51 (3.1) 29 (2.8) 22 (2.5)Syrian Arab Republic k 23 (3.3) 83 (3.1) 3 (1.2) 13 (2.3) 14 (2.4) 15 (2.7)Thailand k 22 (3.3) 42 (4.5) 0 (0.0) 1 (0.0) 6 (1.9) 29 (4.3)Tunisia j 9 (2.3) 99 (0.7) 1 (0.9) 6 (2.0) 6 (2.1) 5 (1.8)Turkey k 53 (4.3) 59 (4.3) 3 (1.4) 16 (2.7) 25 (3.5) 9 (2.3)Ukraine k 11 (2.0) 92 (1.2) 7 (0.9) 6 (0.9) 8 (1.7) 12 (1.7)United States k 39 (2.5) 57 (3.1) 3 (0.9) 6 (1.3) 38 (3.2) 34 (2.7)
¶ Morocco k r 12 (2.8) r 96 (1.8) r 2 (1.3) r 5 (1.8) r 5 (1.7) r 8 (2.3)International Avg. 39 (0.5) 81 (0.4) 10 (0.3) 18 (0.3) 24 (0.4) 19 (0.4)
Benchmarking ParticipantsBasque Country, Spain j 45 (4.4) 57 (4.6) 23 (3.9) 19 (4.3) 17 (3.8) 12 (3.3)British Columbia, Canada j 47 (4.2) r 74 (3.9) 14 (3.4) 11 (2.6) 40 (4.0) 45 (4.3)Dubai, UAE k s 48 (3.8) s 86 (2.8) s 5 (1.4) s 20 (3.4) s 12 (1.9) s 13 (3.4)Massachusetts, US k 45 (6.9) 68 (5.8) 3 (2.6) 7 (2.8) 25 (4.4) 28 (5.3)Minnesota, US k 66 (8.0) 90 (4.2) 4 (2.3) 5 (2.6) 19 (5.1) 26 (5.6)Ontario, Canada k 29 (4.4) 44 (4.2) 8 (2.2) 7 (2.0) 56 (4.5) 61 (4.3)Quebec, Canada k 51 (4.7) 69 (4.1) 14 (3.8) 10 (3.1) 17 (3.7) 21 (3.4)
Background data provided by National Research Coordinators and by teachers.1 Teachers who responded that they majored in more than one area are reflected in all
categories that apply.¶ Did not satisfy guidelines for sample participation rates (see Appendix A).
( ) Standard errors appear in parentheses. Because results are rounded to the nearest whole number, some totals may appear inconsistent.
A dash (–) indicates comparable data are not available. An “r” indicates data are available for at least 70 but less than 85% of the students. An “s” indicates data are available for at least 50 but less than 70% of the students.
k Yes j No
SOU
RCE:
IEA
’s Tr
ends
in In
tern
atio
nal M
athe
mat
ics
and
Scie
nce
Stud
y (T
IMSS
) 200
7
Exhibit 6.3 Teachers’ Educational Emphasis on Science and Teaching (Continued)

268 chapter 6: teachers of science
Exhibit 6.4: Teachers’ Major Area of Study in Science
Country
Percentage of Students Taught by Teachers Having Major Area of Study in Sciences in Their Post-secondary Education1
Biology Physics Chemistry Earth Science
Algeria r 43 (2.1) r 45 (2.6) r 31 (3.0) r 23 (3.1)Armenia 43 (1.6) 52 (2.4) 51 (2.0) 24 (1.2)Australia 61 (3.2) 23 (2.9) 51 (3.5) 21 (2.5)Bahrain 34 (2.9) 30 (1.9) 61 (2.7) 7 (1.3)Bosnia and Herzegovina 32 (1.1) 26 (1.1) 40 (1.4) 26 (0.6)Botswana 63 (4.7) 40 (4.4) 51 (4.8) 7 (2.2)Bulgaria 40 (2.0) 41 (2.2) 52 (1.5) 29 (2.0)Chinese Taipei 20 (3.5) 64 (4.0) 72 (3.9) 22 (3.3)Colombia 79 (3.6) 12 (2.5) 64 (3.9) 16 (3.1)Cyprus r 26 (0.8) r 39 (1.0) r 46 (0.8) r 15 (0.7)Czech Republic 38 (1.9) 21 (1.5) 33 (1.8) 22 (1.4)Egypt 48 (4.7) 43 (3.6) 53 (4.5) 16 (3.0)El Salvador 48 (3.8) 31 (4.1) 40 (4.1) 25 (3.8)England 64 (2.6) 31 (2.7) 53 (2.8) r 10 (2.2)Georgia 38 (1.9) 25 (1.2) 30 (1.9) 23 (1.5)Ghana 53 (4.2) 56 (4.1) 57 (4.1) 14 (3.1)Hong Kong SAR 34 (4.4) 28 (3.8) 36 (4.2) 3 (1.6)Hungary 40 (1.7) 26 (1.1) 31 (1.3) 34 (1.3)Indonesia 43 (2.9) 32 (3.1) 10 (2.2) 2 (0.9)Iran, Islamic Rep. of 24 (3.0) 20 (2.8) 26 (3.0) 21 (3.0)Israel r 76 (3.0) r 32 (3.5) r 54 (4.1) r 4 (1.3)Italy 52 (3.0) 4 (1.4) 3 (1.0) 9 (1.8)Japan 31 (4.3) 27 (3.6) 42 (3.7) 16 (3.0)Jordan 52 (4.0) 65 (3.8) 62 (4.1) 36 (4.2)Korea, Rep. of 28 (3.2) 26 (3.6) 23 (3.4) 16 (2.9)Kuwait r 35 (4.6) r 31 (3.8) r 44 (4.4) r 20 (4.5)Lebanon 67 (3.1) 45 (3.5) 58 (3.8) 24 (3.1)Lithuania 35 (1.3) 25 (1.1) 28 (1.4) 22 (0.7)Malaysia 50 (4.1) 34 (4.2) 43 (4.0) 13 (2.6)Malta 24 (0.3) 34 (0.2) 21 (0.3) 27 (0.2)Norway s 33 (3.6) s 9 (2.3) s 15 (2.9) s 12 (3.0)Oman 21 (3.4) 66 (4.0) 57 (4.3) 9 (2.5)Palestinian Nat'l Auth. 34 (4.3) 27 (3.8) 35 (4.4) 8 (2.2)Qatar 41 (0.2) 35 (0.2) 46 (0.2) 13 (0.1)Romania 28 (1.0) 46 (1.5) 50 (1.5) 24 (0.7)Russian Federation 49 (1.5) 27 (0.5) 40 (1.0) 29 (1.0)Saudi Arabia 46 (4.7) 16 (3.3) 31 (4.4) 15 (2.8)Scotland r 48 (2.5) r 38 (2.1) r 50 (2.2) r 9 (1.6)Serbia 28 (0.7) 29 (1.0) 38 (1.2) 25 (0.4)Singapore 50 (2.6) 47 (2.1) 62 (2.5) 12 (1.6)Slovenia 3 (0.8) 3 (0.9) 3 (0.9) – –Sweden 54 (3.1) 41 (2.7) 56 (3.2) 13 (2.0)Syrian Arab Republic 50 (2.9) 52 (3.2) 52 (3.2) 17 (2.6)Thailand 21 (3.2) 6 (2.0) 13 (3.0) 2 (1.3)Tunisia 96 (1.3) 7 (2.1) 9 (2.4) 73 (3.4)Turkey 24 (3.7) 33 (4.2) 36 (3.7) 5 (1.8)Ukraine 39 (1.6) 22 (0.8) 32 (1.5) 24 (1.2)United States 42 (2.7) 7 (1.5) 17 (2.1) 17 (2.2)
¶ Morocco r 46 (3.1) r 47 (3.2) r 40 (3.7) r 33 (3.6)International Avg. 42 (0.4) 32 (0.4) 40 (0.4) 19 (0.3)
Benchmarking ParticipantsBasque Country, Spain 37 (4.7) 17 (4.2) 30 (4.1) 11 (3.3)British Columbia, Canada r 53 (3.7) r 10 (2.5) r 26 (3.6) r 14 (2.8)Dubai, UAE s 43 (5.6) s 41 (6.1) s 53 (5.1) s 8 (1.9)Massachusetts, US 47 (6.6) 12 (4.6) 20 (6.0) 27 (6.2)Minnesota, US 68 (7.4) 7 (2.2) 25 (6.5) 37 (8.2)Ontario, Canada 30 (4.1) 10 (2.8) 19 (3.7) 21 (4.1)Quebec, Canada 46 (5.1) 25 (4.5) 24 (4.5) 14 (3.4)
Background data provided by teachers.1 Teachers who responded that they majored in more than one area are reflected in all
categories that apply.¶ Did not satisfy guidelines for sample participation rates (see Appendix A).( ) Standard errors appear in parentheses. Because results are rounded to the nearest
whole number, some totals may appear inconsistent.
A dash (–) indicates comparable data are not available. An “r” indicates data are available for at least 70 but less than 85% of the students. An “s” indicates data are available for at least 50 but less than 70% of the students.
SOU
RCE:
IEA
’s Tr
ends
in In
tern
atio
nal M
athe
mat
ics
and
Scie
nce
Stud
y (T
IMSS
) 200
7
Exhibit 6.4 Teachers’ Major Area of Study in Science

269chapter 6: teachers of science
Exhibit 6.5 contains teachers’ reports about their participation in professional development in science. At the fourth grade, one-third of the students, on average internationally, had teachers that had participated in some type of professional development during the past two years in the various science areas asked about by TIMSS, including science content (34%), science pedagogy (35%), science curriculum (3�%), and/or improving students’ critical thinking or inquiry skills (33%). Somewhat fewer students had teachers with such professional development in science assessment (28%) and/or integrating information technology into science (24%). At the eighth grade, the participation in professional development was somewhat higher, but the pattern was similar. Approximately one-half of the eighth grade students, on average internationally, had teachers that had participated in some type of professional development during the past two years in science content (58%), science pedagogy (57%), science curriculum (5�%), science assessment (47%), improving students critical thinking or inquiry skills (46%), and integrating information technology into science (45%).
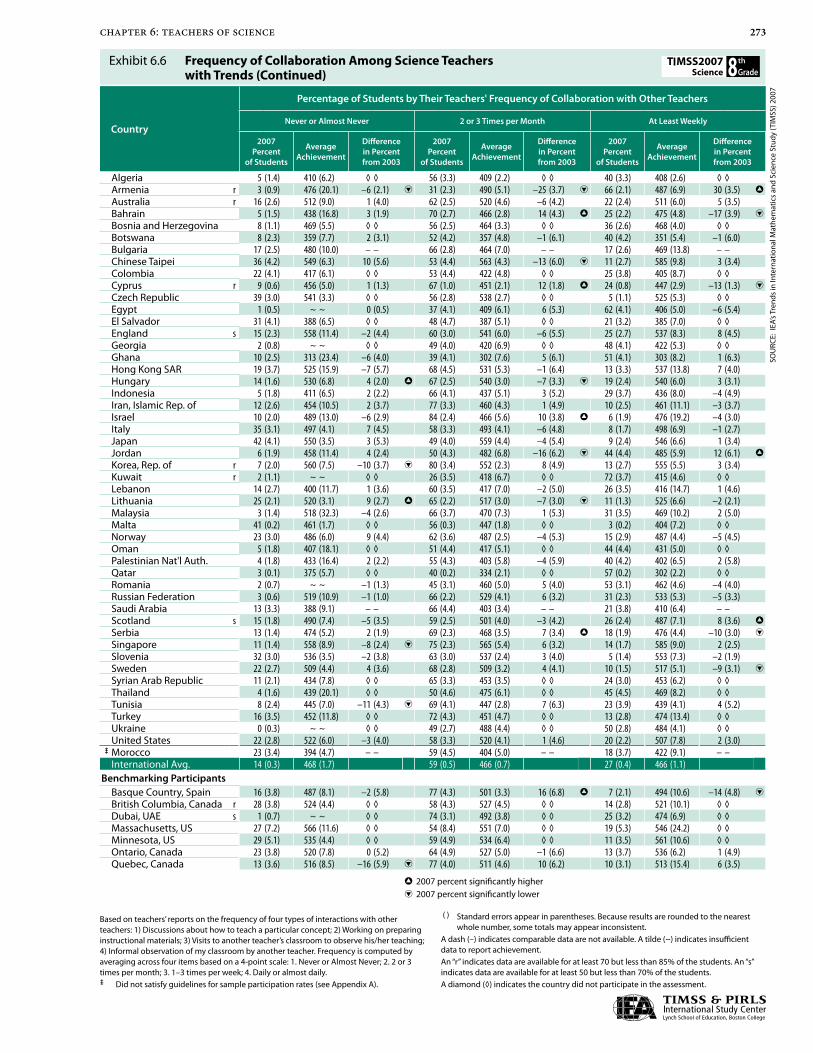
Teachers also were asked about opportunities for collaboration with other science teachers. Exhibit 6.6 contains the results in relation to students’ average science achievement, with trend data from 2003. Internationally on average, the largest percentages of students at both grades (59% for both) had teachers that collaborated with other teachers about 2–3 times a month. Other than that, collaboration tended to be more frequent (27–3�% at least weekly) rather than less frequent (�0–�4% never or almost never). Although teachers may well appreciate opportunities to benefit from the experience of their colleagues, on average internationally, the frequency of collaboration was not related to achievement at either grade. At the fourth grade, between 2003 and 2007 the frequency of collaboration (percent at least weekly) increased to some extent in Armenia, Italy, Morocco, Scotland, and Tunisia while it decreased in Lithuania. At the eighth grade, the frequency of collaboration increased between 2003 and 2007 in Armenia, Jordan, and Scotland, while it decreased in Bahrain, Cyprus, Serbia, and Sweden.

270 chapter 6: teachers of science
Background data provided by teachers.( ) Standard errors appear in parentheses. Because results are rounded to the nearest
whole number, some totals may appear inconsistent.
An “r” indicates data are available for at least 70 but less than 85% of the students. An “s” indicates data are available for at least 50 but less than 70% of the students. An “x” indicates data are available for less than 50% of the students.
Exhibit 6.5: Teachers’ Participation in Professional Development in Science
Country
Percentage of Students by Their Teachers’ Participation in Professional Development in Science in the Past 2 Years
Science Content
Science Pedagogy / Instruction
Science Curriculum
Integrating Information
Technology into Science
Improving Students’
Critical Thinking or Inquiry Skills
Science Assessment
Algeria 32 (4.3) 48 (5.1) 40 (5.3) 9 (2.6) 35 (4.4) 36 (4.2)Armenia 15 (2.6) 17 (2.6) 23 (3.2) 16 (2.7) 18 (3.3) 17 (3.1)Australia 22 (3.0) 16 (2.5) 24 (3.4) 20 (3.1) 36 (3.5) 15 (2.3)Austria 35 (3.6) 24 (2.9) 8 (1.8) 13 (1.9) 20 (2.3) 4 (1.2)Chinese Taipei 65 (3.9) 69 (3.3) 65 (3.8) 64 (4.2) 41 (4.4) 37 (3.9)Colombia 42 (5.0) 36 (4.3) 52 (5.0) 26 (4.2) 32 (4.5) 35 (4.7)Czech Republic 20 (3.2) 19 (2.9) 15 (2.9) 17 (3.1) 24 (3.6) 13 (3.1)Denmark r 21 (3.9) r 17 (3.6) r 13 (3.3) r 6 (2.0) r 6 (2.1) r 4 (2.0)El Salvador 23 (3.4) 14 (2.6) 10 (2.1) 9 (2.5) 27 (3.9) 15 (3.1)England 32 (4.1) 41 (4.2) 34 (3.7) 28 (3.5) 42 (4.3) 36 (4.0)Georgia 20 (4.7) 25 (3.5) 30 (4.2) 16 (3.2) 49 (5.0) 44 (4.7)Germany 36 (2.8) 21 (2.6) 33 (3.2) 7 (1.6) 25 (2.5) 15 (2.2)Hong Kong SAR 53 (4.3) 47 (4.4) 38 (4.2) 45 (4.2) 56 (4.5) 31 (3.9)Hungary 24 (3.2) 29 (3.5) 13 (2.7) 14 (2.5) 26 (2.9) 7 (1.9)Iran, Islamic Rep. of 28 (3.3) 36 (3.3) 25 (3.2) 12 (2.8) 28 (3.7) 25 (3.4)Italy 16 (2.1) 10 (1.9) 8 (1.4) 17 (2.3) 12 (1.9) 6 (1.4)Japan 37 (3.8) 45 (4.0) 14 (2.6) 23 (3.3) 11 (2.4) 15 (2.9)Kazakhstan 65 (5.5) 68 (5.6) 70 (5.1) 53 (4.3) 69 (5.5) 67 (5.6)Kuwait r 39 (4.1) r 36 (4.1) r 19 (3.3) r 39 (3.8) r 43 (4.0) r 39 (4.1)Latvia 68 (3.6) 61 (3.8) 68 (3.9) 29 (3.7) 51 (4.3) 60 (3.9)Lithuania 21 (3.0) 25 (3.1) 9 (1.8) 35 (3.2) 44 (4.2) 24 (2.7)Morocco 8 (2.5) 16 (3.2) 5 (1.9) 2 (1.4) 15 (2.8) 10 (2.7)Netherlands 5 (1.7) 4 (1.3) r 3 (1.4) 7 (2.3) 17 (2.6) 5 (1.5)New Zealand 14 (1.9) 12 (1.6) 17 (1.9) 19 (2.3) 47 (2.7) 11 (1.7)Norway 8 (1.9) 4 (1.4) 12 (2.5) 4 (1.5) 4 (1.3) 0 (0.3)Qatar 37 (0.2) 39 (0.2) 27 (0.2) 29 (0.2) 44 (0.2) 39 (0.2)Russian Federation 58 (3.3) 62 (3.5) 62 (2.9) 48 (3.1) 41 (3.6) 52 (3.4)Scotland r 39 (4.1) r 44 (4.3) r 42 (4.2) r 27 (3.6) r 47 (3.9) r 23 (3.2)Singapore 61 (2.9) 68 (3.0) 48 (2.6) 52 (2.9) 57 (3.2) 53 (2.8)Slovak Republic 21 (3.1) 47 (3.8) 51 (3.8) 45 (3.6) 29 (3.5) 26 (3.4)Slovenia 63 (3.1) 57 (3.4) 43 (2.9) 29 (2.9) 23 (2.5) 57 (3.1)Sweden 22 (2.4) 17 (2.8) 21 (2.9) 4 (1.3) 14 (2.5) 11 (2.5)Tunisia 27 (3.1) 41 (3.5) 27 (3.6) 19 (3.2) 28 (3.9) 42 (3.9)Ukraine 67 (3.2) 75 (2.9) 75 (3.6) 62 (3.2) 63 (3.7) 78 (3.0)United States 42 (2.8) 29 (2.4) 44 (2.7) 28 (2.8) 36 (2.2) 24 (2.4)Yemen 22 (4.2) 35 (5.0) 27 (4.5) 7 (2.9) 41 (5.0) 36 (5.0)International Avg. 34 (0.6) 35 (0.6) 31 (0.5) 24 (0.5) 33 (0.6) 28 (0.5)
Benchmarking ParticipantsAlberta, Canada 38 (4.0) 32 (3.8) 31 (3.9) 35 (4.2) 55 (4.0) 31 (3.9)British Columbia, Canada r 51 (4.2) r 30 (4.2) r 44 (4.7) r 14 (2.9) r 45 (4.3) r 17 (3.4)Dubai, UAE s 60 (5.0) x x s 51 (5.4) s 38 (5.4) s 58 (5.1) s 53 (4.9)Massachusetts, US 45 (6.5) 41 (5.5) 51 (5.9) 35 (6.4) 38 (5.5) 21 (4.7)Minnesota, US 35 (8.7) 33 (7.4) 45 (7.7) 27 (7.6) 41 (5.7) 20 (6.5)Ontario, Canada 17 (3.6) 12 (2.7) 26 (4.6) 19 (4.6) 29 (4.0) 10 (2.7)Quebec, Canada 19 (3.1) 20 (3.4) r 15 (3.1) 11 (2.8) 11 (2.6) 10 (2.8)
SOU
RCE:
IEA
’s Tr
ends
in In
tern
atio
nal M
athe
mat
ics
and
Scie
nce
Stud
y (T
IMSS
) 200
7
Exhibit 6.5 Teachers’ Participation in Professional Development in Science

271chapter 6: teachers of science
Exhibit 6.5: Teachers’ Participation in Professional Development in Science (Continued)
Country
Percentage of Students by Their Teachers’ Participation in Professional Development in Science in the Past 2 Years
Science Content
Science Pedagogy / Instruction
Science Curriculum
Integrating Information
Technology into Science
Improving Students’
Critical Thinking or Inquiry Skills
Science Assessment
Algeria r 48 (3.2) r 60 (3.2) r 47 (3.5) r 36 (3.4) r 50 (3.6) r 47 (3.4)Armenia 38 (2.1) 50 (2.5) 51 (2.0) 31 (2.1) 44 (2.4) 34 (2.2)Australia 56 (3.7) 52 (3.5) 57 (3.9) 57 (4.3) 51 (3.9) 54 (3.5)Bahrain 45 (2.9) 50 (2.4) 35 (2.5) 68 (2.5) 58 (2.4) 50 (2.8)Bosnia and Herzegovina 44 (2.1) 39 (2.6) 46 (2.5) 45 (2.3) 49 (2.4) 53 (2.1)Botswana 22 (3.9) 15 (2.7) 13 (2.8) 18 (3.1) 26 (3.5) 33 (3.6)Bulgaria 69 (2.8) 55 (3.0) 75 (2.4) 76 (2.7) 29 (2.9) 44 (3.0)Chinese Taipei 78 (3.7) 70 (3.9) 80 (3.4) 73 (3.8) 40 (4.2) 48 (4.3)Colombia 72 (4.2) 68 (4.4) 71 (4.8) 39 (4.6) 46 (4.9) 62 (4.5)Cyprus r 58 (1.0) r 67 (0.8) r 53 (1.0) r 68 (1.0) r 48 (0.9) r 40 (1.0)Czech Republic 61 (2.4) 43 (2.3) 30 (2.7) 55 (2.7) 31 (2.3) 22 (2.5)Egypt 55 (4.1) 70 (3.6) 39 (4.1) 49 (4.4) 71 (3.9) 61 (4.1)El Salvador 53 (4.2) 36 (3.9) 22 (3.5) 24 (3.7) 43 (4.5) 30 (3.7)England 66 (2.6) 75 (2.4) 71 (2.6) 44 (3.0) 49 (3.1) 65 (2.6)Georgia 44 (3.1) 48 (3.2) 58 (2.7) 36 (3.5) 68 (3.2) 71 (3.3)Ghana 60 (4.5) 48 (4.3) 54 (4.5) 20 (3.4) 45 (4.1) 51 (4.5)Hong Kong SAR 79 (3.4) 78 (3.5) 75 (4.0) 56 (4.3) 69 (4.0) 56 (4.5)Hungary 48 (2.6) 50 (2.3) 29 (2.3) 35 (2.7) 33 (2.3) 25 (2.2)Indonesia 64 (4.1) 68 (3.6) 75 (3.2) 25 (3.1) 51 (4.3) 71 (3.1)Iran, Islamic Rep. of 81 (2.9) 83 (2.8) 58 (3.8) 44 (3.8) 51 (3.8) 58 (3.9)Israel 70 (3.9) 67 (4.2) 72 (3.7) 56 (3.3) 62 (3.8) 50 (4.0)Italy 24 (3.0) 28 (3.2) 13 (1.9) 25 (2.9) 10 (1.8) 15 (2.3)Japan 74 (3.3) 64 (3.8) 31 (3.7) 31 (3.5) 14 (2.9) 40 (4.3)Jordan 58 (4.2) 78 (3.4) 66 (4.0) 59 (3.8) 74 (3.7) 54 (4.2)Korea, Rep. of 69 (3.2) 49 (3.9) 34 (3.4) 29 (3.4) 38 (4.0) 36 (3.9)Kuwait r 53 (4.8) r 57 (4.7) r 33 (4.6) r 46 (4.5) r 47 (4.4) r 34 (4.9)Lebanon 57 (3.4) 59 (3.4) 52 (3.7) 42 (4.1) 58 (3.6) 64 (3.7)Lithuania 75 (1.9) 68 (1.9) 66 (2.2) 69 (2.2) 51 (2.4) 62 (2.0)Malaysia 66 (3.7) 46 (4.0) 66 (3.9) 60 (4.6) 38 (3.9) 49 (3.9)Malta 37 (0.3) 28 (0.3) 34 (0.3) 38 (0.3) 26 (0.3) 28 (0.3)Norway 31 (3.3) 29 (3.0) 28 (3.3) 15 (2.7) 9 (2.0) 7 (1.8)Oman 53 (4.3) 45 (4.5) 46 (4.4) 20 (3.5) 27 (3.9) 61 (3.9)Palestinian Nat'l Auth. 49 (4.2) 50 (3.8) 36 (4.3) 38 (3.4) 50 (3.4) 40 (4.2)Qatar 52 (0.2) 68 (0.1) 45 (0.2) 55 (0.1) 47 (0.2) 48 (0.1)Romania 58 (2.5) 54 (2.4) 47 (2.6) 67 (2.6) 50 (2.7) 54 (2.7)Russian Federation 63 (2.1) 72 (1.6) 70 (2.2) 67 (2.8) 49 (2.2) 54 (2.2)Saudi Arabia 41 (4.0) 55 (3.9) 21 (3.8) 30 (3.7) 44 (4.2) 31 (4.4)Scotland r 73 (2.2) r 84 (2.0) r 68 (2.4) r 64 (2.1) r 63 (2.5) r 57 (2.3)Serbia 63 (2.4) 33 (2.2) 20 (2.2) 50 (2.5) 45 (2.3) 6 (1.1)Singapore 78 (2.3) 85 (1.9) 78 (2.2) 70 (2.2) 72 (2.4) 65 (2.3)Slovenia 82 (2.1) 49 (2.2) 43 (2.1) 43 (2.2) 24 (1.7) 67 (2.3)Sweden 43 (3.3) 29 (2.5) 36 (2.6) 10 (1.9) 20 (2.4) 37 (3.1)Syrian Arab Republic 27 (3.5) 26 (3.3) 18 (2.4) 16 (2.6) 51 (3.6) 34 (3.7)Thailand 91 (2.5) 85 (3.1) 82 (3.2) 70 (3.4) 80 (3.1) 81 (3.3)Tunisia 64 (4.1) 78 (3.5) 76 (3.8) 54 (4.3) 41 (4.2) 55 (4.6)Turkey 65 (4.3) 64 (4.5) 78 (3.9) 28 (3.6) 25 (3.9) 44 (4.0)Ukraine 80 (2.3) 84 (1.9) 85 (2.0) 81 (2.0) 80 (2.1) 84 (2.0)United States 82 (2.3) 64 (2.8) 82 (2.3) 70 (3.1) 73 (2.9) 61 (3.0)
¶ Morocco 33 (3.2) 58 (3.1) r 34 (3.2) 16 (2.7) r 18 (3.1) 26 (3.5)International Avg. 58 (0.5) 57 (0.5) 51 (0.5) 45 (0.5) 46 (0.5) 47 (0.5)
Benchmarking ParticipantsBasque Country, Spain 30 (4.2) 28 (4.8) 25 (4.5) 41 (5.0) 18 (3.8) 13 (3.6)British Columbia, Canada r 84 (3.2) r 56 (3.9) r 70 (3.3) r 55 (4.0) r 64 (3.8) r 42 (4.5)Dubai, UAE s 58 (3.8) s 68 (3.3) s 64 (3.1) s 67 (3.9) s 75 (3.6) s 69 (4.2)Massachusetts, US 85 (5.3) 76 (6.8) 90 (4.3) 72 (6.3) 69 (7.4) 61 (7.1)Minnesota, US 89 (3.9) 77 (5.2) 87 (3.7) 66 (6.6) 68 (7.8) 61 (6.6)Ontario, Canada 44 (4.0) 32 (4.7) 40 (4.3) 36 (4.4) 45 (5.3) 22 (3.9)Quebec, Canada 66 (4.8) 64 (4.4) 68 (5.2) 42 (5.4) 17 (3.6) 73 (4.0)
Background data provided by teachers.¶ Did not satisfy guidelines for sample participation rates (see Appendix A). ( ) Standard errors appear in parentheses. Because results are rounded to the nearest
whole number, some totals may appear inconsistent.
An “r” indicates data are available for at least 70 but less than 85% of the students. An “s” indicates data are available for at least 50 but less than 70% of the students.
SOU
RCE:
IEA
’s Tr
ends
in In
tern
atio
nal M
athe
mat
ics
and
Scie
nce
Stud
y (T
IMSS
) 200
7
Exhibit 6.5 Teachers’ Participation in Professional Development in Science (Continued)

272 chapter 6: teachers of science
Exhibit 6.6: Frequency of Collaboration Among Science Teacherswith Trends
Country
Percentage of Students by Their Teachers' Frequency of Collaboration with Other Teachers
Never or Almost Never 2 or 3 Times per Month At Least Weekly
2007Percent
of Students
Average Achievement
Difference in Percent from 2003
2007Percent
of Students
Average Achievement
Difference in Percent from 2003
2007Percent
of Students
Average Achievement
Difference in Percent from 2003
Algeria 5 (2.0) 351 (25.8) ◊ ◊ 55 (4.6) 351 (9.4) ◊ ◊ 40 (4.4) 347 (10.2) ◊ ◊Armenia s 2 (1.0) ~ ~ 0 (1.6) 35 (3.2) 483 (9.4) –35 (5.9) i 63 (3.2) 485 (8.2) 35 (5.9) h
Australia 10 (2.4) 527 (15.4) –3 (3.2) 61 (3.3) 528 (5.0) –1 (5.2) 29 (3.0) 526 (7.0) 4 (4.7)Austria 23 (2.6) 533 (4.7) ◊ ◊ 66 (3.1) 522 (3.4) ◊ ◊ 11 (2.0) 533 (5.5) ◊ ◊Chinese Taipei 18 (3.6) 549 (6.0) 6 (4.6) 64 (4.3) 558 (3.0) –7 (5.8) 17 (2.9) 560 (4.9) 1 (4.2)Colombia 11 (2.8) 388 (12.0) ◊ ◊ 45 (5.0) 414 (8.8) ◊ ◊ 45 (5.0) 396 (11.3) ◊ ◊Czech Republic 15 (2.8) 513 (7.6) ◊ ◊ 78 (3.4) 515 (3.7) ◊ ◊ 7 (2.1) 508 (5.0) ◊ ◊Denmark 22 (3.6) 520 (6.2) ◊ ◊ 68 (4.2) 519 (3.7) ◊ ◊ 10 (2.7) 520 (6.1) ◊ ◊El Salvador 17 (3.6) 404 (9.4) ◊ ◊ 56 (4.7) 391 (5.6) ◊ ◊ 27 (3.8) 375 (8.8) ◊ ◊England r 10 (2.6) 541 (9.1) –3 (3.9) 58 (3.9) 545 (4.0) –2 (6.2) 32 (3.4) 535 (5.6) 5 (5.7)Georgia 2 (1.2) ~ ~ ◊ ◊ 39 (4.5) 415 (8.1) ◊ ◊ 59 (4.6) 420 (5.0) ◊ ◊Germany 21 (2.8) 532 (6.0) ◊ ◊ 73 (3.1) 528 (3.0) ◊ ◊ 6 (1.6) 505 (11.3) ◊ ◊Hong Kong SAR 12 (3.1) 573 (10.6) –8 (4.9) 76 (4.3) 553 (4.1) 2 (6.1) 13 (3.1) 555 (7.5) 6 (4.1)Hungary 3 (1.5) 554 (28.8) –3 (2.3) 62 (3.8) 538 (4.7) –1 (4.9) 34 (3.7) 531 (5.3) 3 (5.1)Iran, Islamic Rep. of 5 (1.7) 418 (19.6) –1 (2.7) 65 (3.7) 437 (5.6) 11 (6.1) 30 (3.9) 431 (9.1) –10 (6.3)Italy 6 (1.5) 532 (8.4) –6 (2.8) i 69 (2.9) 535 (4.1) –1 (4.2) 26 (2.5) 537 (5.8) 7 (3.5) h
Japan 12 (2.2) 548 (4.8) –2 (3.4) 74 (3.4) 547 (2.2) 6 (5.0) 14 (2.8) 552 (5.9) –3 (4.1)Kazakhstan 1 (0.7) ~ ~ ◊ ◊ 26 (4.2) 527 (11.8) ◊ ◊ 73 (4.3) 534 (5.6) ◊ ◊Kuwait r 0 (0.5) ~ ~ ◊ ◊ 40 (4.4) 342 (10.0) ◊ ◊ 59 (4.4) 350 (7.9) ◊ ◊Latvia 8 (1.9) 552 (5.7) 8 (1.9) h 78 (2.9) 543 (2.7) –4 (5.3) 13 (2.3) 538 (5.5) –4 (5.0)Lithuania 8 (1.5) 510 (6.6) 5 (2.1) h 71 (3.2) 515 (2.7) 13 (4.9) h 20 (3.0) 514 (5.5) –18 (4.8) i
Morocco s 19 (3.7) 292 (21.7) –36 (6.4) i 54 (4.0) 294 (8.9) 14 (6.6) h 27 (3.8) 296 (16.8) 22 (4.2) h
Netherlands 32 (3.6) 523 (4.2) 0 (5.5) 62 (4.1) 523 (3.4) –3 (5.8) 7 (2.3) 520 (7.7) 3 (3.1)New Zealand 5 (1.0) 504 (7.3) –4 (2.2) 65 (2.5) 508 (3.6) 3 (3.9) 31 (2.6) 499 (4.6) 1 (4.0)Norway 8 (1.7) 466 (9.7) –2 (3.4) 58 (3.8) 473 (4.3) –6 (5.7) 34 (3.8) 483 (4.4) 7 (5.0)Qatar 5 (0.1) 314 (7.1) ◊ ◊ 45 (0.2) 312 (3.3) ◊ ◊ 50 (0.2) 271 (2.7) ◊ ◊Russian Federation 0 (0.2) ~ ~ –1 (0.7) 50 (3.6) 543 (4.9) –3 (4.8) 50 (3.5) 550 (6.9) 4 (4.7)Scotland r 17 (3.1) 497 (7.3) –2 (4.6) 53 (4.1) 499 (3.6) –13 (6.1) i 30 (3.5) 505 (4.7) 15 (5.0) h
Singapore 8 (1.6) 589 (11.2) –4 (3.3) 79 (2.5) 589 (4.3) –1 (4.4) 13 (2.2) 570 (10.3) 5 (3.1)Slovak Republic 5 (1.8) 492 (20.2) ◊ ◊ 60 (3.9) 534 (3.9) ◊ ◊ 35 (3.9) 519 (11.3) ◊ ◊Slovenia 11 (1.9) 521 (6.7) –2 (3.7) 73 (2.9) 518 (2.3) –3 (4.8) 16 (2.5) 517 (5.4) 5 (3.6)Sweden 19 (3.0) 527 (4.9) ◊ ◊ 61 (3.5) 524 (3.8) ◊ ◊ 20 (3.0) 529 (5.1) ◊ ◊Tunisia r 11 (2.8) 300 (28.3) –21 (5.0) i 51 (4.1) 321 (9.1) 2 (5.8) 38 (4.0) 304 (9.6) 19 (5.1) h
Ukraine 1 (0.7) ~ ~ ◊ ◊ 20 (3.2) 482 (6.0) ◊ ◊ 79 (3.3) 472 (3.5) ◊ ◊United States 9 (1.6) 542 (9.4) –3 (2.6) 65 (2.8) 541 (3.2) 4 (3.9) 25 (2.7) 529 (4.9) –1 (3.8)Yemen r 15 (3.6) 217 (21.8) ◊ ◊ 56 (4.6) 211 (9.3) ◊ ◊ 30 (4.5) 178 (14.7) ◊ ◊International Avg. 10 (0.4) 478 (2.5) 59 (0.6) 477 (1.0) 31 (0.6) 472 (1.3)
Benchmarking ParticipantsAlberta, Canada 10 (3.0) 530 (15.5) ◊ ◊ 69 (3.8) 544 (4.2) ◊ ◊ 21 (2.9) 543 (5.4) ◊ ◊British Columbia, Canada r 23 (3.8) 543 (4.9) ◊ ◊ 63 (4.3) 536 (4.3) ◊ ◊ 14 (2.8) 522 (5.9) ◊ ◊Dubai, UAE s 0 (0.0) ~ ~ ◊ ◊ 62 (3.3) 458 (9.3) ◊ ◊ 38 (3.3) 441 (3.8) ◊ ◊Massachusetts, US 12 (3.9) 565 (13.0) ◊ ◊ 59 (5.2) 570 (5.2) ◊ ◊ 30 (5.3) 576 (7.5) ◊ ◊Minnesota, US 8 (2.9) 554 (12.8) ◊ ◊ 66 (8.6) 554 (5.7) ◊ ◊ 26 (8.1) 546 (22.4) ◊ ◊Ontario, Canada 14 (3.5) 537 (8.2) –4 (5.0) 63 (5.1) 534 (5.1) –2 (6.5) 23 (4.4) 536 (9.8) 6 (5.7)Quebec, Canada 18 (2.9) 522 (6.1) 0 (4.3) 67 (3.9) 518 (3.5) –5 (5.6) 16 (3.1) 517 (7.2) 6 (4.0)
Based on teachers’ reports on the frequency of four types of interactions with other teachers: 1) Discussions about how to teach a particular concept; 2) Working on preparing instructional materials; 3) Visits to another teacher’s classroom to observe his/her teaching; 4) Informal observation of my classroom by another teacher. Frequency is computed by averaging across four items based on a 4-point scale: 1. Never or Almost Never; 2. 2 or 3 times per month; 3. 1–3 times per week; 4. Daily or almost daily.( ) Standard errors appear in parentheses. Because results are rounded to the nearest
whole number, some totals may appear inconsistent.
A tilde (~) indicates insufficient data to report achievement.An “r” indicates data are available for at least 70 but less than 85% of the students. An “s” indicates data are available for at least 50 but less than 70% of the students. A diamond (◊) indicates the country did not participate in the assessment.
h 2007 percent significantly higheri 2007 percent significantly lower
SOU
RCE:
IEA
’s Tr
ends
in In
tern
atio
nal M
athe
mat
ics
and
Scie
nce
Stud
y (T
IMSS
) 200
7
Exhibit 6.6 Frequency of Collaboration Among Science Teacherswith Trends
273chapter 6: teachers of science
Exhibit 6.6: Frequency of Collaboration Among Science Teacherswith Trends (Continued)
Country
Percentage of Students by Their Teachers' Frequency of Collaboration with Other Teachers
Never or Almost Never 2 or 3 Times per Month At Least Weekly
2007Percent
of Students
Average Achievement
Difference in Percent from 2003
2007Percent
of Students
Average Achievement
Difference in Percent from 2003
2007Percent
of Students
Average Achievement
Difference in Percent from 2003
Algeria 5 (1.4) 410 (6.2) ◊ ◊ 56 (3.3) 409 (2.2) ◊ ◊ 40 (3.3) 408 (2.6) ◊ ◊Armenia r 3 (0.9) 476 (20.1) –6 (2.1) i 31 (2.3) 490 (5.1) –25 (3.7) i 66 (2.1) 487 (6.9) 30 (3.5) h
Australia r 16 (2.6) 512 (9.0) 1 (4.0) 62 (2.5) 520 (4.6) –6 (4.2) 22 (2.4) 511 (6.0) 5 (3.5)Bahrain 5 (1.5) 438 (16.8) 3 (1.9) 70 (2.7) 466 (2.8) 14 (4.3) h 25 (2.2) 475 (4.8) –17 (3.9) i
Bosnia and Herzegovina 8 (1.1) 469 (5.5) ◊ ◊ 56 (2.5) 464 (3.3) ◊ ◊ 36 (2.6) 468 (4.0) ◊ ◊Botswana 8 (2.3) 359 (7.7) 2 (3.1) 52 (4.2) 357 (4.8) –1 (6.1) 40 (4.2) 351 (5.4) –1 (6.0)Bulgaria 17 (2.5) 480 (10.0) – – 66 (2.8) 464 (7.0) – – 17 (2.6) 469 (13.8) – –Chinese Taipei 36 (4.2) 549 (6.3) 10 (5.6) 53 (4.4) 563 (4.3) –13 (6.0) i 11 (2.7) 585 (9.8) 3 (3.4)Colombia 22 (4.1) 417 (6.1) ◊ ◊ 53 (4.4) 422 (4.8) ◊ ◊ 25 (3.8) 405 (8.7) ◊ ◊Cyprus r 9 (0.6) 456 (5.0) 1 (1.3) 67 (1.0) 451 (2.1) 12 (1.8) h 24 (0.8) 447 (2.9) –13 (1.3) i
Czech Republic 39 (3.0) 541 (3.3) ◊ ◊ 56 (2.8) 538 (2.7) ◊ ◊ 5 (1.1) 525 (5.3) ◊ ◊Egypt 1 (0.5) ~ ~ 0 (0.5) 37 (4.1) 409 (6.1) 6 (5.3) 62 (4.1) 406 (5.0) –6 (5.4)El Salvador 31 (4.1) 388 (6.5) ◊ ◊ 48 (4.7) 387 (5.1) ◊ ◊ 21 (3.2) 385 (7.0) ◊ ◊England s 15 (2.3) 558 (11.4) –2 (4.4) 60 (3.0) 541 (6.0) –6 (5.5) 25 (2.7) 537 (8.3) 8 (4.5)Georgia 2 (0.8) ~ ~ ◊ ◊ 49 (4.0) 420 (6.9) ◊ ◊ 48 (4.1) 422 (5.3) ◊ ◊Ghana 10 (2.5) 313 (23.4) –6 (4.0) 39 (4.1) 302 (7.6) 5 (6.1) 51 (4.1) 303 (8.2) 1 (6.3)Hong Kong SAR 19 (3.7) 525 (15.9) –7 (5.7) 68 (4.5) 531 (5.3) –1 (6.4) 13 (3.3) 537 (13.8) 7 (4.0)Hungary 14 (1.6) 530 (6.8) 4 (2.0) h 67 (2.5) 540 (3.0) –7 (3.3) i 19 (2.4) 540 (6.0) 3 (3.1)Indonesia 5 (1.8) 411 (6.5) 2 (2.2) 66 (4.1) 437 (5.1) 3 (5.2) 29 (3.7) 436 (8.0) –4 (4.9)Iran, Islamic Rep. of 12 (2.6) 454 (10.5) 2 (3.7) 77 (3.3) 460 (4.3) 1 (4.9) 10 (2.5) 461 (11.1) –3 (3.7)Israel 10 (2.0) 489 (13.0) –6 (2.9) 84 (2.4) 466 (5.6) 10 (3.8) h 6 (1.9) 476 (19.2) –4 (3.0)Italy 35 (3.1) 497 (4.1) 7 (4.5) 58 (3.3) 493 (4.1) –6 (4.8) 8 (1.7) 498 (6.9) –1 (2.7)Japan 42 (4.1) 550 (3.5) 3 (5.3) 49 (4.0) 559 (4.4) –4 (5.4) 9 (2.4) 546 (6.6) 1 (3.4)Jordan 6 (1.9) 458 (11.4) 4 (2.4) 50 (4.3) 482 (6.8) –16 (6.2) i 44 (4.4) 485 (5.9) 12 (6.1) h
Korea, Rep. of r 7 (2.0) 560 (7.5) –10 (3.7) i 80 (3.4) 552 (2.3) 8 (4.9) 13 (2.7) 555 (5.5) 3 (3.4)Kuwait r 2 (1.1) ~ ~ ◊ ◊ 26 (3.5) 418 (6.7) ◊ ◊ 72 (3.7) 415 (4.6) ◊ ◊Lebanon 14 (2.7) 400 (11.7) 1 (3.6) 60 (3.5) 417 (7.0) –2 (5.0) 26 (3.5) 416 (14.7) 1 (4.6)Lithuania 25 (2.1) 520 (3.1) 9 (2.7) h 65 (2.2) 517 (3.0) –7 (3.0) i 11 (1.3) 525 (6.6) –2 (2.1)Malaysia 3 (1.4) 518 (32.3) –4 (2.6) 66 (3.7) 470 (7.3) 1 (5.3) 31 (3.5) 469 (10.2) 2 (5.0)Malta 41 (0.2) 461 (1.7) ◊ ◊ 56 (0.3) 447 (1.8) ◊ ◊ 3 (0.2) 404 (7.2) ◊ ◊Norway 23 (3.0) 486 (6.0) 9 (4.4) 62 (3.6) 487 (2.5) –4 (5.3) 15 (2.9) 487 (4.4) –5 (4.5)Oman 5 (1.8) 407 (18.1) ◊ ◊ 51 (4.4) 417 (5.1) ◊ ◊ 44 (4.4) 431 (5.0) ◊ ◊Palestinian Nat'l Auth. 4 (1.8) 433 (16.4) 2 (2.2) 55 (4.3) 403 (5.8) –4 (5.9) 40 (4.2) 402 (6.5) 2 (5.8)Qatar 3 (0.1) 375 (5.7) ◊ ◊ 40 (0.2) 334 (2.1) ◊ ◊ 57 (0.2) 302 (2.2) ◊ ◊Romania 2 (0.7) ~ ~ –1 (1.3) 45 (3.1) 460 (5.0) 5 (4.0) 53 (3.1) 462 (4.6) –4 (4.0)Russian Federation 3 (0.6) 519 (10.9) –1 (1.0) 66 (2.2) 529 (4.1) 6 (3.2) 31 (2.3) 533 (5.3) –5 (3.3)Saudi Arabia 13 (3.3) 388 (9.1) – – 66 (4.4) 403 (3.4) – – 21 (3.8) 410 (6.4) – –Scotland s 15 (1.8) 490 (7.4) –5 (3.5) 59 (2.5) 501 (4.0) –3 (4.2) 26 (2.4) 487 (7.1) 8 (3.6) h
Serbia 13 (1.4) 474 (5.2) 2 (1.9) 69 (2.3) 468 (3.5) 7 (3.4) h 18 (1.9) 476 (4.4) –10 (3.0) i
Singapore 11 (1.4) 558 (8.9) –8 (2.4) i 75 (2.3) 565 (5.4) 6 (3.2) 14 (1.7) 585 (9.0) 2 (2.5)Slovenia 32 (3.0) 536 (3.5) –2 (3.8) 63 (3.0) 537 (2.4) 3 (4.0) 5 (1.4) 553 (7.3) –2 (1.9)Sweden 22 (2.7) 509 (4.4) 4 (3.6) 68 (2.8) 509 (3.2) 4 (4.1) 10 (1.5) 517 (5.1) –9 (3.1) i
Syrian Arab Republic 11 (2.1) 434 (7.8) ◊ ◊ 65 (3.3) 453 (3.5) ◊ ◊ 24 (3.0) 453 (6.2) ◊ ◊Thailand 4 (1.6) 439 (20.1) ◊ ◊ 50 (4.6) 475 (6.1) ◊ ◊ 45 (4.5) 469 (8.2) ◊ ◊Tunisia 8 (2.4) 445 (7.0) –11 (4.3) i 69 (4.1) 447 (2.8) 7 (6.3) 23 (3.9) 439 (4.1) 4 (5.2)Turkey 16 (3.5) 452 (11.8) ◊ ◊ 72 (4.3) 451 (4.7) ◊ ◊ 13 (2.8) 474 (13.4) ◊ ◊Ukraine 0 (0.3) ~ ~ ◊ ◊ 49 (2.7) 488 (4.4) ◊ ◊ 50 (2.8) 484 (4.1) ◊ ◊United States 22 (2.8) 522 (6.0) –3 (4.0) 58 (3.3) 520 (4.1) 1 (4.6) 20 (2.2) 507 (7.8) 2 (3.0)
¶ Morocco 23 (3.4) 394 (4.7) – – 59 (4.5) 404 (5.0) – – 18 (3.7) 422 (9.1) – –International Avg. 14 (0.3) 468 (1.7) 59 (0.5) 466 (0.7) 27 (0.4) 466 (1.1)
Benchmarking ParticipantsBasque Country, Spain 16 (3.8) 487 (8.1) –2 (5.8) 77 (4.3) 501 (3.3) 16 (6.8) h 7 (2.1) 494 (10.6) –14 (4.8) i
British Columbia, Canada r 28 (3.8) 524 (4.4) ◊ ◊ 58 (4.3) 527 (4.5) ◊ ◊ 14 (2.8) 521 (10.1) ◊ ◊Dubai, UAE s 1 (0.7) ~ ~ ◊ ◊ 74 (3.1) 492 (3.8) ◊ ◊ 25 (3.2) 474 (6.9) ◊ ◊Massachusetts, US 27 (7.2) 566 (11.6) ◊ ◊ 54 (8.4) 551 (7.0) ◊ ◊ 19 (5.3) 546 (24.2) ◊ ◊Minnesota, US 29 (5.1) 535 (4.4) ◊ ◊ 59 (4.9) 534 (6.4) ◊ ◊ 11 (3.5) 561 (10.6) ◊ ◊Ontario, Canada 23 (3.8) 520 (7.8) 0 (5.2) 64 (4.9) 527 (5.0) –1 (6.6) 13 (3.7) 536 (6.2) 1 (4.9)Quebec, Canada 13 (3.6) 516 (8.5) –16 (5.9) i 77 (4.0) 511 (4.6) 10 (6.2) 10 (3.1) 513 (15.4) 6 (3.5)
Based on teachers’ reports on the frequency of four types of interactions with other teachers: 1) Discussions about how to teach a particular concept; 2) Working on preparing instructional materials; 3) Visits to another teacher’s classroom to observe his/her teaching; 4) Informal observation of my classroom by another teacher. Frequency is computed by averaging across four items based on a 4-point scale: 1. Never or Almost Never; 2. 2 or 3 times per month; 3. 1–3 times per week; 4. Daily or almost daily.¶ Did not satisfy guidelines for sample participation rates (see Appendix A).
( ) Standard errors appear in parentheses. Because results are rounded to the nearest whole number, some totals may appear inconsistent.
A dash (–) indicates comparable data are not available. A tilde (~) indicates insufficient data to report achievement.An “r” indicates data are available for at least 70 but less than 85% of the students. An “s” indicates data are available for at least 50 but less than 70% of the students. A diamond (◊) indicates the country did not participate in the assessment.
h 2007 percent significantly higheri 2007 percent significantly lower
SOU
RCE:
IEA
’s Tr
ends
in In
tern
atio
nal M
athe
mat
ics
and
Scie
nce
Stud
y (T
IMSS
) 200
7
Exhibit 6.6 Frequency of Collaboration Among Science Teacherswith Trends (Continued)
274 chapter 6: teachers of science
How Well Prepared Do Teachers Feel They Are to Teach Science?
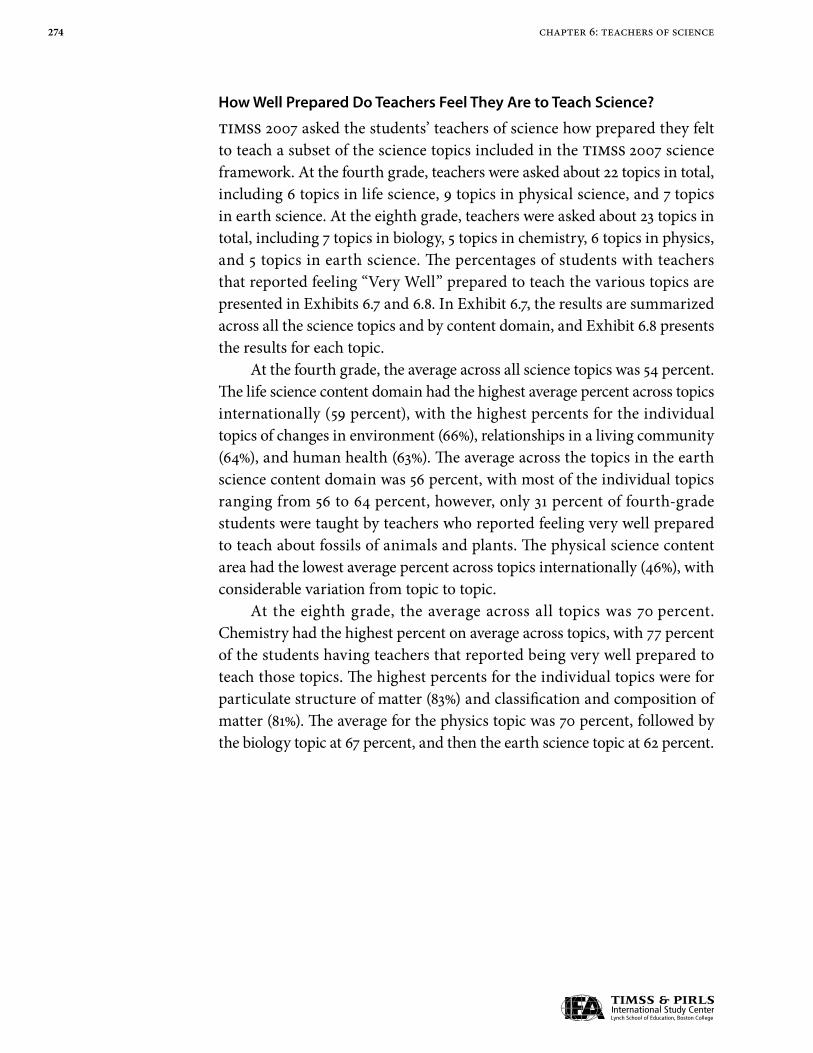
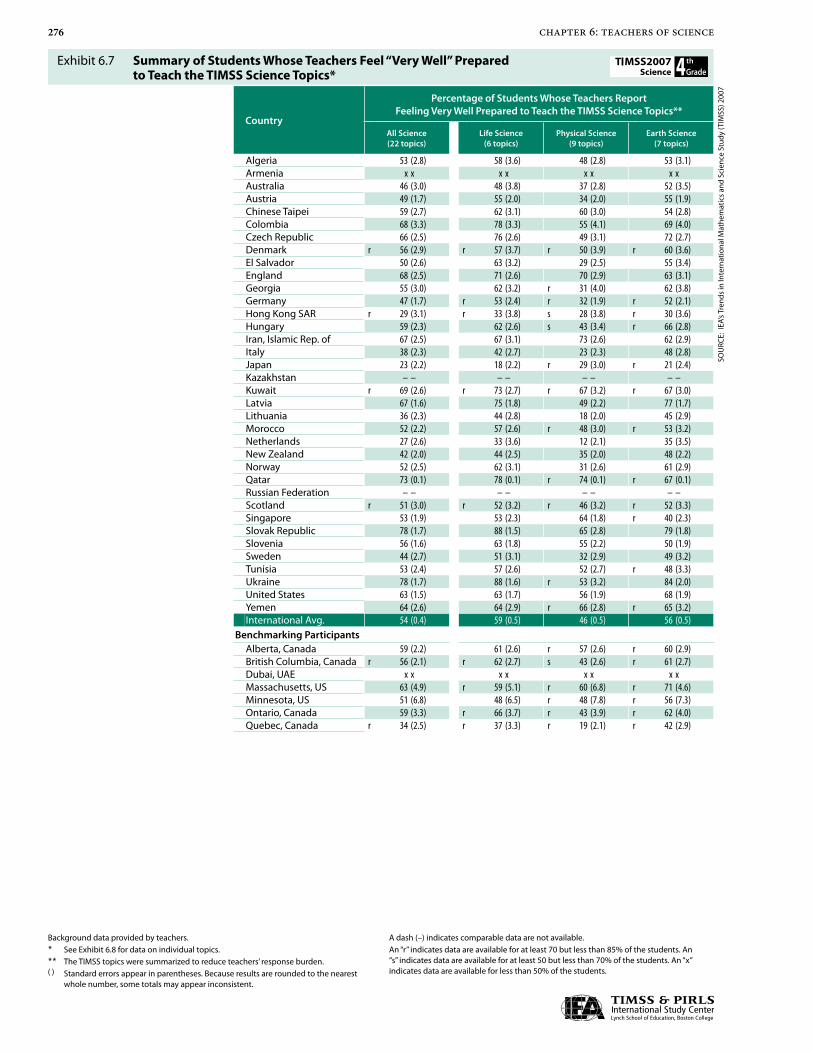
TIMSS 2007 asked the students’ teachers of science how prepared they felt to teach a subset of the science topics included in the TIMSS 2007 science framework. At the fourth grade, teachers were asked about 22 topics in total, including 6 topics in life science, 9 topics in physical science, and 7 topics in earth science. At the eighth grade, teachers were asked about 23 topics in total, including 7 topics in biology, 5 topics in chemistry, 6 topics in physics, and 5 topics in earth science. The percentages of students with teachers that reported feeling “Very Well” prepared to teach the various topics are presented in Exhibits 6.7 and 6.8. In Exhibit 6.7, the results are summarized across all the science topics and by content domain, and Exhibit 6.8 presents the results for each topic.
At the fourth grade, the average across all science topics was 54 percent. The life science content domain had the highest average percent across topics internationally (59 percent), with the highest percents for the individual topics of changes in environment (66%), relationships in a living community (64%), and human health (63%). The average across the topics in the earth science content domain was 56 percent, with most of the individual topics ranging from 56 to 64 percent, however, only 3� percent of fourth-grade students were taught by teachers who reported feeling very well prepared to teach about fossils of animals and plants. The physical science content area had the lowest average percent across topics internationally (46%), with considerable variation from topic to topic.
At the eighth grade, the average across all topics was 70 percent. Chemistry had the highest percent on average across topics, with 77 percent of the students having teachers that reported being very well prepared to teach those topics. The highest percents for the individual topics were for particulate structure of matter (83%) and classification and composition of matter (8�%). The average for the physics topic was 70 percent, followed by the biology topic at 67 percent, and then the earth science topic at 62 percent.

275chapter 6: teachers of science
The individual topics in physics were similar, with all between 65 and 76 percent. Within the biology topics, the highest percents were for cells and their functions (76%) and major organs and organ systems in humans and other organisms (75%). In earth science, 70 percent of eighth-grade students were taught by teachers who reported feeling very well prepared to teach about environmental concerns and 68 percent on the use and conservation of earth’s natural resources.
276 chapter 6: teachers of science
Exhibit 6.7: Summary of Students Whose Teachers Feel “Very Well” Prepared to Teach the TIMSS Science Topics*
Country
Percentage of Students Whose Teachers Report Feeling Very Well Prepared to Teach the TIMSS Science Topics**
All Science(22 topics)
Life Science(6 topics)
Physical Science(9 topics)
Earth Science(7 topics)
Algeria 53 (2.8) 58 (3.6) 48 (2.8) 53 (3.1)Armenia x x x x x x x xAustralia 46 (3.0) 48 (3.8) 37 (2.8) 52 (3.5)Austria 49 (1.7) 55 (2.0) 34 (2.0) 55 (1.9)Chinese Taipei 59 (2.7) 62 (3.1) 60 (3.0) 54 (2.8)Colombia 68 (3.3) 78 (3.3) 55 (4.1) 69 (4.0)Czech Republic 66 (2.5) 76 (2.6) 49 (3.1) 72 (2.7)Denmark r 56 (2.9) r 57 (3.7) r 50 (3.9) r 60 (3.6)El Salvador 50 (2.6) 63 (3.2) 29 (2.5) 55 (3.4)England 68 (2.5) 71 (2.6) 70 (2.9) 63 (3.1)Georgia 55 (3.0) 62 (3.2) r 31 (4.0) 62 (3.8)Germany 47 (1.7) r 53 (2.4) r 32 (1.9) r 52 (2.1)Hong Kong SAR r 29 (3.1) r 33 (3.8) s 28 (3.8) r 30 (3.6)Hungary 59 (2.3) 62 (2.6) s 43 (3.4) r 66 (2.8)Iran, Islamic Rep. of 67 (2.5) 67 (3.1) 73 (2.6) 62 (2.9)Italy 38 (2.3) 42 (2.7) 23 (2.3) 48 (2.8)Japan 23 (2.2) 18 (2.2) r 29 (3.0) r 21 (2.4)Kazakhstan – – – – – – – –Kuwait r 69 (2.6) r 73 (2.7) r 67 (3.2) r 67 (3.0)Latvia 67 (1.6) 75 (1.8) 49 (2.2) 77 (1.7)Lithuania 36 (2.3) 44 (2.8) 18 (2.0) 45 (2.9)Morocco 52 (2.2) 57 (2.6) r 48 (3.0) r 53 (3.2)Netherlands 27 (2.6) 33 (3.6) 12 (2.1) 35 (3.5)New Zealand 42 (2.0) 44 (2.5) 35 (2.0) 48 (2.2)Norway 52 (2.5) 62 (3.1) 31 (2.6) 61 (2.9)Qatar 73 (0.1) 78 (0.1) r 74 (0.1) r 67 (0.1)Russian Federation – – – – – – – –Scotland r 51 (3.0) r 52 (3.2) r 46 (3.2) r 52 (3.3)Singapore 53 (1.9) 53 (2.3) 64 (1.8) r 40 (2.3)Slovak Republic 78 (1.7) 88 (1.5) 65 (2.8) 79 (1.8)Slovenia 56 (1.6) 63 (1.8) 55 (2.2) 50 (1.9)Sweden 44 (2.7) 51 (3.1) 32 (2.9) 49 (3.2)Tunisia 53 (2.4) 57 (2.6) 52 (2.7) r 48 (3.3)Ukraine 78 (1.7) 88 (1.6) r 53 (3.2) 84 (2.0)United States 63 (1.5) 63 (1.7) 56 (1.9) 68 (1.9)Yemen 64 (2.6) 64 (2.9) r 66 (2.8) r 65 (3.2)International Avg. 54 (0.4) 59 (0.5) 46 (0.5) 56 (0.5)
Benchmarking ParticipantsAlberta, Canada 59 (2.2) 61 (2.6) r 57 (2.6) r 60 (2.9)British Columbia, Canada r 56 (2.1) r 62 (2.7) s 43 (2.6) r 61 (2.7)Dubai, UAE x x x x x x x xMassachusetts, US 63 (4.9) r 59 (5.1) r 60 (6.8) r 71 (4.6)Minnesota, US 51 (6.8) 48 (6.5) r 48 (7.8) r 56 (7.3)Ontario, Canada 59 (3.3) r 66 (3.7) r 43 (3.9) r 62 (4.0)Quebec, Canada r 34 (2.5) r 37 (3.3) r 19 (2.1) r 42 (2.9)
Background data provided by teachers.* See Exhibit 6.8 for data on individual topics.** The TIMSS topics were summarized to reduce teachers’ response burden.( ) Standard errors appear in parentheses. Because results are rounded to the nearest
whole number, some totals may appear inconsistent.
A dash (–) indicates comparable data are not available. An “r” indicates data are available for at least 70 but less than 85% of the students. An “s” indicates data are available for at least 50 but less than 70% of the students. An “x” indicates data are available for less than 50% of the students.
SOU
RCE:
IEA
’s Tr
ends
in In
tern
atio
nal M
athe
mat
ics
and
Scie
nce
Stud
y (T
IMSS
) 200
7
Exhibit 6.7 Summary of Students Whose Teachers Feel “Very Well” Prepared to Teach the TIMSS Science Topics*

277chapter 6: teachers of science
Exhibit 6.7: Summary of Students Whose Teachers Feel “Very Well” Prepared to Teach the TIMSS Science Topics*
Country
Percentage of Students Whose Teachers Report Feeling Very Well Prepared to Teach the TIMSS Science Topics**
All Science(23 topics)
Biology(7 topics)
Chemistry(5 topics)
Physics(6 topics)
Earth Science(5 topics)
Algeria 60 (2.1) 62 (3.0) r 60 (3.4) 73 (3.0) r 47 (4.2)Armenia 50 (1.9) 53 (3.3) 75 (3.8) 36 (3.0) 39 (3.6)Australia 73 (1.9) 76 (2.4) 79 (2.4) 69 (2.7) 70 (2.4)Bahrain 77 (1.3) 70 (1.5) 90 (1.6) 77 (2.0) 69 (1.9)Bosnia and Herzegovina 87 (1.2) 81 (2.1) 91 (1.6) 91 (1.8) 87 (2.4)Botswana 76 (1.6) 82 (1.9) 86 (1.7) 71 (2.7) 62 (2.7)Bulgaria 89 (1.0) 86 (1.8) 94 (1.5) 95 (1.5) 83 (2.6)Chinese Taipei 63 (2.2) 26 (3.6) 86 (2.8) 83 (3.0) 45 (3.9)Colombia 71 (1.8) 82 (2.3) 84 (2.7) 45 (3.1) 70 (2.6)Cyprus r 84 (0.7) – – r 92 (0.9) r 88 (1.4) r 72 (1.1)Czech Republic 85 (1.0) 78 (2.0) 95 (1.3) 93 (1.3) 76 (2.3)Egypt 73 (1.6) 62 (2.7) 85 (2.2) 78 (2.5) 68 (2.8)El Salvador 50 (2.9) 59 (3.0) 42 (3.5) 42 (3.5) 56 (3.4)England 79 (1.0) 81 (1.7) 84 (1.6) 76 (2.0) 71 (1.4)Georgia 86 (1.6) 82 (2.5) 87 (3.1) 89 (2.3) 86 (2.5)Ghana 80 (1.8) 80 (2.1) 87 (1.7) 82 (2.3) 70 (2.5)Hong Kong SAR 52 (2.8) 49 (4.0) 60 (4.0) 55 (3.9) r 33 (2.7)Hungary r 85 (1.4) r 72 (3.1) 93 (2.5) 92 (1.9) r 80 (2.4)Indonesia 80 (2.0) 78 (3.0) – – 80 (3.1) – –Iran, Islamic Rep. of 76 (1.9) 72 (2.4) 83 (2.3) 76 (2.3) 71 (2.2)Israel 68 (1.6) r 80 (1.9) r 87 (1.9) r 61 (2.6) r 39 (2.6)Italy 52 (2.0) 56 (2.5) 54 (2.6) 45 (2.6) 54 (2.6)Japan 41 (2.1) 29 (2.5) 60 (2.8) 47 (2.8) 30 (2.7)Jordan 70 (2.3) 67 (3.0) 76 (2.6) 74 (2.9) 64 (3.0)Korea, Rep. of 53 (2.2) 42 (2.5) 62 (3.1) 57 (2.8) 52 (2.9)Kuwait r 66 (2.1) r 65 (3.2) r 75 (2.8) r 67 (3.2) r 61 (3.5)Lebanon 85 (1.4) 77 (1.9) 95 (1.9) 83 (2.1) – –Lithuania r 59 (1.6) 49 (3.7) 70 (3.0) s 64 (4.0) r 52 (3.2)Malaysia 65 (2.3) 71 (2.7) 70 (3.0) 63 (3.3) r 45 (3.2)Malta 88 (0.1) 88 (0.3) 91 (0.2) 90 (0.2) 86 (0.2)Norway 64 (1.9) 72 (2.2) 55 (2.9) 58 (2.7) 69 (2.2)Oman 70 (1.7) 61 (2.8) 85 (1.9) 80 (2.8) 57 (2.7)Palestinian Nat’l Auth. 74 (1.9) 72 (2.6) 86 (2.0) 76 (2.7) 62 (3.1)Qatar 65 (0.1) 64 (0.1) 74 (0.1) r 65 (0.1) r 63 (0.1)Romania 85 (1.3) 76 (2.5) 92 (1.5) 91 (1.6) 79 (2.5)Russian Federation – – – – – – – – – –Saudi Arabia 58 (2.1) 68 (3.1) 56 (3.8) r 51 (3.6) r 57 (3.6)Scotland r 68 (1.2) r 63 (2.1) r 77 (1.8) r 71 (1.8) r 54 (2.1)Serbia 91 (1.3) 85 (2.1) 96 (1.0) 94 (1.5) 88 (2.2)Singapore 59 (1.5) 46 (2.1) 74 (1.8) 64 (2.1) r 18 (1.9)Slovenia 80 (1.4) 64 (2.5) 90 (2.1) 85 (1.7) – –Sweden 67 (1.6) 59 (2.5) 67 (2.7) 68 (2.8) 45 (3.9)Syrian Arab Republic 77 (1.7) 72 (2.7) 86 (2.5) 79 (2.4) 62 (3.6)Thailand 46 (2.2) 51 (2.7) 45 (3.1) 32 (2.7) 59 (3.0)Tunisia 49 (2.0) 66 (2.2) s 19 (3.7) s 14 (3.7) 59 (2.7)Turkey 71 (2.4) 70 (3.2) 79 (2.9) r 72 (2.6) 62 (3.2)Ukraine 94 (0.7) 91 (1.7) 96 (1.4) 95 (1.1) 92 (1.3)United States 72 (1.5) r 74 (1.8) r 73 (2.0) r 60 (2.3) 78 (2.0)
¶ Morocco r 69 (2.5) r 62 (4.0) r 82 (3.4) r 77 (3.2) r 57 (4.0)International Avg. 70 (0.3) 67 (0.4) 77 (0.4) 70 (0.4) 62 (0.4)
Benchmarking ParticipantsBasque Country, Spain 68 (2.5) 65 (3.4) 68 (3.1) 65 (3.5) 74 (3.1)British Columbia, Canada r 69 (2.3) r 68 (3.0) r 78 (2.8) r 65 (2.8) r 64 (3.3)Dubai, UAE s 79 (1.5) x x s 85 (2.0) s 80 (2.0) x xMassachusetts, US 66 (3.3) 67 (4.6) 67 (4.4) 52 (4.5) 76 (5.0)Minnesota, US 68 (4.2) 78 (5.6) 57 (6.3) 45 (4.4) 84 (5.2)Ontario, Canada 54 (2.6) 65 (3.7) 44 (3.2) 47 (2.8) 60 (3.5)Quebec, Canada 61 (2.3) 65 (3.6) 64 (4.0) 51 (4.2) 61 (3.5)
Background data provided by teachers.Does not include students whose teachers report that they do not teach the content domain.* See Exhibit 6.8 for data on individual topics.** The TIMSS topics were summarized to reduce teachers’ response burden.¶ Did not satisfy guidelines for sample participation rates (see Appendix A).
( ) Standard errors appear in parentheses. Because results are rounded to the nearest whole number, some totals may appear inconsistent.
A dash (–) indicates comparable data are not available. An “r” indicates data are available for at least 70 but less than 85% of the students. An “s” indicates data are available for at least 50 but less than 70% of the students. An “x” indicates data are available for less than 50% of the students.
SOU
RCE:
IEA
’s Tr
ends
in In
tern
atio
nal M
athe
mat
ics
and
Scie
nce
Stud
y (T
IMSS
) 200
7
Exhibit 6.7 Summary of Students Whose Teachers Feel “Very Well” Prepared to Teach the TIMSS Science Topics* (Continued)

278 chapter 6: teachers of science
Exhibit 6.8: Students Whose Teachers Feel “Very Well“ Prepared to Teach the TIMSS Science Topics
Country
Percentage of Students Whose Teachers Report Feeling Very Well Prepared to Teach the TIMSS Science Topics*
Life Science (6 topics) Physical Science (9 topics)
Major Body Structures and Their
Functions in Humans and
Other Organisms
Reproduction and
Development in Plants and
Animals
Physical Features,
Behavior, and Survival of
Organisms Living in Different
Environments
Relationships in a Living
Community
Changes in
Environments
HumanHealth
Classification of Objects /
Materials Based on Physical
Properties
Forming and
Separating Mixtures
States of Matter
andDifferences
in Their Physical
Properties, Including
Changes in State
of Matter by Heating and
Cooling
Familiar Changes
inMaterials
Algeria 62 (4.7) 57 (4.4) 42 (4.7) 70 (5.1) 66 (4.3) 53 (5.0) 45 (4.5) 33 (4.1) 73 (4.4) 47 (5.0)Armenia x x x x x x x x x x x x x x x x x x x xAustralia 41 (4.5) 42 (4.6) 40 (4.9) 55 (4.7) 61 (4.4) 49 (4.6) 38 (4.0) 19 (3.2) 44 (3.6) 40 (3.7)Austria 66 (3.0) 35 (2.7) 39 (3.1) 51 (3.2) 65 (2.9) 74 (2.9) 28 (3.2) 14 (2.5) 41 (3.2) 25 (3.0)Chinese Taipei 63 (3.9) 54 (4.1) 54 (4.1) 67 (3.7) 70 (3.7) 65 (3.9) 51 (4.2) 40 (4.1) 71 (3.8) 70 (3.5)Colombia 78 (4.9) 78 (4.6) 74 (5.0) 88 (3.6) 86 (3.8) 66 (4.2) 72 (4.6) 63 (5.4) 72 (4.9) 56 (5.0)Czech Republic 80 (3.4) 52 (4.4) 74 (3.3) 79 (3.2) 82 (2.9) 85 (3.2) 55 (4.5) 22 (4.0) 73 (3.7) 60 (4.1)Denmark r 55 (4.8) r 48 (5.4) r 47 (4.6) r 66 (5.2) r 59 (5.1) r 66 (4.4) r 48 (5.0) r 33 (4.7) r 50 (5.0) r 51 (4.6)El Salvador 57 (3.7) 58 (4.0) 55 (4.1) 67 (4.1) 72 (3.8) 71 (4.2) 35 (4.0) 19 (3.8) 50 (4.5) 32 (3.6)England 68 (3.2) 71 (3.5) 63 (3.4) 76 (3.3) 69 (3.8) 79 (3.3) 74 (3.8) 68 (3.9) 85 (3.2) 72 (3.7)Georgia 57 (5.1) 52 (5.2) 51 (5.3) 54 (4.9) 79 (4.1) 73 (4.3) 33 (5.4) 22 (5.4) 44 (5.1) 37 (5.2)Germany 45 (3.3) 44 (3.5) 44 (3.7) 54 (3.6) 60 (3.2) 67 (3.4) 23 (2.7) 17 (2.8) 50 (2.9) 24 (3.4)Hong Kong SAR 33 (4.7) 24 (4.8) 23 (4.3) 35 (5.3) 42 (4.9) 43 (4.3) 26 (4.4) 15 (3.8) 40 (5.0) 32 (4.0)Hungary 57 (3.3) 58 (3.6) 34 (3.1) 66 (3.7) 77 (3.1) 72 (3.5) 44 (3.5) 29 (4.1) 69 (3.4) 48 (3.8)Iran, Islamic Rep. of 71 (3.9) 62 (4.5) 57 (4.2) 68 (3.9) 77 (3.2) 68 (4.1) 61 (4.3) 80 (3.0) 87 (3.0) 68 (4.1)Italy 42 (3.2) 45 (3.2) 37 (3.3) 48 (2.9) 47 (3.3) 37 (3.4) 25 (3.5) 19 (2.8) 48 (3.0) 29 (3.5)Japan 17 (2.9) 23 (3.3) 14 (2.8) 19 (3.2) 21 (3.4) 17 (3.0) 29 (4.2) 10 (2.7) 47 (4.4) 15 (3.2)Kazakhstan – – – – – – – – – – – – – – – – – – – –Kuwait r 78 (3.8) r 74 (4.1) r 60 (4.3) r 87 (2.9) r 71 (4.4) r 70 (4.0) r 60 (5.2) r 47 (5.5) r 76 (4.1) r 61 (4.9)Latvia 81 (2.7) 60 (3.6) 66 (3.4) 85 (2.3) 82 (2.9) 74 (2.9) 51 (3.6) 28 (3.2) 75 (3.4) 48 (4.1)Lithuania 36 (3.5) 36 (3.3) 37 (3.2) 47 (3.2) 52 (3.3) 54 (4.0) 14 (2.5) 2 (1.0) 23 (3.0) 17 (2.6)Morocco 55 (4.4) 54 (4.0) 34 (4.2) 67 (4.0) 68 (4.3) 61 (4.5) 58 (4.2) 29 (4.3) 74 (3.6) 50 (4.6)Netherlands 28 (4.3) 28 (4.0) 25 (3.7) 36 (4.3) 39 (4.2) 42 (4.6) 9 (2.5) 5 (1.8) 18 (3.5) 8 (2.3)New Zealand 36 (2.9) 37 (2.9) 38 (2.9) 51 (3.1) 52 (3.2) 47 (2.7) 36 (2.5) 21 (2.3) 40 (2.6) 38 (2.6)Norway 60 (4.1) 56 (4.2) 48 (3.9) 69 (3.6) 66 (3.6) 76 (3.3) 21 (2.9) 11 (2.2) 41 (3.5) 38 (3.8)Qatar 85 (0.2) 82 (0.1) 69 (0.2) 86 (0.1) 73 (0.2) 75 (0.2) 67 (0.2) 53 (0.2) 85 (0.1) 70 (0.1)Russian Federation – – – – – – – – – – – – – – – – – – – –Scotland r 51 (3.7) r 46 (4.1) r 41 (4.0) r 55 (4.1) r 59 (4.4) r 58 (4.2) r 47 (3.9) r 38 (3.8) r 54 (4.0) r 46 (4.4)Singapore 50 (2.7) 54 (2.7) 49 (2.7) 59 (2.8) 62 (2.7) 43 (2.7) 74 (2.4) 44 (2.9) 83 (2.1) 59 (3.0)Slovak Republic 95 (1.4) 79 (2.8) 86 (2.7) 94 (1.7) 92 (2.0) 83 (2.4) 73 (3.6) 32 (4.8) 83 (2.9) 73 (3.8)Slovenia 76 (2.8) 36 (2.9) 36 (2.9) 62 (3.2) 83 (2.0) 84 (2.2) 53 (3.2) 50 (3.1) 68 (3.1) 50 (2.8)Sweden 51 (3.6) 41 (3.8) 40 (3.6) 65 (3.7) 48 (4.2) 59 (4.1) 25 (3.6) 22 (3.6) 43 (4.0) 37 (3.7)Tunisia 58 (3.4) 56 (3.7) 44 (3.4) 60 (3.1) 62 (3.6) 60 (3.6) 54 (3.5) 35 (4.3) 67 (3.1) 53 (3.8)Ukraine 89 (2.5) 86 (3.0) 82 (3.2) 93 (1.9) 93 (1.7) 88 (2.5) 45 (4.7) 35 (4.5) 71 (3.9) 79 (3.7)United States 55 (2.6) 54 (2.9) 69 (2.2) 77 (2.3) 73 (2.4) 52 (2.6) 62 (2.8) 37 (3.0) 71 (2.5) 53 (3.1)Yemen 67 (4.4) 61 (4.9) 49 (5.4) 66 (4.6) 64 (4.8) 72 (4.3) 65 (4.4) r 38 (5.3) 77 (4.5) 69 (4.5)International Avg. 59 (0.6) 53 (0.7) 49 (0.7) 64 (0.6) 66 (0.6) 63 (0.6) 45 (0.7) 31 (0.6) 60 (0.6) 47 (0.7)
Benchmarking ParticipantsAlberta, Canada 42 (3.9) 57 (4.2) 52 (4.6) 75 (2.9) 81 (3.0) 59 (4.1) 54 (4.3) 40 (4.2) 58 (4.0) 66 (3.7)British Columbia, Canada r 56 (4.4) r 41 (3.8) r 72 (3.8) r 79 (3.3) r 71 (4.0) r 50 (4.3) r 40 (4.9) r 20 (3.0) r 57 (4.1) r 36 (3.8)Dubai, UAE x x x x x x x x x x x x x x x x x x x xMassachusetts, US 48 (6.5) 53 (7.3) 68 (6.3) 70 (5.3) 69 (5.7) 47 (8.2) 59 (8.2) 40 (7.1) 65 (7.7) 54 (8.3)Minnesota, US 41 (7.2) 36 (9.1) 42 (9.1) 59 (8.7) 58 (7.9) 50 (6.9) 53 (8.6) 32 (9.2) 60 (8.5) 44 (9.2)Ontario, Canada 53 (5.2) 51 (4.8) 71 (4.7) 84 (3.5) 75 (4.0) 59 (5.4) 44 (4.6) 22 (4.1) 57 (5.1) 44 (4.8)Quebec, Canada 35 (4.4) r 30 (4.3) r 22 (3.2) r 41 (4.7) r 53 (4.8) r 45 (4.7) r 24 (3.5) r 16 (3.4) r 35 (4.3) r 16 (3.3)
Background data provided by teachers.* The TIMSS topics were summarized to reduce teachers’ response burden.( ) Standard errors appear in parentheses. Because results are rounded to the nearest
whole number, some totals may appear inconsistent.
A dash (–) indicates comparable data are not available. An “r” indicates data are available for at least 70 but less than 85% of the students. An “x” indicates data are available for less than 50% of the students.
SOU
RCE:
IEA
’s Tr
ends
in In
tern
atio
nal M
athe
mat
ics
and
Scie
nce
Stud
y (T
IMSS
) 200
7
Exhibit 6.8 Students Whose Teachers Feel “Very Well” Prepared to Teach the TIMSS Science Topics

279chapter 6: teachers of science
Exhibit 6.8: Students Whose Teachers Feel "Very Well" Prepared to Teach the TIMSS Science Topics (Continued)
Country
Percentage of Students Whose Teachers Report Feeling Very Well Prepared to Teach the TIMSS Science Topics*
Physical Science (9 topics) (Continued) Earth Science (7 topics)
Common Energy
Sources / Forms and
Their Practical
Uses
Light Electrical Circuits
Properties of
Magnets
Forces that
Cause Objects to Move
Features of the Earth’s
Landscape
Water on
EarthAir
Common Features
of the Earth’s
Landscapeand
Relationship to Human
Use
Weather Conditions from Day to Day or Over the Seasons
Fossils of Animals
and Plants
Earth’s Solar
System
Algeria 48 (4.9) 44 (5.0) 55 (5.3) 39 (5.1) 45 (5.1) 68 (4.5) 67 (4.5) 58 (4.1) 64 (4.8) 58 (4.8) 20 (3.5) 31 (4.5)Armenia x x x x x x x x x x x x x x x x x x x x x x x xAustralia 48 (3.6) 33 (4.1) 30 (4.4) 33 (4.0) 44 (4.4) 64 (4.0) 57 (4.6) 40 (4.5) 58 (4.5) 60 (4.0) 22 (3.1) 63 (4.5)Austria 46 (3.1) 37 (3.2) 30 (2.9) 53 (3.5) 27 (3.2) 67 (3.0) 79 (2.6) 51 (3.3) 45 (3.3) 69 (2.8) 23 (2.8) 51 (3.0)Chinese Taipei 75 (3.6) 56 (3.9) 51 (4.5) 64 (3.7) 63 (4.0) 61 (3.6) 59 (3.5) 60 (3.6) 60 (4.0) 58 (4.0) 29 (3.7) 49 (4.2)Colombia 55 (5.3) 55 (5.4) 30 (4.5) 40 (5.4) 52 (5.2) 80 (4.7) 75 (5.0) 76 (4.9) 70 (4.8) 71 (4.7) 36 (4.2) 80 (4.5)Czech Republic 64 (4.0) 43 (4.5) 29 (4.3) 53 (4.5) 36 (4.2) 79 (3.6) 86 (2.9) 81 (3.2) 76 (3.4) 74 (3.9) 32 (4.2) 70 (4.1)Denmark r 65 (4.6) r 41 (5.1) r 50 (5.1) r 61 (4.7) r 53 (5.0) r 67 (4.7) r 61 (4.6) r 60 (5.0) r 61 (5.3) r 67 (5.0) r 37 (4.8) r 66 (4.0)El Salvador 29 (3.3) 35 (3.8) 16 (3.4) 18 (3.6) 27 (3.7) 64 (4.1) 49 (4.6) 48 (4.4) 60 (4.2) 62 (4.0) 35 (4.2) 66 (4.4)England 67 (3.7) 69 (3.9) 60 (4.1) 65 (3.8) 68 (4.3) 67 (4.4) 70 (4.1) 60 (4.2) 63 (4.1) 72 (3.8) 34 (4.2) 79 (3.7)Georgia 38 (4.7) 38 (4.8) 13 (3.6) 27 (5.3) 24 (4.5) 73 (4.5) 73 (4.2) 68 (4.6) 66 (4.8) 59 (5.1) 29 (4.0) 60 (4.8)Germany 38 (3.3) 25 (3.2) 45 (3.2) 44 (3.2) 15 (2.9) 62 (3.2) 68 (2.7) 57 (3.5) 44 (3.2) 67 (3.1) 18 (3.3) 39 (3.9)Hong Kong SAR 31 (4.7) 32 (4.7) 21 (4.4) 24 (4.3) 26 (4.8) 38 (4.1) 28 (4.3) 44 (4.8) 31 (4.2) 34 (4.4) 11 (3.5) 26 (4.8)Hungary 45 (3.8) 38 (5.4) r 12 (4.3) 48 (4.3) 15 (4.3) 79 (3.0) 71 (4.1) 60 (4.5) 77 (3.6) 76 (3.4) 24 (4.4) 38 (4.5)Iran, Islamic Rep. of 70 (3.8) 73 (3.8) 68 (4.1) 83 (3.2) 69 (4.2) 76 (3.4) 61 (4.2) 56 (4.5) 69 (4.1) 60 (3.8) 40 (4.1) 71 (3.6)Italy 26 (2.9) 19 (2.8) 10 (2.0) 12 (2.3) 16 (2.5) 57 (3.2) 53 (3.2) 53 (3.0) 55 (3.0) 46 (3.3) 31 (3.8) 39 (3.3)Japan 21 (3.5) 29 (4.1) 46 (4.3) 49 (4.3) 19 (3.7) 16 (3.3) 21 (3.4) 23 (3.6) 13 (3.1) 31 (3.9) 19 (3.3) 22 (3.5)Kazakhstan – – – – – – – – – – – – – – – – – – – – – – – –Kuwait r 69 (4.4) r 74 (4.5) r 64 (4.6) r 77 (3.6) r 73 (3.9) r 67 (4.0) r 75 (3.9) r 74 (3.8) r 67 (4.4) r 66 (4.4) r 49 (4.9) r 69 (4.7)Latvia 73 (3.5) 70 (3.5) 16 (3.1) 49 (4.1) 28 (3.9) 90 (1.9) 86 (2.3) 79 (2.8) 83 (2.9) 80 (2.9) 36 (3.8) 79 (2.9)Lithuania 37 (3.6) 28 (3.2) 16 (2.7) 9 (2.1) 7 (1.7) 50 (3.9) 48 (3.6) 38 (3.4) 46 (3.3) 59 (3.5) 20 (2.9) 49 (3.6)Morocco 46 (4.5) 41 (4.0) 62 (4.1) 36 (4.1) 36 (5.1) 65 (4.7) 59 (4.2) 60 (4.3) 63 (4.5) 52 (4.4) 22 (3.6) 45 (5.2)Netherlands 24 (3.7) 12 (2.7) 8 (2.1) 15 (2.9) r 12 (3.1) 47 (4.6) 39 (4.9) 31 (4.4) 46 (4.6) 46 (4.6) 17 (3.3) 18 (3.2)New Zealand 44 (2.6) 37 (2.6) 34 (2.7) 31 (2.6) 33 (2.6) 54 (2.7) 53 (2.6) 37 (2.8) 49 (2.6) 54 (2.6) 32 (2.6) 57 (2.8)Norway 50 (3.7) 36 (3.7) 19 (2.9) 29 (3.4) 30 (3.1) 69 (3.7) 56 (3.8) 55 (3.7) 66 (3.8) 72 (2.7) 37 (3.4) 71 (3.1)Qatar 70 (0.2) 77 (0.1) 79 (0.2) 82 (0.1) 73 (0.2) 66 (0.2) 75 (0.2) 78 (0.1) 62 (0.2) 69 (0.1) 46 (0.2) 76 (0.1)Russian Federation – – – – – – – – – – – – – – – – – – – – – – – –Scotland r 54 (4.3) r 46 (4.5) r 47 (4.1) r 42 (4.2) r 41 (4.3) r 63 (4.0) r 55 (4.2) r 37 (4.2) r 57 (4.5) r 66 (4.0) r 22 (3.8) r 64 (3.7)Singapore 69 (2.6) 73 (2.2) 43 (2.7) 76 (2.2) 57 (2.7) 35 (3.1) 44 (2.5) 62 (2.5) 35 (3.1) 38 (2.8) 25 (2.8) 41 (2.8)Slovak Republic 79 (3.6) 62 (4.4) 52 (3.8) 64 (4.1) 65 (4.1) 84 (3.1) 83 (2.9) 87 (2.8) 86 (2.2) 77 (3.5) 38 (4.2) 89 (2.3)Slovenia 59 (3.3) 50 (3.2) 68 (3.0) 56 (3.2) 35 (3.1) 51 (2.9) 66 (2.5) 64 (2.9) 44 (3.0) 62 (3.0) 21 (2.7) 36 (2.8)Sweden 44 (3.9) 30 (3.6) 27 (3.8) 40 (3.5) 26 (3.7) 61 (3.8) 53 (4.0) 50 (3.8) 46 (4.0) 55 (4.1) 27 (3.5) 53 (4.5)Tunisia 62 (3.4) 49 (4.0) 51 (4.3) 41 (4.2) 62 (3.2) 54 (4.3) 49 (4.5) 65 (3.7) 56 (4.2) 52 (4.3) 28 (3.8) 36 (4.2)Ukraine 79 (3.6) 62 (4.3) 18 (4.3) 36 (4.8) 42 (4.8) 90 (2.4) 92 (2.2) 81 (3.2) 86 (2.5) 91 (2.4) 58 (4.4) 81 (3.2)United States 64 (2.8) 49 (2.6) 53 (2.9) 58 (2.7) 60 (2.9) 78 (2.2) 70 (2.2) 59 (3.2) 74 (2.3) 73 (2.5) 54 (2.9) 70 (2.4)Yemen 75 (3.9) 78 (4.2) 50 (5.2) 59 (5.0) 69 (4.8) 73 (4.3) 74 (4.5) 75 (4.5) 63 (5.3) 62 (4.7) 40 (5.6) 67 (4.5)International Avg. 53 (0.7) 47 (0.7) 39 (0.7) 46 (0.7) 41 (0.7) 64 (0.6) 62 (0.6) 58 (0.7) 59 (0.7) 62 (0.7) 31 (0.6) 56 (0.7)
Benchmarking ParticipantsAlberta, Canada 72 (3.5) 80 (3.3) 36 (4.7) 45 (4.4) 56 (4.0) 73 (4.0) 56 (4.4) 53 (4.1) 72 (3.6) 69 (3.8) 47 (3.9) 51 (4.4)British Columbia, Canada r 52 (3.9) r 60 (4.3) r 33 (4.6) r 40 (4.3) r 48 (4.9) r 74 (3.6) r 68 (3.5) r 58 (4.4) r 69 (3.8) r 75 (3.3) r 25 (3.5) r 58 (4.7)Dubai, UAE x x x x x x x x x x x x x x x x x x x x x x x xMassachusetts, US 66 (7.7) 56 (8.1) 66 (7.3) 64 (7.8) 64 (7.9) 84 (3.8) 74 (5.6) 60 (7.2) 76 (4.9) 71 (7.6) 48 (8.1) 71 (6.2)Minnesota, US 49 (9.0) 35 (9.0) 50 (7.1) 56 (8.6) 48 (8.7) 66 (7.8) 66 (7.3) 45 (9.1) 67 (7.5) 58 (8.4) 39 (9.8) 52 (8.3)Ontario, Canada 51 (4.8) 65 (4.9) 18 (4.1) 39 (5.6) 50 (5.0) 76 (4.1) 62 (4.7) 53 (4.8) 63 (5.3) 68 (4.9) 51 (4.7) 58 (5.4)Quebec, Canada r 27 (4.0) r 16 (3.4) r 8 (2.3) r 13 (2.9) r 14 (3.0) r 58 (4.2) r 33 (3.8) r 42 (4.1) r 52 (4.3) r 50 (4.4) r 18 (3.6) r 44 (4.1)
SOU
RCE:
IEA
’s Tr
ends
in In
tern
atio
nal M
athe
mat
ics
and
Scie
nce
Stud
y (T
IMSS
) 200
7
Exhibit 6.8 Students Whose Teachers Feel “Very Well” Prepared to Teach the TIMSS Science Topics (Continued)

280 chapter 6: teachers of science
Exhibit 6.8: Students Whose Teachers Feel "Very Well" Prepared to Teach the TIMSS Science Topics (Continued)
Country
Percentage of Students Whose Teachers Report Feeling Very Well Prepared to Teach the TIMSS Science Topics*
Biology (7 topics)
Major Organs and Organ Systems in
Humansand Other Organisms
Cells and Their Functions, Including
Respiration and Photosynthesis
as Cellular Processes
Reproduction and Heredity
Role of Variation and Adaptation
in Survival/Extinction
of Species in a Changing
Environment
Interaction with Living Organisms and the Physical Environment in the Ecosystem
Trends in Human
Population and its Effects on the
Environment
Impact of Natural
Hazards on Humans, Wildlife, and the
Environment
Algeria 70 (4.3) 71 (4.5) 52 (4.1) 52 (5.0) 68 (4.1) 53 (4.6) 65 (3.9)Armenia 53 (4.5) 50 (4.7) 56 (4.3) 55 (4.3) 50 (4.3) 49 (4.2) 57 (3.9)Australia 83 (2.5) 79 (3.2) 80 (2.5) 78 (2.9) 80 (3.0) 63 (3.7) 72 (3.7)Bahrain 75 (2.0) 82 (1.8) 72 (2.1) 67 (2.6) 72 (1.9) 56 (2.4) 67 (2.0)Bosnia and Herzegovina 93 (2.1) 94 (1.9) 87 (2.9) 68 (3.6) 90 (2.2) 67 (3.6) 68 (3.7)Botswana 90 (2.5) 97 (1.6) 74 (3.9) 66 (4.3) 91 (2.0) 69 (4.3) 80 (3.7)Bulgaria 96 (2.1) 97 (1.3) 90 (3.3) 85 (3.7) 97 (1.4) 56 (5.0) 77 (3.9)Chinese Taipei 20 (3.6) 24 (3.8) 22 (3.6) 24 (4.0) 25 (4.1) 28 (4.3) 31 (4.3)Colombia 92 (2.2) 94 (2.6) 85 (3.8) 74 (4.8) 90 (3.1) 60 (4.7) 81 (5.0)Cyprus – – – – – – – – – – – – – –Czech Republic 94 (1.9) 86 (2.6) 77 (3.7) 71 (3.6) 75 (3.4) 68 (3.9) 71 (3.9)Egypt 70 (4.0) 64 (4.0) 70 (3.7) 59 (4.2) 61 (4.2) 47 (4.1) 61 (4.1)El Salvador 55 (3.9) 59 (4.2) 62 (4.0) 52 (4.2) 53 (4.1) 61 (4.0) 70 (3.9)England 82 (2.1) 85 (1.6) 84 (2.1) 85 (2.0) 84 (2.0) 74 (2.3) 76 (2.3)Georgia 91 (2.6) 91 (2.8) 86 (3.3) 73 (4.4) 83 (3.0) 62 (5.7) 84 (4.1)Ghana 83 (2.9) 92 (2.2) 88 (2.7) 59 (4.5) 81 (3.5) 78 (3.9) 78 (3.9)Hong Kong SAR 46 (4.9) 54 (4.6) 49 (4.7) 47 (4.8) 54 (4.1) 45 (4.6) 44 (4.2)Hungary 91 (2.9) 78 (4.2) 76 (4.6) 73 (4.1) 79 (3.4) 52 (4.7) 66 (3.9)Indonesia 86 (3.1) 80 (3.6) 81 (3.3) 78 (3.8) 85 (3.4) 79 (3.9) 63 (5.4)Iran, Islamic Rep. of 83 (2.9) 71 (3.5) 88 (2.5) 66 (3.8) 67 (3.8) 66 (3.8) 67 (3.8)Israel r 84 (2.6) r 90 (1.9) 90 (1.9) r 75 (3.1) r 82 (2.9) r 69 (3.4) r 74 (2.9)Italy 63 (2.9) 69 (2.9) 70 (2.9) 54 (3.4) 53 (3.7) 31 (3.3) 51 (3.4)Japan 40 (3.6) 46 (3.8) 37 (4.1) 18 (3.2) 33 (3.6) 13 (2.9) 16 (3.1)Jordan 66 (4.3) 68 (4.2) 70 (4.0) 63 (4.3) 75 (3.4) 62 (4.1) 68 (4.1)Korea, Rep. of 41 (3.9) 63 (3.6) 50 (4.1) 32 (3.3) 40 (3.8) 29 (3.5) 35 (3.6)Kuwait r 75 (4.1) r 68 (4.8) r 54 (4.9) r 62 (5.2) r 67 (5.0) r 63 (4.8) r 64 (4.5)Lebanon 91 (2.0) 96 (1.2) 93 (1.7) 57 (5.1) 67 (4.0) 61 (4.1) 66 (4.2)Lithuania 59 (4.7) 59 (5.0) 54 (4.6) 36 (4.5) 53 (4.3) 42 (4.3) 38 (3.9)Malaysia 70 (4.0) 84 (3.1) 66 (3.9) 61 (3.8) 87 (2.9) 66 (3.8) 70 (3.9)Malta 96 (0.4) 100 (0.0) 96 (0.4) 75 (0.9) 91 (0.5) 80 (0.6) 77 (0.9)Norway 73 (3.4) 81 (3.2) 79 (3.0) 73 (3.4) 70 (3.4) 66 (3.3) 65 (3.1)Oman 68 (4.2) 71 (3.9) 62 (3.8) 51 (4.4) 62 (4.2) 53 (4.0) 56 (4.4)Palestinian Nat'l Auth. 78 (3.4) 87 (2.9) 76 (3.6) 59 (4.5) 67 (4.1) 63 (4.1) 72 (4.2)Qatar 79 (0.1) 76 (0.1) 65 (0.1) 50 (0.2) 64 (0.2) 54 (0.2) 60 (0.2)Romania 90 (2.5) 88 (2.9) 76 (3.5) 67 (3.9) 84 (3.1) 68 (4.0) 59 (4.5)Russian Federation – – – – – – – – – – – – – –Saudi Arabia 76 (3.8) 78 (4.0) 62 (4.5) 61 (4.3) 72 (4.0) 59 (4.2) 67 (4.1)Scotland r 66 (2.4) r 70 (2.2) r 66 (2.2) r 62 (2.5) r 68 (2.5) r 55 (2.8) r 58 (2.5)Serbia 98 (1.7) 94 (2.7) 88 (3.2) 78 (4.0) 92 (2.4) 73 (3.9) 74 (3.9)Singapore 50 (2.7) 58 (2.7) 52 (2.5) 39 (2.6) 50 (2.8) 30 (2.4) 40 (2.4)Slovenia 81 (3.4) 76 (3.4) 58 (4.2) 54 (3.9) 77 (3.2) 53 (4.1) 45 (4.0)Sweden 67 (2.4) 68 (2.5) 71 (2.6) 56 (3.1) 63 (2.8) 36 (3.1) 35 (3.1)Syrian Arab Republic 84 (3.8) 88 (2.9) 75 (4.3) 59 (5.5) 67 (4.2) 55 (5.0) 70 (5.1)Thailand 56 (4.1) 52 (4.2) 47 (4.0) 43 (4.2) 48 (4.2) 51 (3.9) 61 (3.9)Tunisia 85 (2.9) 91 (2.0) 85 (2.9) 51 (4.5) 57 (3.8) 40 (4.1) 53 (4.0)Turkey 74 (4.3) 78 (3.8) 79 (3.8) 64 (4.1) 63 (4.3) 65 (4.6) 61 (4.7)Ukraine 97 (1.5) 92 (2.4) 91 (2.6) 87 (3.1) 91 (2.5) 94 (2.0) 86 (3.0)United States r 73 (2.7) 78 (2.6) 75 (2.6) r 75 (2.9) 80 (2.4) r 68 (2.9) r 72 (2.8)
¶ Morocco r 74 (3.9) r 65 (5.9) r 69 (6.0) r 49 (5.1) r 69 (4.3) r 53 (6.6) r 60 (5.0)International Avg. 75 (0.5) 76 (0.5) 71 (0.5) 60 (0.6) 70 (0.5) 57 (0.6) 62 (0.6)
Benchmarking ParticipantsBasque Country, Spain 69 (4.4) 76 (4.4) 66 (4.3) 63 (4.2) 66 (3.8) 57 (4.6) 57 (4.3)British Columbia, Canada r 83 (3.4) r 79 (3.8) r 73 (4.3) r 68 (4.3) r 71 (4.2) r 48 (4.4) r 57 (4.4)Dubai, UAE s 62 (3.0) s 76 (2.2) s 62 (4.3) s 56 (3.9) s 74 (4.1) s 63 (2.8) s 60 (3.4)Massachusetts, US 57 (4.1) 72 (5.2) 66 (6.8) 69 (7.0) 77 (7.3) 61 (7.5) 69 (6.6)Minnesota, US 77 (6.8) 76 (5.8) 76 (8.0) 80 (7.5) 82 (6.4) 77 (6.6) 76 (6.3)Ontario, Canada 69 (4.3) 72 (4.6) 59 (5.3) 60 (5.0) 73 (4.3) 57 (4.9) 63 (5.1)Quebec, Canada 63 (5.1) 70 (4.9) 72 (4.5) 61 (5.0) 64 (5.0) 60 (5.0) 65 (5.2)
Background data provided by teachers.Does not include students whose teachers report that they do not teach the content domain.* The TIMSS topics were summarized to reduce teachers’ response burden.¶ Did not satisfy guidelines for sample participation rates (see Appendix A).
( ) Standard errors appear in parentheses. Because results are rounded to the nearest whole number, some totals may appear inconsistent.
A dash (–) indicates comparable data are not available. An “r” indicates data are available for at least 70 but less than 85% of the students. An “s” indicates data are available for at least 50 but less than 70% of the students.
SOU
RCE:
IEA
’s Tr
ends
in In
tern
atio
nal M
athe
mat
ics
and
Scie
nce
Stud
y (T
IMSS
) 200
7
Exhibit 6.8 Students Whose Teachers Feel “Very Well” Prepared to Teach the TIMSS Science Topics (Continued)

281chapter 6: teachers of science
Exhibit 6.8: Students Whose Teachers Feel "Very Well" Prepared to Teach the TIMSS Science Topics (Continued)
Country
Percentage of Students Whose Teachers Report Feeling Very Well Prepared to Teach the TIMSS Science Topics*
Chemistry (5 topics) Physics (6 topics)
Classification and
Composition of Matter
Particulate Structure of Matter
Solutions
Properties and Uses
ofCommon Acids and
Bases
Chemical Change
Physical States
andChanges
inMatter
Energy Forms, Transformations,
Heat, and Temperature
Basic Properties / Behaviors
of Light
Electric Circuits
Properties of
Permanent Magnets
andElectro-
magnets
Forces and
Motion
Algeria r 62 (5.1) 77 (4.1) r 72 (4.5) r 39 (4.5) r 46 (4.9) 68 (4.1) 77 (4.0) 58 (4.7) 79 (3.9) 82 (3.5) 72 (4.2)Armenia 77 (4.2) 76 (4.2) 75 (4.0) 72 (4.2) 74 (4.5) 33 (4.4) 32 (3.9) 33 (4.1) 37 (4.5) 49 (5.7) 37 (5.9)Australia 82 (2.8) 85 (2.4) 82 (2.9) 79 (2.8) 70 (3.2) 71 (3.2) 75 (3.2) 68 (3.0) 69 (3.2) 63 (3.4) 71 (3.2)Bahrain 94 (1.5) 95 (1.5) 90 (1.6) 87 (2.4) 83 (2.5) 68 (2.7) 79 (2.2) 78 (2.4) 67 (2.8) 89 (2.0) 78 (2.6)Bosnia and Herzegovina 95 (1.6) 96 (1.5) 82 (2.7) 90 (2.5) 93 (1.9) 89 (2.6) 91 (2.3) 91 (2.3) 92 (2.1) 90 (2.5) 93 (2.0)Botswana 93 (2.4) 85 (2.7) 90 (2.9) 93 (2.3) 72 (3.7) 67 (4.4) 79 (3.3) 82 (3.1) 80 (3.8) 59 (5.2) 52 (4.5)Bulgaria 98 (1.2) 99 (0.8) 87 (3.4) 96 (1.7) 91 (2.7) 94 (2.2) 97 (1.5) 96 (1.9) 92 (2.5) 95 (2.0) 95 (1.9)Chinese Taipei 85 (3.0) 88 (2.8) 86 (2.9) 86 (2.9) 83 (3.5) 84 (3.4) 84 (3.4) 82 (3.5) 81 (3.3) 85 (3.1) 83 (3.6)Colombia 93 (2.0) 95 (1.9) 77 (4.5) 74 (4.4) 79 (3.9) 66 (4.5) 71 (3.9) 33 (4.8) 19 (4.0) 32 (4.9) 42 (5.1)Cyprus r 90 (0.8) r 93 (0.8) r 90 (0.9) r 93 (0.9) r 90 (0.9) r 92 (1.6) r 91 (1.7) r 86 (1.7) r 87 (2.0) r 79 (2.2) r 94 (1.6)Czech Republic 95 (1.7) 97 (1.3) 95 (1.8) 93 (1.9) 91 (2.4) 97 (1.6) 94 (2.1) 90 (1.9) 92 (2.0) 92 (1.8) 94 (1.3)Egypt 86 (2.6) 93 (2.2) 86 (3.3) 80 (3.2) 82 (3.2) 76 (3.6) 83 (3.0) 86 (2.8) 83 (3.3) 71 (4.3) 68 (4.3)El Salvador 48 (4.6) 50 (4.5) 46 (4.2) 33 (4.1) 34 (4.2) 37 (4.3) 56 (4.5) 42 (4.5) 33 (4.3) 39 (4.3) 47 (4.7)England 87 (1.8) 86 (1.8) 86 (1.8) 83 (2.1) 78 (2.2) 83 (2.1) 81 (2.4) 75 (2.9) 74 (2.7) 73 (2.6) 73 (2.8)Georgia 91 (3.2) 93 (2.9) 82 (4.3) 91 (3.0) 80 (4.6) 94 (2.5) 89 (3.7) 90 (2.9) 90 (2.3) 83 (3.8) 92 (2.8)Ghana 92 (2.2) 88 (2.9) 95 (1.9) 81 (3.1) 77 (3.4) 80 (3.6) 94 (2.0) 82 (3.6) 80 (3.3) 79 (3.6) 78 (3.5)Hong Kong SAR 55 (4.8) 61 (4.7) 62 (4.4) 72 (4.3) 53 (4.7) 56 (4.4) 59 (4.4) 51 (4.5) 61 (4.7) 50 (4.6) 55 (4.4)Hungary 93 (2.7) 94 (2.5) 93 (2.7) 92 (2.7) 93 (2.6) 92 (2.6) 92 (2.4) 84 (3.0) 94 (2.1) 94 (2.1) 96 (1.6)Indonesia – – – – – – – – – – 84 (3.0) 87 (2.8) 82 (3.0) 76 (3.9) 84 (3.5) 83 (3.0)Iran, Islamic Rep. of 87 (2.8) 92 (2.2) 87 (2.9) 76 (3.5) 73 (3.7) 87 (2.9) 79 (3.5) 72 (4.1) 74 (3.2) 83 (3.2) 62 (3.7)Israel r 94 (1.8) r 95 (1.5) r 90 (2.3) r 77 (3.0) r 81 (3.1) r 91 (2.0) r 74 (4.0) r 38 (3.5) r 72 (3.7) r 46 (4.3) r 47 (3.7)Italy 61 (3.0) 68 (2.6) 59 (3.0) 42 (3.1) 41 (3.0) 59 (3.5) 53 (3.4) 33 (3.2) 36 (3.2) 35 (3.1) 55 (3.5)Japan 63 (3.6) 50 (3.7) 53 (3.7) 62 (3.2) 71 (3.3) 40 (3.7) 29 (3.8) 50 (3.8) 67 (3.5) 46 (4.0) 49 (3.9)Jordan 79 (3.4) 90 (2.6) 71 (4.0) 60 (4.2) 78 (3.5) 78 (3.5) 82 (3.1) 71 (3.6) 71 (3.8) 73 (3.8) 69 (3.9)Korea, Rep. of 68 (3.6) 58 (3.5) 69 (3.3) 55 (3.9) 57 (4.0) 61 (3.7) 58 (3.9) 39 (3.4) 74 (3.5) 46 (4.2) 65 (3.7)Kuwait r 83 (3.4) r 87 (3.5) r 72 (3.6) r 62 (4.4) r 65 (5.0) r 64 (4.3) r 78 (3.7) r 75 (4.1) r 55 (4.9) r 69 (4.4) r 60 (4.7)Lebanon 97 (1.7) 97 (1.5) 96 (1.7) 92 (3.5) 93 (3.3) 88 (2.8) 87 (3.8) 87 (3.3) 92 (2.3) 55 (4.8) 90 (2.9)Lithuania 73 (3.5) 80 (3.2) 65 (3.9) 63 (4.9) 63 (4.0) 70 (4.5) 65 (4.3) 55 (4.5) 68 (5.3) 52 (5.2) 72 (3.6)Malaysia 79 (3.8) 59 (4.4) 82 (3.6) 78 (3.7) 51 (4.6) 65 (4.4) 72 (4.2) 68 (4.2) 44 (4.4) 49 (4.6) 70 (4.2)Malta 95 (0.1) 100 (0.0) 90 (0.4) 91 (0.3) 80 (0.5) 88 (0.3) 94 (0.2) 94 (0.2) 83 (0.3) 81 (0.3) 95 (0.1)Norway 61 (3.2) 75 (3.4) 42 (3.8) 64 (3.5) 35 (3.4) 62 (3.6) 67 (3.6) 60 (3.6) 58 (3.8) 43 (3.6) 61 (3.5)Oman 93 (2.0) 93 (1.7) 76 (3.4) 83 (2.9) 78 (3.2) 88 (3.0) 90 (2.7) 75 (4.3) 78 (4.0) 73 (3.9) 74 (4.2)Palestinian Nat'l Auth. 96 (1.8) 96 (1.5) 84 (3.2) 80 (3.4) 76 (3.5) 78 (3.8) 89 (2.8) 88 (3.0) 74 (3.9) 67 (4.0) 60 (4.6)Qatar 84 (0.1) 86 (0.1) 69 (0.1) 67 (0.1) 67 (0.1) 72 (0.1) 73 (0.1) 61 (0.2) 59 (0.2) 64 (0.1) 63 (0.2)Romania 95 (1.9) 97 (1.6) 92 (2.4) 93 (2.0) 85 (3.1) 88 (3.0) 94 (1.5) 89 (2.3) 94 (1.9) 91 (2.2) 92 (2.1)Russian Federation – – – – – – – – – – – – – – – – – – – – – –Saudi Arabia 64 (4.6) 64 (4.4) 53 (4.7) 31 (4.4) 60 (4.7) 56 (4.8) 65 (4.6) 58 (4.9) 32 (4.6) 42 (4.8) 42 (4.9)Scotland r 81 (1.9) r 83 (1.8) r 80 (1.9) r 72 (2.4) r 68 (2.6) r 77 (2.0) r 81 (2.0) r 69 (2.3) r 78 (2.2) r 60 (2.5) r 64 (2.5)Serbia 99 (0.6) 98 (1.1) 93 (2.3) 95 (1.7) 94 (2.3) 90 (2.9) 95 (1.7) 92 (2.4) 96 (1.5) 92 (2.5) 98 (1.1)Singapore 78 (2.2) 80 (2.1) 76 (2.2) 75 (2.1) 63 (2.4) 69 (2.7) 65 (2.5) 64 (2.4) 66 (2.3) 56 (2.5) 62 (2.5)Slovenia 91 (2.5) 93 (2.3) 92 (2.3) 87 (3.0) 86 (3.1) 83 (2.8) 93 (2.0) 76 (3.6) 89 (2.4) 71 (3.3) 97 (1.3)Sweden 67 (2.6) 81 (2.1) 63 (2.8) 66 (2.4) 50 (2.9) 58 (2.9) 68 (2.8) 60 (2.9) 62 (3.0) 55 (2.9) 64 (2.9)Syrian Arab Republic 88 (3.4) 91 (2.6) 84 (3.5) 83 (3.8) 84 (3.0) 80 (3.7) 87 (2.9) 75 (3.6) 81 (3.2) 78 (3.5) 74 (3.7)Thailand 50 (4.3) 48 (4.0) 44 (4.3) 55 (3.9) 26 (4.0) 24 (2.9) 43 (4.0) 29 (3.7) 31 (4.2) 34 (4.2) 34 (4.3)Tunisia r 26 (5.1) r 14 (4.3) r 19 (4.5) r 14 (4.3) r 18 (4.6) r 11 (3.9) r 15 (4.0) r 14 (4.1) s 12 (4.6) s 10 (4.6) r 13 (3.9)Turkey 85 (3.4) 87 (3.1) 65 (4.1) 81 (3.7) 75 (3.8) 81 (3.5) 67 (4.4) 49 (5.1) 77 (3.7) 70 (4.3) 82 (3.3)Ukraine 97 (1.4) 98 (1.2) 96 (1.6) 96 (1.6) 94 (2.1) 97 (0.9) 95 (1.0) 91 (2.2) 97 (1.5) 92 (2.4) 96 (1.7)United States 85 (2.0) 89 (1.8) 67 (3.0) 61 (2.8) 67 (2.9) 72 (3.2) r 69 (2.8) 57 (3.3) 43 (3.1) 46 (3.2) 73 (2.8)
¶ Morocco r 77 (4.8) r 86 (3.7) r 87 (3.4) r 82 (3.5) r 76 (5.5) r 71 (5.4) r 86 (2.5) r 66 (5.4) r 82 (3.2) r 75 (4.5) r 79 (4.8)International Avg. 81 (0.4) 83 (0.4) 76 (0.5) 74 (0.5) 71 (0.5) 72 (0.5) 76 (0.5) 68 (0.5) 69 (0.5) 65 (0.5) 70 (0.5)
Benchmarking ParticipantsBasque Country, Spain 76 (4.1) 82 (3.4) 78 (3.7) 45 (4.6) 60 (4.5) 65 (4.5) 81 (3.4) 69 (4.9) 56 (4.9) 39 (5.2) 76 (4.1)British Columbia, Canada r 85 (2.9) r 83 (3.2) r 79 (3.4) r 68 (4.0) r 71 (3.7) r 86 (2.9) r 81 (3.7) r 68 (4.5) r 44 (3.8) r 43 (4.4) r 64 (4.2)Dubai, UAE s 94 (2.1) s 94 (1.8) s 82 (3.1) s 80 (2.5) s 78 (3.1) s 85 (2.1) s 74 (2.2) s 76 (2.9) s 84 (3.0) s 67 (2.9) s 84 (2.1)Massachusetts, US 83 (5.2) 81 (5.2) 68 (5.9) 51 (7.1) 53 (6.2) 75 (6.3) 79 (5.6) 25 (6.1) 28 (6.0) 28 (7.1) 79 (5.8)Minnesota, US 70 (6.2) 72 (7.3) 46 (7.6) 47 (7.2) 48 (7.8) 60 (7.3) 63 (8.4) 39 (7.5) 33 (6.2) 26 (6.8) 51 (6.3)Ontario, Canada 47 (3.7) 48 (4.3) 57 (4.1) 34 (3.8) 35 (4.2) 58 (4.1) 65 (4.3) 55 (4.6) 22 (4.0) 23 (3.8) 55 (3.4)Quebec, Canada 66 (5.0) 69 (4.5) 79 (4.1) 55 (5.3) 50 (5.6) 70 (5.0) 68 (5.3) 35 (5.1) 49 (5.2) 42 (5.3) 48 (5.6)
SOU
RCE:
IEA
’s Tr
ends
in In
tern
atio
nal M
athe
mat
ics
and
Scie
nce
Stud
y (T
IMSS
) 200
7
Exhibit 6.8 Students Whose Teachers Feel “Very Well” Prepared to Teach the TIMSS Science Topics (Continued)

282 chapter 6: teachers of science
Exhibit 6.8: Students Whose Teachers Feel "Very Well" Prepared to Teach the TIMSS Science Topics (Continued)
Country
Percentage of Students Whose Teachers Report Feeling Very Well Prepared to Teach the TIMSS Science Topics*
Earth Science (5 topics)
Earth's Structure and
Physical Features
Earth's Processes, Cycles, and
History
Environmental Concerns
Use and Conservation
of Earth's Natural
Resources
Earth in the Solar System and the
Universe
Algeria 48 (4.9) r 45 (5.2) r 46 (4.8) r 53 (5.5) r 34 (4.9)Armenia 41 (4.6) 36 (4.3) 40 (4.6) 34 (4.3) 44 (4.6)Australia 64 (2.9) 67 (3.3) 78 (3.1) 70 (2.9) 68 (2.9)Bahrain 60 (2.5) 58 (2.9) 72 (2.1) 73 (2.5) 79 (2.3)Bosnia and Herzegovina 89 (2.8) 91 (2.7) 84 (2.8) 81 (3.5) 91 (2.7)Botswana 29 (5.0) 52 (4.7) 83 (3.3) 86 (3.1) 50 (5.0)Bulgaria 86 (3.5) 76 (4.2) 83 (3.2) 80 (3.5) 87 (2.7)Chinese Taipei 39 (4.2) 39 (4.2) 57 (4.7) 52 (4.5) 36 (4.4)Colombia 57 (5.0) 59 (4.5) 90 (2.5) 88 (3.0) 57 (4.8)Cyprus r 72 (1.4) r 58 (2.0) r 85 (1.0) r 78 (1.3) r 62 (1.8)Czech Republic 81 (3.1) 56 (4.0) 81 (3.3) 77 (3.6) 83 (2.9)Egypt 57 (3.7) 56 (4.3) 70 (4.1) 82 (3.1) 77 (3.3)El Salvador 48 (4.2) 44 (4.0) 70 (4.2) 69 (4.2) 50 (4.3)England 57 (2.7) 63 (2.5) 88 (1.5) 80 (1.8) 70 (2.5)Georgia 87 (3.4) 81 (4.4) 89 (3.0) 91 (3.3) 75 (4.6)Ghana 57 (4.8) 46 (4.5) 80 (3.2) 79 (4.0) 84 (2.8)Hong Kong SAR 15 (3.8) 19 (3.5) 58 (4.1) 49 (4.6) 25 (4.7)Hungary 91 (2.7) 88 (2.8) 75 (3.5) 77 (3.7) 67 (5.1)Indonesia – – – – – – – – – –Iran, Islamic Rep. of 74 (3.3) 62 (3.7) 79 (3.4) 81 (3.3) 60 (3.8)Israel r 27 (3.6) r 22 (3.0) r 60 (4.1) r 55 (4.2) r 29 (3.4)Italy 56 (3.2) 42 (3.1) 61 (3.2) 57 (3.4) 56 (3.1)Japan 22 (3.6) 28 (3.6) 34 (4.2) 20 (3.5) 44 (4.3)Jordan 51 (4.0) 60 (4.3) 77 (3.3) 75 (3.6) 58 (4.2)Korea, Rep. of 66 (3.5) 52 (4.4) 56 (3.8) 33 (3.4) 50 (4.3)Kuwait r 54 (4.8) r 53 (4.8) r 49 (4.6) r 68 (4.2) r 68 (4.5)Lebanon – – – – – – – – – –Lithuania 60 (4.0) 32 (3.8) 60 (3.8) 67 (3.5) 43 (4.9)Malaysia 28 (4.5) 28 (4.5) 70 (4.0) 71 (3.6) 38 (4.4)Malta 98 (0.3) 84 (0.3) 100 (0.0) 99 (0.1) 52 (0.4)Norway 57 (3.9) 57 (3.3) 82 (2.4) 78 (3.0) 69 (3.3)Oman 33 (4.0) 41 (4.1) 69 (3.8) 67 (4.0) 72 (3.6)Palestinian Nat'l Auth. 49 (4.6) 54 (4.5) 65 (4.2) 72 (4.1) 68 (4.3)Qatar 46 (0.2) 53 (0.2) 68 (0.2) 71 (0.1) 67 (0.2)Romania 82 (2.7) 72 (3.4) 79 (3.9) 76 (3.4) 88 (2.6)Russian Federation – – – – – – – – – –Saudi Arabia 55 (4.4) 41 (4.5) 54 (4.8) 54 (4.7) 67 (4.2)Scotland r 32 (3.0) r 42 (2.9) r 75 (2.1) r 71 (2.6) r 49 (2.5)Serbia 94 (2.7) 90 (2.9) 77 (4.0) 84 (3.4) 93 (2.5)Singapore 7 (2.2) 5 (1.7) 43 (3.1) 29 (3.0) 15 (2.5)Slovenia – – – – – – – – – –Sweden r 20 (2.9) r 30 (3.2) r 65 (2.8) r 45 (3.1) r 53 (3.0)Syrian Arab Republic 62 (4.5) 61 (5.2) 69 (4.7) 67 (5.0) 52 (5.6)Thailand 62 (3.8) 63 (4.1) 62 (3.7) 61 (4.0) 41 (4.5)Tunisia 74 (3.8) 73 (3.5) 51 (3.9) 59 (3.9) 34 (3.9)Turkey 38 (5.0) 48 (5.0) 76 (4.5) 73 (4.2) 64 (4.7)Ukraine 94 (1.6) 91 (2.4) 94 (1.9) 95 (1.7) 87 (3.0)United States 83 (2.4) 80 (2.4) 75 (2.6) 78 (2.6) 75 (3.1)
¶ Morocco r 82 (3.3) r 54 (6.0) r 56 (5.7) r 54 (4.4) r 42 (6.7)International Avg. 57 (0.5) 55 (0.6) 70 (0.5) 68 (0.5) 59 (0.6)
Benchmarking ParticipantsBasque Country, Spain 75 (4.1) 60 (4.2) 81 (3.4) 76 (3.5) 78 (3.8)British Columbia, Canada r 67 (3.6) r 66 (4.5) r 66 (4.3) r 61 (4.4) r 59 (4.1)Dubai, UAE s 44 (3.5) s 59 (4.3) s 75 (4.5) s 83 (2.3) s 58 (4.2)Massachusetts, US 80 (4.9) 76 (6.4) 75 (6.2) 71 (6.4) 81 (5.4)Minnesota, US 86 (5.4) 84 (5.8) 82 (6.2) 84 (5.5) 84 (5.9)Ontario, Canada 59 (4.7) 58 (4.8) 67 (4.2) 65 (3.9) 49 (4.5)Quebec, Canada 52 (5.1) 47 (4.8) 80 (4.2) 66 (5.5) 61 (5.0)
SOU
RCE:
IEA
’s Tr
ends
in In
tern
atio
nal M
athe
mat
ics
and
Scie
nce
Stud
y (T
IMSS
) 200
7
Exhibit 6.8 Students Whose Teachers Feel “Very Well” Prepared to Teach the TIMSS Science Topics (Continued)