Embed Size (px)
Citation preview
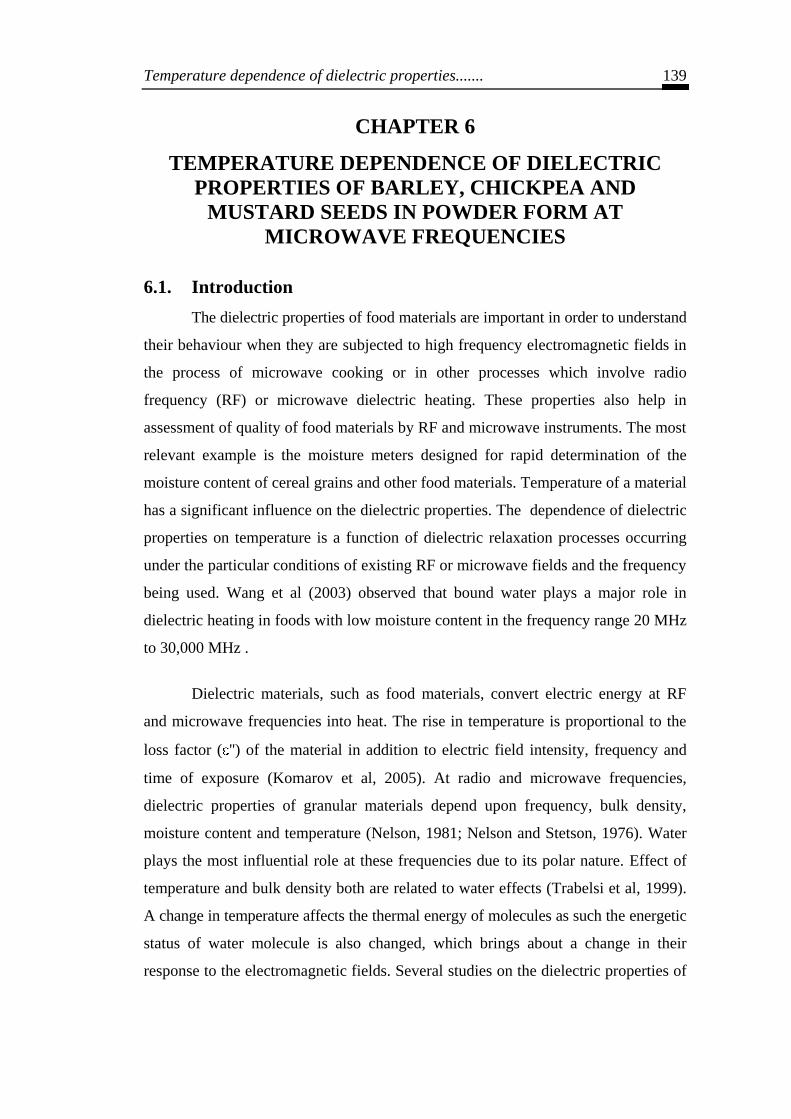
Temperature dependence of dielectric properties....... 139
CHAPTER 6
TEMPERATURE DEPENDENCE OF DIELECTRIC
PROPERTIES OF BARLEY, CHICKPEA AND
MUSTARD SEEDS IN POWDER FORM AT
MICROWAVE FREQUENCIES
6.1. Introduction
The dielectric properties of food materials are important in order to understand
their behaviour when they are subjected to high frequency electromagnetic fields in
the process of microwave cooking or in other processes which involve radio
frequency (RF) or microwave dielectric heating. These properties also help in
assessment of quality of food materials by RF and microwave instruments. The most
relevant example is the moisture meters designed for rapid determination of the
moisture content of cereal grains and other food materials. Temperature of a material
has a significant influence on the dielectric properties. The dependence of dielectric
properties on temperature is a function of dielectric relaxation processes occurring
under the particular conditions of existing RF or microwave fields and the frequency
being used. Wang et al (2003) observed that bound water plays a major role in
dielectric heating in foods with low moisture content in the frequency range 20 MHz
to 30,000 MHz .
Dielectric materials, such as food materials, convert electric energy at RF
and microwave frequencies into heat. The rise in temperature is proportional to the
loss factor ( '') of the material in addition to electric field intensity, frequency and
time of exposure (Komarov et al, 2005). At radio and microwave frequencies,
dielectric properties of granular materials depend upon frequency, bulk density,
moisture content and temperature (Nelson, 1981; Nelson and Stetson, 1976). Water
plays the most influential role at these frequencies due to its polar nature. Effect of
temperature and bulk density both are related to water effects (Trabelsi et al, 1999).
A change in temperature affects the thermal energy of molecules as such the energetic
status of water molecule is also changed, which brings about a change in their
response to the electromagnetic fields. Several studies on the dielectric properties of
Temperature dependence of dielectric properties....... 140
agricultural products have been reported in the past, covering a wide range of
frequency, temperature and moisture contents. (Nelson, 1965; Jiao et al., 2011;
Ohlsson et al., 1974).
Dielectric constant ( '), dielectric loss ( '') and conductivity of some oil seeds
were measured over the range of temperature 15°-45°C within the frequency range 5
kHz to 10 MHz by Singh et al. (2006). Nelson (1978) studied the variation of
dielectric constant of shelled corn with temperature for three different frequencies
and two different moisture contents. Dependence of the dielectric properties of
ground wheat having 11.2% moisture content on frequency and temperature in the
frequency range (10 MHz to 1.8 GHz) and temperature range (25°C to 95°C) was
observed by Nelson and Trabelsi (2006). Trabelsi and Nelson (2006) investigated the
dielectric properties of wheat, corn, and soybeans by measuring the scattering
transmission coefficient S21 in free space at frequencies ranging between 2 and 3
GHz. They studied the variations in the dielectric properties of above mentioned
samples with frequency and physical properties such as bulk density, moisture
content, and temperature. Both dielectric constant (ε') and the loss factor (ε'') were
found to decrease with frequency and increased linearly with bulk density, moisture
content, and temperature. The relative complex permittivity(ε*), consisting of the
dielectric constant and loss factor, were measured for samples cut from three fresh
fruits, viz. Apple, avocado and banana, over the frequency range from 10 MHz to
1.8 GHz at temperatures ranging from 5°C to 95°C by Nelson (2003). Measurements
of the dielectric properties of unshelled and shelled peanuts at 6 GHz were made by
Trabelsi et al (2009) for the temperature range from 0°C to 60°C.
From the literature survey it is apparent that temperature dependence of the
dielectric properties of food grains like mustard seeds, barley and chickpea have not
been reported at microwave frequencies particularly in the range 3 GHz -10 MHZ.
As this is the frequency range in which dispersion effects are maximum both for ε'
and ε'', it was considered relevant to study the temperature dependence of the
dielectric properties of these samples at some of the frequencies in this range.
Temperature dependence of dielectric properties....... 141
6.2 Material and Method
Chickpea (RSG 888) and Barley grains (RD2508) were obtained from
Durgapura Agriculture Research Station of Rajasthan Agriculture University, Bikaner.
The samples of mustard seeds (MAYA) were obtained from the National Mustard
Research Centre, Sewar, Bharatpur. The grains were grinded to bring them in
powder form. The method used in the present work is a method proposed by Yadav
and Gandhi (1992) described in detail in Chapter 3. This method has been employed
because it is simple and can be used by attaching a slotted section and liquid
dielectric cell in the microwave bench. The dielectric cell has a Jacket to circulate
hot / cold water around the sample so as to keep it at different temperatures. In the
present work, the temperature of the sample powder filled in dielectric cell was
varied by circulating hot water around it. The measurements were performed at
different temperatures by using a constant temperature water bath fitted with a
digital temperature controller having temperature stability of the order of ± 0.1˚C.
6.2.1. Experimental Details
The method used for the study of temperature variation of dielectric properties
of food grains in powder form is the method proposed by Yadav and Gandhi (1992).
The experiment was carried out at three frequencies viz., 4.65 GHz,7.01 GHz and
9.42 GHz on C band, J band and X band microwave benches respectively.
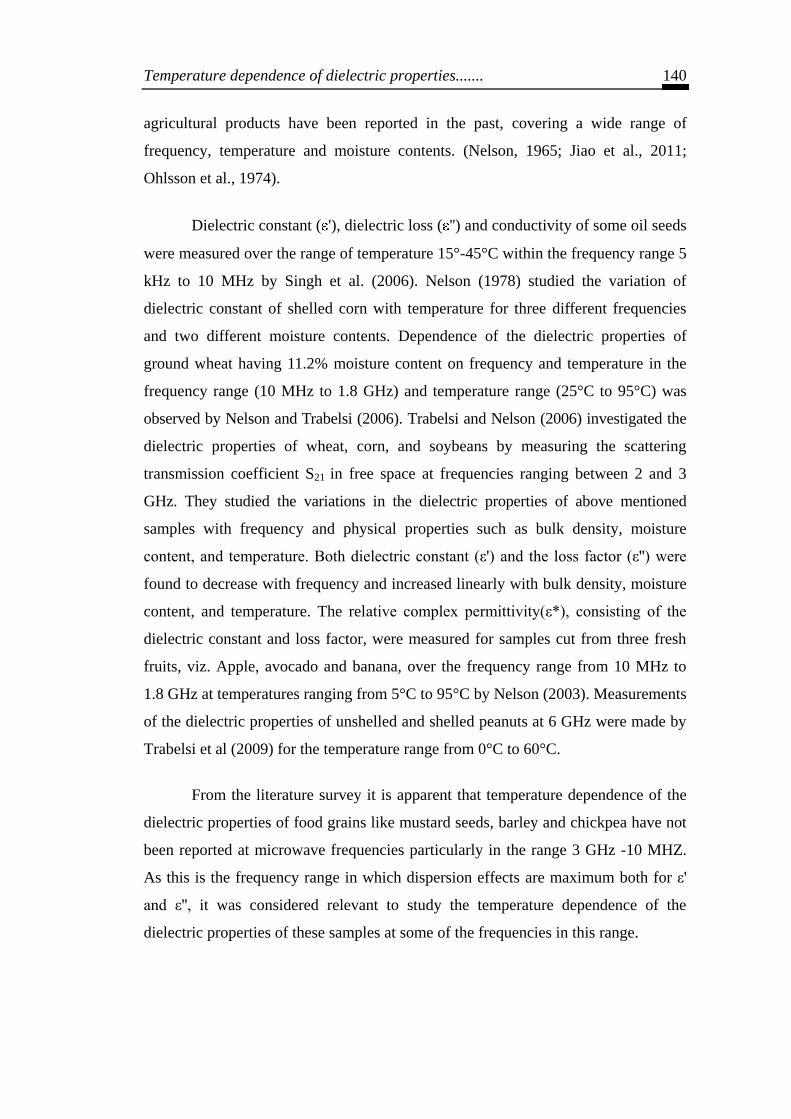
The experimental arrangement is shown in Fig. 6.1. Microwave power was
obtained from a microwave source, viz. Klystron tube and was allowed to form
standing waves in the slotted waveguide section after being reflected from the short
circuiting plunger in the liquid dielectric cell, which was initially kept at its lowest
position in the cell. The probe in the slotted waveguide section was accurately
adjusted at the node of the standing waves, as adjudged by the position of the
minima in the indicating meter. The temperature of the cell was maintained by
circulating hot water in the jacket surrounding the cell from a water bath by means
of a motor. Then, a small quantity of food grain powder was introduced in the
dielectric cell and the plunger was brought over it by moving the micrometer screw
till a proper contact was established. The height „h‟ of the powder in the dielectric
cell was determined from the difference of readings on the scale of micrometer screw
Temperature dependence of dielectric properties....... 142
Fig. 6.1: Experimental Arrangement for Yadav- Gandhi (1992) method used to
observe temperature dependence of the dielectric properties of food grains in
powder form.
taken with and without food powder in the cell. The powder was added slowly in the
dielectric cell till for a height „h‟ of the powder in the cell, the position of minima in
the slotted section is the same as for the empty cell. For this position,
dh2
Or d 2h
(6.1)
The value of λd. was determined by using equation ( 6.1). The phase factor in
the dielectric (βd) is then given by
βd = 2π / λd (6.2)
In order to calculate the value of attenuation constant in the dielectric (α), the
plunger was kept at the bottom of the empty cell and the probe was located at one of
the maximas, i.e., at the position of a voltage antinode in the waveguide slotted
section, and reading „x1‟ of the indicating meter is noted. The food powder (flour of
the food grains in the present case) was then added slowly in the dielectric cell and
position of the maxima in the slotted section is noted every time. The height of the
powder column in the dielectric cell (h') was accurately adjusted so that the probe
position locating the maxima in the slotted section was again the same as with the
empty cell. The deflection „x2‟ of the indicating meter in this state, for such height
„h' of the powder column, was noted.. The value of the attenuation constant in the
dielectric ( αd ) is then given by
Temperature dependence of dielectric properties....... 143
1
d
2 1
x2.303log
2h ' 2 x x (6.3)
On using the measured values of αd and βd,the values of ε' and ε'' of food
grain powder were calculated by the following equations
2 2 2
0 0 d
c d d
' 1
(6.4)
2
0 d
d d
" 2
(6.5)
where λ0 is the guide wavelength for air dielectric and λc is the cutoff wavelength
given by λc = 2a,where a is the width of the waveguide.
The same procedure was repeated for determination of dielectric properties
at different temperatures. The experiment was performed three times for each
temperature and the mean values of dielectric constant and dielectric loss factor
were obtained.
6.3 Results and Discussion
6.3.1 Temperature Dependence of Dielectric Properties of Barley
The values of dielectric constant (ε') and dielectric loss factor (ε'') computed
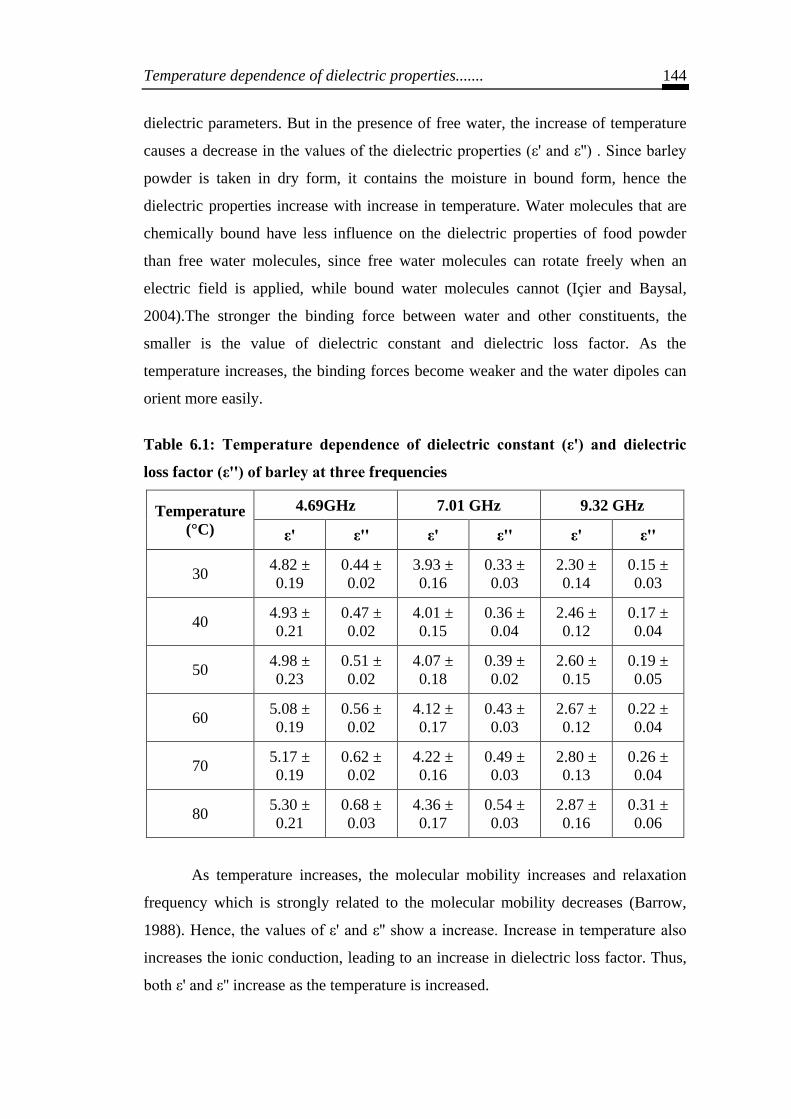
for barley in powder form at different temperatures are displayed in table 6.1. It is
observed from this table that at any frequency both the dielectric constant and
dielectric loss show a slight increase in their respective values with increase in
temperature.
At a fixed temperature, the dielectric values (ε' and ε'') are observed to vary
with frequency. Both the dielectric constant and dielectric loss decrease with increase
in frequency, which is as expected, as discussed in chapter 4. It has been stated by
Sahin and Sumnu (2006a) that free and bound water and the ionic conductivity
affect the rate of change of dielectric constant and loss with temperature .If bound
water is present, the increase in temperature leads to increase in the values of the
Temperature dependence of dielectric properties....... 144
dielectric parameters. But in the presence of free water, the increase of temperature
causes a decrease in the values of the dielectric properties (ε' and ε'') . Since barley
powder is taken in dry form, it contains the moisture in bound form, hence the
dielectric properties increase with increase in temperature. Water molecules that are
chemically bound have less influence on the dielectric properties of food powder
than free water molecules, since free water molecules can rotate freely when an
electric field is applied, while bound water molecules cannot (Içier and Baysal,
2004).The stronger the binding force between water and other constituents, the
smaller is the value of dielectric constant and dielectric loss factor. As the
temperature increases, the binding forces become weaker and the water dipoles can
orient more easily.
Table 6.1: Temperature dependence of dielectric constant (ε') and dielectric
loss factor (ε'') of barley at three frequencies
Temperature
(°C)
4.69GHz 7.01 GHz 9.32 GHz
ε' ε'' ε' ε'' ε' ε''
30 4.82 ±
0.19
0.44 ±
0.02
3.93 ±
0.16
0.33 ±
0.03
2.30 ±
0.14
0.15 ±
0.03
40 4.93 ±
0.21
0.47 ±
0.02
4.01 ±
0.15
0.36 ±
0.04
2.46 ±
0.12
0.17 ±
0.04
50 4.98 ±
0.23
0.51 ±
0.02
4.07 ±
0.18
0.39 ±
0.02
2.60 ±
0.15
0.19 ±
0.05
60 5.08 ±
0.19
0.56 ±
0.02
4.12 ±
0.17
0.43 ±
0.03
2.67 ±
0.12
0.22 ±
0.04
70 5.17 ±
0.19
0.62 ±
0.02
4.22 ±
0.16
0.49 ±
0.03
2.80 ±
0.13
0.26 ±
0.04
80 5.30 ±
0.21
0.68 ±
0.03
4.36 ±
0.17
0.54 ±
0.03
2.87 ±
0.16
0.31 ±
0.06
As temperature increases, the molecular mobility increases and relaxation
frequency which is strongly related to the molecular mobility decreases (Barrow,
1988). Hence, the values of ε' and ε'' show a increase. Increase in temperature also
increases the ionic conduction, leading to an increase in dielectric loss factor. Thus,
both ε' and ε'' increase as the temperature is increased.
Temperature dependence of dielectric properties....... 145
(a)
(b)
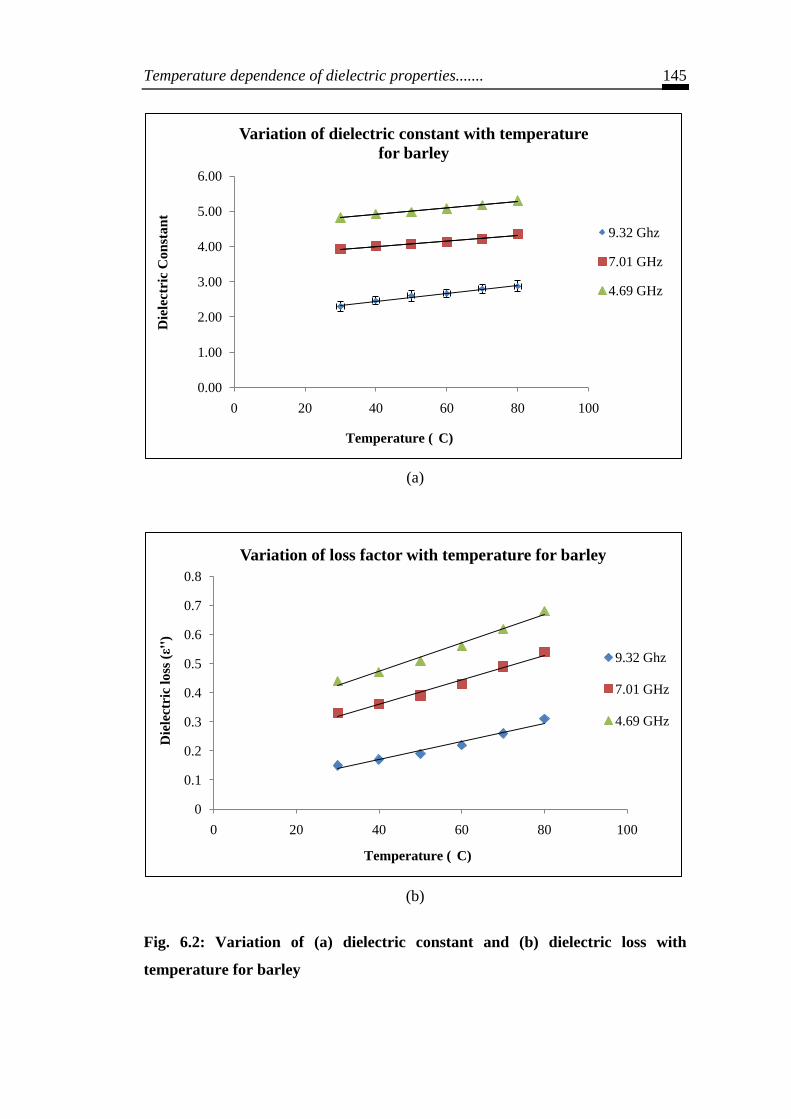
Fig. 6.2: Variation of (a) dielectric constant and (b) dielectric loss with
temperature for barley
0.00
1.00
2.00
3.00
4.00
5.00
6.00
0 20 40 60 80 100
Die
lect
ric C
on
stan
t
Temperature ( C)
Variation of dielectric constant with temperature
for barley
9.32 Ghz
7.01 GHz
4.69 GHz
0
0.1
0.2
0.3
0.4
0.5
0.6
0.7
0.8
0 20 40 60 80 100
Die
lect
ric l
oss
(ε'
')
Temperature ( C)
Variation of loss factor with temperature for barley
9.32 Ghz
7.01 GHz
4.69 GHz
Temperature dependence of dielectric properties....... 146
Figures 6.2 (a) and (b) show temperature dependence of dielectric constant
(ε') and dielectric loss factor (ε'') for barley in the temperature range of 30° C to
80°C respectively. From the Fig. 6.2 (a), it is apparent that the linear regression
provides good estimates for the temperature dependence of dielectric constant .The
values of regression coefficients for the lines shown in this figure are given below in
Table 6. The rate of change of ε' with temperature is approximately the same at all
frequencies. This behaviour is similar to that observed by Nelson (1978) for shelled
yellow dent corn at frequency 2.45 GHz and temperatures 25°C to 60°C.
Fig. 6.2 (b) shows the variation of dielectric loss factor (ε'') with temperature.
From this diagram, it can be inferred that the dependence of loss factor (ε'') on
temperature is also almost linear. The values of linear regression coefficients (R2)
for
the three cases are shown in Table 6.2. From this table it is clear that the rate of
change ε'' with temperature is slightly higher at frequencies 4.69 GHz and 7.01 GHz
as compared to 9.32 GHz.
It may be concluded that the variation of both ε' and ε'' with temperature is
gradual at all the frequencies at which measurements are made, no irregular jumps
are observed.
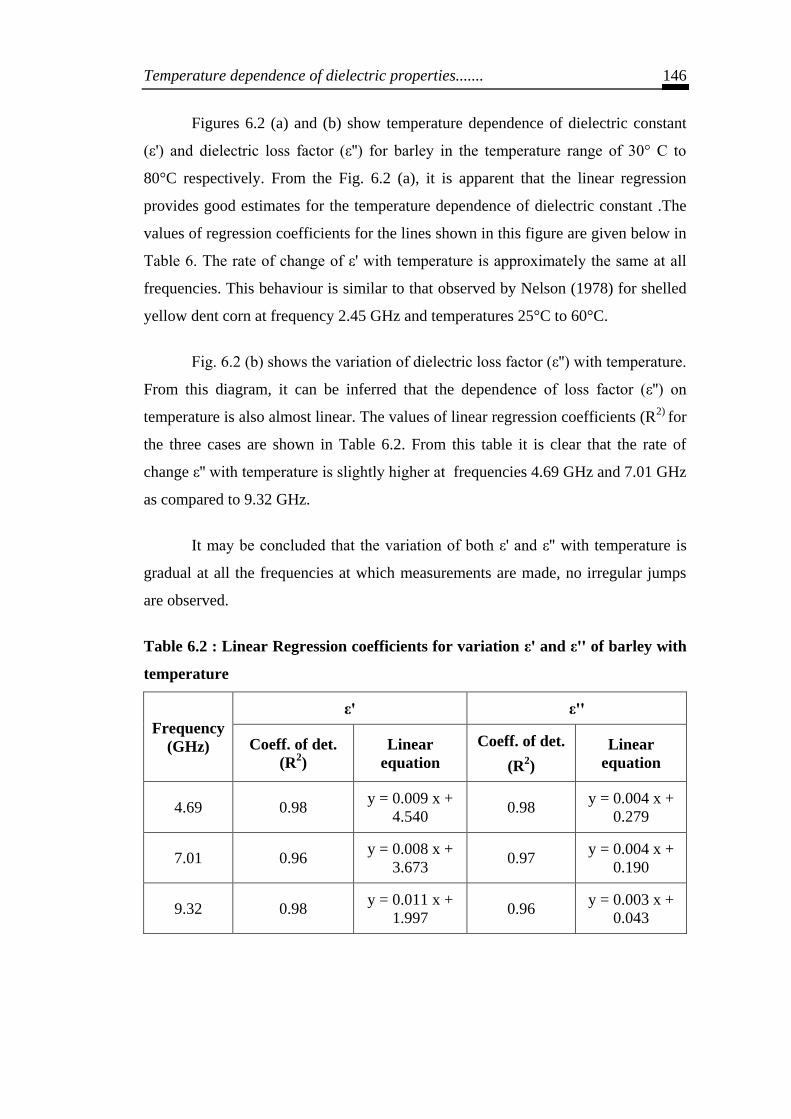
Table 6.2 : Linear Regression coefficients for variation ε' and ε'' of barley with
temperature
Frequency
(GHz)
ε' ε''
Coeff. of det.
(R2)
Linear
equation
Coeff. of det.
(R2)
Linear
equation
4.69 0.98 y = 0.009 x +
4.540 0.98
y = 0.004 x +
0.279
7.01 0.96 y = 0.008 x +
3.673 0.97
y = 0.004 x +
0.190
9.32 0.98 y = 0.011 x +
1.997 0.96
y = 0.003 x +
0.043
Temperature dependence of dielectric properties....... 147
6.3.2 Temperature Dependence of Dielectric Properties of Chickpea
The values of dielectric constant(ε') and dielectric loss (ε'') of chickpea as
obtained by Yadav-Gandhi method (1992) in powder form at different temperatures
are displayed in table 6.3.It is apparent from this table that at a particular frequency,
the values of ε' and ε'' increase with increase in temperature. This indicates that the
water exists in chickpea in bound form. A change in temperature causes the energetic
status of the molecules to change, with the result that the capability of the molecules
to rotate under the influence of electric field also changes. As such, when temperature
is changed, there is a change in the contribution of water molecules to polarisation,
giving rise to a change in the value of complex permittivity of the dielectric.
Increase in dielectric loss factor with increasing temperature often results in a
well-known phenomenon, commonly referred to as „„thermal runaway‟‟ (Metaxas
and Meridith, 1983), in which a preferentially heated subject in an EM field
accelerates heating as its temperature rises. Stuchly and Stuchly (1980) investigated
the effect of moisture content on the dielectric properties of granular solids at 9.4
GHz over a wide range of temperature and moisture contents and reported that at
low moisture contents the temperature dependence of ε' and ε'' was not appreciable
for dried solids but it increased dramatically at higher moisture contents. Under the
influence of electromagnetic fields, a material at high temperatures has low value of
relaxation time (η) and therefore the peak of dielectric loss shifts to the higher
frequency (ω = 1/ η) side. They observed that the temperature effects on dielectric
properties also depend on the relaxation frequency of the material. The dielectric
constant increases and dielectric loss either decreases or increases with increasing
temperature depending on whether the operating frequency is lower or higher than
the relaxation frequency.
Temperature dependence of dielectric properties....... 148
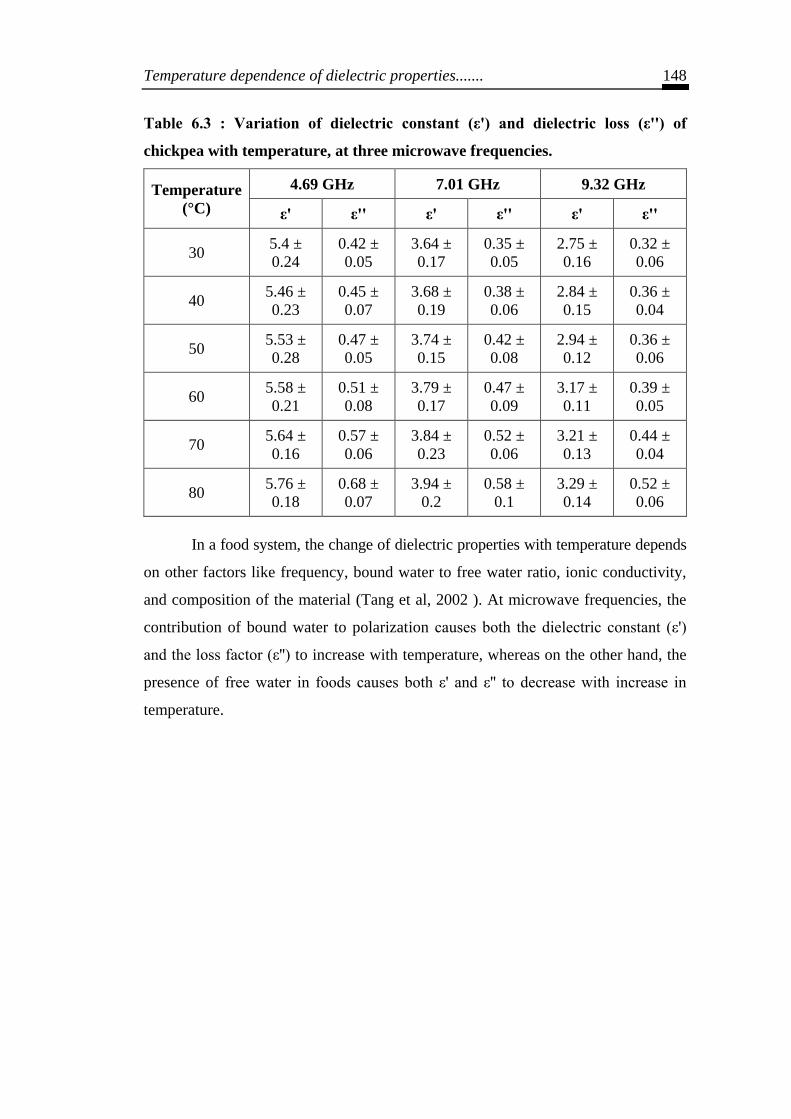
Table 6.3 : Variation of dielectric constant (ε') and dielectric loss (ε'') of
chickpea with temperature, at three microwave frequencies.
Temperature
(°C)
4.69 GHz 7.01 GHz 9.32 GHz
ε' ε'' ε' ε'' ε' ε''
30 5.4 ±
0.24
0.42 ±
0.05
3.64 ±
0.17
0.35 ±
0.05
2.75 ±
0.16
0.32 ±
0.06
40 5.46 ±
0.23
0.45 ±
0.07
3.68 ±
0.19
0.38 ±
0.06
2.84 ±
0.15
0.36 ±
0.04
50 5.53 ±
0.28
0.47 ±
0.05
3.74 ±
0.15
0.42 ±
0.08
2.94 ±
0.12
0.36 ±
0.06
60 5.58 ±
0.21
0.51 ±
0.08
3.79 ±
0.17
0.47 ±
0.09
3.17 ±
0.11
0.39 ±
0.05
70 5.64 ±
0.16
0.57 ±
0.06
3.84 ±
0.23
0.52 ±
0.06
3.21 ±
0.13
0.44 ±
0.04
80 5.76 ±
0.18
0.68 ±
0.07
3.94 ±
0.2
0.58 ±
0.1
3.29 ±
0.14
0.52 ±
0.06
In a food system, the change of dielectric properties with temperature depends
on other factors like frequency, bound water to free water ratio, ionic conductivity,
and composition of the material (Tang et al, 2002 ). At microwave frequencies, the
contribution of bound water to polarization causes both the dielectric constant (ε')
and the loss factor (ε'') to increase with temperature, whereas on the other hand, the
presence of free water in foods causes both ε' and ε'' to decrease with increase in
temperature.
Temperature dependence of dielectric properties....... 149
(a)
(b)
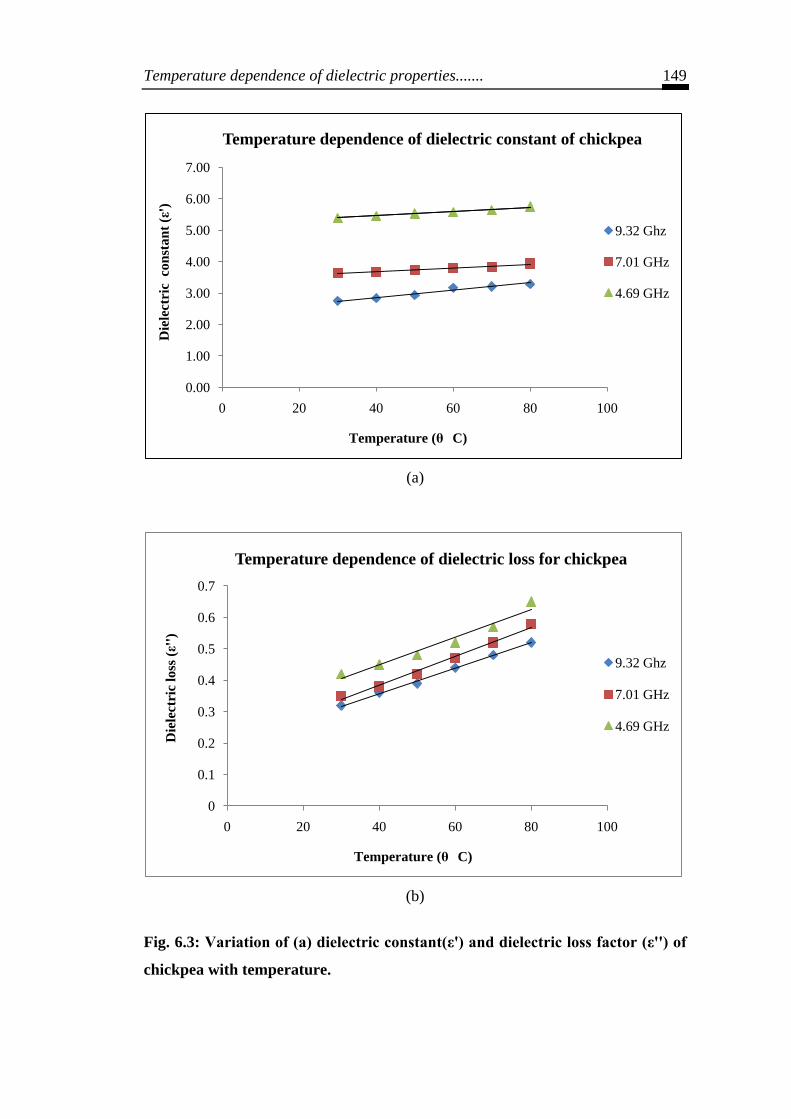
Fig. 6.3: Variation of (a) dielectric constant(ε') and dielectric loss factor (ε'') of
chickpea with temperature.
0.00
1.00
2.00
3.00
4.00
5.00
6.00
7.00
0 20 40 60 80 100
Die
lect
ric co
nst
an
t (ε
')
Temperature (θ C)
Temperature dependence of dielectric constant of chickpea
9.32 Ghz
7.01 GHz
4.69 GHz
0
0.1
0.2
0.3
0.4
0.5
0.6
0.7
0 20 40 60 80 100
Die
lect
ric l
oss
(ε'
')
Temperature (θ C)
Temperature dependence of dielectric loss for chickpea
9.32 Ghz
7.01 GHz
4.69 GHz
Temperature dependence of dielectric properties....... 150
It is clear from these figures that both the dielectric constant (ε') and dielectric
loss factor (ε'') increase almost linearly with increase in temperature. For loss factor
(ε'') at 4.69 GHz deviations from linear dependence are observed. As such, curve
fitting has been used in this case. At other frequencies linear relationship is found to
be quite satisfactory. This shows that variation of dielectric constant (ε') at low
frequency is faster as compared to other frequency. The increase in dielectric
parameters with temperature at lower frequency denote the predominant effect of
ionic conduction as well as molecular mobility. For lower moisture content the
variation of ε ' and ε'' with temperature is almost linear.
It may be observed from Fig. 6.3 (a) and (b) that slope of ε'-θ lines is smaller
than the slopes of ε''-θ lines at all the frequencies, showing that the dielectric
constant is less affected by temperature than that of the dielectric loss factor because
the increase in ionic conduction at higher temperature produces additional effect on
dielectric loss factor, whereas the dielectric constant is least or not at all affected by
the increase in ionic conduction (Khan and Chandel, 2011).
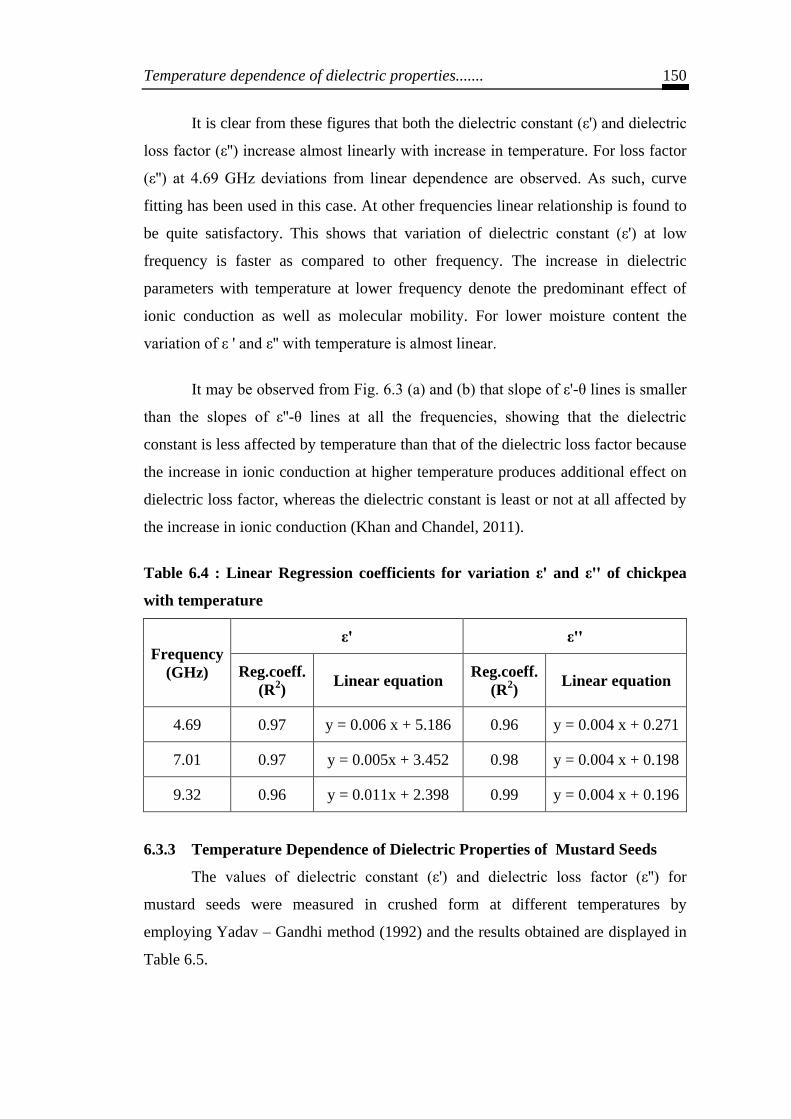
Table 6.4 : Linear Regression coefficients for variation ε' and ε'' of chickpea
with temperature
Frequency
(GHz)
ε' ε''
Reg.coeff.
(R2)
Linear equation Reg.coeff.
(R2)
Linear equation
4.69 0.97 y = 0.006 x + 5.186 0.96 y = 0.004 x + 0.271
7.01 0.97 y = 0.005x + 3.452 0.98 y = 0.004 x + 0.198
9.32 0.96 y = 0.011x + 2.398 0.99 y = 0.004 x + 0.196
6.3.3 Temperature Dependence of Dielectric Properties of Mustard Seeds
The values of dielectric constant (ε') and dielectric loss factor (ε'') for
mustard seeds were measured in crushed form at different temperatures by
employing Yadav – Gandhi method (1992) and the results obtained are displayed in
Table 6.5.
Temperature dependence of dielectric properties....... 151
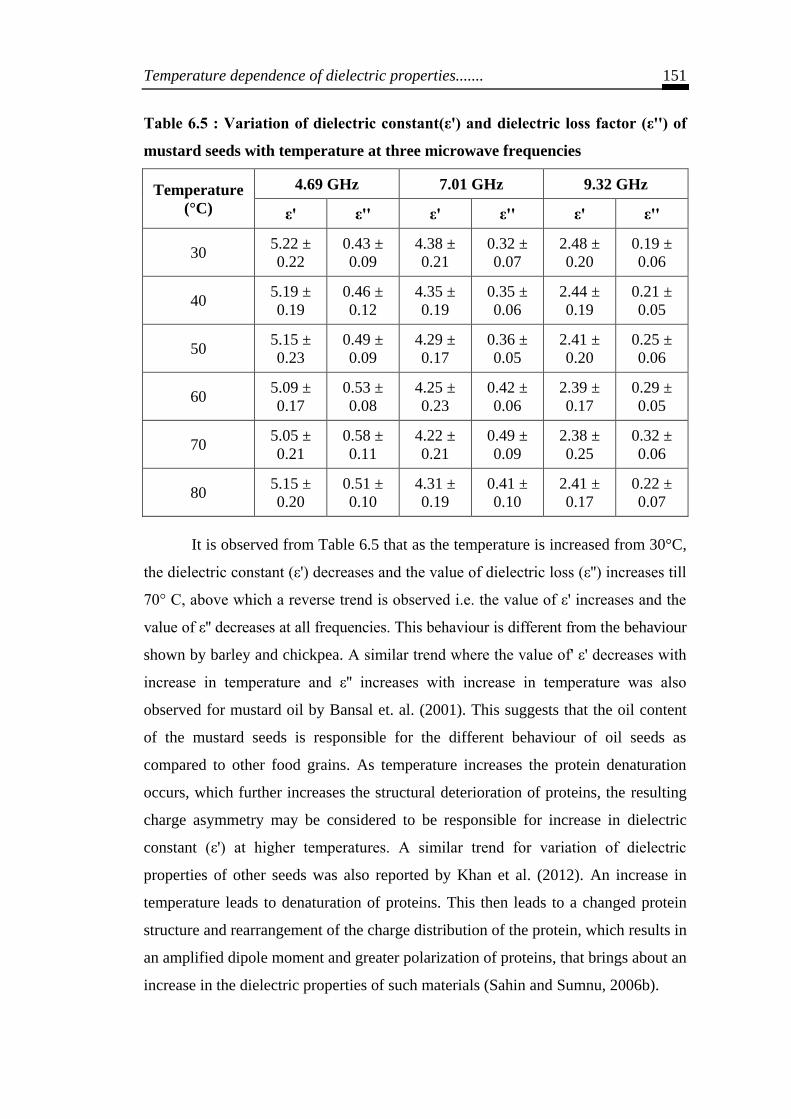
Table 6.5 : Variation of dielectric constant(ε') and dielectric loss factor (ε'') of
mustard seeds with temperature at three microwave frequencies
Temperature
(°C)
4.69 GHz 7.01 GHz 9.32 GHz
ε' ε'' ε' ε'' ε' ε''
30 5.22 ±
0.22
0.43 ±
0.09
4.38 ±
0.21
0.32 ±
0.07
2.48 ±
0.20
0.19 ±
0.06
40 5.19 ±
0.19
0.46 ±
0.12
4.35 ±
0.19
0.35 ±
0.06
2.44 ±
0.19
0.21 ±
0.05
50 5.15 ±
0.23
0.49 ±
0.09
4.29 ±
0.17
0.36 ±
0.05
2.41 ±
0.20
0.25 ±
0.06
60 5.09 ±
0.17
0.53 ±
0.08
4.25 ±
0.23
0.42 ±
0.06
2.39 ±
0.17
0.29 ±
0.05
70 5.05 ±
0.21
0.58 ±
0.11
4.22 ±
0.21
0.49 ±
0.09
2.38 ±
0.25
0.32 ±
0.06
80 5.15 ±
0.20
0.51 ±
0.10
4.31 ±
0.19
0.41 ±
0.10
2.41 ±
0.17
0.22 ±
0.07
It is observed from Table 6.5 that as the temperature is increased from 30°C,
the dielectric constant (ε') decreases and the value of dielectric loss (ε'') increases till
70° C, above which a reverse trend is observed i.e. the value of ε' increases and the
value of ε'' decreases at all frequencies. This behaviour is different from the behaviour
shown by barley and chickpea. A similar trend where the value of' ε' decreases with
increase in temperature and ε'' increases with increase in temperature was also
observed for mustard oil by Bansal et. al. (2001). This suggests that the oil content
of the mustard seeds is responsible for the different behaviour of oil seeds as
compared to other food grains. As temperature increases the protein denaturation
occurs, which further increases the structural deterioration of proteins, the resulting
charge asymmetry may be considered to be responsible for increase in dielectric
constant (ε') at higher temperatures. A similar trend for variation of dielectric
properties of other seeds was also reported by Khan et al. (2012). An increase in
temperature leads to denaturation of proteins. This then leads to a changed protein
structure and rearrangement of the charge distribution of the protein, which results in
an amplified dipole moment and greater polarization of proteins, that brings about an
increase in the dielectric properties of such materials (Sahin and Sumnu, 2006b).
Temperature dependence of dielectric properties....... 152
(a)
(b)
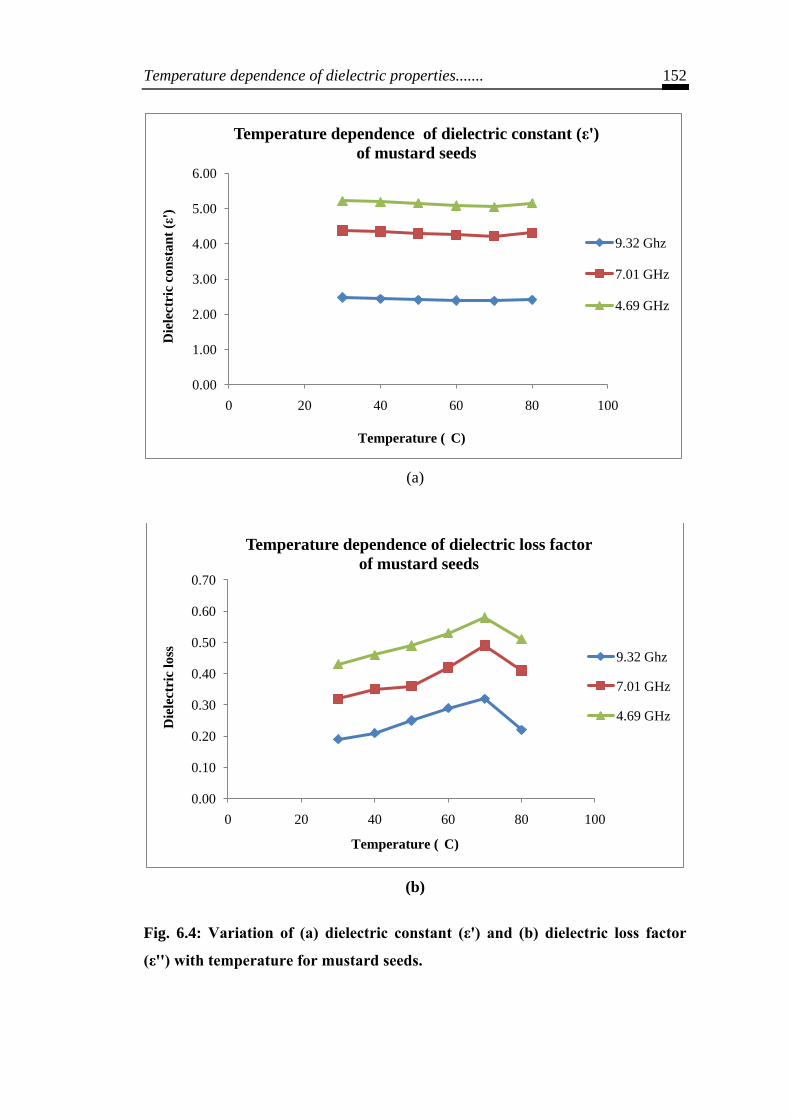
Fig. 6.4: Variation of (a) dielectric constant (ε') and (b) dielectric loss factor
(ε'') with temperature for mustard seeds.
0.00
1.00
2.00
3.00
4.00
5.00
6.00
0 20 40 60 80 100
Die
lect
ric c
on
stan
t (ε
')
Temperature ( C)
Temperature dependence of dielectric constant (ε')
of mustard seeds
9.32 Ghz
7.01 GHz
4.69 GHz
0.00
0.10
0.20
0.30
0.40
0.50
0.60
0.70
0 20 40 60 80 100
Die
lect
ric l
oss
Temperature ( C)
Temperature dependence of dielectric loss factor
of mustard seeds
9.32 Ghz
7.01 GHz
4.69 GHz
Temperature dependence of dielectric properties....... 153
However, if water becomes bound during the denaturation process, the
dielectric properties will decrease and vice versa if water is released during
denaturation. Carbohydrates are also present in the oilseeds. A strong binding exists
between bound water and carbohydrates which results in low value of dielectric
constant (ε') and dielectric loss factor (ε'') (Sahin and Sumnu, 2006b). It is this
binding between bound water and proteins and bound water and carbohydrates and
consequent decrease in free water content that is responsible for a decrease in ε' and
increase in ε'' with increase in emperature. When denaturation takes place and water
is in bound state, the mobility of the ions present is also reduced, causing the
dielectric properties to reduce (Sahin and Sumnu, 2006 b).
The variation of dielectric constant (ε') with temperature is depicted in Fig.
6.4 (a). It is observed from this figure that the value of ε' shows a linear dependence
on temperature upto 70°C with a negative slope, but above 70°C the slope of the
curves become positive at all the three frequencies. The change in ε' with
temperature is found to be quite gradual. The variation of dielectric loss factor (ε'')
with temperature is shown in Fig.6.4 (b).It is observed from this figure that linear
regression does not apply to this case. Now the dielectric loss factor (ε'') increases
with temperature almost linearly till 70°C and above 70°C it decreases till 80°C,
showing a peak at about 70°C at all three frequencies. This change in the trend can
be attributed to protein denaturation and the change in viscosity of the oil content of
the mustard seeds. Protein denaturation is not observed in the case of chickpea
though they are rich in proteins. This may be due to the fact that chickpea has high
proteins as well as carbohydrates while mustard seeds have high content of fats and
proteins.
It may also be observed that the general trend of the present results for
dependence of dielectric constant (ε') and dielectric loss factor (ε'') on temperature
for barley and chickpea agree well with the results of Trabelsi et.al.(2009) at 6 GHz
for temperature dependence of ε' and ε'' of shelled and unshelled peanuts. However,
the results for ε' and ε'' of mustard seeds show variation from the general trend, as
can be inferred from Fig. 6.4.
Temperature dependence of dielectric properties....... 154
6.4 Conclusion
It can be concluded that the dielectric properties of barley, chickpea and
mustard seeds vary with the change in temperature. The change in dielectric constant
(ε') with temperature is very small since the moisture content in these grains and
seeds is quite low. It can be inferred that both dielectric constant (ε') and dielectric
loss factor (ε'') increase with increase in temperature for cereals and pulses while the
dielectric constant decreases with increase in temperature for mustard seeds which
represents the oilseeds. The knowledge of temperature dependence of dielectric
properties helps in design of microwave processes and control and also in material
characterization.