Embed Size (px)
Citation preview
Chapter 7
Adaptive Management and Tracking Progress
While the Minnesota Nutrient Reduction Strategy (NRS) is based on scientific analysis and considerable
agency, academic and public input, there will continue to be a need to improve and refine the NRS
based on new information and input from scientists, key stakeholders and partners. The NRS will be
frequently evaluated and periodically updated using an iterative process of planning, implementing,
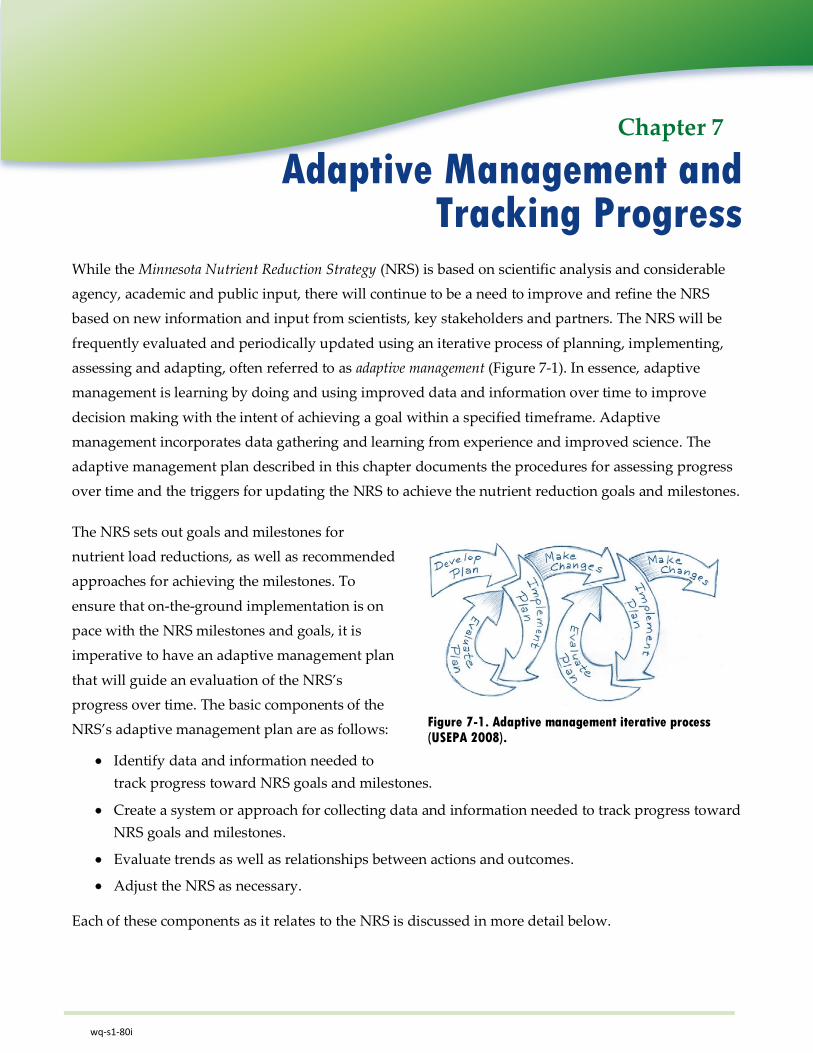
assessing and adapting, often referred to as adaptive management (Figure 7-1). In essence, adaptive
management is learning by doing and using improved data and information over time to improve
decision making with the intent of achieving a goal within a specified timeframe. Adaptive
management incorporates data gathering and learning from experience and improved science. The
adaptive management plan described in this chapter documents the procedures for assessing progress
over time and the triggers for updating the NRS to achieve the nutrient reduction goals and milestones.
The NRS sets out goals and milestones for
nutrient load reductions, as well as recommended
approaches for achieving the milestones. To
ensure that on-the-ground implementation is on
pace with the NRS milestones and goals, it is
imperative to have an adaptive management plan
that will guide an evaluation of the NRS’s
progress over time. The basic components of the
NRS’s adaptive management plan are as follows:
Identify data and information needed to
track progress toward NRS goals and milestones.
Create a system or approach for collecting data and information needed to track progress toward
NRS goals and milestones.
Evaluate trends as well as relationships between actions and outcomes.
Adjust the NRS as necessary.
Each of these components as it relates to the NRS is discussed in more detail below.
Figure 7-1. Adaptive management iterative process (USEPA 2008).
wq-s1-80i
7-2 Chapter 7. Adaptive Management and Tracking Progress
Minnesota Nutrient Reduction Strategy
7.1 Information Needed to Track Progress To understand the level of nutrient reduction progress being achieved, it is important to evaluate both
changes in the adoption of best management practices (BMPs) (human actions) and water quality
monitoring information (environmental outcomes). Water quality monitoring data alone will not
provide sufficient information to evaluate progress and make needed adjustments to the NRS. Water
monitoring does not provide reliable information on incremental nutrient reduction progress when the
level of BMP adoption is not extensive enough to overshadow natural water quality variations, or
when lag times are large due to phosphorus cycling in stagnant waters or when nitrate movement
through the groundwater hydrologic pathway is slow compared to other pathways.
Both action and environmental outcome data will be necessary to track progress toward NRS goals and
milestones. Implementation data provides early indicator information about nitrogen and phosphorus
reductions that, over time, should translate to in-stream nutrient reductions. Expected water quality
changes can be analyzed and modeled when the following types of information are available:
BMP implementation through programs
Overarching management changes through BMP adoption by all government and private action
Land use and management changes apart from BMP adoption (i.e., cropping rotation changes,
deforestation, urbanization, tiling, etc.)
Precipitation and hydrologic information
Environmental outcomes as represented by water quality monitoring trends are an important part of
tracking NRS success, since they are a direct measure of NRS goals. This is especially the case when the
monitoring results are analyzed in concert with the above list of information, allowing evaluation of
not only progress toward goals, but the effectiveness of actions taken to influence those outcomes.
Water quality monitoring results should be evaluated at different points and scales, including:
Watershed outlets (i.e., major 8-digit hydrologic unit code [HUC8] watershed, basin and major
basin)
Major river monitoring sites with historical monitoring
Water supply wells (for nitrate)
Sentinel and demonstration watersheds for studying water quality cause and effects
When all of the information above is considered together, progress toward achieving milestones and
goals can be evaluated. Each information need and corresponding evaluation approach is described
below.
7-3 Chapter 7. Adaptive Management and Tracking Progress
Minnesota Nutrient Reduction Strategy
7.1.1 BMP Implementation Evaluation
The implementation evaluation piece of the NRS’s adaptive management process focuses on
implementation of the most influential categories of BMPs and management actions described in
Chapters 5 and 6. The objective of evaluating programs and BMP implementation is to determine
progress toward the milestones and goals outlined in Chapter 2. The emphasis of this initial version of
the NRS is on reaching goals and the Phase 1 nitrogen milestone and has an 11-year planning horizon
from 2014 to 2025. Under an adaptive management approach, the implementation evaluation would
allow opportunities to gauge implementation progress at several key intervals to ensure
implementation is on track to achieve the goals and Phase 1 nitrogen milestone. Tracking
environmental outcomes helps to inform needs to achieve environmental goals. Quantifying changes in
both program implementation and water quality outcomes are complementary parts of the NRS. The
approach for quantifying these changes must be meaningful, sustainable, and replicable.
The selected key programs identified in Chapter 4 implement a variety of structural and nonstructural
BMPs. While programs are expected to provide accounting of the actions that they directly control,
whether through permit or assistance contracts, attempting to quantify nutrient reductions for every
BMP influenced by each program is not always possible with limited resources. Federal programs play
an important role in promoting adoption of agricultural conservation practices using key BMPs. There
is a need to develop mechanisms that allow for improved federal agency data sharing and changes to
existing federal databases to support NRS tracking over time. It is expected that the public will
continue to call for improved accountability in government programs.
A suite of program measures have been developed in an effort to narrow down the potential BMPs
under each identified program to focus on those that are the most meaningful indicators of readily
available data on statewide nutrient reduction progress. This can streamline the tracking process, but
where only indicator BMPs are being tracked, a relationship to overall BMP implementation should be
developed. Tracking the implementation information associated with the selected program measures
provides the pulse of key implementation programs. Nutrient reduction trends for the selected
program measures will show progress related to certain BMPs; yet it is important to keep in mind that
there is a wide range of BMPs that are beneficial to achieving the nutrient reduction goals (as listed in
Appendix B). Table 7-1 summarizes the priority programs with the associated measure and indicator
BMPs. It is important to note that some measures capture more than one program. Not all programs
have measures at this time due to data limitations, specific program development issues, or project
resource constraints.
7-4 Chapter 7. Adaptive Management and Tracking Progress
Minnesota Nutrient Reduction Strategy
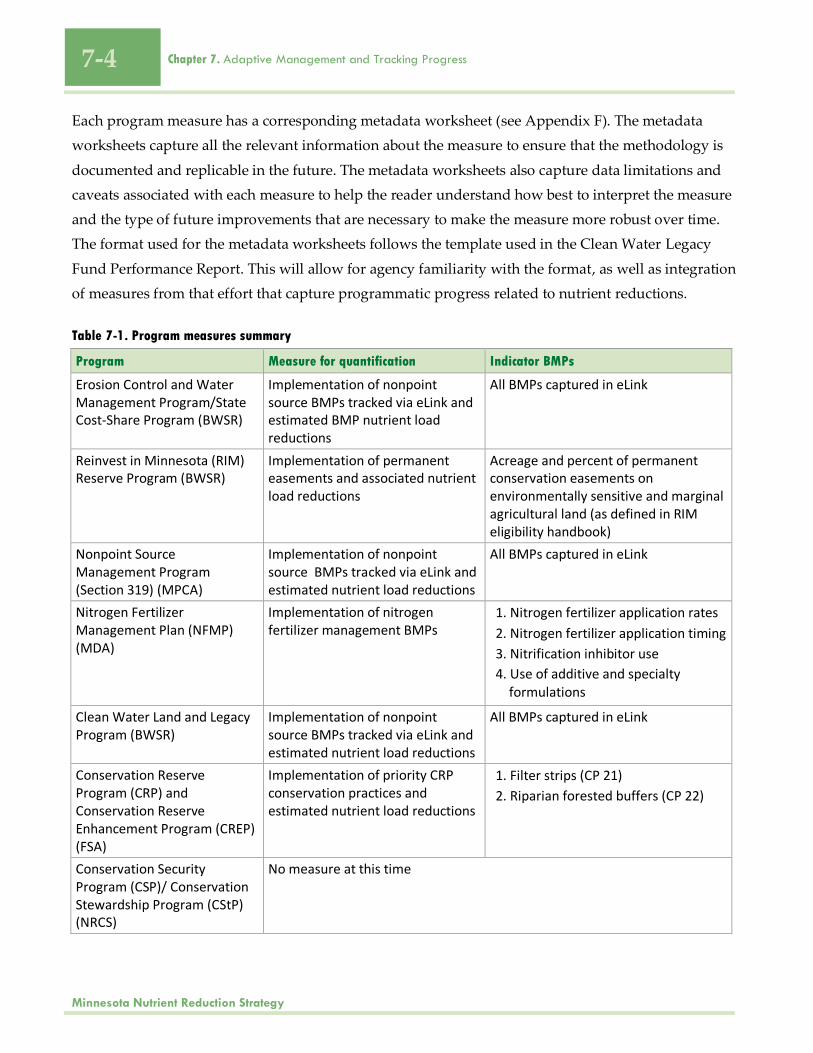
Each program measure has a corresponding metadata worksheet (see Appendix F). The metadata
worksheets capture all the relevant information about the measure to ensure that the methodology is
documented and replicable in the future. The metadata worksheets also capture data limitations and
caveats associated with each measure to help the reader understand how best to interpret the measure
and the type of future improvements that are necessary to make the measure more robust over time.
The format used for the metadata worksheets follows the template used in the Clean Water Legacy
Fund Performance Report. This will allow for agency familiarity with the format, as well as integration
of measures from that effort that capture programmatic progress related to nutrient reductions.
Table 7-1. Program measures summary
Program Measure for quantification Indicator BMPs
Erosion Control and Water Management Program/State Cost-Share Program (BWSR)
Implementation of nonpoint source BMPs tracked via eLink and estimated BMP nutrient load reductions
All BMPs captured in eLink
Reinvest in Minnesota (RIM) Reserve Program (BWSR)
Implementation of permanent easements and associated nutrient load reductions
Acreage and percent of permanent conservation easements on environmentally sensitive and marginal agricultural land (as defined in RIM eligibility handbook)
Nonpoint Source Management Program (Section 319) (MPCA)
Implementation of nonpoint source BMPs tracked via eLink and estimated nutrient load reductions
All BMPs captured in eLink
Nitrogen Fertilizer Management Plan (NFMP) (MDA)
Implementation of nitrogen fertilizer management BMPs
1. Nitrogen fertilizer application rates
2. Nitrogen fertilizer application timing
3. Nitrification inhibitor use
4. Use of additive and specialty formulations
Clean Water Land and Legacy Program (BWSR)
Implementation of nonpoint source BMPs tracked via eLink and estimated nutrient load reductions
All BMPs captured in eLink
Conservation Reserve Program (CRP) and Conservation Reserve Enhancement Program (CREP) (FSA)
Implementation of priority CRP conservation practices and estimated nutrient load reductions
1. Filter strips (CP 21)
2. Riparian forested buffers (CP 22)
Conservation Security Program (CSP)/ Conservation Stewardship Program (CStP) (NRCS)
No measure at this time
7-5 Chapter 7. Adaptive Management and Tracking Progress
Minnesota Nutrient Reduction Strategy
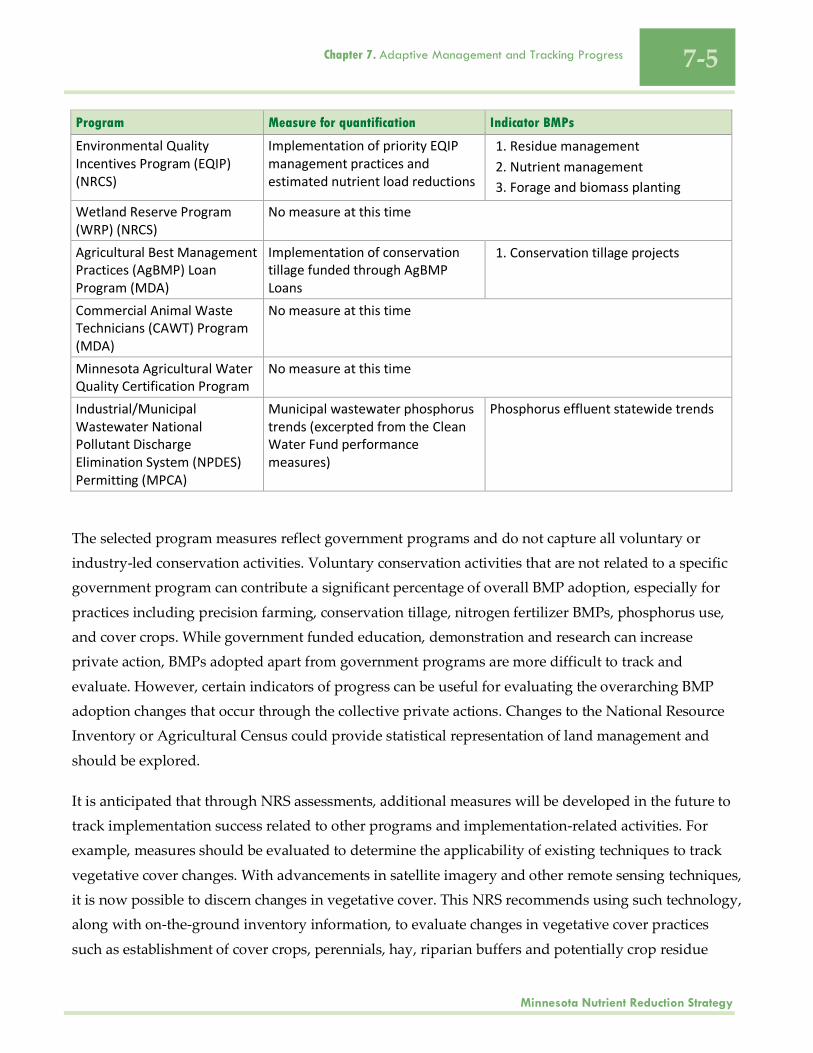
Program Measure for quantification Indicator BMPs
Environmental Quality Incentives Program (EQIP) (NRCS)
Implementation of priority EQIP management practices and estimated nutrient load reductions
1. Residue management
2. Nutrient management
3. Forage and biomass planting
Wetland Reserve Program (WRP) (NRCS)
No measure at this time
Agricultural Best Management Practices (AgBMP) Loan Program (MDA)
Implementation of conservation tillage funded through AgBMP Loans
1. Conservation tillage projects
Commercial Animal Waste Technicians (CAWT) Program (MDA)
No measure at this time
Minnesota Agricultural Water Quality Certification Program
No measure at this time
Industrial/Municipal Wastewater National Pollutant Discharge Elimination System (NPDES) Permitting (MPCA)
Municipal wastewater phosphorus trends (excerpted from the Clean Water Fund performance measures)
Phosphorus effluent statewide trends
The selected program measures reflect government programs and do not capture all voluntary or
industry-led conservation activities. Voluntary conservation activities that are not related to a specific
government program can contribute a significant percentage of overall BMP adoption, especially for
practices including precision farming, conservation tillage, nitrogen fertilizer BMPs, phosphorus use,
and cover crops. While government funded education, demonstration and research can increase
private action, BMPs adopted apart from government programs are more difficult to track and
evaluate. However, certain indicators of progress can be useful for evaluating the overarching BMP
adoption changes that occur through the collective private actions. Changes to the National Resource
Inventory or Agricultural Census could provide statistical representation of land management and
should be explored.
It is anticipated that through NRS assessments, additional measures will be developed in the future to
track implementation success related to other programs and implementation-related activities. For
example, measures should be evaluated to determine the applicability of existing techniques to track
vegetative cover changes. With advancements in satellite imagery and other remote sensing techniques,
it is now possible to discern changes in vegetative cover. This NRS recommends using such technology,
along with on-the-ground inventory information, to evaluate changes in vegetative cover practices
such as establishment of cover crops, perennials, hay, riparian buffers and potentially crop residue
7-6 Chapter 7. Adaptive Management and Tracking Progress
Minnesota Nutrient Reduction Strategy
cover. Crop residue cover and other ground-cover BMPs should also be determined with transect
surveys, similar to transect surveys conducted during previous years so that changes can be evaluated
from historical levels of crop residue cover.
Because nutrient efficiency is such a critical NRS element, metrics need to track improvements in
overall nutrient efficiencies. These efficiencies should be also be used to estimate nutrient changes in
the receiving waters. Nitrogen fertilizer sales and crop yield information are tracked and have been
used to show that, during the past couple of decades, agricultural producers have made progress in
growing more corn for each pound of nitrogen fertilizer. Fertilizer sales and crop yield information,
when combined with trends in planting densities, manure nutrient availability, grain protein content,
and other information, could provide an indication of trends related to nutrient efficiencies and
changes in the amount of soil nutrients that are potentially available for losses to the environment.
BMP implementation that takes place on a watershed scale, but is occurring outside of government
assistance, is likely the largest gap relative to measuring success of the NRS. Comprehensively
determining outcomes will require measuring of conservation practices and farming activities that are
not funded and tracked through government programs. Potential BMP implementation not accounted
for due to private implementation efforts could include conservation tillage, nitrogen fertilizer BMPs,
phosphorus use, cover crops and non-commodity crops.
Other metrics of nutrient efficiency, based on data from combined public and private efforts, should
also be considered and developed. Sources of data for additional metrics of nutrient efficiency could
include farmer and crop advisor surveys (i.e. NASS and FANMAP surveys), soil phosphorus test
results, sales and use of farm implements and equipment needed for BMPs and higher precision
nutrient management, and a geographically based statistical survey similar to a natural resources
inventory.
Other future measures could address the following:
Improvements in working with national and regional statistical surveys as well as with local
partners to track voluntary, non-government funded BMP implementation
CSP/CStP program measure
Municipal wastewater nitrogen effluent trends
Tile drainage water management practices
Other program BMPs (e.g., constructed wetlands, cover crops)
7-7 Chapter 7. Adaptive Management and Tracking Progress
Minnesota Nutrient Reduction Strategy
7.1.2 Estimating Effects of BMPs on Nutrient Reduction
Estimates of expected nutrient reductions in waters from BMP adoption can be developed based on the
level of BMP adoption change using various models and tools. However, evaluation of NRS progress
should also consider the effects of non-BMP land use and management changes, as well as climate
influences, so that both the estimated effects of the BMPs and other factors influencing water nutrient
levels can be understood.
One of the models that can be used to evaluate the effects of changing precipitation and land use is the
Hydrologic Simulation Program FORTRAN (HSPF) model. In an effort to aid the completion of
watershed restoration and protection strategies (WRAPS), the Minnesota Pollution Control Agency
(MPCA) is in the process of constructing HSPF watershed models for many of the HUC8 major
watersheds. The HSPF model is a comprehensive model for simulating watershed hydrology and
water quality for both conventional pollutants such as nutrients and sediment and toxic organic
pollutants. HSPF allows the integrated simulation of land and soil runoff processes with in-stream
hydraulic and sediment-chemical interactions. In the Minnesota River Basin, HSPF models for ten
major watersheds have been aggregated to represent the larger basin. The results of HUC8 watershed
modeling will further inform NRS implementation in the future.
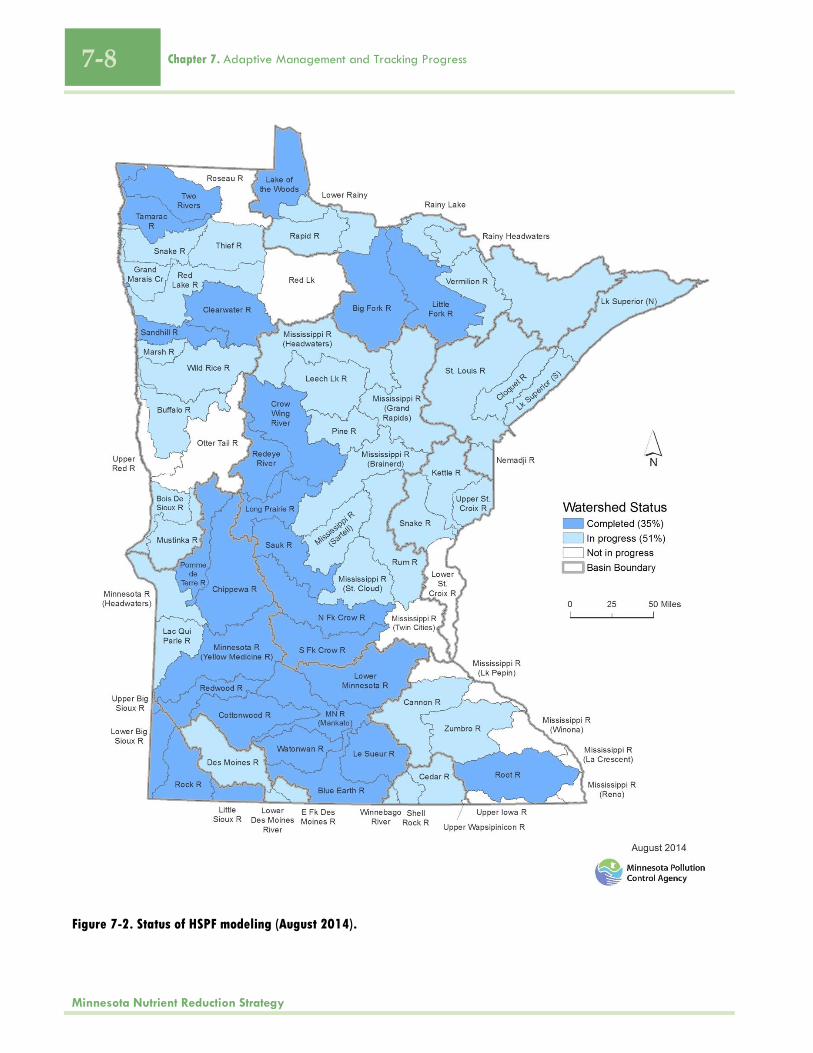
Figure 7-2 provides a summary of the current status of HSPF modeling in the state (current through
August 2014). HSPF and other models such as Soil Water Assessment Tool and SPARROW combined
with other modeling approaches, such as the University of Minnesota’s NBMP spreadsheet, should be
used to estimate the NRS’s progress made by BMPs, along with confounding effects of changing crop
rotations, hydrologic modifications, and precipitation.
7-8 Chapter 7. Adaptive Management and Tracking Progress
Minnesota Nutrient Reduction Strategy
Figure 7-2. Status of HSPF modeling (August 2014).
7-9 Chapter 7. Adaptive Management and Tracking Progress
Minnesota Nutrient Reduction Strategy
7.1.3 Water Quality Monitoring Evaluation
Water quality evaluations will largely rely on the Watershed
Pollutant Load Monitoring Network (WPLMN). This network
will be supplemented with special watershed monitoring
projects for environmental changes below the HUC8,
monitoring of sentinel watersheds, ground water nitrate
monitoring, National Water Quality Initiative projects,
Targeted Watershed Demonstration Program Projects, BMP
effectiveness as provided in research and Discovery Farm
monitoring, along with other special projects and water quality
modeling. There are many other local, regional, statewide, and
national monitoring programs that will inform water quality
evaluations including those being conducted by the new
Mississippi River Monitoring Collaborative, which is made up
of federal and state agencies along the Mississippi River
between the Gulf of Mexico and Minnesota. Efforts will be
made to coordinate Minnesota monitoring with national
monitoring initiatives.
Due to lag effects in transport of nutrients through
groundwater, lakes and reservoirs, the full effects of BMPs
often do not show up at river monitoring stations for years or
even as long as decades. Therefore, the monitoring results will
be evaluated along with estimated lag times. Some monitored
watersheds will show quicker response times to BMP
implementation, such as heavily tiled watersheds and
watersheds where phosphorus is less likely to by cycled and
held in reservoirs or stagnant waters.
Water quality and flow analysis will include trends in total load
and flow weighted mean concentrations (FWMC) (see Chapter
3). Both measures are important to understand changes in load
over time and tracking progress toward milestones and goals.
Progress toward achieving eutrophication standards in lakes
and flowing waters also provides a measure for how well the
How soon will the effects of BMPs show
up in the water?
It is difficult to predict when in-
stream conditions will respond to
implementation activities. As a
general rule, larger watersheds are
slower to respond because of the
pollutant transport mechanisms
involved. Watersheds exceeding
5,000 acres generally require
monitoring programs of 10 years or
more to measure the effects of
management measures, although
the exact timeframe depends on a
range of factors, including the type
of problem being addressed, the
monitoring design employed, the
weather during the monitoring
period, and the type and extent of
treatment implemented. HUC 8
major watersheds are much larger
than 5,000 acres.
In rivers fed largely by groundwater,
as opposed to surface runoff or tile
drainage, there can be a lag time of
decades or more before the effects
of nitrate reduction BMPs can be
observed in the river. Groundwater
often moves very slowly toward
streams, whereas tile drainage and
surface runoff pathways to rivers
are much faster.
For phosphorus, a key factor is the
amount of reservoirs and pools of
more stagnant water that exist. In
these pools, phosphorus can settle
and then be released over time back
into the water.
7-10 Chapter 7. Adaptive Management and Tracking Progress
Minnesota Nutrient Reduction Strategy
NRS addresses in-state load reduction goals. Important measures of NRS progress include:
Trend in actual load
Trend in FWMC
Extent of stream and lake eutrophication impairments
Statistical comparisons of baseline loads and concentrations at low, medium and high flow
periods with comparable flow periods during recent years
Extent of groundwater nitrate above drinking water standards in high-nitrate areas, including
those watersheds where nitrate coming from groundwater currently impairs surface waters
When multiple water quality monitoring measures are considered, along with the BMP adoption and
modeling evaluations previously described, then progress toward NRS goals and milestones can be
more accurately assessed.
Watershed Pollutant Load Monitoring Network
The WPLMN is a multi-agency effort that the MPCA leads to measure and compare regional
differences and long-term trends in water quality among Minnesota’s major rivers including the Red,
Rainy, St. Croix, Minnesota, and Mississippi, the outlets of major HUC8 watershed tributaries draining
to these rivers, and select subwatersheds. The network was established in 2007. Site-specific streamflow
data from U.S. Geological Survey (USGS) and Minnesota Department of Natural Resources (DNR) flow
gauging stations is combined with water quality data collected by Metropolitan Council Environmental
Services, local monitoring organizations, and MPCA staff. Annual pollutant loads are computed from
these data at river monitoring sites across Minnesota. The WPLMN is summarized at
http://www.pca.state.mn.us/pyrieeb.
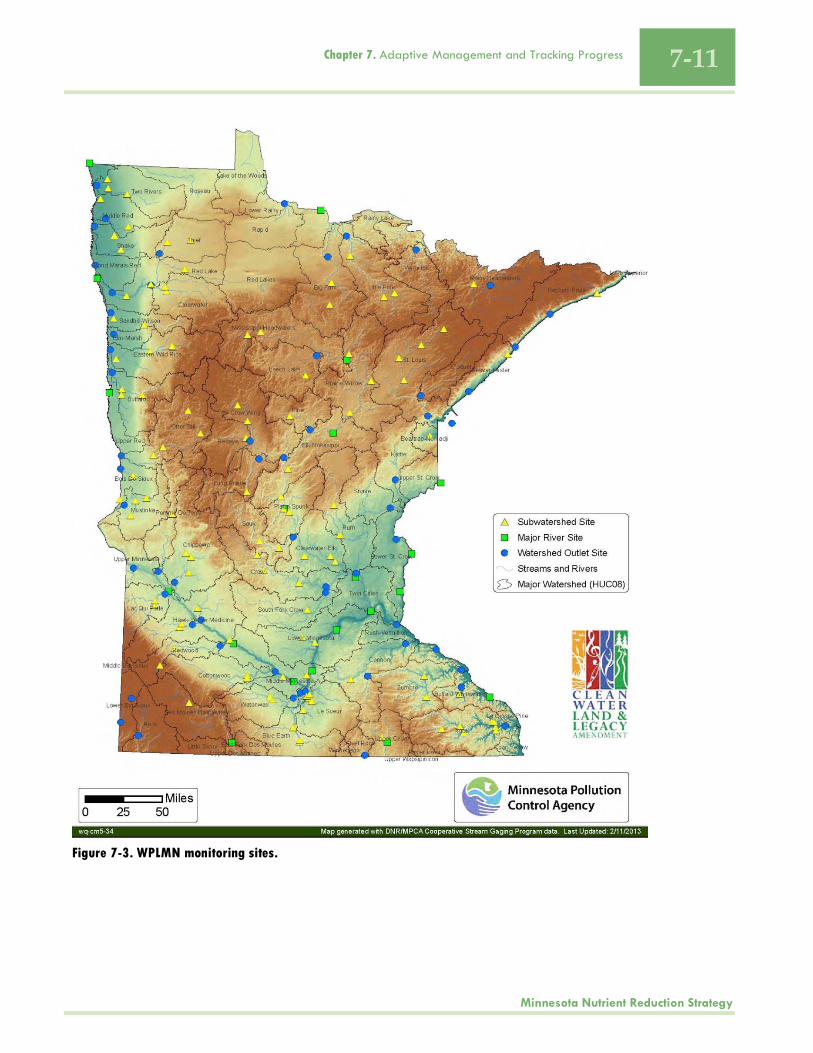
The WPLMN has been collecting water quality at an increasing number of locations since 2007,
reaching 79 major watershed and mainstem river monitoring sites by 2010 (Figure 7-3). The design
scale is focused toward, but not limited to, monitoring HUC8 watershed outlets within the state. By the
end of 2014, about 150 additional subwatershed monitoring sites will be installed to further apportion
pollutant loads. Strategic major river mainstem sites are included to determine basin loads and assist
with statewide mass balance calculations.
7-11 Chapter 7. Adaptive Management and Tracking Progress
Minnesota Nutrient Reduction Strategy
Figure 7-3. WPLMN monitoring sites.
7-12 Chapter 7. Adaptive Management and Tracking Progress
Minnesota Nutrient Reduction Strategy
Pollutant loads are calculated from water quality analysis and daily average discharge data collected at
each site, using the Flux32 software. The software was designed to provide seasonal or annual
pollutant loads and flow-weighted mean concentrations, but enhancements to the program allow the
estimation of daily loads and concentrations. Loads and flow weighted mean concentrations are
calculated annually for total suspended solids, phosphorus, dissolved orthophosphate, nitrate plus
nitrite nitrogen and total Kjeldahl nitrogen. The nitrate plus nitrite nitrogen parameter is added to total
Kjeldahl nitrogen to represent total nitrogen.
This network can be used to track changes in nutrient pollutant load, yields, and mean concentrations
at a major river/basin, watershed, and subwatershed scales.
Sentinel Watersheds
The Selection of Sentinel Watersheds in Minnesota was developed by the University of Minnesota and a
working group consisting of agency and stakeholder representatives in 2013 as part of a project funded
by the MDA. Watersheds at the HUC10 and HUC8 scales were prioritized for long-term, intensive
monitoring. Criteria in the selection process included:
Available historical data
Diversity of landscapes and watershed characteristics
Entities with demonstrated local capacity present
Existing programs could be used to coordinate new activities
Representation of water quantity and quality issues at different scales
Nineteen HUC8 watersheds and eleven HUC10 watersheds were selected as sentinel watersheds.
These watersheds may be used to be used to monitor changes in water quality as a result of
conservation practices on the ground.
Ground Water Monitoring
Long-term ground water monitoring for nitrate conducted by state and local agencies should continue
for public wells, private wells and monitoring wells, so that trends and progress to reduce nitrate levels
can be evaluated. This monitoring should be coordinated with the NFMP and Source Water Protection
Program efforts.
7-13 Chapter 7. Adaptive Management and Tracking Progress
Minnesota Nutrient Reduction Strategy
7.2 Tracking and Communicating Progress Teamwork through the NRS Interagency Coordination Team (ICT) was integral to NRS development
and teamwork will continue to be integral to overall NRS implementation. Accountability has been
given a high priority through the legislatively mandated Clean Water Accountability Act of 2013.
Accountability to the NRS should be integrated and coordinated with those existing coordinating
mechanisms where possible with a subcommittee or adjunct team maintaining the perspective of the
NRS. An Accountability Team could be formed, composed of a person or small group of
implementation coordinators who would oversee the implementation of the NRS with input from
critical program managers, represent NRS interests at a statewide level, lead tracking and reporting
efforts, and oversee adaptive management adjustments to the NRS over time.
The Clean Water Accountability Act of 2013 will guide tracking efforts which may include annual or
biennial reporting on the program measures developed as indicators of implementation progress, as
well as planning and assessment activities triggered at 2 years, 5 years, and 10 years for reassessment,
starting with the NRS implementation kickoff date and working toward the year 2025. Reporting and
NRS updates will be led by an Accountability Team, who may report findings to the Clean Water
Council or Minnesota Legislature. An outline of the tracking steps is outlined below.
First year of NRS (2015)
Determine and initiate appropriate accountability process
Identify Tracking Tool Team (see Section 7.2).
Tracking Tool Team begins implementation of activities included in Section 7.2.
Two-year tracking and reporting (2016)
Agencies and stakeholders develop approaches and plans to achieve BMP adoption goals
Update NRS to incorporate additional implementation activities such as stepped up actions and
tracking tool development.
Evaluate program output and water quality outcomes.
Evaluate implementation progress reported through the 2013 Clean Water Accountability Act to
determine relevance to NRS progress reporting and tracking.
Review progress toward goals and milestones.
Update research for expanding feasible implementation activities (e.g., cover crops and biomass
crops).
Review effectiveness of comprehensive NRS outreach campaign and adjust as necessary.
7-14 Chapter 7. Adaptive Management and Tracking Progress
Minnesota Nutrient Reduction Strategy
Five-year tracking and reporting (2019)
Assess implementation progress through other reporting (e.g., 2013 Clean Water Accountability
Act).
Report on success of implementation activities and strategies and identify needed adjustments to
achieve goals and milestones.
Survey key target audiences to gauge changes in management associated with comprehensive
NRS outreach campaign.
Evaluate program output and water quality outcomes.
Continue to assess voluntary and industry-led implementation activities and associated nutrient
reductions.
Ten-year NRS reassessment tracking and reporting (2024)
Evaluate goals and milestones for future phases of implementation.
Assess changes in natural conditions (e.g., climate and landscape) and potential impact on
reductions.
Establish new higher milestones that will make use of the researched BMPs.
Continue making nutrient reduction progress as new research begins.
Publish updated NRS document.
7.2.1 Approach for Tracking Progress
As described in the previous section, a wide range of data and information is needed to track progress
in meeting the NRS goals and milestones. Synthesizing this array of data and information will require a
coordinated system for tracking nutrient reductions associated with implementation activities. The
previously described program and water quality measures highlight the challenges associated with
compiling the data necessary to quantify implementation activities and nutrient loads. The data
compiled for the suite of programmatic and water quality measures vary in collection methodology
and frequency, documented in the metadata worksheets provided in Appendix F. Data from several
nutrient reduction programs are tracked through grant or program-specific systems such as the
BWSR’s eLink database. Over time, an interagency, integrated tracking tool would provide a more
systematic approach for compiling the data from the various programs to support regular assessments
of the NRS’s progress and reporting to key stakeholders within and outside of Minnesota.
A systematic approach for collecting and analyzing the output and outcome data and information
would be helpful to track and communicate progress over time. The metadata worksheets in Appendix
F provide an initial mechanism for capturing key output information about the suite of NRS measures.
7-15 Chapter 7. Adaptive Management and Tracking Progress
Minnesota Nutrient Reduction Strategy
Updating the metadata worksheets on a regular basis (e.g., annually) will help generate trend
information on the particular BMPs associated with each measure to compare against the BMP
adoption needs identified in Chapter 5. This will require a comparison of the BMPs identified on the
NRS Reduction Summaries for each major basin presented in Chapter 5 with the BMPs associated with
the quantified program measures at the HUC8, basin, and major basin scales. The comparison of these
two components of the NRS will illustrate where BMPs have been implemented at the needed levels
through existing government-based programs. The approach for tracking progress needs to also
account for nongovernment-affiliated BMP implementation and the water quality monitoring findings.
7.2.2 Tools for Tracking Progress
There are a variety of ongoing information technology-related activities taking place within the MPCA
and other key agencies. Under the Clean Water Accountability Act of 2013, MPCA must report
progress toward implementation milestones and water quality goals for TMDLs and, where available,
WRAPS beginning July 1, 2016, with updates on progress made every other year. The MPCA’s
Watershed Data Integration Project (WDIP) is an initiative to improve data sharing among MPCA
programs at a watershed level to support the Minnesota Water Management Framework. WDIP is also
working to develop a template for the TMDL and WRAPS Web-based implementation tables. MPCA
also has a transformation project underway that is converting MPCA’s existing databases to an
enterprise system. These are examples within one agency that will provide information for the NRS. It
is likely that similar data management projects and initiatives key to tracking the NRS’s progress are
also underway within other federal and state agencies. Ongoing and planned information technology-
related efforts provide an opportunity to integrate the NRS’s tracking needs into the design and
development of new and upgraded systems. Similar considerations may be necessary for other
Minnesota agencies with key nutrient reduction programs.
There is currently no integrated tool that will allow for automated tracking of NRS output and outcome
information to assess progress over time. The approach for tracking progress requires developing a tool
to ensure efficient and reliable progress tracking. Developing a tool of this nature will be a multi-
agency undertaking that must take into consideration the existing data management approaches and
numerous programs being uses within several agencies.
An evaluation of the website and tools used to track water quality implementation in the Chesapeake
Bay (ChesapeakeStat) was conducted to determine if this existing tracking tool could provide a
framework to incorporate an effective method for tracking nutrient reduction progress in Minnesota
(Appendix G). ChesapeakeStat was viewed as a potential model for a new tool to communicate with
7-16 Chapter 7. Adaptive Management and Tracking Progress
Minnesota Nutrient Reduction Strategy
stakeholders and watershed managers in Minnesota as well as other states and interested parties.
Analysis performed during the evaluation revealed significant gaps between data required to support a
Chesapeake-style website and the current abilities of state and federal agencies to provide that data.
Future planned work will increase data availability, but significant work remains to be done for
watershed modeling as well as program requirements.
A NRS tracking tool would improve process and information management efficiency among the many
state and federal agencies, as well as local partners, that promote BMP adoption necessary for NRS
success. The recommended approach for a NRS tracking tool is one that would serve as a hub of
information, extracting data from a variety of existing monitoring and program implementation
databases. Using a Web-based interface, the NRS tracking tool would not only present integrated
information from existing databases, but also allow for the input of voluntary BMP information by
private landowners and key local or nongovernmental organizations working with private landowners
(e.g., county soil and water conservation districts, university extension staff, crop advisors).
A brief overview of the recommended tasks for developing this type of NRS tracking tool is provided
below. Appendix H provides more detailed information on the preliminary requirements of
developing this type of tracking system and each task.
Task 1: Identify Tracking Tool Team. A subgroup of existing Interagency Coordination Team
(ICT) members, as well as program data analysts, will provide input on the preliminary system
requirements and aid in refining those requirements.
Task 2: Review Existing Program Measures, Refine Metrics, Select Measures for Tracking
Pilot. The NRS tracking tool team will identify program measures that require updating or
refinement for tracking purposes and select 3—5 measures to use during the pilot phase of the
tracking tool. The metadata worksheets presented in Appendix F should be evaluated to
determine what is adequately measured and areas that are not adequately measured. This
analysis could be used to develop a matrix that identifies which existing tracking efforts are
adequate, what voids exist, and whether a new tracking tool needs to be developed, or if existing
tracking tools can be modified.
Task 3: Analyze Existing Data Management Systems to Support Data Extraction and
Integration. The NRS tracking tool team will collect detailed information on the functionality of
each data management system that will contribute nutrient data to the System, including the type
of system, planned or existing changes, users, maintenance procedures, and other factors that
could influence export of data from the system into the NRS tracking tool.
7-17 Chapter 7. Adaptive Management and Tracking Progress
Minnesota Nutrient Reduction Strategy
Task 4: Identify Data Sources or Approaches for Obtaining Voluntary or Industry-Led BMP
Information. The NRS tracking tool team would work with local partners (e.g., county SWCD
staff, watershed districts, crop advisors, extension staff, and other entities) working with
agricultural producers to improve adoption of conservation practices and BMPs, inventory
voluntary BMPs not associated with governmental programs, and understand existing systems
used to track this information.
Task 5: Conduct Comprehensive System Requirements Analysis. The NRS tracking tool team
would verify the preliminary tracking tool requirements and, as necessary, add other
requirements to inform tool development.
Task 6: Develop NRS Tracking and Accounting System Web Page. The final comprehensive
system requirements analysis would then allow the NRS tracking tool team to proceed with
initial development and piloting of the tool using the 3–5 selected program measures.
Task 7: Long-Term Operations and Maintenance System Plan. In support of the production
deployment of the tool, the NRS tracking tool team should develop an Operation and
Maintenance Plan, which will address staffing, tasks, processes, and tools necessary to ensure
consistent, reliable, and comprehensive production support of the NRS tracking tool.
The timing of the NRS and the associated data tracking needs coincides with several other tracking and
reporting efforts taking place within the state. This allows for the incorporation of the NRS’s tracking
needs into other ongoing system development and refinement projects. Examples of ongoing system
development opportunities that could integrate NRS tracking needs include the following:
MPCA’s Transformation Project. MPCA is currently changing their information systems to a
tempo-based enterprise system. As a result, all program data will be managed in a similar
manner, allowing program data within the agency to be better integrated.
MPCA’s Watershed Data Integration Project (WDIPs). A multiyear data integration project
intended to improve MPCA’s staff handling and sharing of data and information generated
through the watershed management process. (http://www.pca.state.mn.us/index.php/view-
document.html?gid=15386) Through the WDIP, MPCA staff are working with total maximum daily
load and WRAPS program staff to develop a data capture tool to meet a 2016 deadline of making
implementation tables available on MPCA’s website.
Portal. Minnesota agencies are also engaging in a Portal project that would allow better
interagency data sharing. This project is currently in the discovery stage. It would offer the
7-18 Chapter 7. Adaptive Management and Tracking Progress
Minnesota Nutrient Reduction Strategy
opportunity to integrate MPCA’s data systems with those at other key agencies, including the
BWSR, MDA, Minnesota Department of Health, DNR, and the Metropolitan Council.
There is also a need for improved data collection and sharing among Minnesota agencies and key
federal agencies working within the state, specifically Farm Service Agency and Natural Resource
Conservation Service (NRCS). There is also a need for a tracking tool that would allow private
landowners or other local government entities such as counties and SWCDs to provide information on
voluntary conservation practices that are not related to state or federal programs and funding.
7.2.3 Communicating Progress
Communicating the ongoing level of progress can be challenging, especially given that progress is not
evaluated by a single indicator, but rather by a suite of indicators including BMP adoption, modeling
and monitoring. The tracking tool described in the previous section, once developed, could serve as a
way of communicating ongoing progress to interested parties. Until a tracking and communication tool
is developed, Program Output Scorecards could be used which are similar in concept to the report
cards used in the Clean Water Fund Performance Report
http://www.legacy.leg.mn/sites/default/files/resources/2012%20Clean%20Water%20Fund%20Report%20Card_
web%20version.pdf.
The report card can provide both a qualitative and quantitative approach to reporting on progress
toward nutrient reduction goals (Table 7-2). A program measure that is showing negative
implementation trends (e.g., diminished voluntary participation or significant exceedances of a mass
limit) can be represented by a red symbol on the NRS report card. A yellow symbol can represent
programs that have no change in implementation over time. A green symbol can represent programs
that demonstrate progress toward programmatic nutrient reduction goals over time. As NRS
implementation actions are further derived, specific targets can be added to the measures, and the
report card can be updated to reflect quantitative targets.
7-19 Chapter 7. Adaptive Management and Tracking Progress
Minnesota Nutrient Reduction Strategy
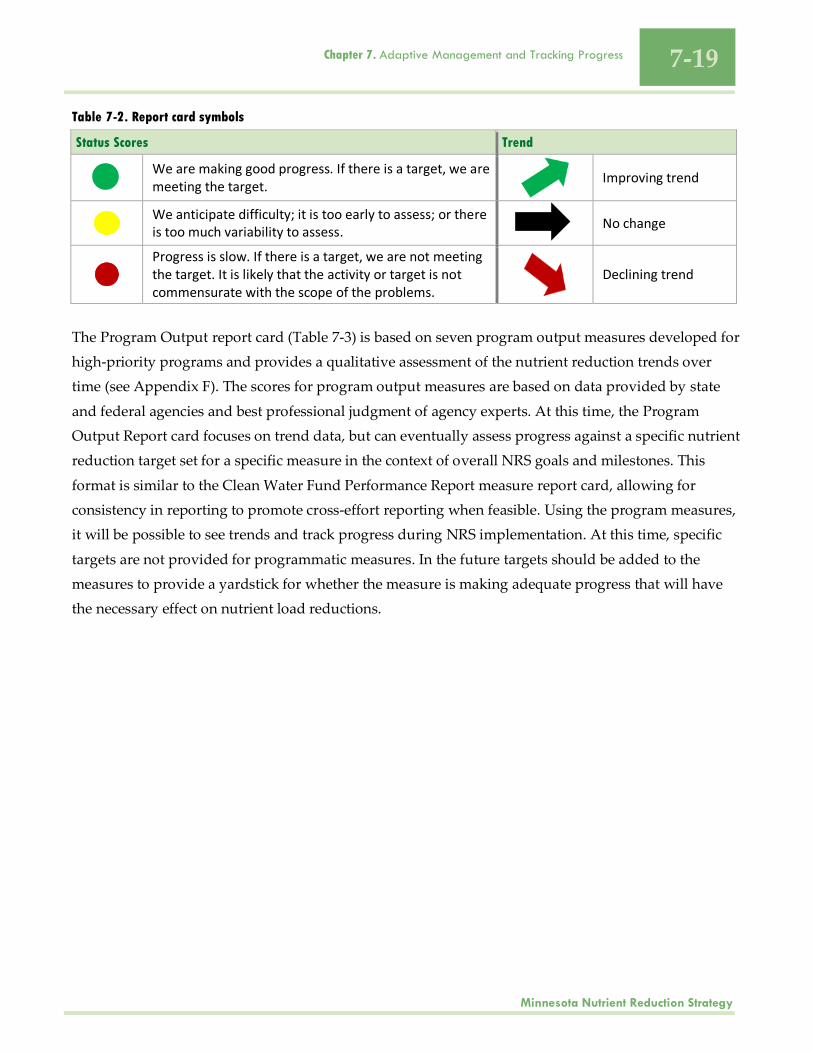
Table 7-2. Report card symbols
Status Scores Trend
We are making good progress. If there is a target, we are meeting the target.
Improving trend
We anticipate difficulty; it is too early to assess; or there is too much variability to assess.
No change
Progress is slow. If there is a target, we are not meeting the target. It is likely that the activity or target is not commensurate with the scope of the problems.
Declining trend
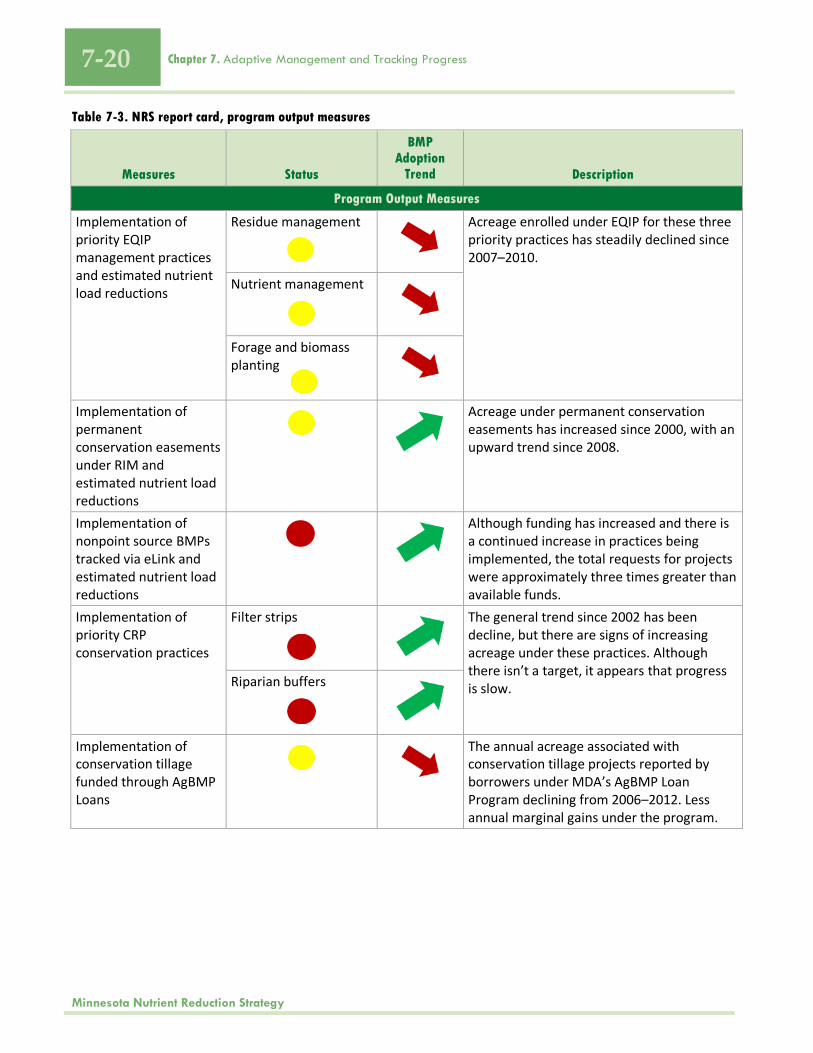
The Program Output report card (Table 7-3) is based on seven program output measures developed for
high-priority programs and provides a qualitative assessment of the nutrient reduction trends over
time (see Appendix F). The scores for program output measures are based on data provided by state
and federal agencies and best professional judgment of agency experts. At this time, the Program
Output Report card focuses on trend data, but can eventually assess progress against a specific nutrient
reduction target set for a specific measure in the context of overall NRS goals and milestones. This
format is similar to the Clean Water Fund Performance Report measure report card, allowing for
consistency in reporting to promote cross-effort reporting when feasible. Using the program measures,
it will be possible to see trends and track progress during NRS implementation. At this time, specific
targets are not provided for programmatic measures. In the future targets should be added to the
measures to provide a yardstick for whether the measure is making adequate progress that will have
the necessary effect on nutrient load reductions.
7-20 Chapter 7. Adaptive Management and Tracking Progress
Minnesota Nutrient Reduction Strategy
Table 7-3. NRS report card, program output measures
Measures Status
BMP Adoption
Trend Description
Program Output Measures
Implementation of priority EQIP management practices and estimated nutrient load reductions
Residue management
Acreage enrolled under EQIP for these three priority practices has steadily declined since 2007–2010.
Nutrient management
Forage and biomass planting
Implementation of permanent conservation easements under RIM and estimated nutrient load reductions
Acreage under permanent conservation easements has increased since 2000, with an upward trend since 2008.
Implementation of nonpoint source BMPs tracked via eLink and estimated nutrient load reductions
Although funding has increased and there is a continued increase in practices being implemented, the total requests for projects were approximately three times greater than available funds.
Implementation of priority CRP conservation practices
Filter strips
The general trend since 2002 has been decline, but there are signs of increasing acreage under these practices. Although there isn’t a target, it appears that progress is slow. Riparian buffers
Implementation of conservation tillage funded through AgBMP Loans
The annual acreage associated with conservation tillage projects reported by borrowers under MDA’s AgBMP Loan Program declining from 2006–2012. Less annual marginal gains under the program.
7-21 Chapter 7. Adaptive Management and Tracking Progress
Minnesota Nutrient Reduction Strategy
Measures Status
BMP Adoption
Trend Description
Program Output Measures
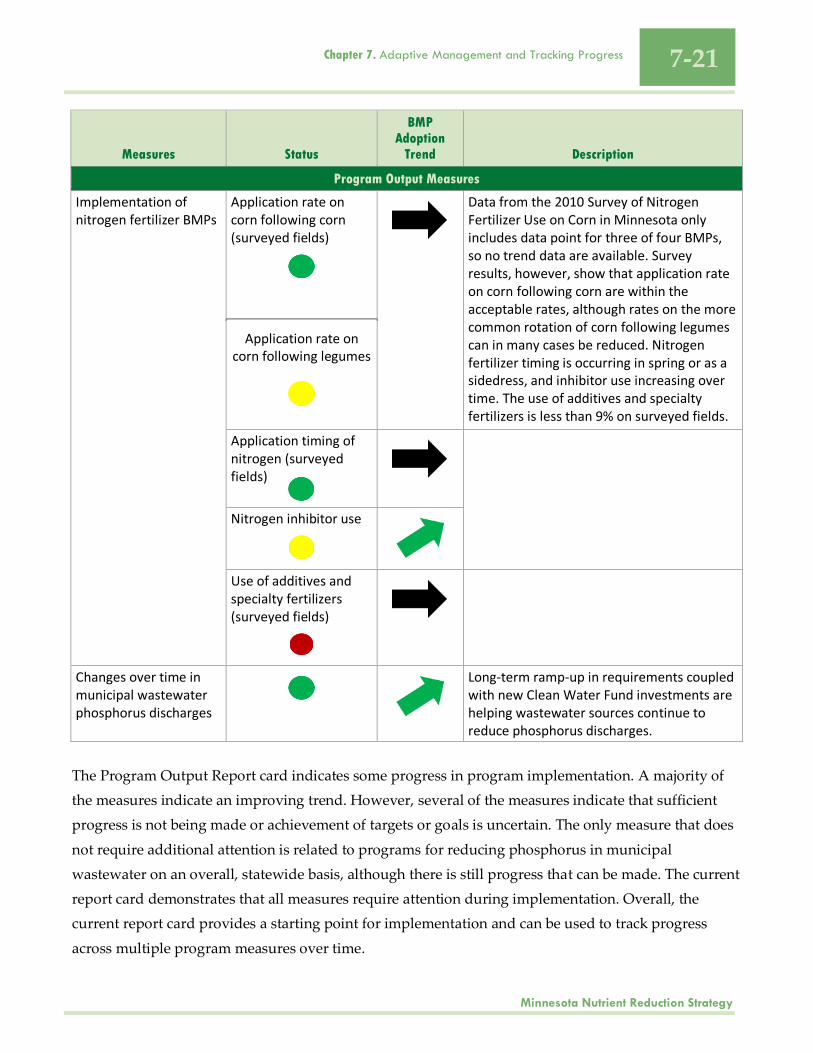
Implementation of nitrogen fertilizer BMPs
Application rate on corn following corn (surveyed fields)
Data from the 2010 Survey of Nitrogen Fertilizer Use on Corn in Minnesota only includes data point for three of four BMPs, so no trend data are available. Survey results, however, show that application rate on corn following corn are within the acceptable rates, although rates on the more common rotation of corn following legumes can in many cases be reduced. Nitrogen fertilizer timing is occurring in spring or as a sidedress, and inhibitor use increasing over time. The use of additives and specialty fertilizers is less than 9% on surveyed fields.
Application rate on corn following legumes
Application timing of nitrogen (surveyed fields)
Nitrogen inhibitor use
Use of additives and specialty fertilizers (surveyed fields)
Changes over time in municipal wastewater phosphorus discharges
Long-term ramp-up in requirements coupled with new Clean Water Fund investments are helping wastewater sources continue to reduce phosphorus discharges.
The Program Output Report card indicates some progress in program implementation. A majority of
the measures indicate an improving trend. However, several of the measures indicate that sufficient
progress is not being made or achievement of targets or goals is uncertain. The only measure that does
not require additional attention is related to programs for reducing phosphorus in municipal
wastewater on an overall, statewide basis, although there is still progress that can be made. The current
report card demonstrates that all measures require attention during implementation. Overall, the
current report card provides a starting point for implementation and can be used to track progress
across multiple program measures over time.
7-22 Chapter 7. Adaptive Management and Tracking Progress
Minnesota Nutrient Reduction Strategy
The program progress included in the above tables does not provide the complete picture of progress,
and additional tables, documents, and communication tools will need to be provided. It is also
important to show progress status with non-governmental program BMP implementation and with
water quality monitoring results.
7.3 Adjust Nutrient Reduction Strategy The ultimate step of the adaptive management process is adjusting the NRS implementation activities
based on the data collection and trend evaluation process to ensure progress toward the NRS goals and
milestones. Adjustments to the NRS could include recommendations for adjusting implementation
guided by the trends seen in the suite of programmatic measures. A formal update of the NRS will be
completed in 2016. A second update would be expected prior to 2025 to incorporate updated
milestones and recent progress.
In addition, adjustments to the NRS could include recommendations guided by research, additional
planning details, BMP adoption progress, programmatic measures, in addition to new water quality
modeling/monitoring information. It will be necessary to document the rationale for any adjustments
to the NRS on the basis of progress evaluation, coordination with program management and water
quality data compiled to support the NRS. Where adjustments are necessary, updated versions of the
NRS will document the changes.