Embed Size (px)
Citation preview

Chapter 7: Computer Integrated Manufacturing Systems
7.1 Introduction(1) In the previous chapters, we have studied various aspects of manufacturing, including- Design: engineering design, design for manufacturing, design for quality and etc.- Planning: process planning (feature recognition, optimization), and systems planning
(scheduling, bill of material, and Material Requirement Planning (MRP))- Machine tools and control: CNC, PLC, bar code, smart card, and etc.- Material handling: conveyor, AGV, warehouse and etc.- Quality control: Taguchi’s quality loss, failure mode and effect analysis (FMEA),
statistic quality control (SPC) and etc.
(2) In this (last) chapter, we will study the manufacturing from a system point of view.
Fig. 7.1: The correlation of the chapter to other chapters
(3) This chapter covers the following materials:- Just-In-Time (JIT) manufacturing (Chapter 11 of the textbook),- Flexible Manufacturing Systems (FMS) (Chapter 12 of the textbook),- Computer Integrated Manufacturing (CIM) (Chapter 13 of the textbook), and- Enterprise integration (Chapter 14 of the textbook).
7.2. Just-In-Time Manufacturing (JIT)(1) What is JIT?- In Chapter 3, we studied the Material Requirement Planning (MRP) system, which
develops a bill of material and a schedule, and releases the order to the shop. Accordingly, the manufacturing is initiated.
7-1
customer customer
Design analysis
Process planning
Material handling
Tooling design and analysis
Machine tool and control
Quality control
Manufacturing Usage and disposal
Design
Manufacturing system

- As shown in Figure 7.2, such a system is a push system, in which the materials (solid line) and information (dash line) flow in the same direction
Fig. 7.2: Illustration of a push system
- The push system is a open-loop system that may create following problems:- It may lead to starvation or excessive stocks simultaneously at different stages
because of imbalances of stocks between the stages.- It may lead to conditions of having excessive equipment and surplus of workers.
- In Japan, the problem is called the 3 Ms problems:- Muda (waste): waste for correction, waster of overproduction, waster for
processing, waste for inventory, waste of motion, waste for waiting, …- Mura (unevenness): uneven workload, uneven schedule, …- Muri (overburden): overburden machine, overburden process, …
- In order to solve these problems, Toyota developed a JIT manufacturing approach, which is a pull system as shown below.
Fig. 7.3:
Illustration of pull system
Note that the information flow serves as a feedback loop that minimizes the 3 Ms problem.
- This approach is called the JIT manufacturing approach.
(2) Kanbans - the basic idea of JIT- In a JIT system, the information feedback is achieved by Kanbans. Kanban is a
Japanese word meaning visible records. But, it has been given a boarder meaning including records, orders and the plans of manufacturing.
- More specifically, kanbans are record cards that travel between preceding and subsequent processes, communicating what parts are needed in the subsequent processes.
7-2
Process 1 Process 1Process 1Raw material
Finished product
Process 1 Process 1Process 1Raw material
Finished product

- Through the Kanbans, the production plan is initiated backwards from the finished product (pull system).
- There are various types of Kanbans, and the following are the most important:- Withdraw Kanbans, which is used to pass the authorization for movement of parts
from one process to another- Production Kanbans, which is used to release an order to the preceding process to
build parts equal to the lot size specifiedA typical example is shown below.
Fig. 7.4:
Illustration of withdraw kanban and production kanban
- The rules for operating Kanbans- Rule 1: no withdrawal of parts without a kanban- Rule 2: the subsequent process comes to withdraw only what is needed- Rule 3: do not send the defectives to the subsequent process- Rule 4: the preceding process should produce only the exact quantity of parts
withdrawn by the subsequent process- Rule 5: smoothing of production- Rule 6: fine tune of production using kanban
- Following figure illustrates how kanbands are worked in a JIT manufacturing system.
Fig. 7.5: Illustration of the paths of Kanbans
7-3
SPS No.
Stock location
PPS No.
Stock location
Part No.Container capacityNo. of kanbans
Part No.Container capacity
Material and Part specification
PPS No.
Stock location
(a) withdraw kanban (b) production kanban
f
e
PPS1
e
fe
f
f
Material flow
Withdrawal kanban
Production kanban

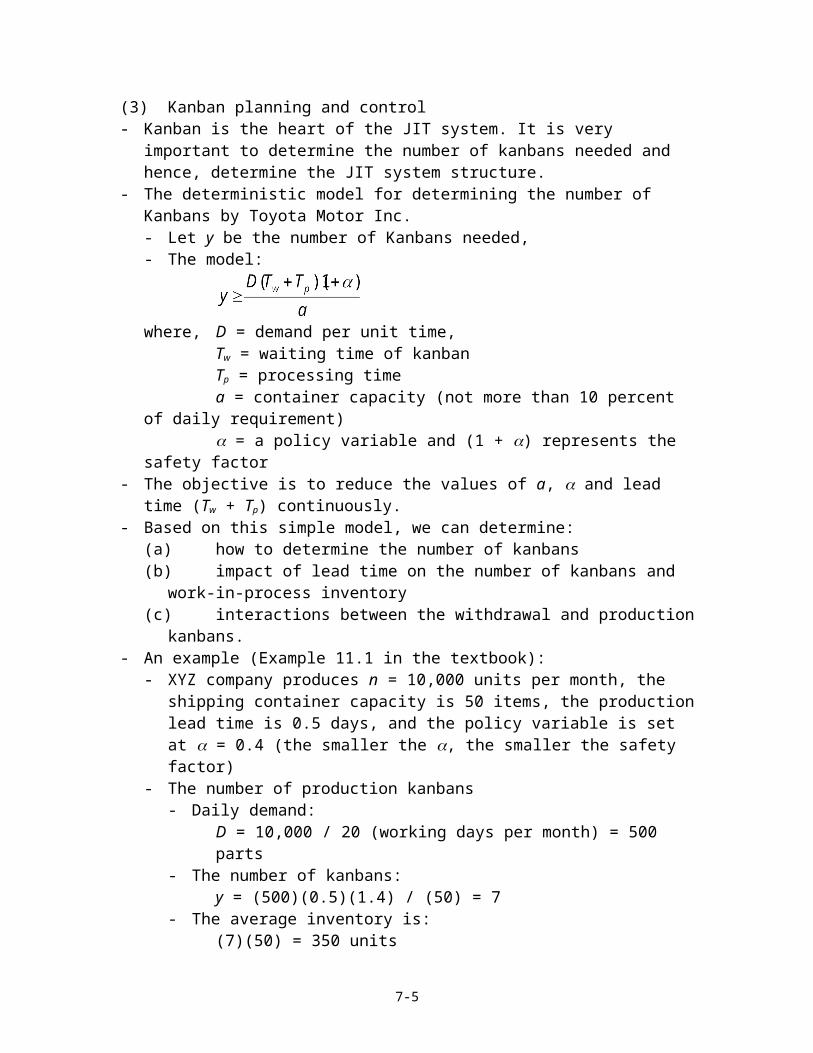
(3) Kanban planning and control- Kanban is the heart of the JIT system. It is very important to determine the number of
kanbans needed and hence, determine the JIT system structure.- The deterministic model for determining the number of Kanbans by Toyota Motor
Inc.- Let y be the number of Kanbans needed,- The model:
where, D = demand per unit time,Tw = waiting time of kanbanTp = processing timea = container capacity (not more than 10 percent of daily requirement) = a policy variable and (1 + ) represents the safety factor
- The objective is to reduce the values of a, and lead time (Tw + Tp) continuously.- Based on this simple model, we can determine:
(a) how to determine the number of kanbans(b) impact of lead time on the number of kanbans and work-in-process inventory(c) interactions between the withdrawal and production kanbans.
- An example (Example 11.1 in the textbook):- XYZ company produces n = 10,000 units per month, the shipping container
capacity is 50 items, the production lead time is 0.5 days, and the policy variable is set at = 0.4 (the smaller the , the smaller the safety factor)
- The number of production kanbans- Daily demand:
D = 10,000 / 20 (working days per month) = 500 parts- The number of kanbans:
y = (500)(0.5)(1.4) / (50) = 7- The average inventory is:
(7)(50) = 350 units
This implies that we can cut down the inventory by cut down the safety margin- Suppose = 0, which implies that a withdrawal kanban must always be delivered
on time, whenever parts are needed; then:y = (500)(0.5)(1) / (50) = 5
at this time, the average inventory is:(5)(50) = 250 units
This implies that we can cut down the inventory by cut down the manufacturing lead time.
- Suppose the production lead time is changed to 1 day, then the number of kanbans needed is:- The number of kanbans:
y = (500)(1)(1.4) / (50) = 14at this time, the average inventory is:
7-4
(14)(50) = 700 units- Example 2 (Example 11.2 in the textbook)
- ABC company produces product Z, which is assembled from two parts, X and Y, also manufactured in the company
- The factory layout is shown in Figure 7.6Fig. 7.6:
factory layout of the ABC company
where, PK-X = production kanban for part XPK-Y = production kanban for part YWK-X = withdrawal kanban for part XWK-Y = withdrawal kanban for part YSA-X = staging area for part XSA-Y = staging area for part Y
- The processing data are given in the table below.
Table 1: An example of production organization using kanbanPart Demand
(units / day)Lead time
(days) Container
capacityAssembly stage
X 2000 1.0 0.00 100Y 800 0.5 0.25 50
Manufacturing stageX 2000 0.5 0.20 100Y 800 1.0 0.00 50
- determining the withdrawal kanbans (the assembly process pulls from the manufacturing process):
7-5
ProcessX
ProcessY
SA-X
SA-Y
AssemblyZ
Preceding processes
Subsequent processesPK-X
PK-Y
WK-X
WK-Y

yX = (2000)(1.0)(1) / 100 = 20yY = (800)(0.5)(1.25) / 50 = 10
- determining the production kanbans (the manufacturing process pulls from the supplier)
yX = (2000)(0.5)(1.2) / 100 = 12yY = (800)(1)(1) / 50 = 16
- now, let us assume that the assembly process is shipped to mainland. As a result, the lead time increases to 4 days. The withdrawal kanbans will be:
yX = (2000)(4)(1) / 100 = 80yY = (800)(4)(1.25) / 50 = 80
but the production kanbans remain the same. This implies that in order to keep the same supply, we must increase the process capability a, which in turn, will increase the total production cause.
(4) A probabilistic cost model for determining optimal number of kanbans- In practice, it is inevitable that the manufacturing systems are affected by various
“random” disturbances, such as machine breakdown, supply shortage, labor absent, and etc. Hence, it is more realistic to develop a probabilistic kanban model for JIT systems.
- Denote:- n = number of kanbans- p(x) = probability mass function for the number of kanbans required- ch = holding cost per container per unit time at a work center- cs = cost of shortage per container per unit time at a work center
- There are two possibilities:- The actual requirement for the kanbans, x, is less than n, and the expected cost is:
Expected holding cost =
- The actual requirement for the kanbans, x is more than n, and the expected cost is:
Expected shortage cost =
- Hence, the total expected cost, TC(n), is:
- It can be shown (in the textbook) that the optimal value n can be obtained from the following equation:
where,
7-6

- An example (Example 11.3 in the textbook)- Suppose the probability mass function of the number of kanbans is known as
follows.
No. of kanbans 0 1 2 3 4 5Probability 0 0.2 0.3 0.35 0.1 0.05
- the holding cost and shortage cost per container per unit time are $50 and $200 respectively
- Solution:- The cost ratio: (cs) / (cs + ch) = (200) / (200 + 50) = 0.8- The probability function:
P(0) = 0, P(1) = 0.2, P(2) = 0.5, P(3) = 0.85, P(4) = 0.95, P(5) = 1
- hence, the optimal number of kanban is n = 3.
(5) Signal Kanban- In the previous kanban models, it is assumed that the setup time is short and hence,
can be neglected. There are however manufacturing processes, such as forging, die-casting, and stamping, in which the setup time is not short. In these cases, a new type of kanban, signal kanban, must be used.
- Figure 7.5 illustrates the process of signal kanbans. - In general, signal kanbans can be further divided into two types:
- raw material ordering kanban: used to withdraw material from the preceding stage (represented by a rectangular in Figure 7.7).
- production ordering kanban: used to trigger the production of a lot at the work center (represented by a triangular in Figure 7.7).
- Signal kanbans are different from standard kanbans. A comparison between standard kanban and signal kanban is as follows:- In the standard kanban process, a production kanban is sent back to trigger
production after every withdrawal of a container- In the signal kanban process, the production kanban is not sent back. Instead, a
production ordering signal kanban is used to minimize the setup time.- There are two important aspects of a signal kanban system:
- The determination of lot size- The position of both production-ordering as well as material-ordering signal
kanbansThe calculations in determining these parameters are the same as the withdraw kanband and production kanban.
7-7

Fig. 7.7:
Illustration of flow of signal kanban
- An example- A stamping plant runs two shifts: 2 x 8 = 16 hrs. / day- The press utilization is 80%: 16 x 0.8 = 12.8 hrs. / day- The rest of the time (20%) is used for setup (die changes): 16 x 0.2 = 3.2 hrs. /
day - Average setup (die change) time is 32 min.: 32 / 60 hrs.- The maximum number of possible setup is 2- The demand for the parts, D: 1400 / day- The safety factor: = 0.2- The minimal lot size per setup is:
Minimum lot size per setup = (Demand)(safety) / (time of setup)or
Minimum lot size per setup = (1400)(1.2) / (2) = 840.- Suppose the size of the container is 100 parts, then the number of containers
needed is:840 / 100 9
- The position of the production-order signal kanban is determined by the kanban cycle time. The kanban cycle time, Tc, consists of several elements such as waiting time, transfer time, and lot processing time. The formula to calculate the position of the production-order signal kanban is as follows:
Production signal kanban position
- Suppose the kanban cycle time is 3 hrs.: 3 / 16 days- The production signal kanban is:
Production signal kanban position = (1400)(1.2)(3/16) / (100) = 3.15 4 containers.
- Similarly, we can calculate the material-ordering signal kanban.
(6) Other related issues
7-8
Raw material inventory storage
Work center Lot
size
B AStandard kanban process
Signal kanban process

- The concept of kanban has been extended greatly to carry out various “feedback” control functions in the manufacturing systems. They all use kanbans, such as- Express kanban- Emergency kanban- …
- It is interesting to know that in additional to push and pull, there are other types of manufacturing models such as:- Periodic pull- Constant work-in-process- Long pull- …
- Finally, there has been effort to combine JIT in purchasing.
7.4 Group Technology(1) What is Group Technology (GT)- GT is a philosophy that recognizing and exploiting similarities in three different ways
- By performing like activities together- By standardizing similar tasks- By efficiently storing and retrieving information about recurring problems
- GT has a number of advantages, such as- A family of products can be manufactured with minimum changes- A complicated product can be decomposed into a number of standard parts (or
systems) and manufactured with minimum additional facilities- GT would result in significant cost saving. It is a basis of cellular manufacturing,
which will be discussed in the subsequent section.
(2) Part features: design features and manufacturing features- In Chapter 3 (process planning), we have discussed the fact that parts have design
features (e.g., a hole), and manufacturing features (e.g., drilling). GT is based on recognizing and using these features.
- A number of GT approaches have been developed to decompose a large manufacturing activity into smaller, manageable system based on similarities of design features and manufacturing features.
- GT approaches can be divided into two categories- Visual inspection method- Coding method
- Visual inspection method is relatively simple. An experienced engineer can examine a part and determine its basic design features (e.g., a hole) and manufacturing features (e.g., drilling). After all, this was the only approach used in the past, and is still effectively used.
- In this section, however, we will focus on the coding method.
(3) Coding methods- Coding refers to the process of assigning symbols to the parts. The symbols represent
the features (both the design features and manufacturing features) of the parts.
7-9

- Coding is for classification – the process of categorization of a set of parts into part families.
- Various coding systems have been developed and these systems can be grouped into three types:- Monocode or hierarchical code: the structure of these codes is like a tree in which
each symbol amplifies the information provided in the previous digit.- Polycode: also known as chain code in which each digit is independent and
describes a specific information- Mixed-mode code: a combination of monocode and polycode.
- We will present a few commonly used codes below.
(4) Optiz classification system- The Optiz classification system is developed at the Technical University of Aachen
for German Machine Tool Association- The Optiz system is one of the oldest systems and you can use it a base to develop
your own.- It is a mixed code system (and hence, rather representative)- The system consists of the following sequence of digits:
12345 6789 ABCDForm code Supplementary code Secondary code
- The code structure and the definition are shown in Figure 12.3 (in the textbook).- An example
Form code 1 3 1 0 6
Interpretation:- First digit = 1: it is a rotation part with 0.5 < L / D < 3 (9.6 / 5 1.9)- Second digit = 3: the external shape has a functional groove- Third digit = 1: the internal shape has a through hole- Fourth digit = 0: the plain surface does not exist- Fifth digit = 6: there are spur gear teeth on the part.- The part is shown in Figure 7.8
Fig. 7.8: A spur gear with Optiz code 13106
7-10

- Note that the code does not contain detailed engineering design information. Instead, it shows the design features. Based on the design features, the manufacturing plan can be determined.
- The benefit of GT:- Help engineering design- Help layout planning- Help design / selection of equipment, tools, jigs and fixtures- Help manufacturing process planning- Help production control- Help quality control- Help purchasing- Help customer services
(5) GT and Cellular Manufacturing- Cellular manufacturing is an application of GT in manufacturing, in which
manufacturing facilities are organized as cells. The parts are similar in their processing requirement, such as operations, tolerances, and machine tool capabilities are manufactured together.
- The objectives of cellular manufacturing are- Reduce setup time- Reduce flow time- Reduce inventories and- Reduce market response time
- Manufacturing cells are natural candidates for JIT implementation.- Cell design is rather complicated in which the following issues must be addressed:
- Selection of part families and grouping of parts in families- Selection of machines and processes and grouping them together- Selection of tools, fixtures and pallets- Selection of material-handling equipment- Choice of equipment layout- Detailed design of jobs- Organization of supporting personnel- Formulation of maintenance and inspection policies- Design of operation procedures- Modification of cost control
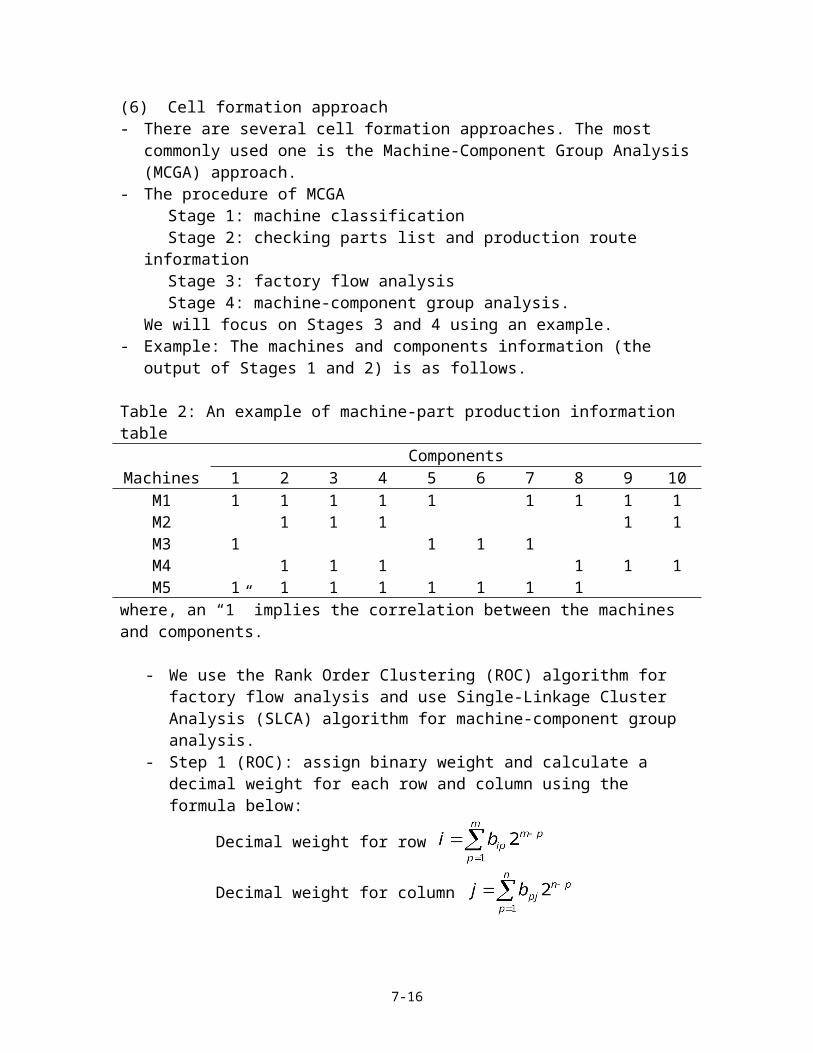
(6) Cell formation approach- There are several cell formation approaches. The most commonly used one is the
Machine-Component Group Analysis (MCGA) approach.- The procedure of MCGA
Stage 1: machine classificationStage 2: checking parts list and production route informationStage 3: factory flow analysisStage 4: machine-component group analysis.
We will focus on Stages 3 and 4 using an example.
7-11

- Example: The machines and components information (the output of Stages 1 and 2) is as follows.
Table 2: An example of machine-part production information tableComponents
Machines 1 2 3 4 5 6 7 8 9 10M1 1 1 1 1 1 1 1 1 1M2 1 1 1 1 1M3 1 1 1 1M4 1 1 1 1 1 1M5 1 1 1 1 1 1 1 1
where, an “1” implies the correlation between the machines and components.
- We use the Rank Order Clustering (ROC) algorithm for factory flow analysis and use Single-Linkage Cluster Analysis (SLCA) algorithm for machine-component group analysis.
- Step 1 (ROC): assign binary weight and calculate a decimal weight for each row and column using the formula below:
Decimal weight for row
Decimal weight for column
where, bip (and bpj) are binary weights. If the jth machine is used to process pth component, bip = 1; else bip = 0. For the data shown above, the resulting decimal equivalents are as follows.
Table 3: The ROC column weighting of the example aboveComponents
1 2 3 4 5 6 7 8 9 10Decimal Binary weight
Machines equivalent 29 28 27 26 25 24 23 22 21 20
M1 1007 1 1 1 1 1 1 1 1 1M2 451 1 1 1 1 1M3 568 1 1 1 1M4 455 1 1 1 1 1 1M5 1020 1 1 1 1 1 1 1 1
Question: suppose the order of the components is changed (e.g., instead of 1, 2, 3, …, 10, we have 10, 9, 8, …, 1), will the result be the same? You are encouraged to think about it.
- Step 2 (RCO): re-arrange rows by sorting the decimal weights in decreasing order and then calculate the column decimal equivalent. For the data above, the result is the following matrix:
7-12

Table 4: The ROC row weighting of the example aboveComponents
1 2 3 4 5 6 7 8 9 10Binary Binary weight
Machines weight 29 28 27 26 25 24 23 22 21 20
M5 24 1 1 1 1 1 1 1 1M1 23 1 1 1 1 1 1 1 1 1M3 22 1 1 1 1M4 21 1 1 1 1 1 1M2 20 1 1 1 1 1Column decimal
equivalent28 27 27 27 28 20 28 26 11 11
- Step 3 (RCO): re-arrange the columns by sorting the column decimal weights in decreasing order. For the data above, the resulting matrix is as follows:
Table 5: The resulting machine grouping in the above exampleComponents
1 5 7 2 3 4 8 6 9 10Binary Binary weight
Machines Weight 29 28 27 26 25 24 23 22 21 20
M5 24 1 1 1 1 1 1 1 1M1 23 1 1 1 1 1 1 1 1 1M3 22 1 1 1 1M4 21 1 1 1 1 1 1M2 20 1 1 1 1 1
- Step 4 (RCO): repeat steps 2 and 3 until there are no changes in row and column positions. This completes the factory flow analysis. For the data above, there is no change in further iteration.
- Step 5 (SLCA): compute similarity coefficients for all possible pairs of machines. Several similarity measures have been used, and one of them is the single-linkage cluster analysis (SLCA). According to SLCA, the similarity coefficient between two machines is defined as the ratio of the number of parts visiting both machines and the number of parts visiting one of the two machines as follows:
where, Xijk = operation on part k performed both on machines i and j;Yik = operation on part k performed on machine i;Zjk = operation on part k performed on machine j.
For the data above, the similarity coefficient between machines 1 and 2 is calculated below:
7-13

Number of operations performed both on machines 1 and 2: 5Number of operations performed on machine 1: 9Number of operations performed on machine 2: 5S12 = (5) / (9 + 5 – 5) = 0.556
The calculation results are summarized in the following table:
Table 6: The similarity measure of different cell formationM1 M1 M1 M1 M2 M2 M2 M3 M3 M4
Machines M2 M3 M4 M5 M3 M4 M5 M4 M5 M5Similarity 0.55 0.30 0.67 0.70 0.00 0.83 0.30 0.00 0.50 0.40
Note that there are other similarity measures, for example:
The result should be similar (but no the same).
- Step 6 (SLCA): select the machine pair that has the largest similarity and use them to form the first cell. For the data above, it is M2 – M4.
- Step 7 (SLCA): select the machine pair that the second largest similarity and use them to form the second cell. Note that if one of the machines has been used for a cell, form the cell by using the machine and the cell. For the data above, it is M1 – M5.
- Step 8 (SLCA): repeat Step 7. For the data above, in the first iteration the cell formation is M4 – M2 and M5 – M1. In the second iteration, the cell formation is made of M5 – (M4 – M2) and M5 – M1. The result is a dendrogram as shown in Figure 7.10. The final cell formation is shown in the table as well.
Fig. 7.10: The
dendrogram for the data above.
7-14
1.00
0.830.700.67
0.50
0.30
0.00
M4 M2 M5 M1 M3

The actual cell formation depends on the threshold value. For example, if the threshold is set at 0.8, only M4 and M2 will form a cell. On the other hand, if the threshold is set at 0.5, all the machines will form a cell. The following table summarizes all the possible cell configurations.
Table 7: A summary of different cell configurationsSimilarity coefficient
Number of cells formed
Cell configuration
1.00 5 (M1), (M2), (M3), (M4), (M5)0.83 4 (M2, M4), (M5), (M1), (M3)0.70 3 (M2, M4), (M1, M5), (M3)0.67 2 ((M1, M2, M4, M5), M30.5 1 (M1, M2, M3, M4, M5)
(7) Evaluation of cell design.- In the previous section, the remaining problem is to determine which cell design is
the best. - The goal of cell design is to minimize the part motion cost during the manufacturing.
Note that there are two types of moves: - Inter-cellular moves: parts move within a cell- Intra-cellular moves: parts move among the cellsThey bear different cost of motions.
- The following factors influence the part motion cost:- The layout of machines in a group- The layout of machine groups- The sequences of parts through machines and machine groups
- In general, the expected distance a part moves between two machines:D = dk
where, k = number of moves between two machines, d = expected distance moved between two machines, In particular, for a straight line layout, the expected distance moved is:
where, N is number of machines in the group. For rectangle layout, the expected distance moved is:
where, M is number of rows and L is number of machines in each row. For square layout, the expected distance moved is:
- The total distance moved in jth cell for the ith configuration:
7-15
- The total cost of inter- and intra-cellular movements (TC) for the ith configuration:
where, C1 = cost of an inter-cell movement, C2 = cost per unit distance of an intra-cell movement, and Ni = number of inter-cell movements for ith configuration.
- Continuing the above example, let us consider the cell formation [(M2, M4), (M1, M5), (M3)], assuming:- All the machines are lined in a straight line- The number of moves between (M2, M4) is 5 (as seen from the table)- The number of moves between (M1, M5) is 7 (also seen from the table)- C1 = $2.00 and C2 = $1.00Hence, the total distance of moves, TD, is as follows:
D3 = (5)(2 + 1)/3 + (7)(2 + 1)/3 + 0 = 12
Also, it can be seen that there are 10 intra-cell moves. Hence, the total cost is:TC3 = ($2)(10) + ($1)(12) = $32
- The following table summarizes the total cost of moves under different cell formations. From the table, it is seen that best formation is 3. In other words, we shall use the 3-cell design, which will minimize the material handling cost.
Table 7: The operating cots of different cell configurationSimilarity coefficient
Number of cells formed
Cell configuration Total cost
1.00 5 (M1), (M2), (M3), (M4), (M5) (2)(22)+(1)(0) = 440.83 4 (M2, M4), (M5), (M1), (M3) (2)(18)+(1)(5) = 410.70 3 (M2, M4), (M1, M5), (M3) (2)(10)+(1)(12) = 320.67 2 ((M1, M2, M4, M5), M3 (2)(4)+(1)(30) = 380.5 1 (M1, M2, M3, M4, M5) (2)(0)+(1)(44) = 44
(8) Solving the bottleneck problem- In cellular manufacturing, some parts must be processed using more than one cell.
For instance, in the example about, Part 2, 3 and 4 must be processed by two cells. This may cause overburden for the machine and the transportation. This problem is called the bottleneck problem.
- Bottleneck problem can be solved by- Generating alternative process plans- Duplication of machines- Subcontracting operations.
7.5. Flexible Manufacturing Systems(1) Introduction
7-16

- Flexible Manufacturing Systems (FMS) is a strategic approach to answer the competitive global manufacturing challenge
- FMS is made possible by advanced technologies such as CAD, CAM, CAPP, CIM, GT and etc.
- In this section, we will briefly describe the basics of FMS including- Flexibility- Volume-variety - Layout- Part / tool management
(2) Flexibility- Flexibility can be defined as a collection of properties of a manufacturing system that
support changes in production activities or capabilities- A number of types of flexibility have been discussed including
- Machine flexibility: use multi-purpose CNC machines- Routing flexibility: use CAPP- Process flexibility: use multi-purpose CNC machines- Product flexibility- Production flexibility- Expansion flexibility
(3) Volume-Variety- There are five types of manufacturing systems:
- Transfer line- Stand-alone CNC machine- Manufacturing cell- Special manufacturing system- Flexible manufacturing system.
- Different systems have different characteristics and hence, suit for different products and production types.
- Key characteristics of various manufacturing systems- Transfer line- Flexible manufacturing module- Manufacturing cell- Special manufacturing systems- Flexible manufacturing systems
7-17

Fig. 7.7 The
characteristics of different types of manufacturing methods
- The key characteristics of various manufacturing systems
(4) What is FMS- An FMS is an automated, mid-volume, mid-variety, central computer-controlled
manufacturing system.- The essential physical components of the FMS are:
- Independent CNC machines capable of performing multiple functions and having automated tool changer
- Automated material-handling system to move parts between machines and fixtures
- All components are computer-controlled- Equipment such as coordinate measurement machines and part-washing devices
- An FMS consists of two subsystems:- Physical subsystem- Control subsystem
- Some examples are shown in the textbook
(5) Operation problems in FMS- The operation problems in FMS include
- Part selection and tool management- Fixture and pallet selection- Machine grouping and loading (part and tool assignment)
- Part selection and tool management methods- There are several methods available. - The mathematical programming approach (Hwang’s model). Let:
i = 1, 2, …, N = part typesc = 1, 2, …, C = tool typest = tool magazine capacity
dc = number of slots required to hold tools in the tool magazine of each machine
7-18
productivity Transfer line
FMS
CNC machines
flexibility

Note that zi and yc are decision variables. The goal is:
subject to:
biczi yc, for all i, czi = 0 or 1, for all i, cyc = 0 or 1, for all i, c
- After the parts and tools are selected, one must determine the tool allocation problem. There are several different policies for tool allocation- Bulk exchange policy: change all the tools according to a preset schedule- Tool migration policy: change the tools once the parts are processed- Resident tooling policy: allocate the tools according to the similarity and change
the tools only when they worn out. The tool allocation algorithm is the same as the machine allocation algorithm discussed in the previous section.
- Tool sharing policy: combine bulk exchange and resident tooling policies.- Fixture and pallet selection
- Fixture is the interface between the machine and the material-handling system.- The use of palletized parts is very important in the integration of machines,
material-handling equipment and storage facilities.- The fixture and pallet selection problem can be considered as a subset of the part
selection problem. The approximate number of pallets required is:
where, PR = parts required per shiftCT = average pallet cycle timePT = planned production time per shiftNP = number of parts per pallet
- Machine grouping and loading- The machine grouping and loading problem refers to grouping of machines and
allocation of operations and tools required for the selected part types.- A number of criteria have to be considered:
- Balance the assigned machine processing times- Minimize the number of movements from machine to machine- Balance the workload per machine in the system- Fill the tool magazines as densely as possible- Maximize the number of weighted operations.
7.6 Computer Integrated Manufacturing and Enterprise Integration(1) An introduction to Computer Integrated Manufacturing (CIM)
7-19

- According to SME, CIM is the integration of the total manufacturing enterprise through the use of integrated systems and data communications coupled with new managerial philosophies that improve organizational and personal efficiency.
- CIM is made possible by the computer technology today and has many advantages over the traditional manufacturing systems.
- A step forward is enterprise integration.
(2) The idea in enterprise-wide integration is to integrate people, technology, business processes, customers and suppliers located at dispersed geographic locations.
- There are three essential tools for enterprise integration:- Network communication- Database management systems- Group-ware.
- In this section, we will briefly introduce these tools, following by a discussion on the framework of CIM.
(3) Network communication- Terminology used in network communication
- Hertz (Hz): number of cycles per second- Baud: number of signals per second- Data rate: number of bits sent per second (bps)- Channel: a logic communication path- Bandwidth: the band of frequency used by a communication path- Channel capacity: number of bits that can be transmitted per second- Interoperability: two systems work with each other through interface- Local area network: LAN is used to interconnect local computers at 100 Mbps- Wide area network: WAN is used to connect remote computers at 1.5 Mbps- Metropolitan area network: MAN is large LANs that connects LANs
- The communication network is the backbone of enterprise integration- In general, there are three levels of communication in a company, and each require a
different type of network:- Device level at the shop floor – sub-network connects individual devices such as
machine tools and robots- Plant level – local area network (LAN) connects manufacturing cells and
departments- Enterprise level – wide area network (WAN) or Metropolitan area network
(MAN) links various plants / sites and interconnect corporations through data exchange protocols.
- Network topology: the general physical layout of the network is called network topology. As shown in Figure 7.9, there are four types of network topology:- Star- Ring- Bus- Tree
7-20

Fig. 7.9: Illustration of network topology
- The network access control: there are several commonly used method for network access control- Carrier Sense Multiple Access with Collision Detection (CSMA/CD) or Ethernet
(IEEE 802.3 standard). Physically, two ethernet coaxial cables are connected together using a repeater (an amplifier). Through the cables, the ethernet cards can send and receive packets. Figure 7.10 shows the format of CSMA/CD. It is a series communication link. While one computer sends a message the other one waits. While two computers sends message together, it may crash. CSMA/CD is widely used in manufacturing because of its simplicity.
Fig. 7.10:
CSMA/CD frame format
- Token ring (IEEE 802.5 standard) and Token bus (IEEE 802.4 standard) are designed to resolve the communication crash problem. They use multiple coaxial cables to connect the computers into a ring. So when a communication path is busy the other one can take over.
7-21
preamble Destination address
Source address
data pad Check-sum
Start of frame delimiter
Length of data field
Bytes7 21 2 or 6 2 or 6 0-1500 0-46 4

- The network protocol- The interpretation of the transmitted data among a network is done based on
network protocol.- A protocol is a set of rules of information exchange between two devices- According to ISO/OSI (open system interconnection), protocols can be divided
into seven layers:- The physical layer: specifies the hardware- The data link layer: handles the data transformation such as synchronization,
error control and flow control- The network layer: decides the paths of the information in the network- The transport layer: establishes the connection, initiate the data transfer and
manage the data transfer- The session layer: controls communication- The presentation layer: coding and decoding- The application layer: user interface
- Based on ISO/OSI, several different protocols have been developed. For example, the Manufacturing Automation Protocol (MAP) is developed by General Motors Co. The most commonly used protocol is however, the Transmission Control Protocol / Internet Protocol (TCP/IP) developed by US Dept. of Defense. TCP/IP suit now consists of several protocols including Telnet, FTP, Network file systems (NFS), and simple mail transfer protocol (SMTP).
- Network hardware. In addition to the computers, various hardware devices are needed in network connections. These include:- Reapeater: circuit used to connect the devices with same protocols- Bridge: circuit used to connect two similar or dissimilar LANs- Routers: a combination of both repeater and bridge- Gateway: a special purpose computer that does the protocol conversions.
- Network performances. The network performances can be measured by the following criteria: network availability and response time.- Network availability can be determined based on the reliability theory. If there are
n components connected in series and the their probability of being available is ai, i = 1, 2…, n, then the system availability is:
On the other hand, suppose the n components are connected in parallel, the system availability is:
- the response time is determined by the summation of service time and waiting.
(4) Database management- Basic terminology
- Date item: the smallest unit of data- Data record: a collection of data items- File: a collection of similar date records
7-22

- Data base: a collection of files as an organized assembly of information that users can access for various purposes.
- Data model: a logic representation of a collection of data elements. It is the building block for databases.
- In modern engineering, a great deal amount of information is required for any task to be accomplished. Imaging that a manufacturing company producing simple gears. The following data must be available:- Work material- Dimensions, surface finish and tolerance- Machines to be used in manufacturing- Tools- ….Therefore, it is very important to have a proper database management system.
- Data model. There are two types data models:- Record based models, which can further decomposed as network model,
hierarchical model, and relational model.- Object-oriented models
- In recent years, object-oriented models become dominant. The object-oriented model is based on following important concept.- Object: any physical or imagery entities may be referred to as an object- Attribute and methods: objects are characterized by attributes, which may include
its intrinsic properties or its relationship with other objects. A method is an operation applied to the objects.
- Message: a method is invoked by a client by sending a message to the object.- Class: objects can be categorized into classes, which describes the common
behavior of the object with respect to its family.- For those who have learnt the object-oriented programming (C++), the above
concepts should be easy to follow. Following is an example- Object: robot- Class:
Class name: robotAttribute: robot_id
Robot_typeMethod: move
PickupDrop off
- A particular instance is:Class name: PUMP1Attribute: 1023
ArticulateMethod: Pickup(Work1)
Note that “Work11” is another object (a workpiece), the interactions between the two objects are defined by the operation (association) “Pickup”.
- The procedure of designing an object-oriented database system is as follows:(a) develop a conceptual model of the system by identifying key objects
7-23

(b) associate attributes and methods with each object identified in step 1(c) arrange objects into a class inheritance hierarchy(d) refine the hierarchy by emphasizing, specialization, and generalizing(e) identify client-server relationships and message exchanges among objects to
capture system dynamics(f) develop a prototype implementation to validate requirements(g) refine the system design iteratively by modifying or adding objects, attributes,
operations, or associations.
(5) Groupware- Groupware is the networked hardware and software that allow people to support each
other in their effort to achieve work goals regardless of where and when they want to do this.
- Groupware shall have consider the following issues- Re-eneineer, re-tool, re-size, re-invent, re-manufacture, …- Teamwork, virtual teaming- Focus on customer needs- Focus on core competencies- The network enterprise- Flatter, leaner organizations- Drive for efficiency and productive gain.
- Tow of the most important groupware handware tools are email and networking.- Also, now there are several software systems that can be used as groupwares, such as
I-DEAS, Unigrphics, and ProEngineering.
By now we have pretty much described all the important technologies used in modern manufacturing systems. These technologies will help you to understand and hence, to solve the practical problems in manufacturing systems. If you have any problems, please do not hesitate to contact me at the following address.
Ruxu DuDept. of Industrial EngineeringUniversity of MiamiCoral Gables, FL 33102U. S. A.
7-24