Embed Size (px)
Citation preview
Chapter 7Lesson 7.6
Random Variables and Probability Distributions7.6: Normal Distributions
Special Distributions
Two Discrete Distributions:Binomial and Geometric
One Continuous Distribution:Normal Distributions
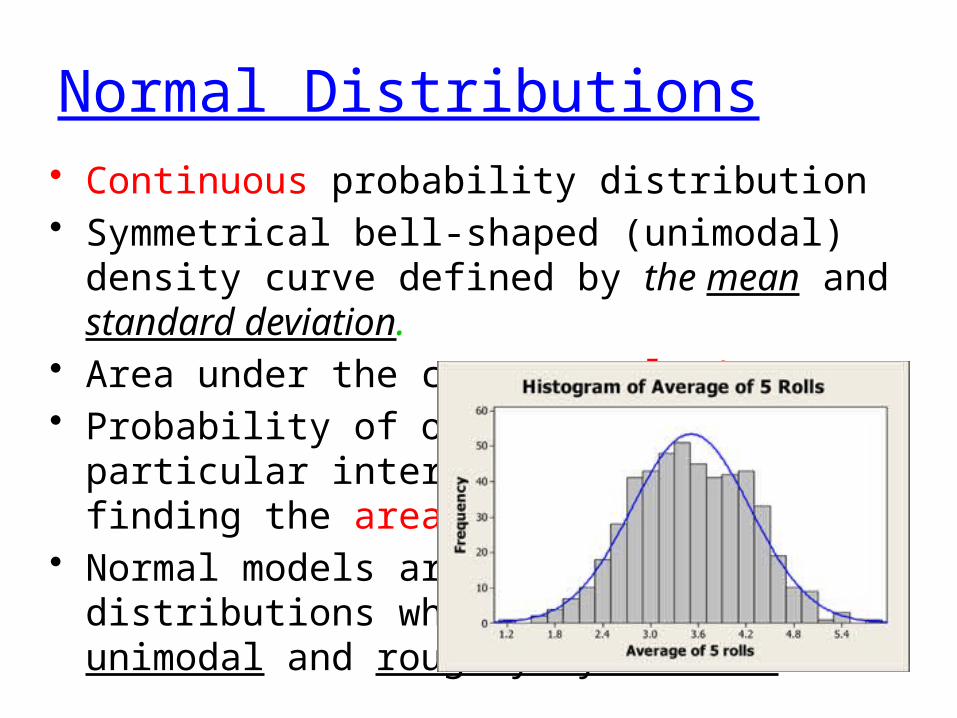
Normal Distributions• Continuous probability distribution• Symmetrical bell-shaped (unimodal) density curve
defined by the mean and standard deviation.• Area under the curve equals 1• Probability of observing a value in a particular
interval is calculated by finding the area under the curve
• Normal models are appropriate for distributions whose shapes are unimodal and roughly symmetric.
Copyright © 2007 Pearson Education, Inc. Publishing as Pearson Addison-Wesley
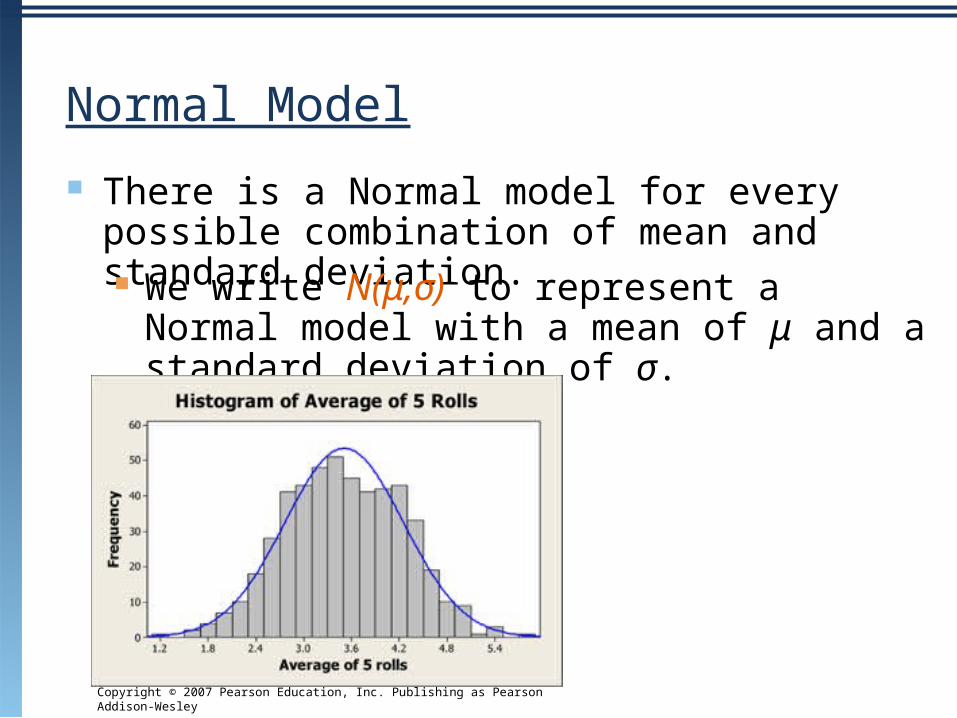
Normal Model
There is a Normal model for every possible combination of mean and standard deviation. We write N(μ,σ) to represent a Normal model
with a mean of μ and a standard deviation of σ.
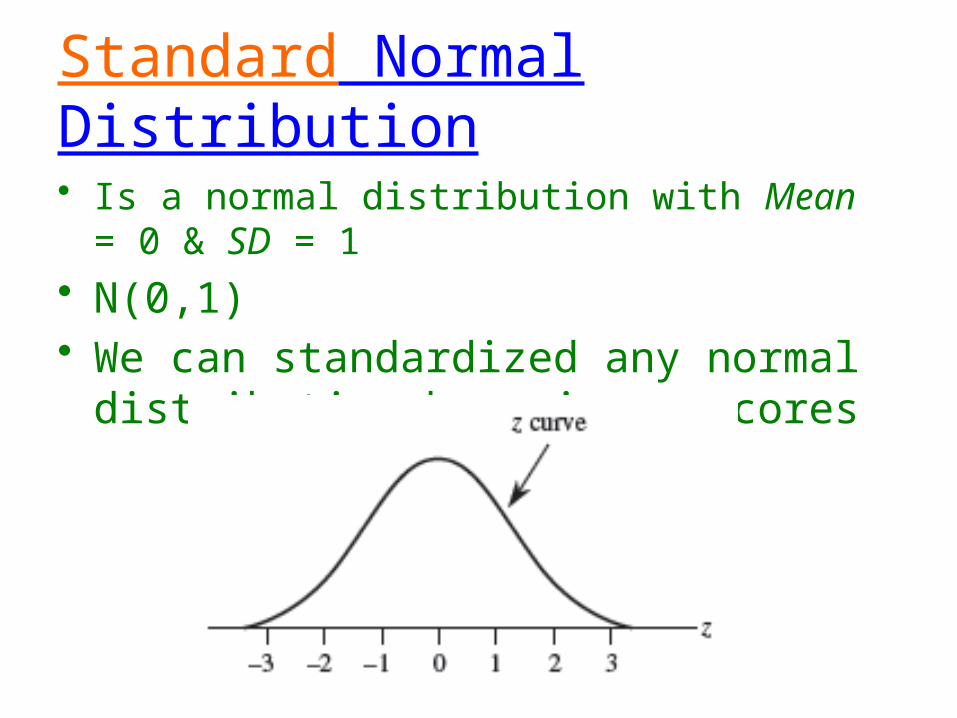
Standard Normal Distribution
• Is a normal distribution with Mean = 0 & SD = 1• N(0,1)• We can standardized any normal
distribution by using z-scores
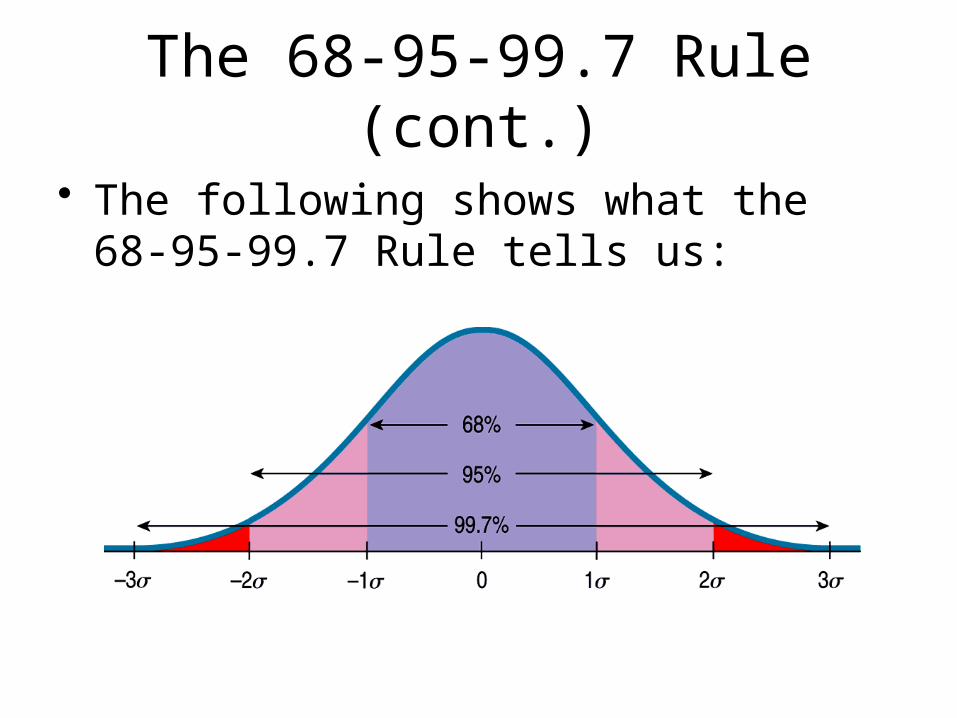
The 68-95-99.7 Rule (cont.)
• The following shows what the 68-95-99.7 Rule tells us:
Copyright © 2007 Pearson Education, Inc. Publishing as Pearson Addison-Wesley
Finding Normal Percentiles by Hand
When a data value doesn’t fall exactly 1, 2, or 3 standard deviations from the mean, we can look it up in a table of Normal percentiles.
Appendix A Table 2 (pg.862) provides us with normal percentiles, but many calculators and statistics computer packages provide these as well.
Copyright © 2007 Pearson Education, Inc. Publishing as Pearson Addison-Wesley
Finding Normal Percentiles by Hand (cont.)
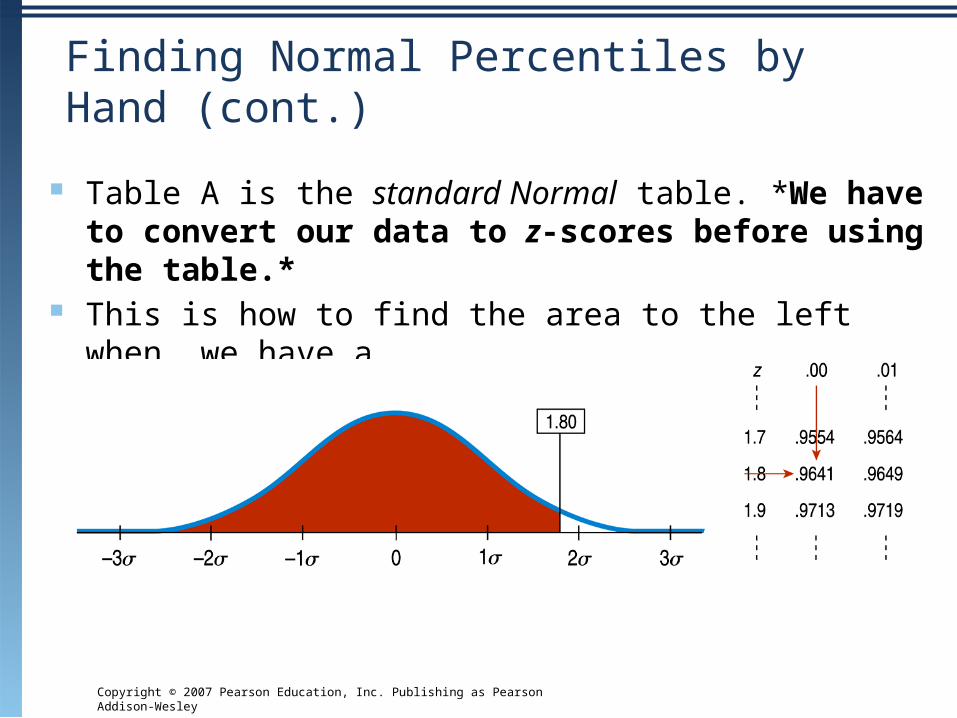
Table A is the standard Normal table. *We have to convert our data to z-scores before using the table.*
This is how to find the area to the left when we have a
z-score = 1.80
Copyright © 2007 Pearson Education, Inc. Publishing as Pearson Addison-Wesley
Finding Normal Percentiles Using Technology (cont.)
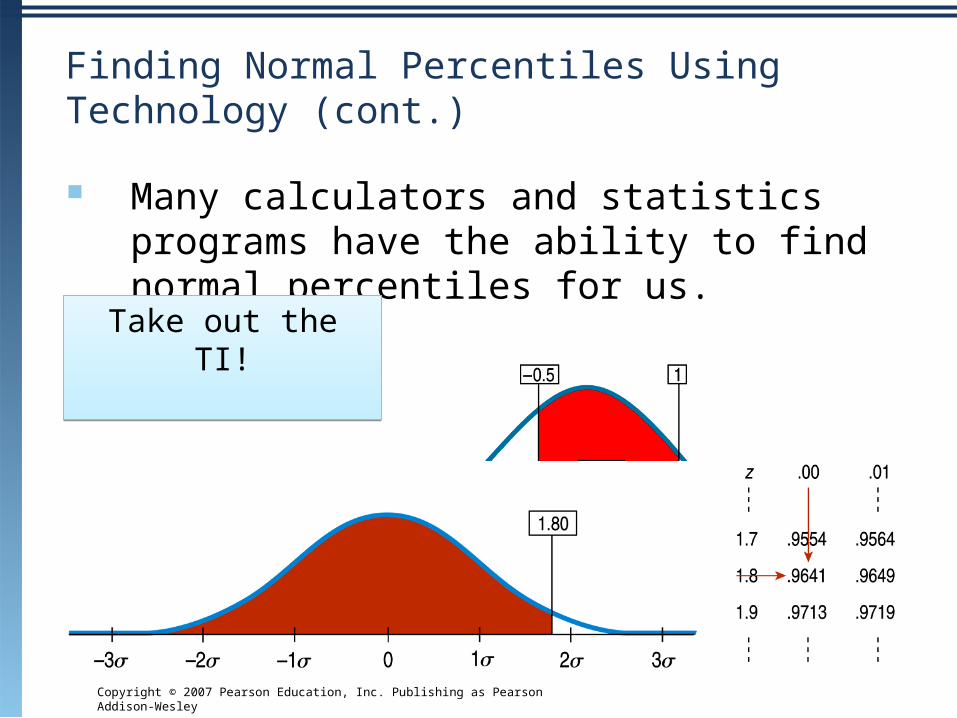
Many calculators and statistics programs have the ability to find normal percentiles for us.
Take out the TI!Take out the TI!
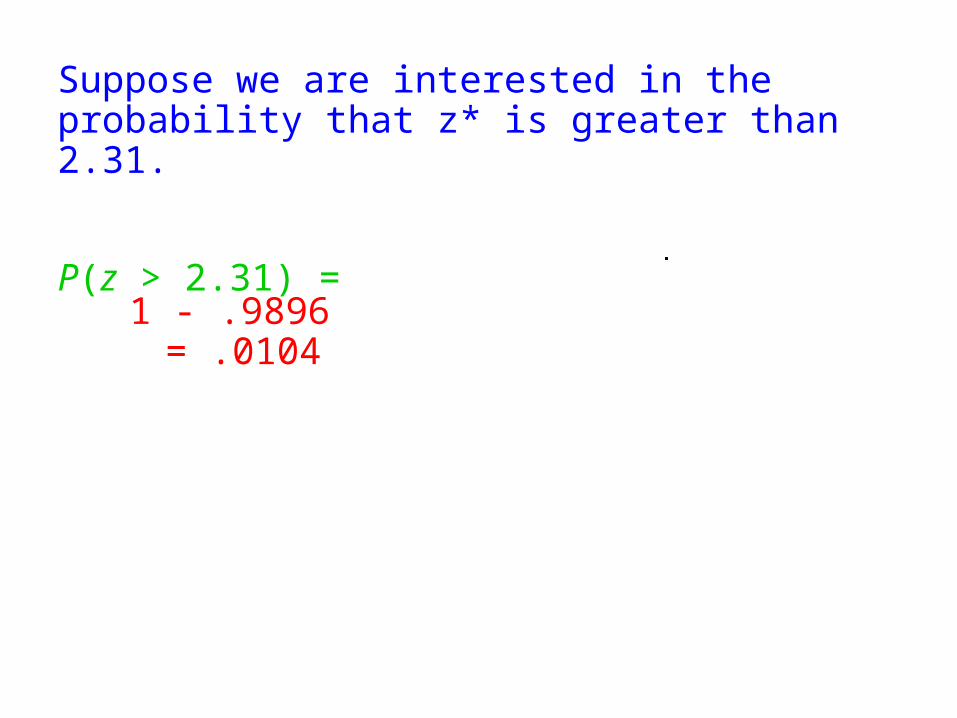
Suppose we are interested in the probability that z* is greater than 2.31.
P(z > 2.31) =
1 - .9896 = .0104
Copyright © 2007 Pearson Education, Inc. Publishing as Pearson Addison-Wesley
From Percentiles to Scores: z in Reverse
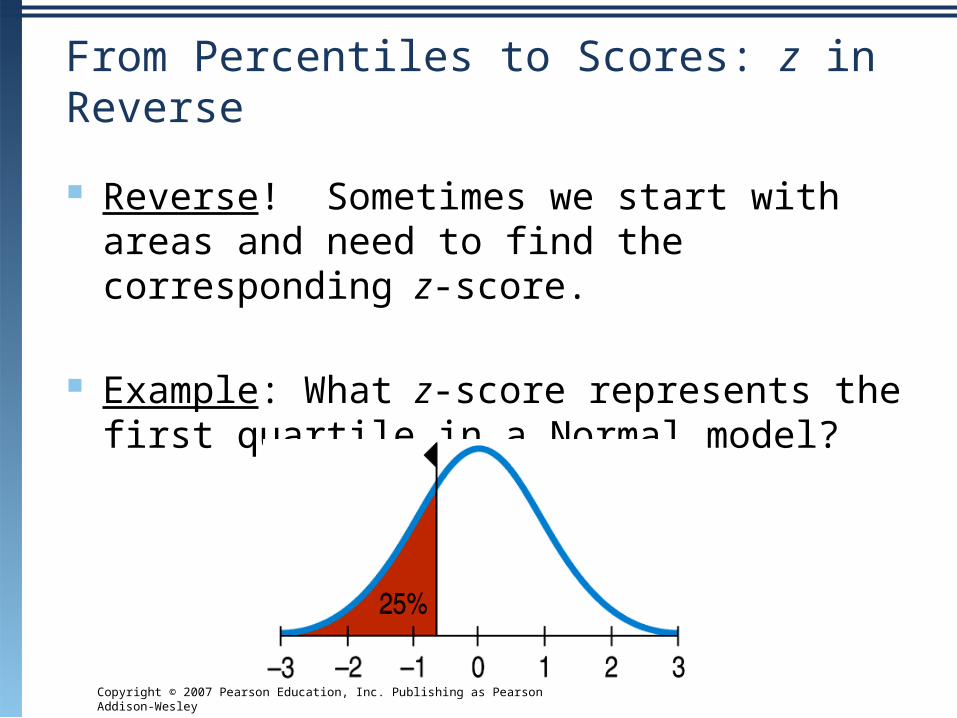
Reverse! Sometimes we start with areas and need to find the corresponding z-score.
Example: What z-score represents the first quartile in a Normal model?
Copyright © 2007 Pearson Education, Inc. Publishing as Pearson Addison-Wesley
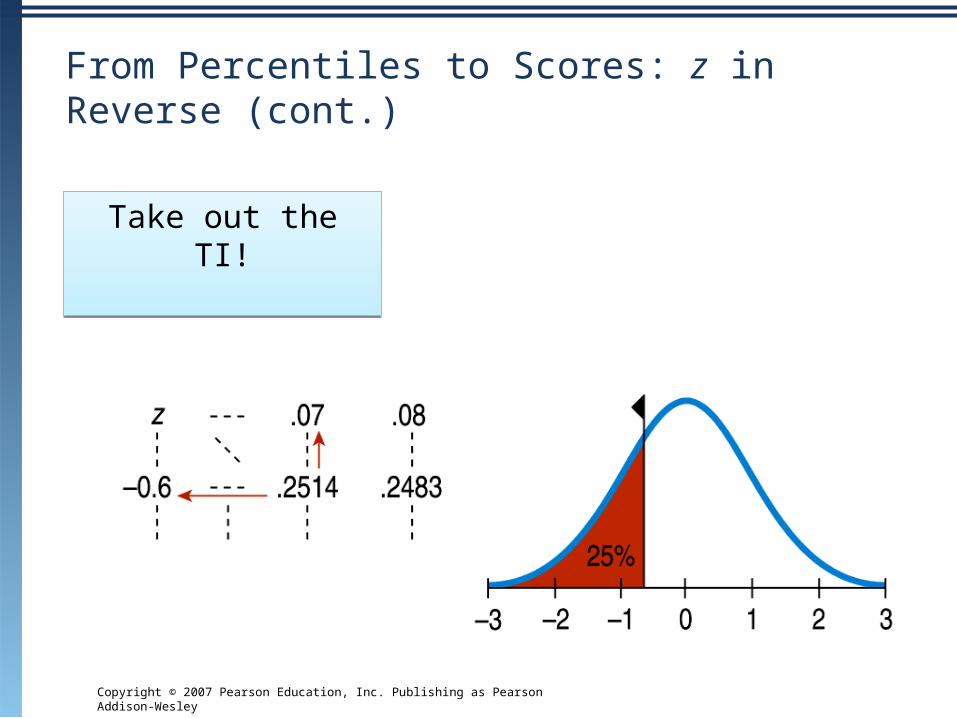
From Percentiles to Scores: z in Reverse (cont.)
Take out the TI!Take out the TI!
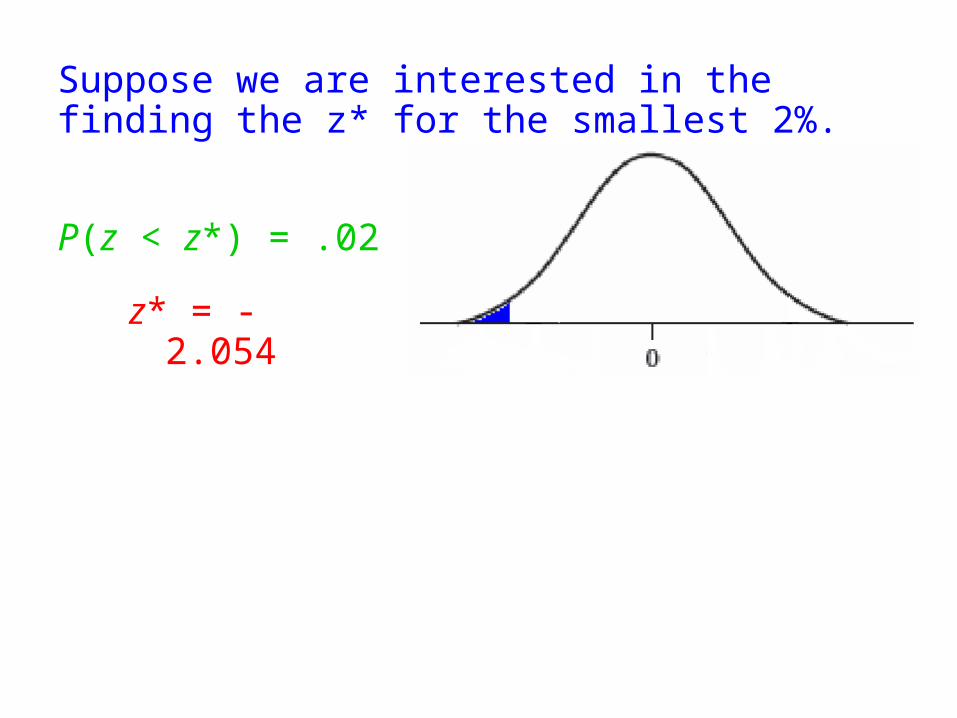
Suppose we are interested in the finding the z* for the smallest 2%.
P(z < z*) = .02
z* = -2.054z*
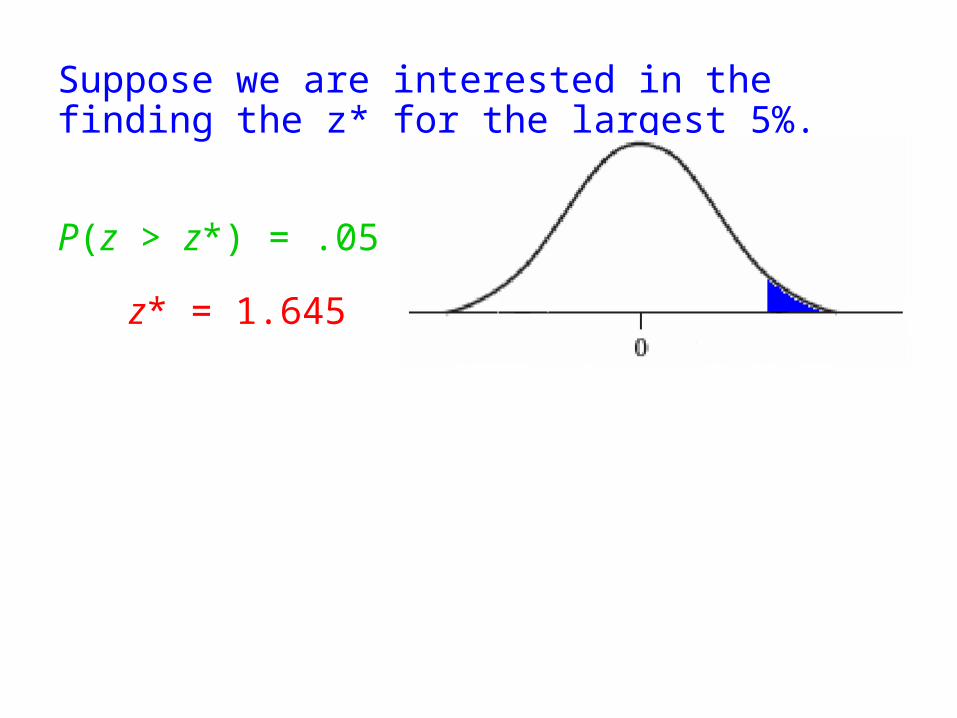
Suppose we are interested in the finding the z* for the largest 5%.
P(z > z*) = .05
z* = 1.645z*
.95
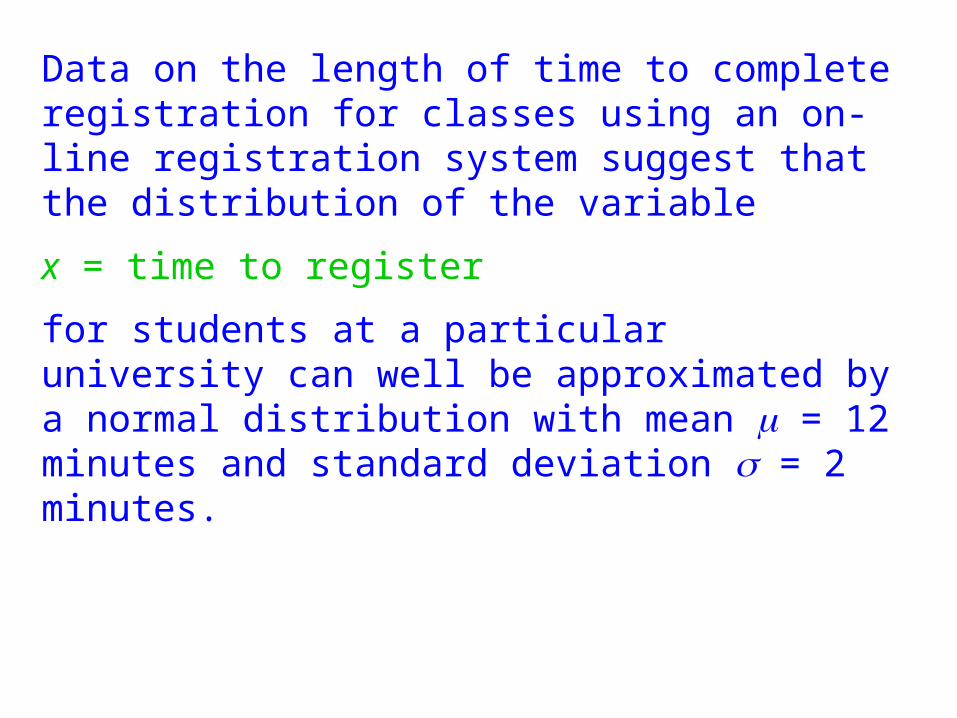
Data on the length of time to complete registration for classes using an on-line registration system suggest that the distribution of the variable
x = time to register
for students at a particular university can well be approximated by a normal distribution with mean m = 12 minutes and standard deviation s = 2 minutes.
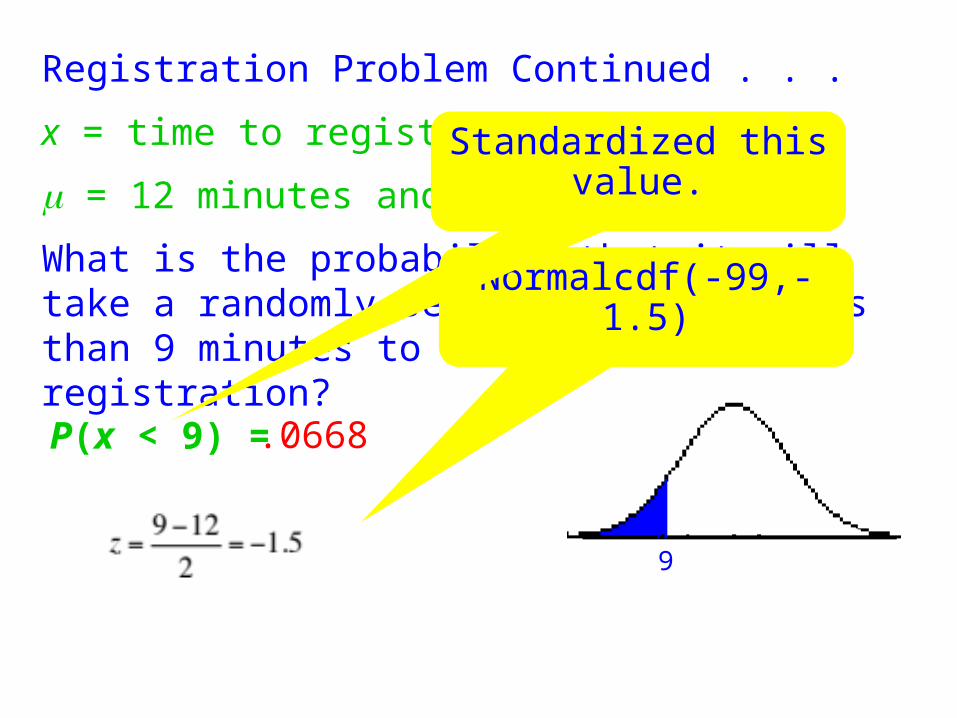
Registration Problem Continued . . .
x = time to register
m = 12 minutes and s = 2 minutes
What is the probability that it will take a randomly selected student less than 9 minutes to complete registration?
P(x < 9) =
Normalcdf(-99,-1.5)
Standardized this value.
.0668
9
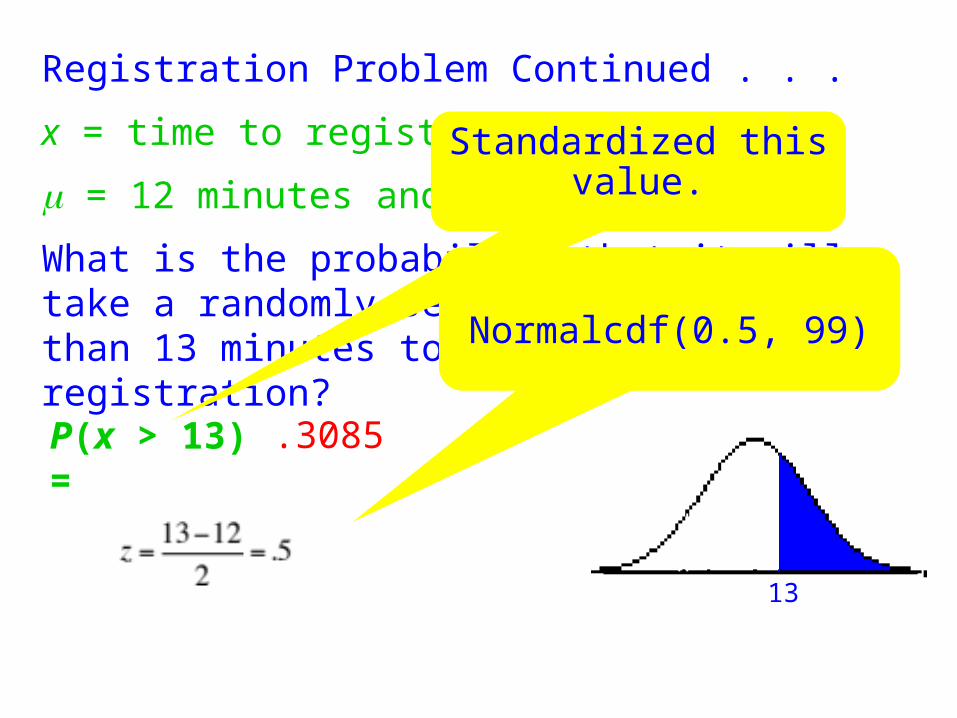
Registration Problem Continued . . .
x = time to register
m = 12 minutes and s = 2 minutes
What is the probability that it will take a randomly selected student more than 13 minutes to complete registration?
P(x > 13) =
Normalcdf(0.5, 99)
Standardized this value.
.3085
13
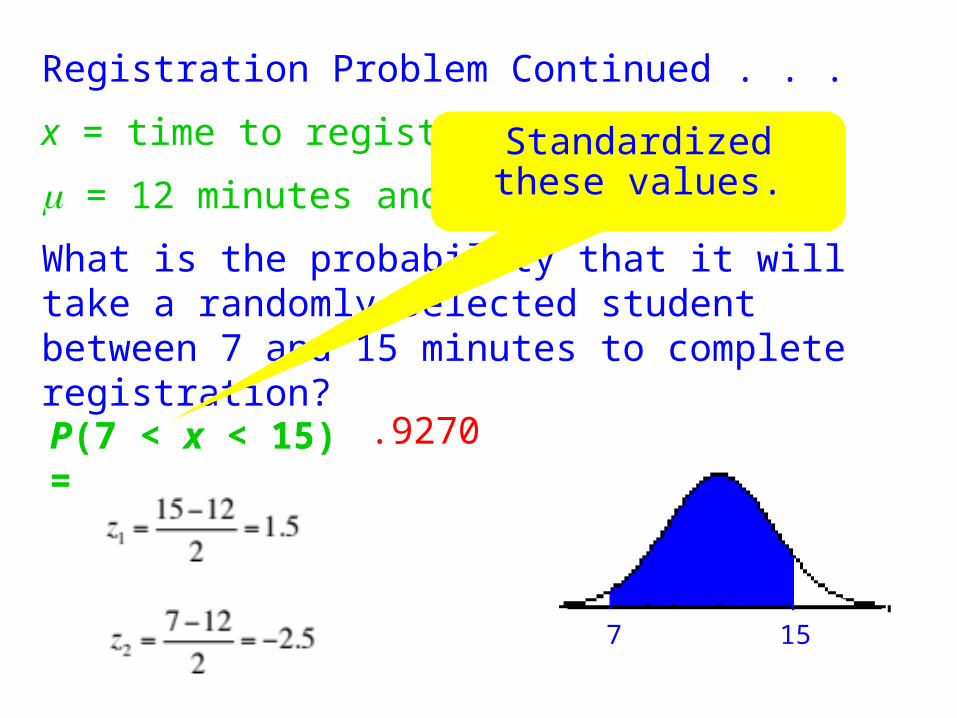
Registration Problem Continued . . .
x = time to register
m = 12 minutes and s = 2 minutes
What is the probability that it will take a randomly selected student between 7 and 15 minutes to complete registration?
P(7 < x < 15) =
Standardized these values.
.9270
7 15
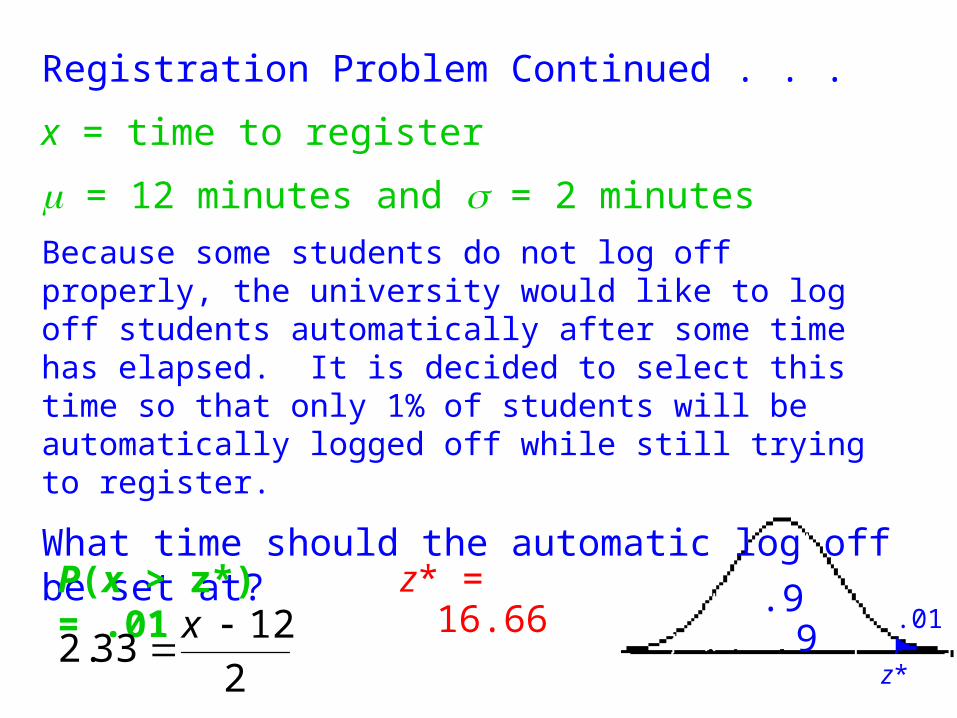
Registration Problem Continued . . .
x = time to register
m = 12 minutes and s = 2 minutes
Because some students do not log off properly, the university would like to log off students automatically after some time has elapsed. It is decided to select this time so that only 1% of students will be automatically logged off while still trying to register.
What time should the automatic log off be set at?
P(x > z*) = .01
z* = 16.66
z*
.01
212
33.2
x
.99
Homework
• Pg.457: #7.63, 65, 67, 68, 70, 72abcd, 75, 81