Embed Size (px)
Citation preview
Chapter 7
Philippines Country Report
Adoracion M. Navarro
Gilberto M. Llanto
Philippine Institute for Development Studies, Philippines
November 2014
This chapter should be cited as
Navarro, A. M. (2014), ‘Philippines Country Report’, in Zen, F. and M. Regan (eds.),
Financing ASEAN Connectivity, ERIA Research Project Report FY2013, No.15.Jakarta:
ERIA, pp.265-326.
265
CHAPTER 7
Philippines Country Report
Adoracion M. NAVARRO and Gilberto M. LLANTO`
Philippine Institute for Development Studies, Philippines
Introduction
This study looks at the financial sources for infrastructure projects in the
Philippines in the last five years and analyses the country’s current fiscal
situation as it relates to infrastructure financing. It also gives updates on
developments in public-private partnerships (PPPs) and describes the level of
capital market development in the country. It is part of a larger study by the
Economic Research Institute for ASEAN and East Asia (ERIA). While the
larger ERIA study maps the regional financial sources and possible
mechanisms to enhance regional cooperation in infrastructure development,
this country study provides updates on the Philippines’ contribution to regional
financing and on efforts in developing the regional connectivity infrastructure.
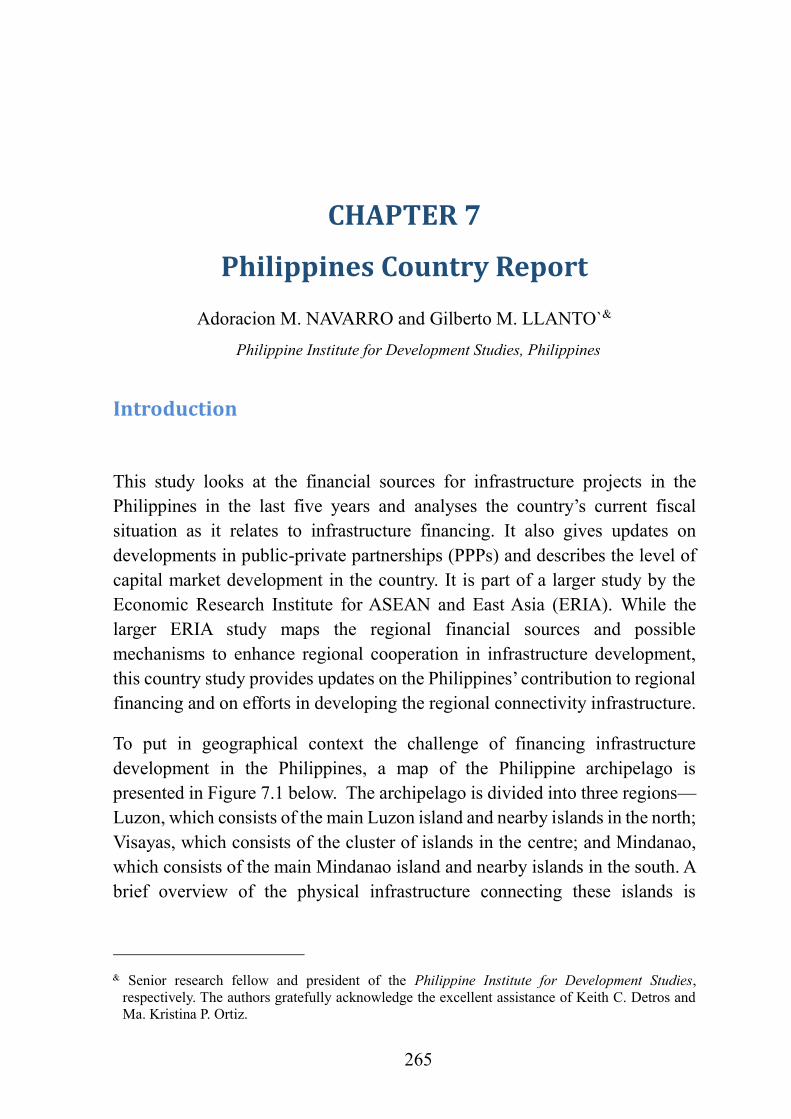
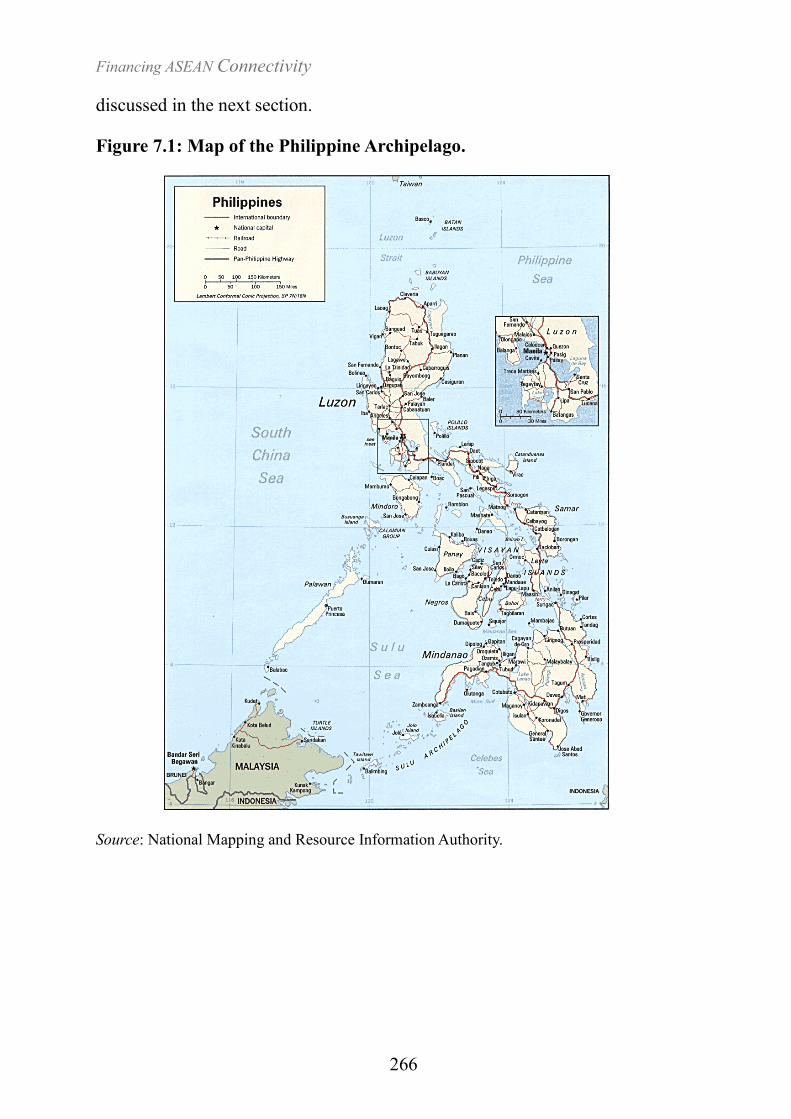
To put in geographical context the challenge of financing infrastructure
development in the Philippines, a map of the Philippine archipelago is
presented in Figure 7.1 below. The archipelago is divided into three regions—
Luzon, which consists of the main Luzon island and nearby islands in the north;
Visayas, which consists of the cluster of islands in the centre; and Mindanao,
which consists of the main Mindanao island and nearby islands in the south. A
brief overview of the physical infrastructure connecting these islands is
Senior research fellow and president of the Philippine Institute for Development Studies,
respectively. The authors gratefully acknowledge the excellent assistance of Keith C. Detros and
Ma. Kristina P. Ortiz.
Financing ASEAN Connectivity
266
discussed in the next section.
Figure 7.1: Map of the Philippine Archipelago.
Source: National Mapping and Resource Information Authority.
Philippines Country Report
267
Overview of the Infrastructure Situation in the Philippines
This section presents the infrastructure stock to date and the population’s level
of access to infrastructure. Infrastructure sectors covered in this brief overview
include the transportation, water supply, energy, and information and
communications technology sectors. The Philippine Development Plan (PDP)
2011-2016 describes the current infrastructure stock as inadequate and the level
of access as inequitable. For a long time, the government and the private sector
have under-invested in infrastructure and the resulting inadequacy and
inequitable access hamper the national government’s goal to bring about
inclusive growth in the country.
Transportation
Road assets consist of a total of 215,088 km of national roads, secondary roads,
provincial roads, city roads, municipal roads, and barangay (i.e., smallest
administrative unit in the Philippines) roads as of October 2012, of which 27
percent are paved and in good condition. Of these roads, national roads measure
25,443.44 km, where around 80 percent are paved (DPWH, 2013).
In maritime transport, there are 211 ports handling domestic traffic and 38 ports
managing international traffic as of 2012 (ASEAN-Japan Transport Partnership,
2012). The domestic shipping fleet consists of 7,299 vessels with a gross
tonnage of 1.76 million tons as of 2011(NSCB, 2012). The Philippine
archipelago has what is called a nautical highway that allows vehicular traffic
from highways to continue the inter-island journeys via roll-on/roll-off
(RORO) ferries along 12 specific routes. However, RORO ferries have pulled
out their operation in five out of these 12 routes mainly due to port
underdevelopment1.
The country currently has 10 international airports serving international flights,
34 principal airports catering to domestic flights, and 41 community airports
used by general aviation aircrafts. The dramatic increase in air traffic in recent
years, coupled with inadequate infrastructure investments, has led to
1 Based on an interview conducted with MARINA Domestic Shipping official. July 2013.
Financing ASEAN Connectivity
268
congestion in airports. For example, the Ninoy Aquino International Airport is
designed to accommodate only 36 aircraft movements (take-off and landing)
per hour, but actual aircraft movements reached 50 per hour in the summer of
2012 (DOTC, 2012).
Water Supply
The water supply sector is quite fragmented. There are numerous water
providers, including 511 water districts2, 475 private water utilities3, and a still
undetermined number of small water service providers. As of 2011, around 86
percent of Filipinos had access to safe drinking water(NEDA, 2012).
Energy
Power generation is a competitive business, where the total capacity is 16,162
megawatts (MW) of installed capacity and 14,477 MW of dependable capacity.
The generation capacity margin is tight, and frequent power shortages have
been occurring in Mindanao in the past two years. Transmission is a natural
monopoly, and the grid is operated by a private firm. The distribution sector
consists of 119 electric cooperatives and 25 private and local government-
owned utilities. As of 2010, 73.7 percent of Filipino households had access to
electricity.4
Information and Communications Technology
Information and communications technology (ICT) is a competitive and private
sector-driven industry, with a total of 70 local exchange carriers and nine
cellular mobile radio service providers nationwide as of 20115. Teledensity in
2012 was at around seven installed lines per 100 Filipinos6. In the same year,
2 Based on an interview conducted with Local Water Utilities Administration (LWUA). July 2013. 3 Raw data retrieved from 2009 registration data of the National Water Resources Board. 4 Raw data retrieved from the Department of Energy.
5 Raw data retrieved from the National Telecommunications Commission 6 Raw data retrieved from the Department of Science and Technology-ICT Data and Statistics and
Philippines Country Report
269
there were 106.7 mobile phones per 100 Filipinos, while internet usage was at
36.24 percent. Meanwhile, fixed broadband subscription was at 2.2 subscribers
per 100 Filipinos7.
Quality of Infrastructure Relative to Those of ASEAN Neighbours
The Philippines lags behind most of its ASEAN neighbours in the quality of its
infrastructure. According to the latest Global Competitiveness Report (2012-
2013) of the World Economic Forum, the Philippines ranks 98th out of 144
countries in terms of quality of overall infrastructure and is second to the last
among the ASEAN countries included in the ranking.
Public Sources of Infrastructure Financing
National Sources
The immense importance of investing in infrastructure development to
facilitate inclusive economic growth is recognised by the current
administration. The Philippine Development Plan (PDP) 2011-2016 puts high
priority on infrastructure development, which has both growth and equity
effects. Thus, this section begins with a discussion of the national development
priorities contained in the government’s investment programme. The
discussion then continues with a presentation of how the government financed
infrastructure investments for the past five years through the national budget.
National Development Priorities
The current administration is guided by a comprehensive investment plan
entitled “Public Investment Programme (PIP) 2011-2016". In 2013, the
National Economic Development Authority (NEDA) released a “Revalidated
PIP”, which incorporates updated data as of May 31, 2012 and shows that
infrastructure development has the largest share at US$13.06 billion or 77
International Telecommunications Union 7 Ibid.
Financing ASEAN Connectivity
270
percent of the total amount of target investments in eight key investment areas8
for the remaining years 2013 to 2016. This amount corresponds to a total of 69
out of the identified 102 core investment projects and programmes. Such is the
high priority that the current administration puts on infrastructure development.
Annex 1 provides details on the infrastructure investment programme in the
PIP.
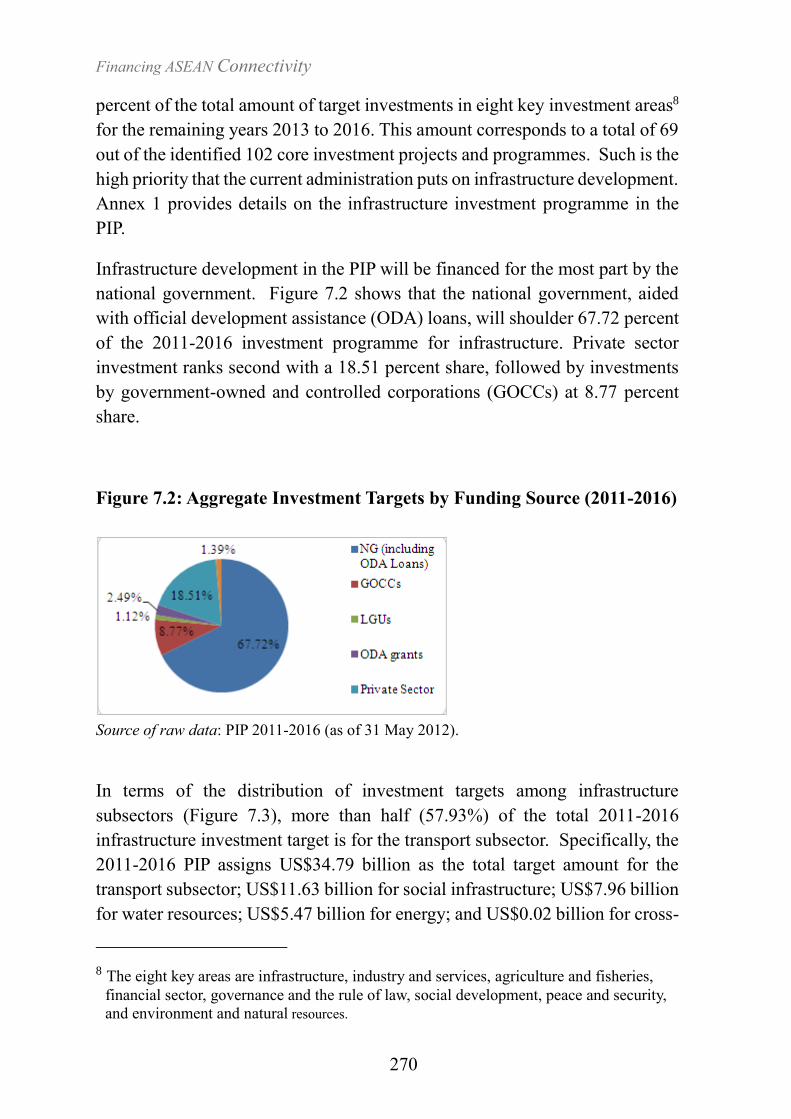
Infrastructure development in the PIP will be financed for the most part by the
national government. Figure 7.2 shows that the national government, aided
with official development assistance (ODA) loans, will shoulder 67.72 percent
of the 2011-2016 investment programme for infrastructure. Private sector
investment ranks second with a 18.51 percent share, followed by investments
by government-owned and controlled corporations (GOCCs) at 8.77 percent
share.
Figure 7.2: Aggregate Investment Targets by Funding Source (2011-2016)
Source of raw data: PIP 2011-2016 (as of 31 May 2012).
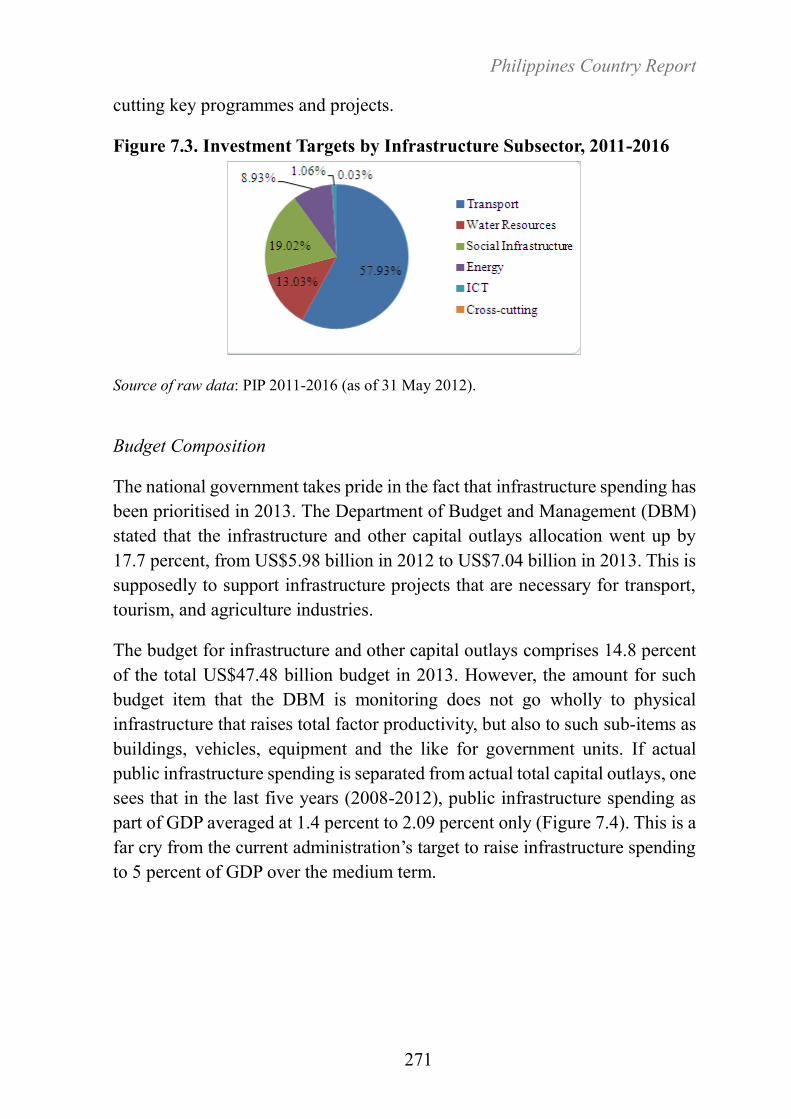
In terms of the distribution of investment targets among infrastructure
subsectors (Figure 7.3), more than half (57.93%) of the total 2011-2016
infrastructure investment target is for the transport subsector. Specifically, the
2011-2016 PIP assigns US$34.79 billion as the total target amount for the
transport subsector; US$11.63 billion for social infrastructure; US$7.96 billion
for water resources; US$5.47 billion for energy; and US$0.02 billion for cross-
8 The eight key areas are infrastructure, industry and services, agriculture and fisheries,
financial sector, governance and the rule of law, social development, peace and security,
and environment and natural resources.
Philippines Country Report
271
cutting key programmes and projects.
Figure 7.3. Investment Targets by Infrastructure Subsector, 2011-2016
Source of raw data: PIP 2011-2016 (as of 31 May 2012).
Budget Composition
The national government takes pride in the fact that infrastructure spending has
been prioritised in 2013. The Department of Budget and Management (DBM)
stated that the infrastructure and other capital outlays allocation went up by
17.7 percent, from US$5.98 billion in 2012 to US$7.04 billion in 2013. This is
supposedly to support infrastructure projects that are necessary for transport,
tourism, and agriculture industries.
The budget for infrastructure and other capital outlays comprises 14.8 percent
of the total US$47.48 billion budget in 2013. However, the amount for such
budget item that the DBM is monitoring does not go wholly to physical
infrastructure that raises total factor productivity, but also to such sub-items as
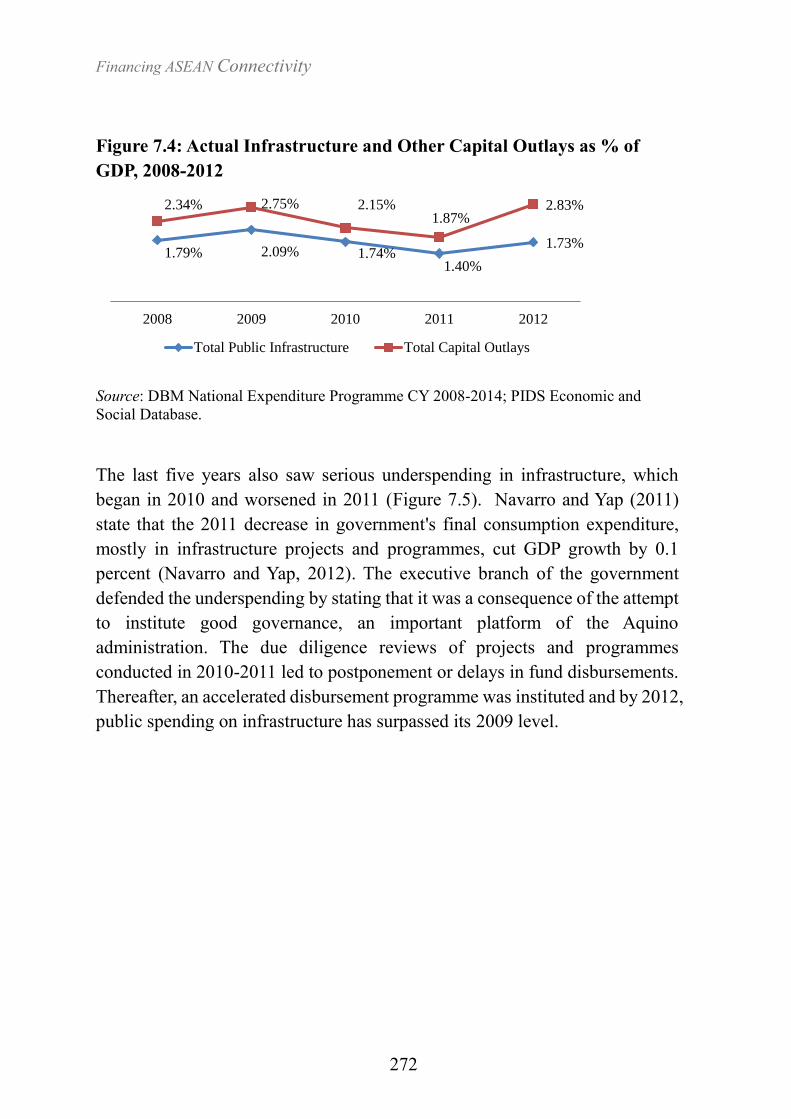
buildings, vehicles, equipment and the like for government units. If actual
public infrastructure spending is separated from actual total capital outlays, one
sees that in the last five years (2008-2012), public infrastructure spending as
part of GDP averaged at 1.4 percent to 2.09 percent only (Figure 7.4). This is a
far cry from the current administration’s target to raise infrastructure spending
to 5 percent of GDP over the medium term.
Financing ASEAN Connectivity
272
Figure 7.4: Actual Infrastructure and Other Capital Outlays as % of
GDP, 2008-2012
Source: DBM National Expenditure Programme CY 2008-2014; PIDS Economic and
Social Database.
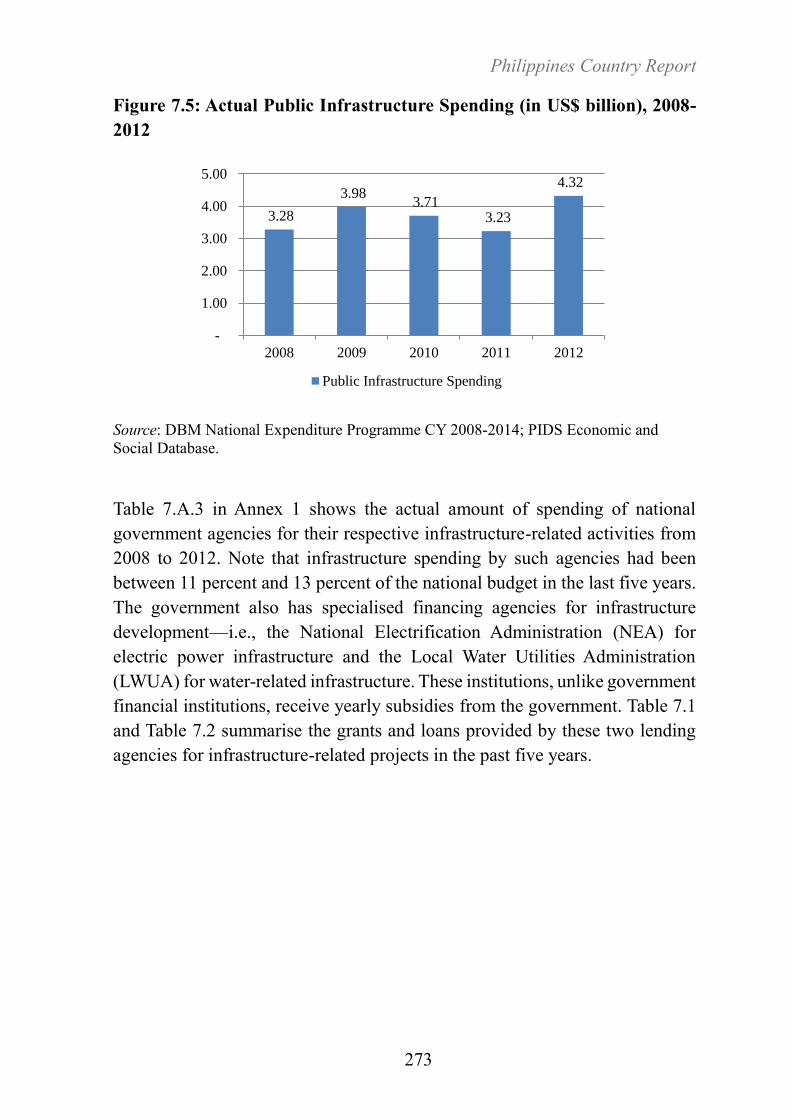
The last five years also saw serious underspending in infrastructure, which
began in 2010 and worsened in 2011 (Figure 7.5). Navarro and Yap (2011)
state that the 2011 decrease in government's final consumption expenditure,
mostly in infrastructure projects and programmes, cut GDP growth by 0.1
percent (Navarro and Yap, 2012). The executive branch of the government
defended the underspending by stating that it was a consequence of the attempt
to institute good governance, an important platform of the Aquino
administration. The due diligence reviews of projects and programmes
conducted in 2010-2011 led to postponement or delays in fund disbursements.
Thereafter, an accelerated disbursement programme was instituted and by 2012,
public spending on infrastructure has surpassed its 2009 level.
1.79% 2.09% 1.74%1.40%
1.73%
2.34% 2.75% 2.15%1.87%
2.83%
2008 2009 2010 2011 2012
Total Public Infrastructure Total Capital Outlays
Philippines Country Report
273
Figure 7.5: Actual Public Infrastructure Spending (in US$ billion), 2008-
2012
Source: DBM National Expenditure Programme CY 2008-2014; PIDS Economic and
Social Database.
Table 7.A.3 in Annex 1 shows the actual amount of spending of national
government agencies for their respective infrastructure-related activities from
2008 to 2012. Note that infrastructure spending by such agencies had been
between 11 percent and 13 percent of the national budget in the last five years.
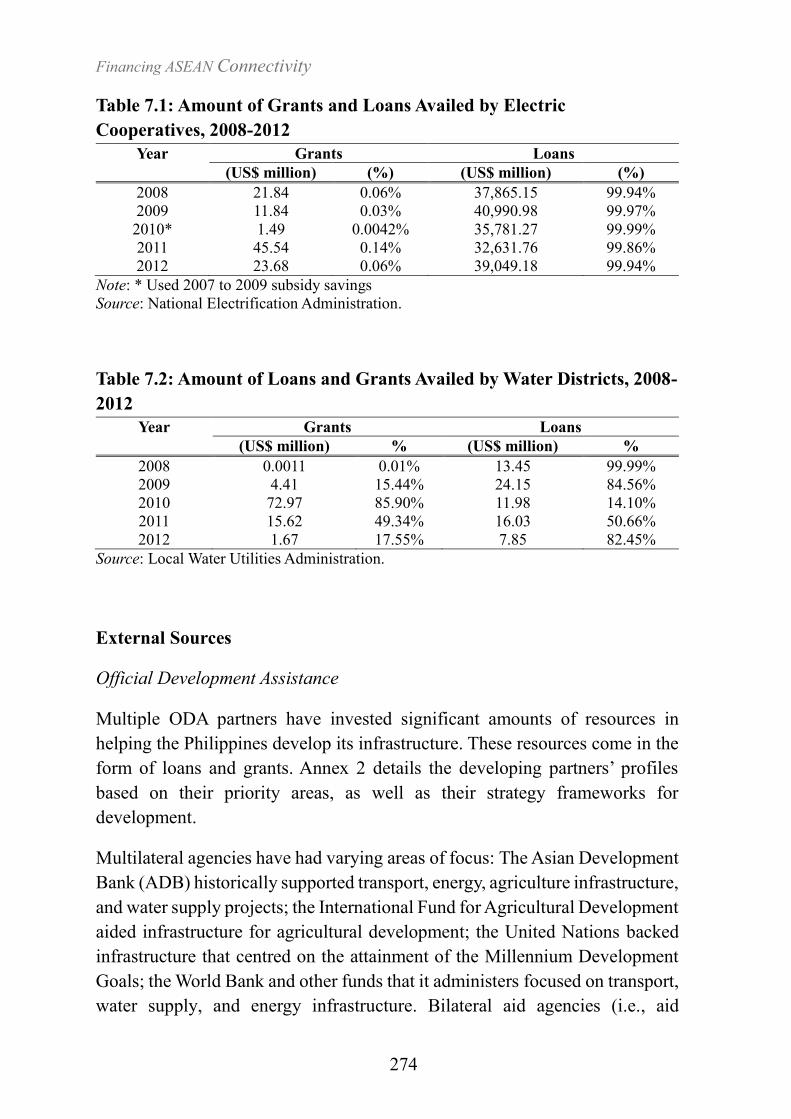
The government also has specialised financing agencies for infrastructure
development—i.e., the National Electrification Administration (NEA) for
electric power infrastructure and the Local Water Utilities Administration
(LWUA) for water-related infrastructure. These institutions, unlike government
financial institutions, receive yearly subsidies from the government. Table 7.1
and Table 7.2 summarise the grants and loans provided by these two lending
agencies for infrastructure-related projects in the past five years.
3.28
3.98 3.71
3.23
4.32
-
1.00
2.00
3.00
4.00
5.00
2008 2009 2010 2011 2012
Public Infrastructure Spending
Financing ASEAN Connectivity
274
Table 7.1: Amount of Grants and Loans Availed by Electric
Cooperatives, 2008-2012
Year Grants Loans
(US$ million) (%) (US$ million) (%)
2008 21.84 0.06% 37,865.15 99.94%
2009 11.84 0.03% 40,990.98 99.97%
2010* 1.49 0.0042% 35,781.27 99.99%
2011 45.54 0.14% 32,631.76 99.86%
2012 23.68 0.06% 39,049.18 99.94%
Note: * Used 2007 to 2009 subsidy savings
Source: National Electrification Administration.
Table 7.2: Amount of Loans and Grants Availed by Water Districts, 2008-
2012
Year Grants Loans
(US$ million) % (US$ million) %
2008 0.0011 0.01% 13.45 99.99%
2009 4.41 15.44% 24.15 84.56%
2010 72.97 85.90% 11.98 14.10%
2011 15.62 49.34% 16.03 50.66%
2012 1.67 17.55% 7.85 82.45%
Source: Local Water Utilities Administration.
External Sources
Official Development Assistance
Multiple ODA partners have invested significant amounts of resources in
helping the Philippines develop its infrastructure. These resources come in the
form of loans and grants. Annex 2 details the developing partners’ profiles
based on their priority areas, as well as their strategy frameworks for
development.
Multilateral agencies have had varying areas of focus: The Asian Development
Bank (ADB) historically supported transport, energy, agriculture infrastructure,
and water supply projects; the International Fund for Agricultural Development
aided infrastructure for agricultural development; the United Nations backed
infrastructure that centred on the attainment of the Millennium Development
Goals; the World Bank and other funds that it administers focused on transport,
water supply, and energy infrastructure. Bilateral aid agencies (i.e., aid
Philippines Country Report
275
agencies of Australia, China, South Korea, New Zealand, Canada, European
Union, France, Spain, and the United States), meanwhile, supported a number
of cross-cutting areas such as public-private partnerships, investment-
promoting infrastructure, infrastructure support to tourism, and infrastructure
for peace and development in Mindanao.
Loans for Infrastructure
As of December 2012, the total loan commitment amounted to US$8.82 billion.
Seventy-eight percent (or US$6.89 billion) was for project loans while the
remaining 22 percent (or US$1.93 billion) was for programme loans. The total
loan commitment in 2012 rose by about 2.6 percent from the registered loan
commitment in 2011. Furthermore, of all the loans for 2012, the biggest share
went to the development of the infrastructure sector. A total of US$5.19 billion
(58%) of the loans was allocated to infrastructure, while 19 percent was for
social reform and community development. Given the amount, it is not
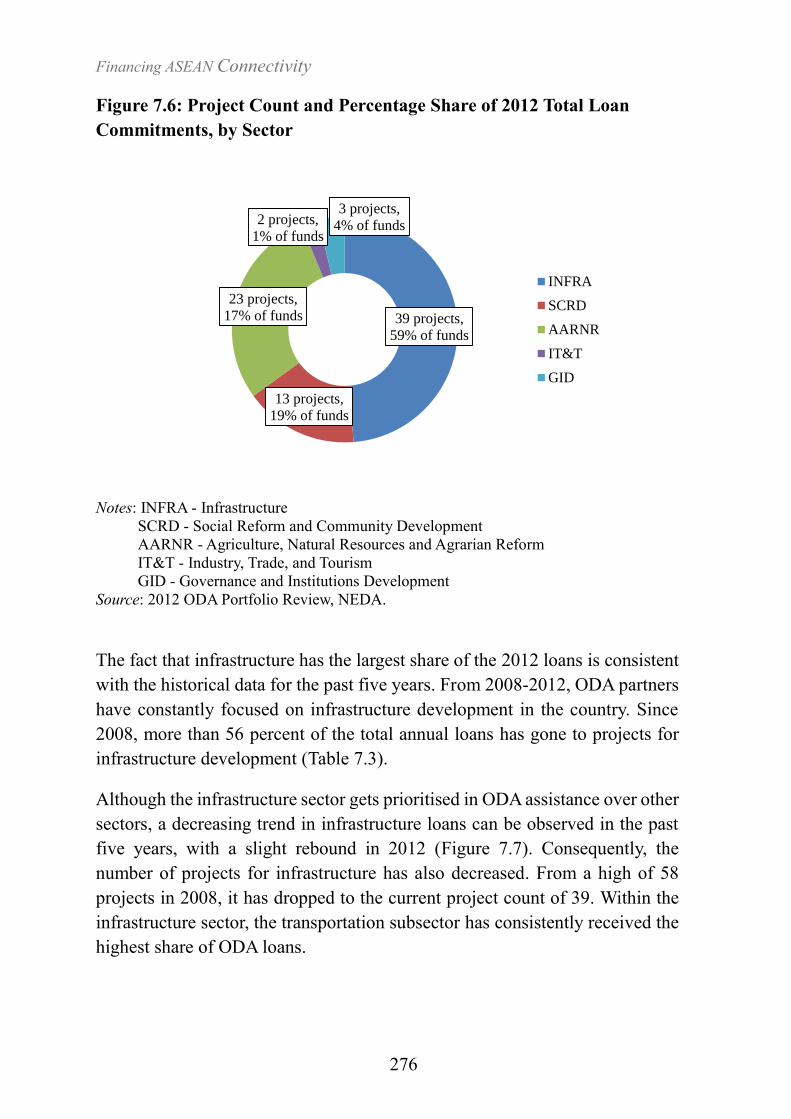
surprising that the infrastructure sector also had the largest number of projects:
39 projects supported by ODA loans in 2012. Figure 7.6 details the distribution
of projects and percentage share by sector in the 2012 net loan commitments.
Financing ASEAN Connectivity
276
Figure 7.6: Project Count and Percentage Share of 2012 Total Loan
Commitments, by Sector
Notes: INFRA - Infrastructure
SCRD - Social Reform and Community Development
AARNR - Agriculture, Natural Resources and Agrarian Reform
IT&T - Industry, Trade, and Tourism
GID - Governance and Institutions Development
Source: 2012 ODA Portfolio Review, NEDA.
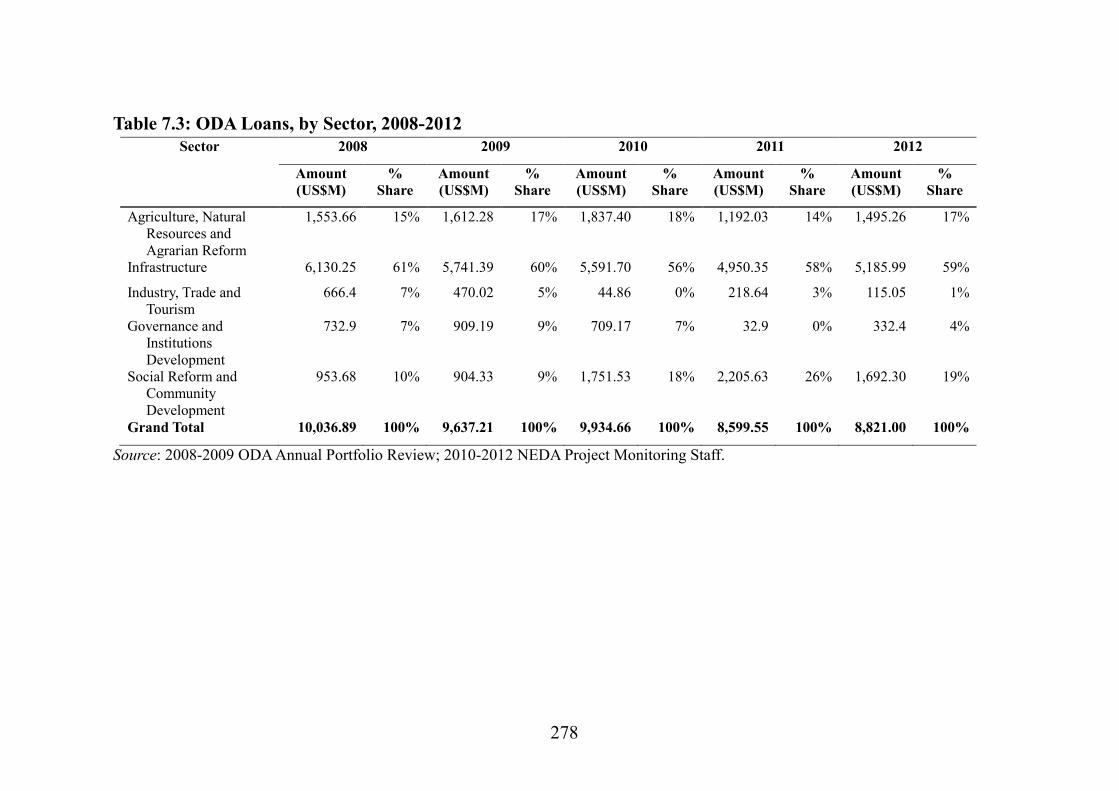
The fact that infrastructure has the largest share of the 2012 loans is consistent
with the historical data for the past five years. From 2008-2012, ODA partners
have constantly focused on infrastructure development in the country. Since
2008, more than 56 percent of the total annual loans has gone to projects for
infrastructure development (Table 7.3).
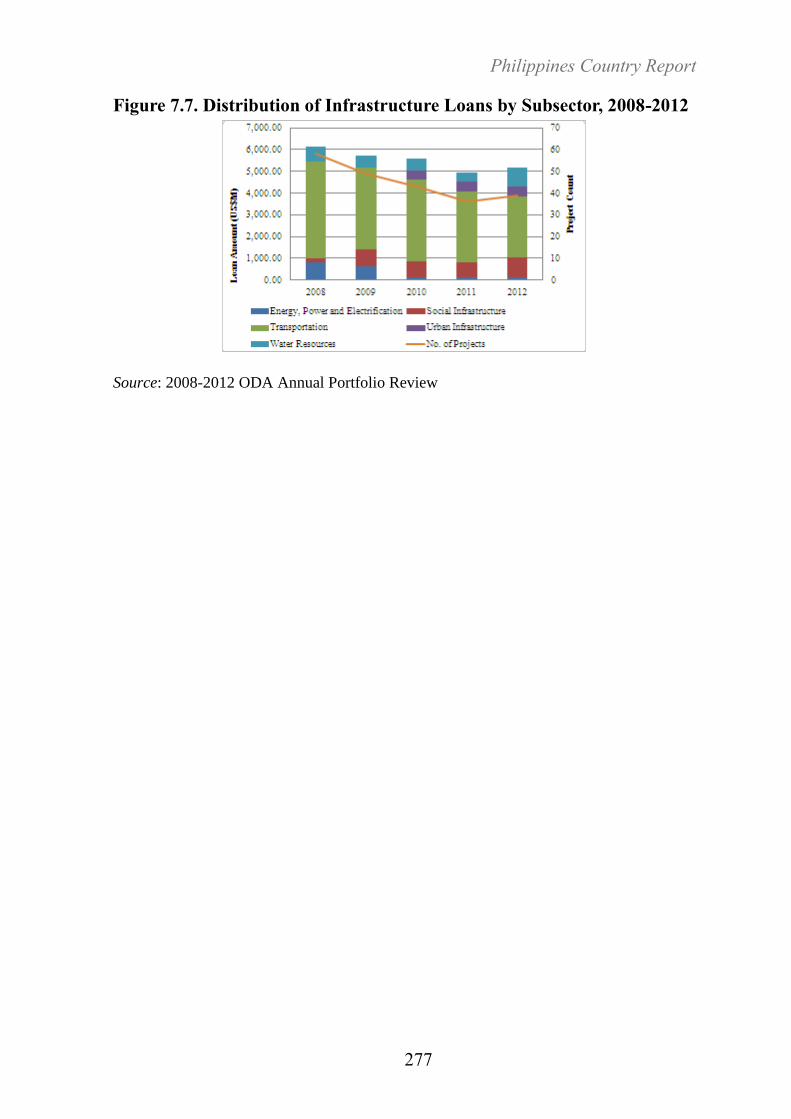
Although the infrastructure sector gets prioritised in ODA assistance over other
sectors, a decreasing trend in infrastructure loans can be observed in the past
five years, with a slight rebound in 2012 (Figure 7.7). Consequently, the
number of projects for infrastructure has also decreased. From a high of 58
projects in 2008, it has dropped to the current project count of 39. Within the
infrastructure sector, the transportation subsector has consistently received the
highest share of ODA loans.
39 projects,
59% of funds
13 projects,
19% of funds
23 projects,
17% of funds
2 projects,
1% of funds
3 projects,
4% of funds
INFRA
SCRD
AARNR
IT&T
GID
Philippines Country Report
277
Figure 7.7. Distribution of Infrastructure Loans by Subsector, 2008-2012
Source: 2008-2012 ODA Annual Portfolio Review
278
Table 7.3: ODA Loans, by Sector, 2008-2012
Sector 2008 2009 2010 2011 2012
Amount
(US$M)
%
Share
Amount
(US$M)
%
Share
Amount
(US$M)
%
Share
Amount
(US$M)
%
Share
Amount
(US$M)
%
Share
Agriculture, Natural
Resources and
Agrarian Reform
1,553.66 15% 1,612.28 17% 1,837.40 18% 1,192.03 14% 1,495.26 17%
Infrastructure 6,130.25 61% 5,741.39 60% 5,591.70 56% 4,950.35 58% 5,185.99 59%
Industry, Trade and
Tourism
666.4 7% 470.02 5% 44.86 0% 218.64 3% 115.05 1%
Governance and
Institutions
Development
732.9 7% 909.19 9% 709.17 7% 32.9 0% 332.4 4%
Social Reform and
Community
Development
953.68 10% 904.33 9% 1,751.53 18% 2,205.63 26% 1,692.30 19%
Grand Total 10,036.89 100% 9,637.21 100% 9,934.66 100% 8,599.55 100% 8,821.00 100%
Source: 2008-2009 ODA Annual Portfolio Review; 2010-2012 NEDA Project Monitoring Staff.
Financing ASEAN Connectivity
279
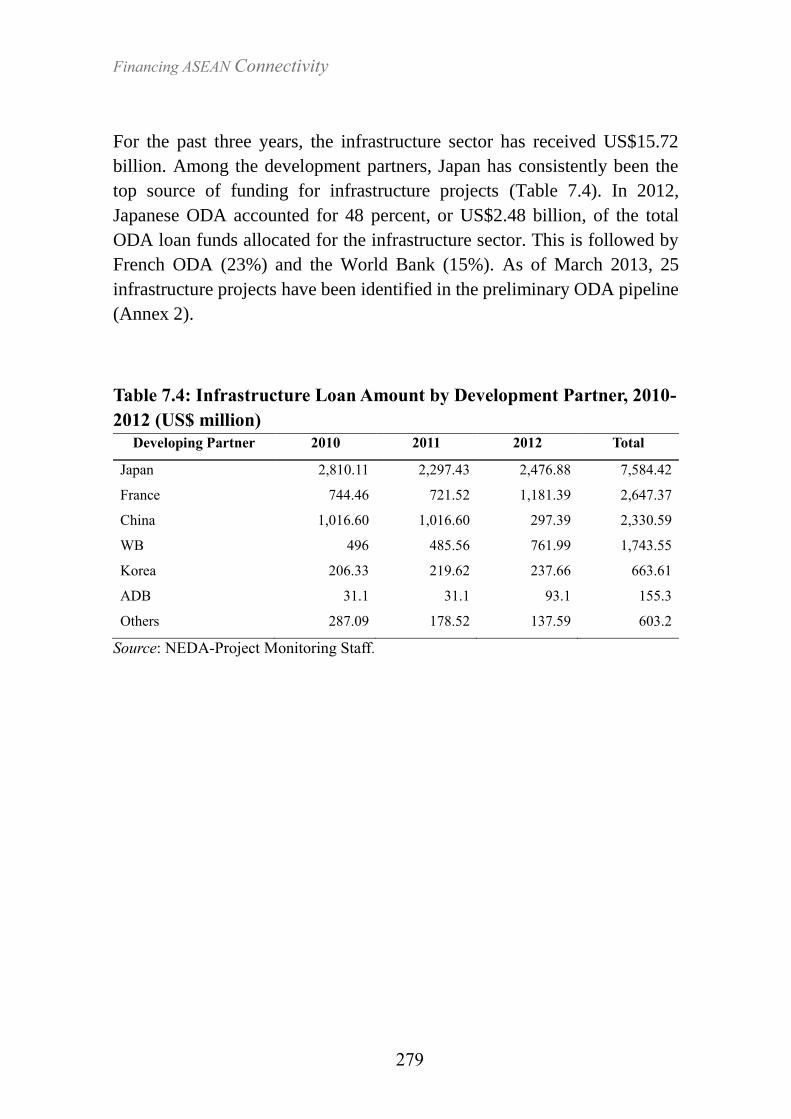
For the past three years, the infrastructure sector has received US$15.72
billion. Among the development partners, Japan has consistently been the
top source of funding for infrastructure projects (Table 7.4). In 2012,
Japanese ODA accounted for 48 percent, or US$2.48 billion, of the total
ODA loan funds allocated for the infrastructure sector. This is followed by
French ODA (23%) and the World Bank (15%). As of March 2013, 25
infrastructure projects have been identified in the preliminary ODA pipeline
(Annex 2).
Table 7.4: Infrastructure Loan Amount by Development Partner, 2010-
2012 (US$ million)
Developing Partner 2010 2011 2012 Total
Japan 2,810.11 2,297.43 2,476.88 7,584.42
France 744.46 721.52 1,181.39 2,647.37
China 1,016.60 1,016.60 297.39 2,330.59
WB 496 485.56 761.99 1,743.55
Korea 206.33 219.62 237.66 663.61
ADB 31.1 31.1 93.1 155.3
Others 287.09 178.52 137.59 603.2
Source: NEDA-Project Monitoring Staff.
Financing ASEAN Connectivity
280
Table 7.5. ODA Grants by Sector, 2008-2012 (US$ million)
Sector 2008 2009 2010 2011 2012
Amount %
Share
Amount %
Share
Amount %
Share
Amount %
Share
Amount %
Share
Social Reform and
Community
Development
284.82 22% 415.78 39% 931.12 43% 876.41 42% 1,519.40 53%
Governance and
Institutions
Development
474.13 37% 334.65 32% 400.93 19% 478.95 23% 561.92 20%
Infrastructure 128.10 10% 69.10 7% 414.37 19% 384.54 18% 400.04 14%
Agriculture, Agrarian
Reform, and Natural
Resources
338.80 26% 192.62 18% 344.55 16% 292.91 14% 314.19 11%
Industry, Trade and
Tourism
62.81 5% 45.08 4% 49.60 2% 56.23 3% 55.90 2%
TOTAL 1,288.66 100% 1,057.23 100% 2,140.57 100% 2,089.04 100% 2,851.45 100%
Note: Total grant received in 2010 was US$2,247.53 million. An amount of US$106.961 million were tagged as unspecified
Source: 2008-2009 ODA Annual Portfolio Review; 2010-2012 NEDA Project Monitoring Staff.
Philippines Country Report
281
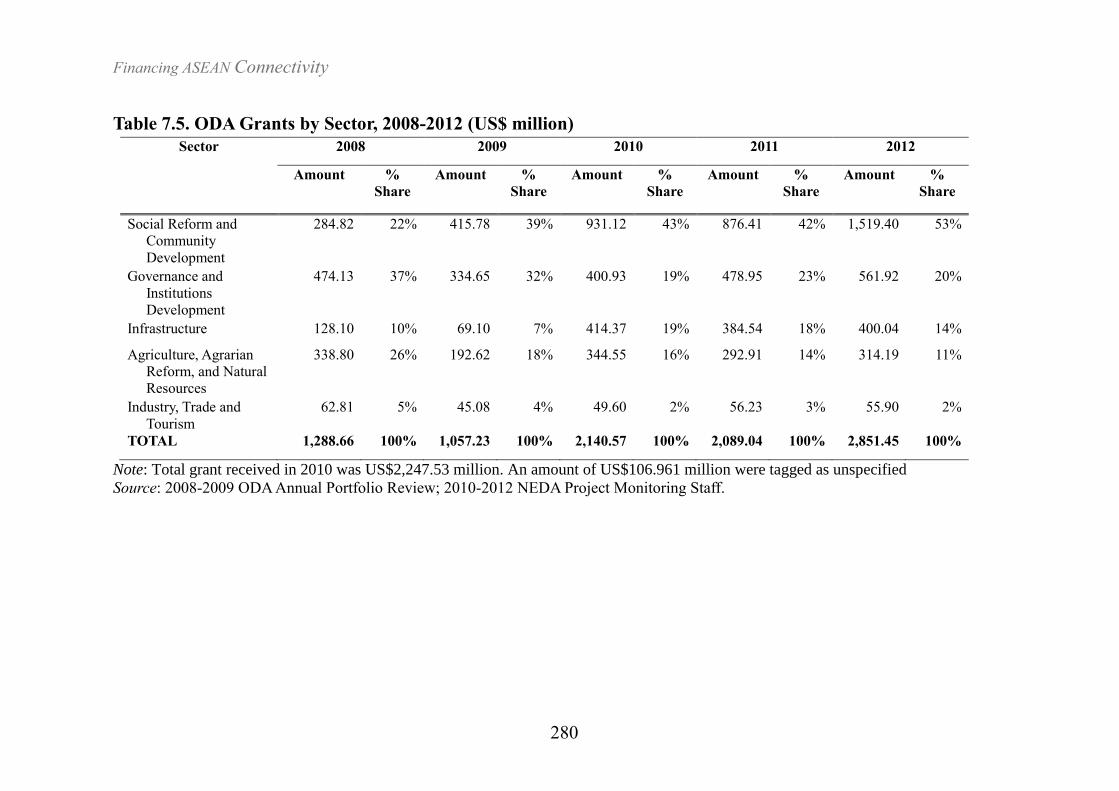
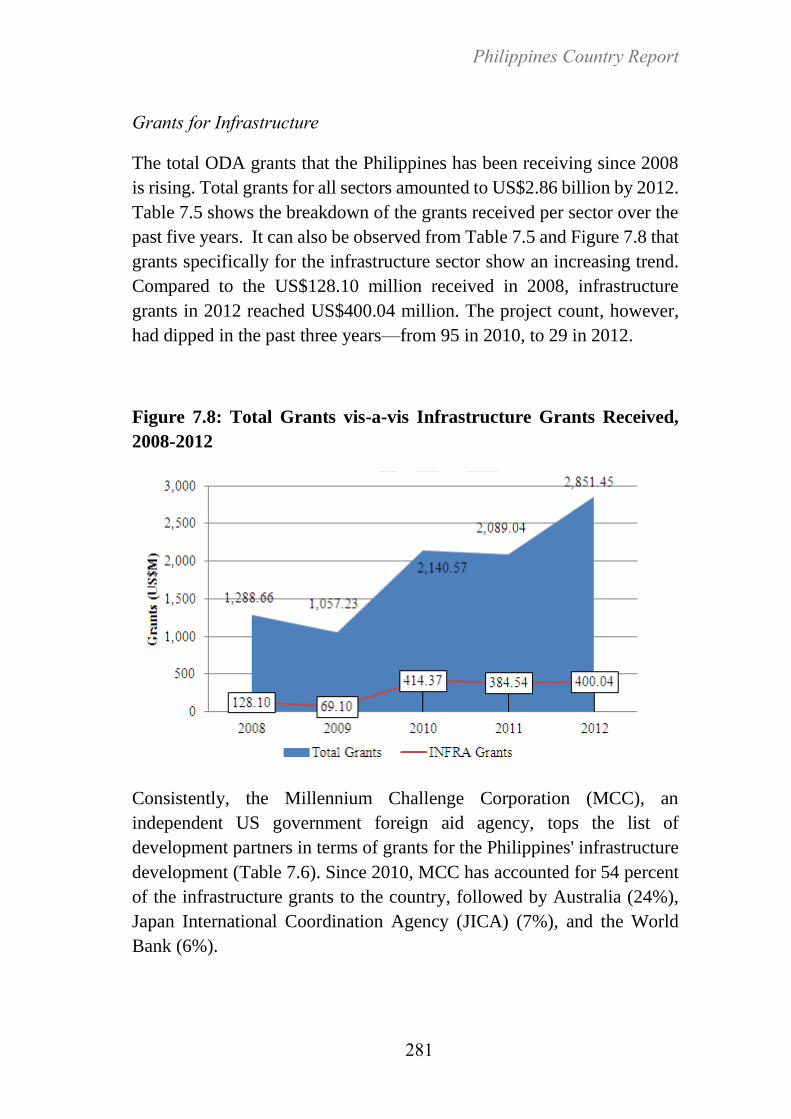
Grants for Infrastructure
The total ODA grants that the Philippines has been receiving since 2008
is rising. Total grants for all sectors amounted to US$2.86 billion by 2012.
Table 7.5 shows the breakdown of the grants received per sector over the
past five years. It can also be observed from Table 7.5 and Figure 7.8 that
grants specifically for the infrastructure sector show an increasing trend.
Compared to the US$128.10 million received in 2008, infrastructure
grants in 2012 reached US$400.04 million. The project count, however,
had dipped in the past three years—from 95 in 2010, to 29 in 2012.
Figure 7.8: Total Grants vis-a-vis Infrastructure Grants Received,
2008-2012
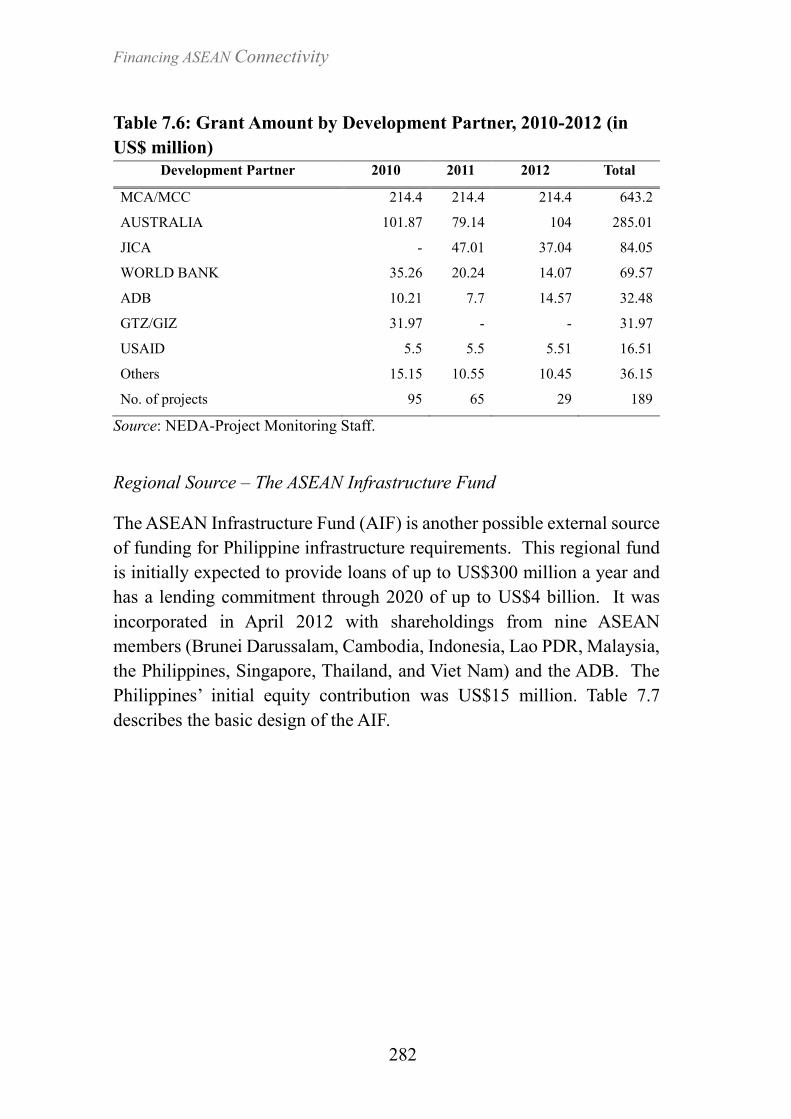
Consistently, the Millennium Challenge Corporation (MCC), an
independent US government foreign aid agency, tops the list of
development partners in terms of grants for the Philippines' infrastructure
development (Table 7.6). Since 2010, MCC has accounted for 54 percent
of the infrastructure grants to the country, followed by Australia (24%),
Japan International Coordination Agency (JICA) (7%), and the World
Bank (6%).
Financing ASEAN Connectivity
282
Table 7.6: Grant Amount by Development Partner, 2010-2012 (in
US$ million)
Development Partner 2010 2011 2012 Total
MCA/MCC 214.4 214.4 214.4 643.2
AUSTRALIA 101.87 79.14 104 285.01
JICA - 47.01 37.04 84.05
WORLD BANK 35.26 20.24 14.07 69.57
ADB 10.21 7.7 14.57 32.48
GTZ/GIZ 31.97 - - 31.97
USAID 5.5 5.5 5.51 16.51
Others 15.15 10.55 10.45 36.15
No. of projects 95 65 29 189
Source: NEDA-Project Monitoring Staff.
Regional Source – The ASEAN Infrastructure Fund
The ASEAN Infrastructure Fund (AIF) is another possible external source
of funding for Philippine infrastructure requirements. This regional fund
is initially expected to provide loans of up to US$300 million a year and
has a lending commitment through 2020 of up to US$4 billion. It was
incorporated in April 2012 with shareholdings from nine ASEAN
members (Brunei Darussalam, Cambodia, Indonesia, Lao PDR, Malaysia,
the Philippines, Singapore, Thailand, and Viet Nam) and the ADB. The
Philippines’ initial equity contribution was US$15 million. Table 7.7
describes the basic design of the AIF.

Philippines Country Report
283
Table 7.7: Basic Design and Structure of the ASEAN Infrastructure
Fund (AIF)
Equity Debt Lending Operations ADB's Role
US$335.2
million
from 9
ASEAN
countries
US$150
million
from ADB
Around
US$162
million in
hybrid
capital
(perpetual
bonds)
Debt issued to
leverage 1.5
times the equity*
High-investment
grade credit
rating targeted
Central banks
and other
institutions,
including private
sector, to
purchase the debt
after the AIF has
established a
clear track-record
and sufficient
lending volume
Lending to relevant
ASEAN countries
Based on ADB's
country partnership
strategy, and
regional pipelines
Initially only on
sovereign and
sovereign-
guaranteed projects
and public portion of
PPP projects, later
also loans to private
sponsors after
formal
determination of the
AIF
Generate the project
pipeline
Ensure that
appropriate safeguards
and due diligence are
part of the project
design and
administration and
report to ASEAN
Provide co-financing
and act as the lender
of record
Administer the AIF
(including financial
management, loan
servicing, accounting
and financial
reporting) during the
project administration
and evaluation
Note: *In capital adequacy terms, it means an equity-to-loan ratio of about 60 percent
by 2020 and about 44 percent by 2025.
Source: ADB August 2011 Report and Recommendation of the President to the
Board of Directors: Proposed Equity Contribution and Administration of
ASEAN Infrastructure. Fund.
The AIF was reported to be ready to process projects in the pipeline by the
second half of 2013. To date, however, details on the projects being
processed have not yet been released.
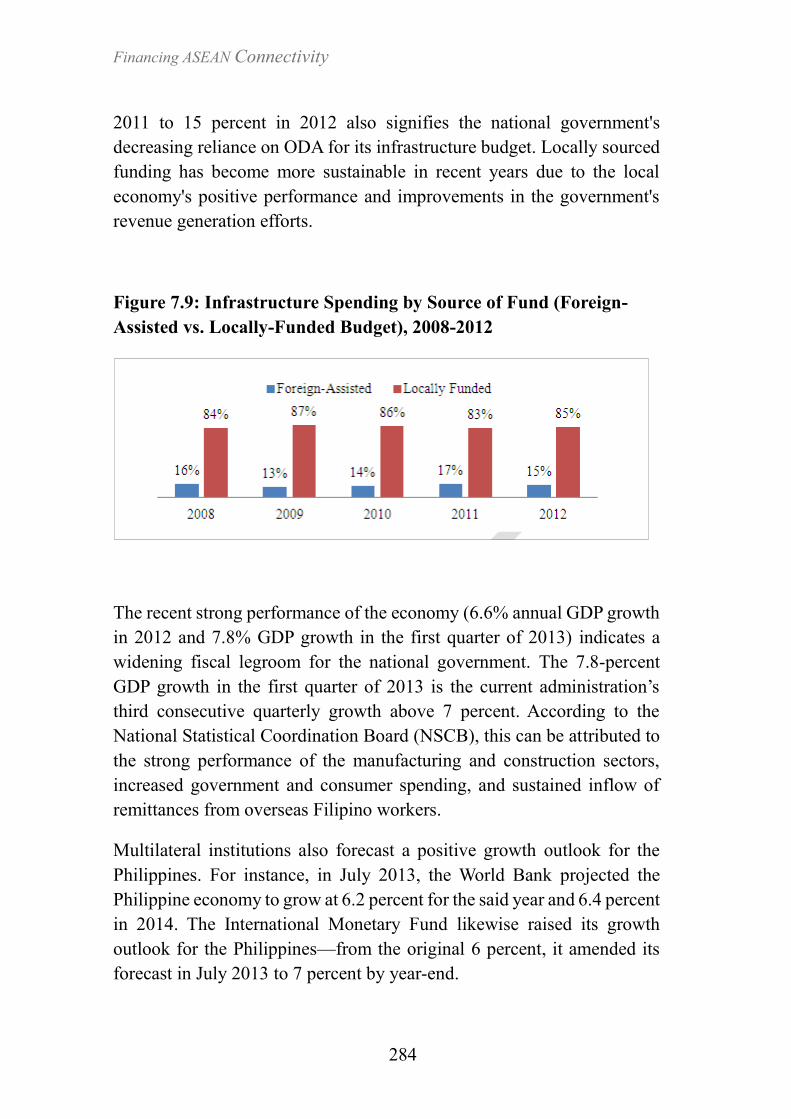
Analysis of the Fiscal Situation
A healthy fiscal system supports the national government’s spending on
infrastructure projects funded by both local sources and external sources,
with the latter usually utilising counterpart government contributions.
Figure 7.9 shows that outlays for infrastructure are largely from local
funds, which averaged 84 percent to 87 percent in the past five years. On
the other hand, the share of foreign assistance stood at 13 percent to 17
percent. The decline in the share of foreign assistance from 17 percent in
Financing ASEAN Connectivity
284
2011 to 15 percent in 2012 also signifies the national government's
decreasing reliance on ODA for its infrastructure budget. Locally sourced
funding has become more sustainable in recent years due to the local
economy's positive performance and improvements in the government's
revenue generation efforts.
Figure 7.9: Infrastructure Spending by Source of Fund (Foreign-
Assisted vs. Locally-Funded Budget), 2008-2012
The recent strong performance of the economy (6.6% annual GDP growth
in 2012 and 7.8% GDP growth in the first quarter of 2013) indicates a
widening fiscal legroom for the national government. The 7.8-percent
GDP growth in the first quarter of 2013 is the current administration’s
third consecutive quarterly growth above 7 percent. According to the
National Statistical Coordination Board (NSCB), this can be attributed to
the strong performance of the manufacturing and construction sectors,
increased government and consumer spending, and sustained inflow of
remittances from overseas Filipino workers.
Multilateral institutions also forecast a positive growth outlook for the
Philippines. For instance, in July 2013, the World Bank projected the
Philippine economy to grow at 6.2 percent for the said year and 6.4 percent
in 2014. The International Monetary Fund likewise raised its growth
outlook for the Philippines—from the original 6 percent, it amended its
forecast in July 2013 to 7 percent by year-end.
Philippines Country Report
285
Moreover, the Philippines' actual fiscal deficit by December 2012 stood at
2.3 percent of GDP, which is below the government's target cap of 2.6
percent of GDP. Navarro and Yap (2013) explain that compared to the
previous year, where fiscal deficit was controlled at the expense of lower
government spending, the fiscal deficit in 2012 improved due to the low-
interest environment, less pressure on borrowings, faster-than-expected
GDP growth, and increase in government revenues. However, Navarro
and Yap note that recent revenue collections were still short of targets. The
NEDA also raised the revenue effort issue in its Socio-Economic Report
2010-2012 and stated that despite the country’s recent commendable fiscal
performance, improvements are still possible given the “path of revenues
and spending.”
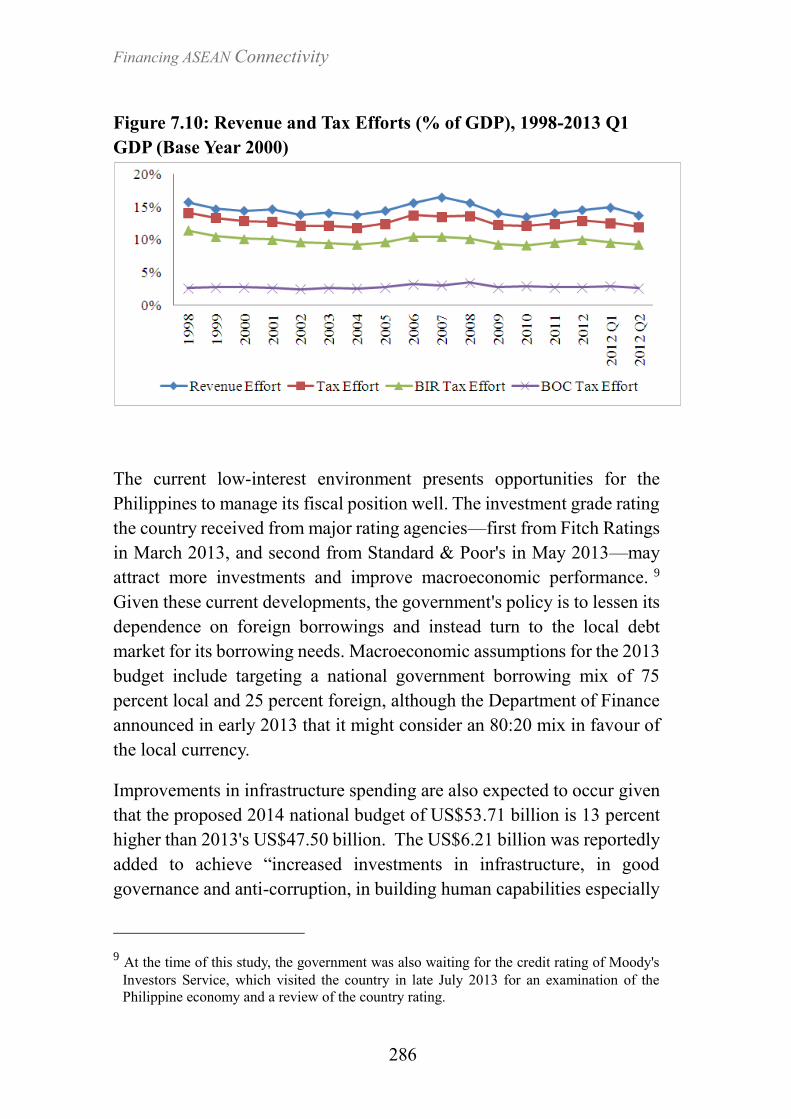
Figure 7.10 presents the trend of the national government revenue effort
from 1998 to early 2013 and shows that the Bureau of Internal Revenue
(BIR) and Bureau of Customs' (BOC) tax collections, as a percentage of
GDP, have recently declined. These agencies cite the challenges they face
in collecting taxes as among the reasons for the decline in collections. The
BOC representatives usually cite the lower tax base for import duties due
to tariff reduction agreements as one big challenge. The BIR
representatives, on the other hand, cite tax leakages and evasion.
Observers, however, frequently point to corruption as the major reason tax
collection targets are not met. The risk posed by such revenue performance
on the country's fiscal position drives the current administration to pursue
governance reforms in the two tax collecting agencies. At present, the
BOC bureaucracy is being revamped, while a customs modernisation bill
is in the legislative agenda. The BIR is also implementing stricter
procedures to be able to cover tax evaders in its collection base.
Financing ASEAN Connectivity
286
Figure 7.10: Revenue and Tax Efforts (% of GDP), 1998-2013 Q1
GDP (Base Year 2000)
The current low-interest environment presents opportunities for the
Philippines to manage its fiscal position well. The investment grade rating
the country received from major rating agencies—first from Fitch Ratings
in March 2013, and second from Standard & Poor's in May 2013—may
attract more investments and improve macroeconomic performance. 9
Given these current developments, the government's policy is to lessen its
dependence on foreign borrowings and instead turn to the local debt
market for its borrowing needs. Macroeconomic assumptions for the 2013
budget include targeting a national government borrowing mix of 75
percent local and 25 percent foreign, although the Department of Finance
announced in early 2013 that it might consider an 80:20 mix in favour of
the local currency.
Improvements in infrastructure spending are also expected to occur given
that the proposed 2014 national budget of US$53.71 billion is 13 percent
higher than 2013's US$47.50 billion. The US$6.21 billion was reportedly
added to achieve “increased investments in infrastructure, in good
governance and anti-corruption, in building human capabilities especially
9 At the time of this study, the government was also waiting for the credit rating of Moody's
Investors Service, which visited the country in late July 2013 for an examination of the
Philippine economy and a review of the country rating.
Philippines Country Report
287
of the poor, through quality education, public health care and housing, and
in climate change adaptation measures” (Diaz, 2013).
Public-Private Partnerships and the Capital Market
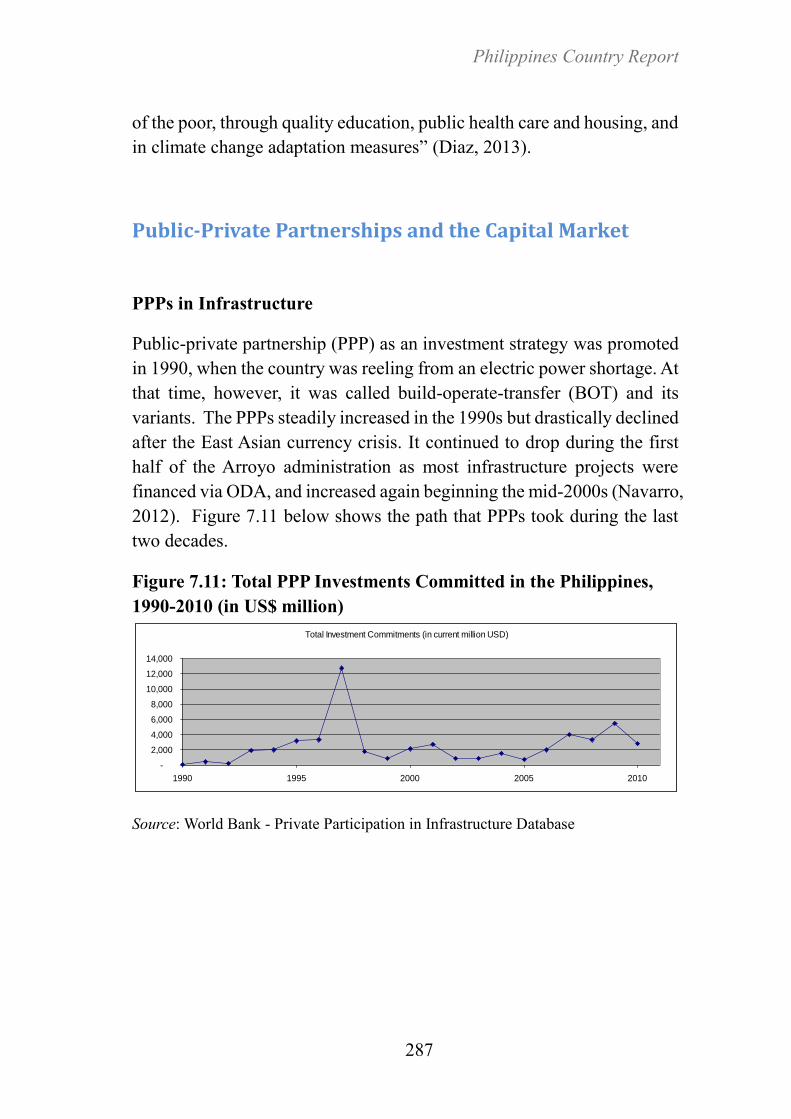
PPPs in Infrastructure
Public-private partnership (PPP) as an investment strategy was promoted
in 1990, when the country was reeling from an electric power shortage. At
that time, however, it was called build-operate-transfer (BOT) and its
variants. The PPPs steadily increased in the 1990s but drastically declined
after the East Asian currency crisis. It continued to drop during the first
half of the Arroyo administration as most infrastructure projects were
financed via ODA, and increased again beginning the mid-2000s (Navarro,
2012). Figure 7.11 below shows the path that PPPs took during the last
two decades.
Figure 7.11: Total PPP Investments Committed in the Philippines,
1990-2010 (in US$ million)
Source: World Bank - Private Participation in Infrastructure Database
Total Investment Commitments (in current million USD)
-
2,000
4,000
6,000
8,000
10,000
12,000
14,000
1990 1995 2000 2005 2010
Financing ASEAN Connectivity
288
Regulatory Framework for PPPs
The regulatory framework for PPPs evolved from the first PPP law, the
Republic Act (RA) 6957 entitled “An Act Authorizing the Financing,
Construction, Operation and Maintenance of Infrastructure Projects by the
Private Sector” and passed in 1990. In 1994, this was amended by RA
7718. At present, RA 7718 and its implementing rules and regulations
(IRR) provide the framework and procedures for the competitive tender
and government support for the following contractual arrangements:
build-operate-transfer, build-transfer, build-own-operate, build-lease-
transfer, build-transfer-operate, contract-add-operate, develop-operate-
transfer, rehabilitate-operate-transfer, and rehabilitate-own-operate. Other
variations of these contractual arrangements need to be approved by the
president of the Philippines.
There are two modes of competition in the Philippine PPP framework—
the solicited proposal process and the unsolicited proposal process. The
solicited mode is the regular tendering process where a government unit
prepares the project feasibility analysis and solicits competitive proposals
from the private sector to undertake the project. In the unsolicited mode,
a government unit may accept an unsolicited proposal from a private firm
under three conditions: (1) The proposed project involves a new concept
or technology and/or is not part of the government’s list of priority
projects; (2) No direct government guarantee, subsidy, or equity is
required; and (3) The government unit has invited comparative or
competitive proposals and no other proposal came in.
Joint ventures between government corporations and private entities must
also follow a competitive process. The Joint Venture Guidelines issued
by the NEDA in 2008 and revised in 2013 provide the rules and procedures
for the competitive selection of private joint venture partners. Under the
guidelines, the private sector can entirely take over a joint venture project
after the government divests itself of any interest in such.
The existing regulators in infrastructure sectors also provide sector-
specific regulatory rules, such as those relating to prices, routes, standards
or operating parameters. These regulators include the Toll Regulatory
Philippines Country Report
289
Board, Maritime Industry Authority, Energy Regulatory Commission,
Civil Aviation Authority of the Philippines, and National Water Resources
Board.
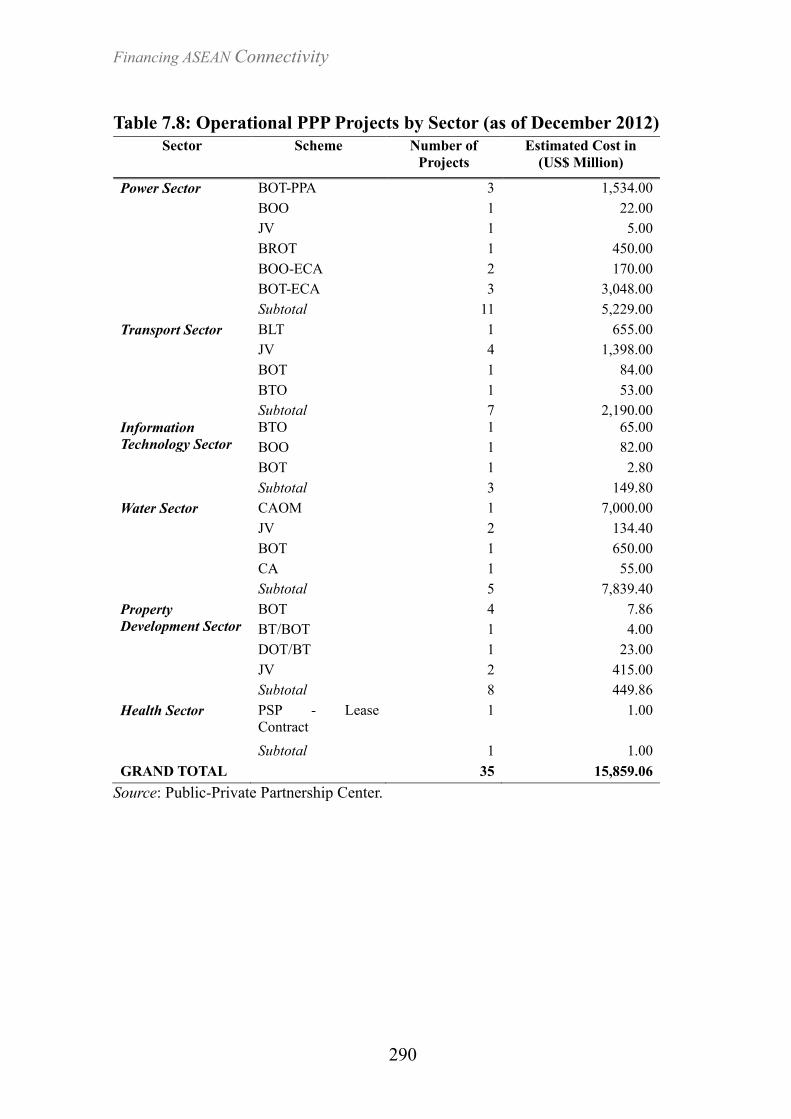
Operational and Proposed PPPs
As of December 2012, about 35 operational projects in the Philippines
valued at US$15.86 billion were undertaken under the framework
provided by RA 7718, the PPP law. Table 7.8 shows the sector distribution
of these projects.
When the current administration revived the PPP programme in 2010, 10
projects were identified as priority projects and promoted to the private
sector. However, only three projects10 have been awarded to date. As of
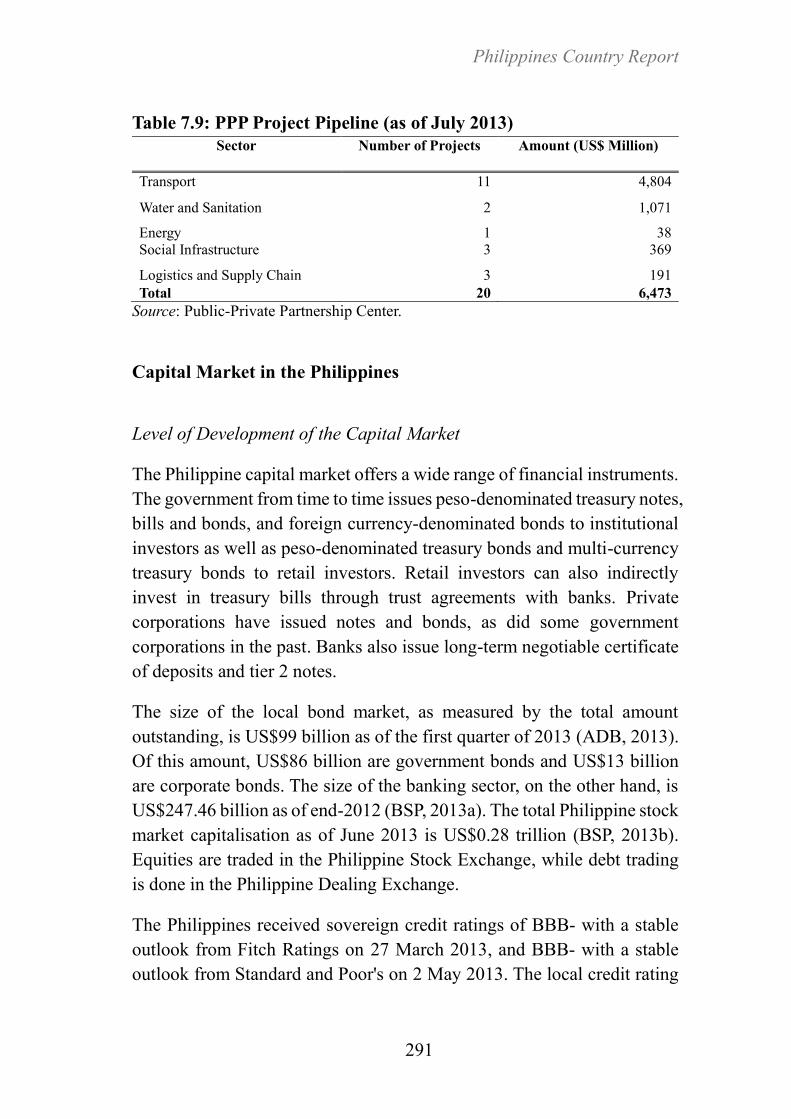
July 2013, the PPP programme consists of 20 projects with a worth of
US$6.47 billion (Table 7.9).
10 These three projects are the PHP1.96-billion (US$0.05 billion) Daang Hari-South Luzon
Expressway Link, the PHP16.42-billion (US$0.39 billion) School Infrastructure Project
Phase I, and the PHP15.86-billion (US$0.38) Ninoy Aquino International Airport
Expressway (NAIA) Phase II.
Financing ASEAN Connectivity
290
Table 7.8: Operational PPP Projects by Sector (as of December 2012)
Sector Scheme Number of
Projects
Estimated Cost in
(US$ Million)
Power Sector BOT-PPA 3 1,534.00
BOO 1 22.00
JV 1 5.00
BROT 1 450.00
BOO-ECA 2 170.00
BOT-ECA 3 3,048.00
Subtotal 11 5,229.00
Transport Sector BLT 1 655.00
JV 4 1,398.00
BOT 1 84.00
BTO 1 53.00
Subtotal 7 2,190.00
Information
Technology Sector
BTO 1 65.00
BOO 1 82.00
BOT 1 2.80
Subtotal 3 149.80
Water Sector CAOM 1 7,000.00
JV 2 134.40
BOT 1 650.00
CA 1 55.00
Subtotal 5 7,839.40
Property
Development Sector
BOT 4 7.86
BT/BOT 1 4.00
DOT/BT 1 23.00
JV 2 415.00
Subtotal 8 449.86
Health Sector PSP - Lease
Contract
1 1.00
Subtotal 1 1.00
GRAND TOTAL 35 15,859.06
Source: Public-Private Partnership Center.
Philippines Country Report
291
Table 7.9: PPP Project Pipeline (as of July 2013)
Sector Number of Projects Amount (US$ Million)
Transport 11 4,804
Water and Sanitation 2 1,071
Energy 1 38
Social Infrastructure 3 369
Logistics and Supply Chain 3 191
Total 20 6,473
Source: Public-Private Partnership Center.
Capital Market in the Philippines
Level of Development of the Capital Market
The Philippine capital market offers a wide range of financial instruments.
The government from time to time issues peso-denominated treasury notes,
bills and bonds, and foreign currency-denominated bonds to institutional
investors as well as peso-denominated treasury bonds and multi-currency
treasury bonds to retail investors. Retail investors can also indirectly
invest in treasury bills through trust agreements with banks. Private
corporations have issued notes and bonds, as did some government
corporations in the past. Banks also issue long-term negotiable certificate
of deposits and tier 2 notes.
The size of the local bond market, as measured by the total amount
outstanding, is US$99 billion as of the first quarter of 2013 (ADB, 2013).
Of this amount, US$86 billion are government bonds and US$13 billion
are corporate bonds. The size of the banking sector, on the other hand, is
US$247.46 billion as of end-2012 (BSP, 2013a). The total Philippine stock
market capitalisation as of June 2013 is US$0.28 trillion (BSP, 2013b).
Equities are traded in the Philippine Stock Exchange, while debt trading
is done in the Philippine Dealing Exchange.
The Philippines received sovereign credit ratings of BBB- with a stable
outlook from Fitch Ratings on 27 March 2013, and BBB- with a stable
outlook from Standard and Poor's on 2 May 2013. The local credit rating
Financing ASEAN Connectivity
292
agency for commercial papers is the Philippine Rating Services
Corporation (PhilRatings).
Infrastructure financing activities in the local capital market currently
include loan syndication or club financing by banks, and corporate bond
issuances of holding companies with infrastructure exposure. To date, no
specific infrastructure bonds have been issued for direct and fresh
financing.
A New Private Equity Fund Co-financed by Pension Funds
The newly created Philippine Investment Alliance for Infrastructure
(PINAI) Fund is another source of financing for Philippine infrastructure
projects. The PINAI Fund is a private equity fund co-financed by pension
funds and the ADB. It is capitalised at US$625 million, where the
Government Service and Insurance System (GSIS), the Philippines’
pension fund for government workers, contributed the largest equity share
at 64 percent. The other equity contributors are: Agemene Pensioen Groep,
a pension fund based in Netherlands, at 24 percent; Macquarie
Infrastructure and Real Assets, which is owned by the Macquarie Group,
at 8 percent; and the ADB at 4 percent. Recently, a private firm pursuing
an 81-MW wind power project for the northern part of the Philippines
expressed interest in tapping the fund (ADB, 2013a).
Challenges in PPPs and Opportunities in the Local Capital Market
Despite the long history of Philippine PPPs, challenges remain. These
include delays in rolling out projects for tender and the current PPP law's
(RA 7718) inadequacy in dealing with competition and implementation
problems.
Issues that gave rise to delays in the tendering process include the
weakened capacity of government units to process PPPs and the lack of a
prudent project development to support the PPP proposals. To address the
capacity issue, capacity-building activities are being conducted for the
Philippines Country Report
293
main agency in charge of the PPP programme (i.e., the Public-Private
Partnership Center) as well as government implementing units and
oversight agencies. To address project quality-at-entry, a Project
Development and Monitoring Facility (PDMF) has been established.
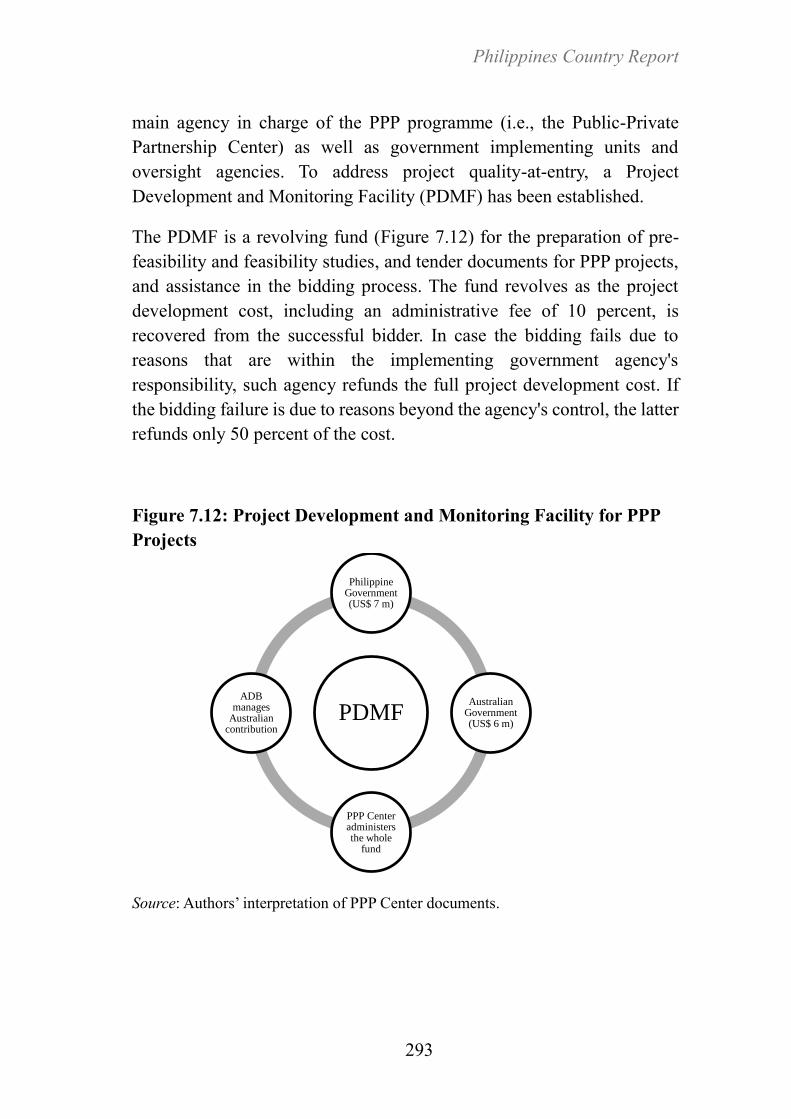
The PDMF is a revolving fund (Figure 7.12) for the preparation of pre-
feasibility and feasibility studies, and tender documents for PPP projects,
and assistance in the bidding process. The fund revolves as the project
development cost, including an administrative fee of 10 percent, is
recovered from the successful bidder. In case the bidding fails due to
reasons that are within the implementing government agency's
responsibility, such agency refunds the full project development cost. If
the bidding failure is due to reasons beyond the agency's control, the latter
refunds only 50 percent of the cost.
Figure 7.12: Project Development and Monitoring Facility for PPP
Projects
Source: Authors’ interpretation of PPP Center documents.
PDMF
Philippine Government (US$ 7 m)
Australian Government (US$ 6 m)
PPP Center administers the whole
fund
ADB manages
Australian contribution
Financing ASEAN Connectivity
294
The initial fund for the PDMF was pooled from the contributions of the
Philippine government (US$7 million) and the government of Australia
(US$6 million). The ADB manages the Australian contribution under its
Capacity Building Technical Assistance project for the PPP Center. The
PPP Center, on the other hand, administers the whole fund and reviews
proposals for PDMF funding.
The inadequacy of the PPP law in dealing with competition and
implementation problems and the need to amend RA 7718 have both been
raised several times in the past. Llanto (2010) explains that the PPP law
(or “BOT law” as referred to in the study) should provide the enabling
policy framework while the IRR should provide the technical and
operational rules. However, as Llanto has argued, the Philippine PPP law
contains both the enabling policy framework and too many details that
should have been in the IRR instead, leaving the government with less
flexibility to change these details in order to conform to the dynamic
nature of such factors as technology and financial markets. At present, the
call for amendment of the PPP law is still alive and being raised from time
to time by the private sector.
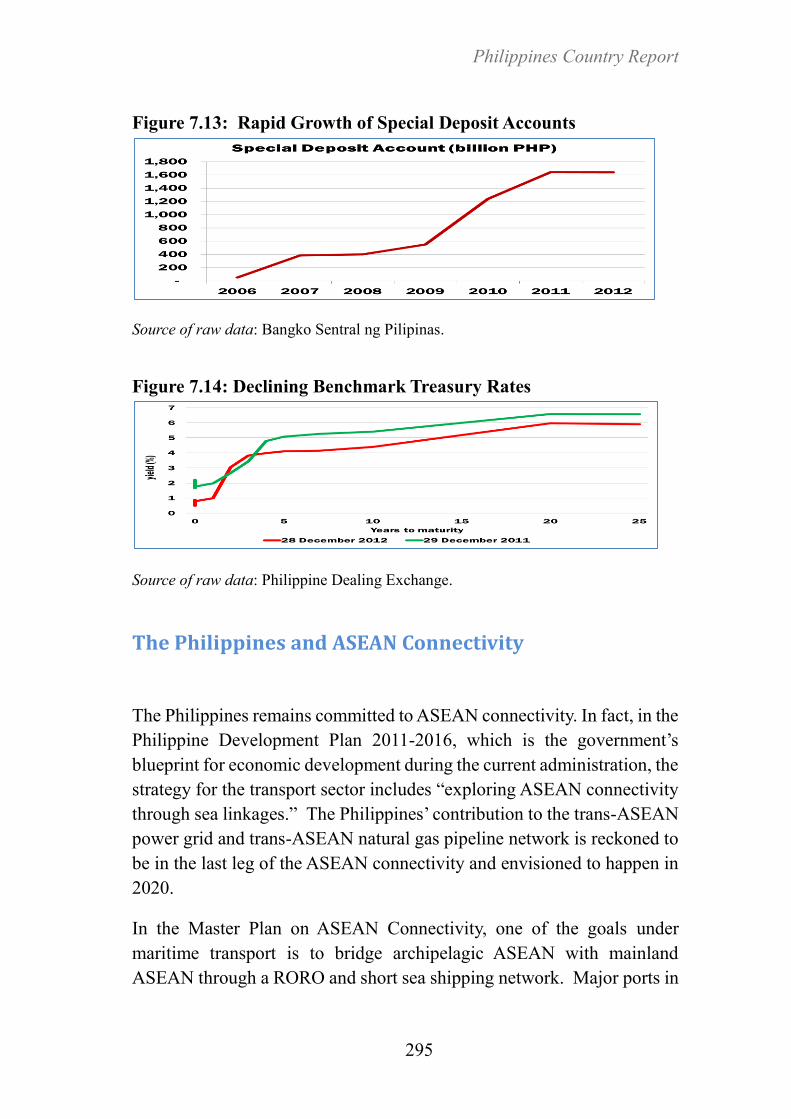
Recent developments in the capital market also present opportunities for
accelerating private sector participation in infrastructure investments.
Liquidity in the banking system has been growing, and interest rates have
been declining. Figure 7.13 shows that special deposit accounts, the main
instrument of the Bangko Sentral ng Pilipinas (BSP) in mopping up excess
liquidity in the financial sector, has dramatically grown and reached
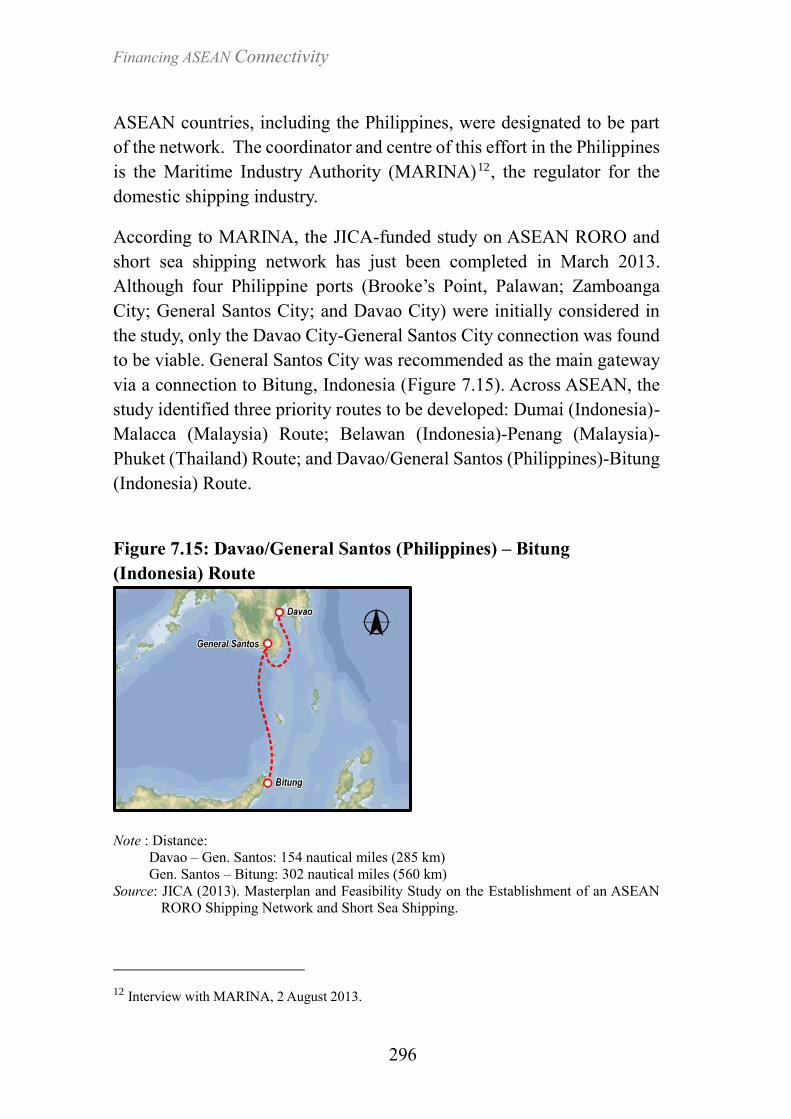
US$38.84 billion in end-2012. 11 Figure 7.14 shows the decline in
reference interest rates across all maturities as of December 2012, which
is actually a continuation of a general decline since 2009. The challenge
now for the private sector is how to take advantage of these positive
developments. Meanwhile, the challenge for the government is how to be
facilitative in channelling capital market resources to PPP projects.
11 The special deposit accounts, which allow banks and retail investors to park their excess
liquidity at the BSP and earn above-market rates, however, will be phased out by the BSP in
November 2013.
Philippines Country Report
295
Figure 7.13: Rapid Growth of Special Deposit Accounts
Source of raw data: Bangko Sentral ng Pilipinas.
Figure 7.14: Declining Benchmark Treasury Rates
Source of raw data: Philippine Dealing Exchange.
The Philippines and ASEAN Connectivity
The Philippines remains committed to ASEAN connectivity. In fact, in the
Philippine Development Plan 2011-2016, which is the government’s
blueprint for economic development during the current administration, the
strategy for the transport sector includes “exploring ASEAN connectivity
through sea linkages.” The Philippines’ contribution to the trans-ASEAN
power grid and trans-ASEAN natural gas pipeline network is reckoned to
be in the last leg of the ASEAN connectivity and envisioned to happen in
2020.
In the Master Plan on ASEAN Connectivity, one of the goals under
maritime transport is to bridge archipelagic ASEAN with mainland
ASEAN through a RORO and short sea shipping network. Major ports in
Financing ASEAN Connectivity
296
ASEAN countries, including the Philippines, were designated to be part
of the network. The coordinator and centre of this effort in the Philippines
is the Maritime Industry Authority (MARINA)12 , the regulator for the
domestic shipping industry.
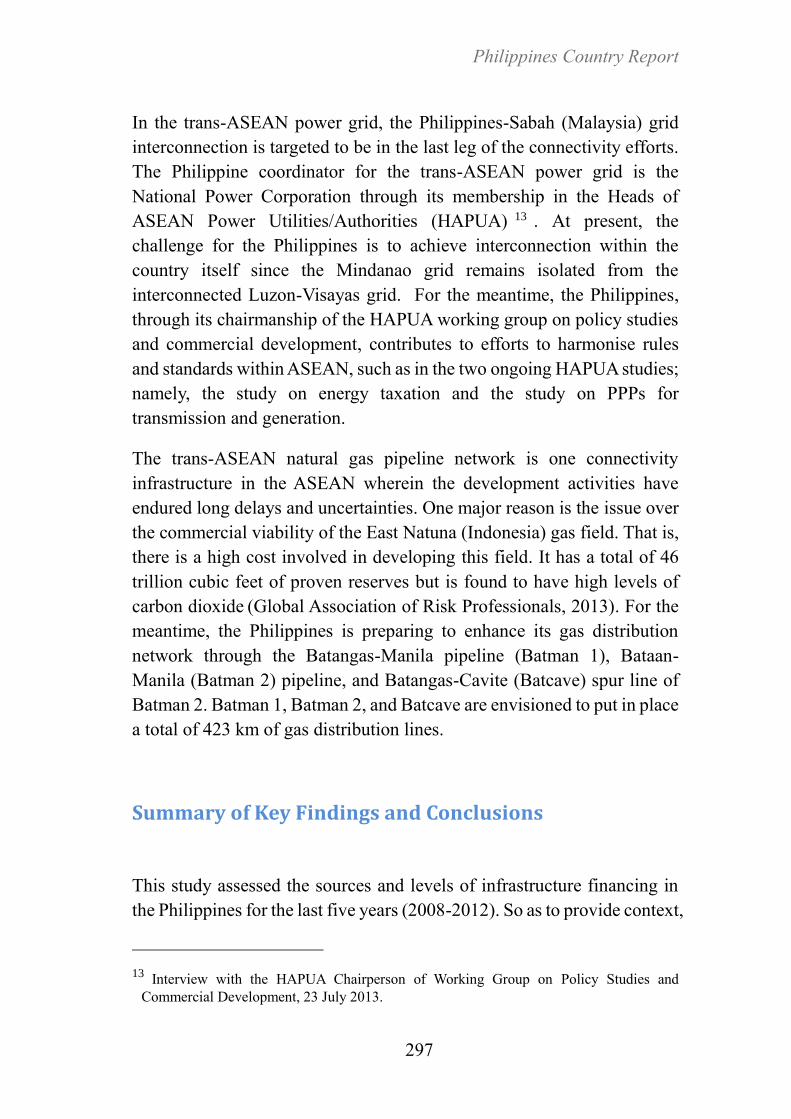
According to MARINA, the JICA-funded study on ASEAN RORO and
short sea shipping network has just been completed in March 2013.
Although four Philippine ports (Brooke’s Point, Palawan; Zamboanga
City; General Santos City; and Davao City) were initially considered in
the study, only the Davao City-General Santos City connection was found
to be viable. General Santos City was recommended as the main gateway
via a connection to Bitung, Indonesia (Figure 7.15). Across ASEAN, the
study identified three priority routes to be developed: Dumai (Indonesia)-
Malacca (Malaysia) Route; Belawan (Indonesia)-Penang (Malaysia)-
Phuket (Thailand) Route; and Davao/General Santos (Philippines)-Bitung
(Indonesia) Route.
Figure 7.15: Davao/General Santos (Philippines) – Bitung
(Indonesia) Route
Note : Distance:
Davao – Gen. Santos: 154 nautical miles (285 km)
Gen. Santos – Bitung: 302 nautical miles (560 km)
Source: JICA (2013). Masterplan and Feasibility Study on the Establishment of an ASEAN
RORO Shipping Network and Short Sea Shipping.
12 Interview with MARINA, 2 August 2013.
Philippines Country Report
297
In the trans-ASEAN power grid, the Philippines-Sabah (Malaysia) grid
interconnection is targeted to be in the last leg of the connectivity efforts.
The Philippine coordinator for the trans-ASEAN power grid is the
National Power Corporation through its membership in the Heads of
ASEAN Power Utilities/Authorities (HAPUA) 13 . At present, the
challenge for the Philippines is to achieve interconnection within the
country itself since the Mindanao grid remains isolated from the
interconnected Luzon-Visayas grid. For the meantime, the Philippines,
through its chairmanship of the HAPUA working group on policy studies
and commercial development, contributes to efforts to harmonise rules
and standards within ASEAN, such as in the two ongoing HAPUA studies;
namely, the study on energy taxation and the study on PPPs for
transmission and generation.
The trans-ASEAN natural gas pipeline network is one connectivity
infrastructure in the ASEAN wherein the development activities have
endured long delays and uncertainties. One major reason is the issue over
the commercial viability of the East Natuna (Indonesia) gas field. That is,
there is a high cost involved in developing this field. It has a total of 46
trillion cubic feet of proven reserves but is found to have high levels of
carbon dioxide (Global Association of Risk Professionals, 2013). For the
meantime, the Philippines is preparing to enhance its gas distribution
network through the Batangas-Manila pipeline (Batman 1), Bataan-
Manila (Batman 2) pipeline, and Batangas-Cavite (Batcave) spur line of
Batman 2. Batman 1, Batman 2, and Batcave are envisioned to put in place
a total of 423 km of gas distribution lines.
Summary of Key Findings and Conclusions
This study assessed the sources and levels of infrastructure financing in
the Philippines for the last five years (2008-2012). So as to provide context,
13 Interview with the HAPUA Chairperson of Working Group on Policy Studies and
Commercial Development, 23 July 2013.
Financing ASEAN Connectivity
298
the assessment is preceded by a brief overview of the infrastructure
situation in the country.
Clearly, there had been underinvestment in infrastructure. Public
infrastructure spending as a share of GDP averaged at only 1.40 percent
to 2.09 percent in 2008-2012, which is a far cry from the current target of
5 percent of GDP over the medium term. As a result of underinvestment,
the infrastructure stocks and levels of access in the Philippines are low.
Moreover, the country has lagged behind most of its ASEAN neighbours
in upgrading the quality of its infrastructure.
The national budget for the past five years shows that actual infrastructure
spending as a share of the appropriated budget was 11 percent in 2008, 13
percent in 2009, and 11 percent again in 2010-2012. Government
underspending in infrastructure is more visible when one looks at levels:
Public infrastructure spending dropped from US$3.98 billion in 2009 to
US$3.71 billion in 2010, and dipped further to US$3.23 billion in 2011
before it started to increase in 2012 as a result of the government’s
disbursement acceleration programme.
As external sources of financing, ODA partners have historically
prioritised infrastructure financing. However, in the past five years, the
country has been decreasing its reliance on ODA loans for infrastructure
financing. These loans declined from a high of US$6.13 billion for 58
projects in 2008 to US$5.19 billion for 39 projects in 2012.
This study likewise took stock of PPPs in the Philippines and found that
there are currently 35 operational PPP projects worth US$15.86 billion
while the PPP pipeline consists of 20 proposed projects estimated to cost
US$6.47 billion. The current PPP programme has encountered delays in
the tendering process due to the weak capacity of government units to
ensure project quality-at-entry and efficiency in the processing of PPPs.
The inadequacy of the PPP law in dealing with competition and
implementation problems is also a key challenge; thus, the call to amend
the law persists. The pressing need to address these challenges is all the
more magnified by the opportunity presented by the currently liquid
capital market and the low interest rate environment—an opportunity to
Philippines Country Report
299
invest in infrastructure with the help of the private sector that should not
be missed by the current administration.
This study also provides updates on the Philippines’ participation in
building the physical connectivity of the ASEAN through infrastructure.
The feasibility study for the strategy of bridging archipelagic ASEAN with
mainland ASEAN through a RORO and short sea shipping network was
finished recently. Although four Philippine ports were initially considered
in the study, only two ports were found to be viable—Davao City and
General Santos City, with General Santos City acting as the main gateway
via a connection to Bitung, Indonesia.
In the review of the sources of infrastructure financing, this study has
uncovered a positive outlook for the Philippine government’s fiscal health
as well as the opportunities presented by new sources such a regional fund
for ASEAN and a private equity fund capitalised with pension funds.
However, based on recent experience, it is not really the availability of
financial resources that is primarily restraining infrastructure development
in the Philippines but the pace at which investments are being pursued.
While the ODA had been relied on less and less and the fiscal position of
the government had improved, there had been underspending in
programmes and projects as the government focused instead on due
diligence reviews and governance reforms. The PPP programme was
revitalised and given much attention but delivered short on its promise due
to delays in the tendering process, which in turn, were due to insufficient
bankable projects.
The important lesson from all these is that an effective infrastructure
financing strategy must not only focus on resource availability for the hard
infrastructure but also on means to facilitate the way projects are identified,
designed, proposed, reviewed, and implemented. In short, the resource
and institutional requirements for project development, capacity building,
and governance reforms must also be considered. Project development
facilities need to be expanded in scale and scope to cover not only project
development studies but also studies on reforms needed to make the
complex wheels of the government evaluation machinery run more
efficiently and local commercial partners act on opportunities more
Financing ASEAN Connectivity
300
quickly. This is an important lesson not only for the Philippines but also
for the whole ASEAN region given that there is a seemingly lack of an
ASEAN strategy to institutionalise project development facilities for
infrastructure.
References
ASEAN-Japan Transport Partnership (2012), 'Water Transport:
Philippines 2012'. Available from
http://www.ajtpweb.org/statistics/Philippines/water-transport-
philippines-2012.
Asian Development Bank [ADB] (2011), Report and Recommendation of
the President to the Board of Directors: Proposed Equity
Contribution and Administration of ASEAN Infrastructure Fund.
Manila: ADB.
Asian Development Bank [ADB] (2013a), Asia Bonds Monitor June 2013.
Manila: Asian Development Bank.
Asian Development Bank [ADB] (2013b). 'PINAI Fund to Finance Wind
Power Project in Northern Philippines'. July 2013. Available from:
http://www.adb.org/news/pinai-fundfinance-wind-power-project-
northern-philippines. (Accessed: 1 August 2013).
Bangko Sentral ng Pilipinas [BSP] (2013a), 'Total Resources of the
Philippine Financial System'. Available from:
http://www.bsp.gov.ph/statistics/efs_fsa1.asp. (Accessed 2 August
2013).
Bangko Sentral ng Pilipinas [BSP] (2013b), 'Philippine Stock Market
Capitalisation'. Available from
http://www.bsp.gov.ph/statistics/spei_new/tab66.htm (Accessed: 2
August 2013).
Department of Budget and Management [DBM] (2013), National
Expenditure Programme (Annual, 2008-2014). Manila: DBM.
Department of Budget and Management [DBM] (2013), Budget of
Expenditures and Sources of Financing 2013. Manila: DBM.
Philippines Country Report
301
Department of Public Works and Highways [DPWH] (2013), 'DPWH
Atlas 2013'. Available from:
http://www.dpwh.gov.ph/infrastructure/infra_stat/2013%20Atlas/1
23.htm (Accessed: 22 July 2013).
Department of Transportation and Communication [DOTC] (2012),
‘DOTC to Implement Measures To Ease NAIA Runway
Congestion’. Press Release available from
http://www.gov.ph/2012/05/08/dotc-to-implement-measures-to-
ease-naia-runway-congestion/ (Accessed: 22 July 2013).
Diaz, J. (2013), 'Palace Eyeing P2.27-Trillion Budget for 2014'. The
Philippine Star. Available from
http://www.philstar.com/headlines/2013/03/25/923722/palace-
eyeing-p2.27-trillion-budget-2014 (Accessed: 22 July 2013).
Global Association of Risk Professionals (2013), 'Indonesian Government
Seeks To Give Contract for Gas Field in South China Sea'. Available
from: http://www.garp.org/risk-news-and-resources/risk-
headlines/story.aspx?newsId=56958 (Accessed: 22 July 2013).
Japan International Cooperation Agency [JICA] (2013), 'Masterplan and
Feasibility Study on the Establishment of an ASEAN RoRo
Shipping Network and Short Sea Shipping'. Unpublished.
Llanto, G.M. (2010), A Review of Build-Operate-Transfer for
Infrastructure Development. Makati: Philippine Institute for
Development Studies.
National Economic and Development Authority [NEDA] (2013), 'ODA
Portfolio Review (annual, 2007-2012)'. Unpublished.
National Economic and Development Authority [NEDA] (2011),
Philippine Development Plan 2011-2016. Pasig: NEDA.
National Economic and Development Authority [NEDA] (2011), Public
Investment Programme 2011-2016. Pasig: NEDA.
National Economic and Development Authority [NEDA] (2013),
(Revalidated) Public Investment Programme 2011-2016. Pasig:
NEDA.
National Economic and Development Authority [NEDA] (2012),
Socioeconomic Report: The First Two Years of the Aquino
Administration, 2010-2012. Pasig: NEDA.
Financing ASEAN Connectivity
302
National Statistical Coordination Board (2012) ‘Chapter 13:
Transportation and Communication’. In Philippine Statistical
Yearbook 2012. Makati City: NSCB.
Navarro, A.M. and J.T. Yap (2012), 'Macroeconomic Trends in 2011'. In
Economic Policy Monitor 2012. Makati: Philippine Institute for
Development Studies.
Navarro, A.M. and J.T. Yap (2013), 'Macroeconomic Developments in
2012'. In Economic Policy Monitor 2013. Manila: Philippine
Institute for Development Studies.
Navarro, A.M. (2012), 'Achieving Inclusive Growth in the Philippines'.
East Asian Policy 4(04), pp. 75-83.
Philippine Ports Authority. (2012). 2012 Annual Report. Port Area,
Manila: Phlippines. Retrieved from
http://www.ppa.com.ph/AnnualReport/Final%202012%20PPA%2
0AR.pdf (Accessed: 22 July 2013).
Schwab, K. (ed.) (2013), The Global Competitiveness Report 2012–2013.
Geneva: World Economic Forum.
Philippines Country Report
303
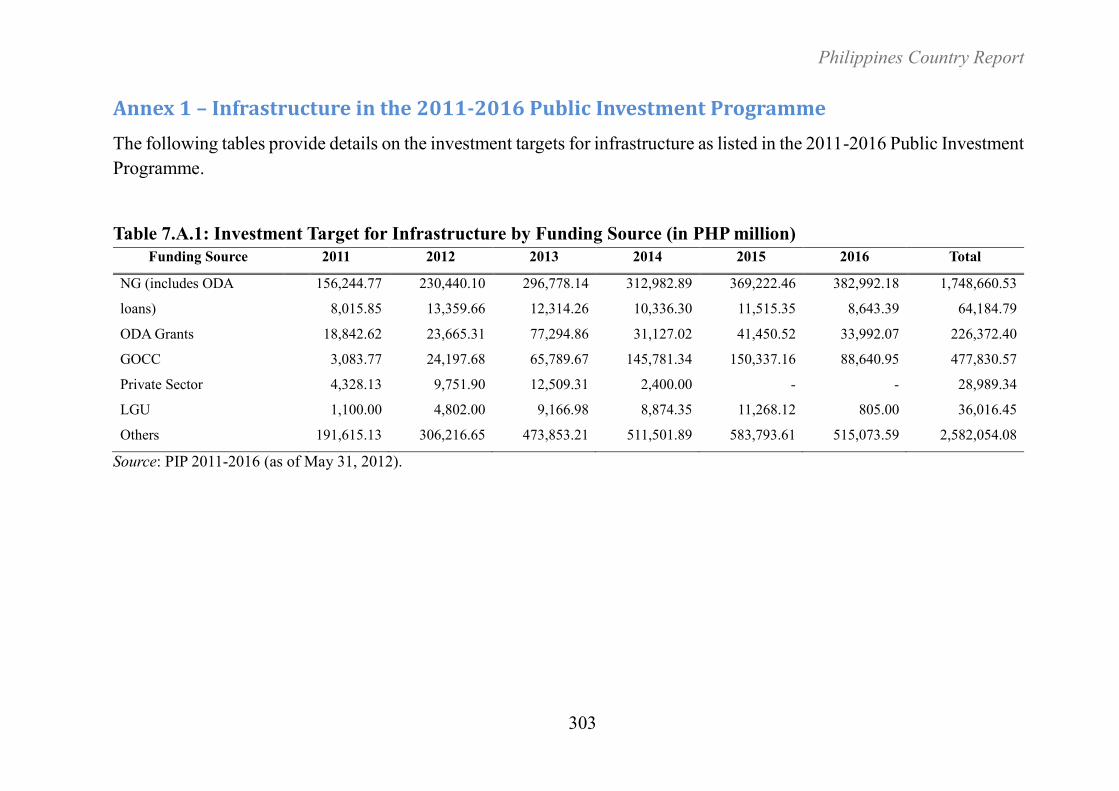
Annex 1 – Infrastructure in the 2011-2016 Public Investment Programme
The following tables provide details on the investment targets for infrastructure as listed in the 2011-2016 Public Investment
Programme.
Table 7.A.1: Investment Target for Infrastructure by Funding Source (in PHP million)
Funding Source 2011 2012 2013 2014 2015 2016 Total
NG (includes ODA 156,244.77 230,440.10 296,778.14 312,982.89 369,222.46 382,992.18 1,748,660.53
loans) 8,015.85 13,359.66 12,314.26 10,336.30 11,515.35 8,643.39 64,184.79
ODA Grants 18,842.62 23,665.31 77,294.86 31,127.02 41,450.52 33,992.07 226,372.40
GOCC 3,083.77 24,197.68 65,789.67 145,781.34 150,337.16 88,640.95 477,830.57
Private Sector 4,328.13 9,751.90 12,509.31 2,400.00 - - 28,989.34
LGU 1,100.00 4,802.00 9,166.98 8,874.35 11,268.12 805.00 36,016.45
Others 191,615.13 306,216.65 473,853.21 511,501.89 583,793.61 515,073.59 2,582,054.08
Source: PIP 2011-2016 (as of May 31, 2012).
Financing ASEAN Connectivity
304
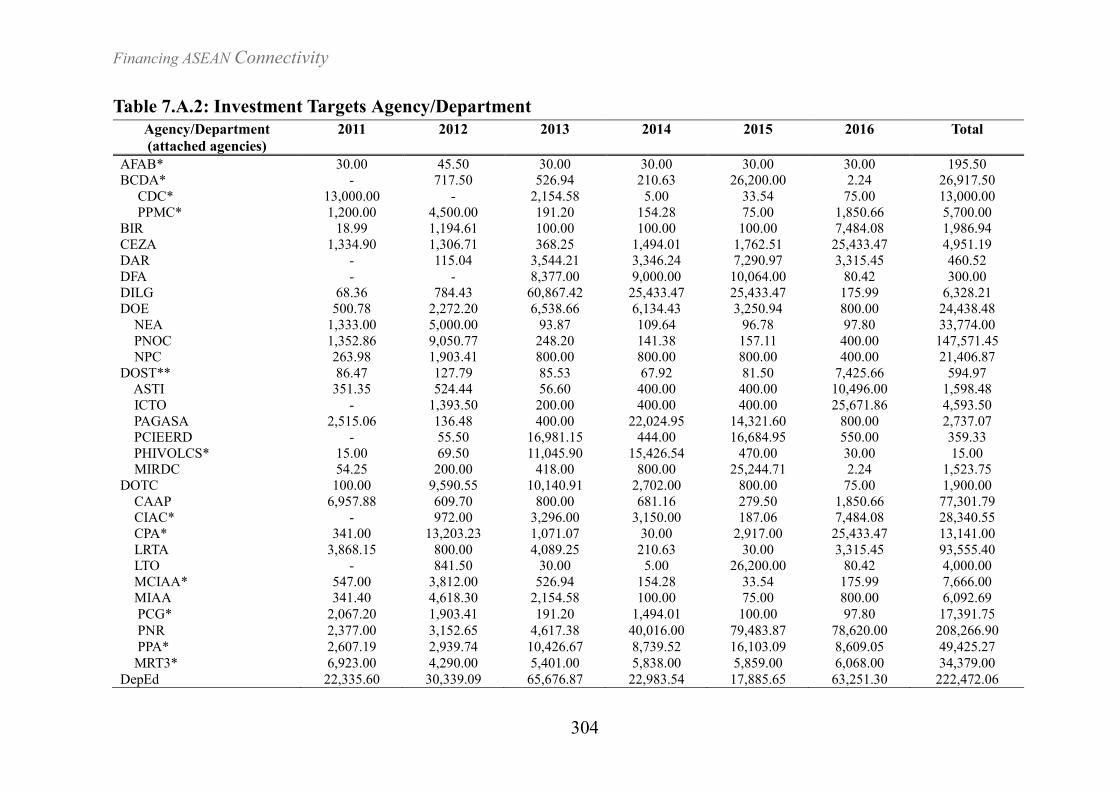
Table 7.A.2: Investment Targets Agency/Department
Agency/Department
(attached agencies)
2011 2012 2013 2014 2015 2016 Total
AFAB* 30.00 45.50 30.00 30.00 30.00 30.00 195.50
BCDA* - 717.50 526.94 210.63 26,200.00 2.24 26,917.50
CDC* 13,000.00 - 2,154.58 5.00 33.54 75.00 13,000.00
PPMC* 1,200.00 4,500.00 191.20 154.28 75.00 1,850.66 5,700.00
BIR 18.99 1,194.61 100.00 100.00 100.00 7,484.08 1,986.94
CEZA 1,334.90 1,306.71 368.25 1,494.01 1,762.51 25,433.47 4,951.19
DAR - 115.04 3,544.21 3,346.24 7,290.97 3,315.45 460.52
DFA - - 8,377.00 9,000.00 10,064.00 80.42 300.00
DILG 68.36 784.43 60,867.42 25,433.47 25,433.47 175.99 6,328.21
DOE 500.78 2,272.20 6,538.66 6,134.43 3,250.94 800.00 24,438.48
NEA 1,333.00 5,000.00 93.87 109.64 96.78 97.80 33,774.00
PNOC 1,352.86 9,050.77 248.20 141.38 157.11 400.00 147,571.45
NPC 263.98 1,903.41 800.00 800.00 800.00 400.00 21,406.87
DOST** 86.47 127.79 85.53 67.92 81.50 7,425.66 594.97
ASTI 351.35 524.44 56.60 400.00 400.00 10,496.00 1,598.48
ICTO - 1,393.50 200.00 400.00 400.00 25,671.86 4,593.50
PAGASA 2,515.06 136.48 400.00 22,024.95 14,321.60 800.00 2,737.07
PCIEERD - 55.50 16,981.15 444.00 16,684.95 550.00 359.33
PHIVOLCS* 15.00 69.50 11,045.90 15,426.54 470.00 30.00 15.00
MIRDC 54.25 200.00 418.00 800.00 25,244.71 2.24 1,523.75
DOTC 100.00 9,590.55 10,140.91 2,702.00 800.00 75.00 1,900.00
CAAP 6,957.88 609.70 800.00 681.16 279.50 1,850.66 77,301.79
CIAC* - 972.00 3,296.00 3,150.00 187.06 7,484.08 28,340.55
CPA* 341.00 13,203.23 1,071.07 30.00 2,917.00 25,433.47 13,141.00
LRTA 3,868.15 800.00 4,089.25 210.63 30.00 3,315.45 93,555.40
LTO - 841.50 30.00 5.00 26,200.00 80.42 4,000.00
MCIAA* 547.00 3,812.00 526.94 154.28 33.54 175.99 7,666.00
MIAA 341.40 4,618.30 2,154.58 100.00 75.00 800.00 6,092.69
PCG* 2,067.20 1,903.41 191.20 1,494.01 100.00 97.80 17,391.75
PNR 2,377.00 3,152.65 4,617.38 40,016.00 79,483.87 78,620.00 208,266.90
PPA* 2,607.19 2,939.74 10,426.67 8,739.52 16,103.09 8,609.05 49,425.27
MRT3* 6,923.00 4,290.00 5,401.00 5,838.00 5,859.00 6,068.00 34,379.00
DepEd 22,335.60 30,339.09 65,676.87 22,983.54 17,885.65 63,251.30 222,472.06
Philippines Country Report
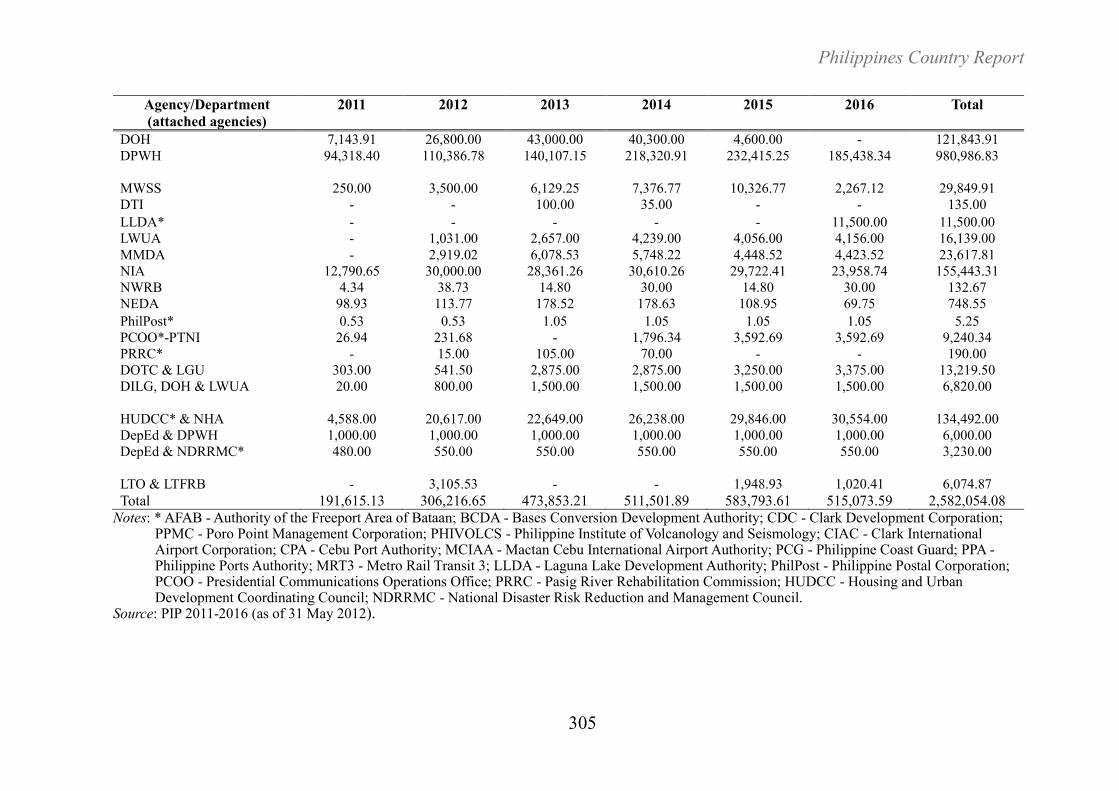
305
Agency/Department
(attached agencies)
2011 2012 2013 2014 2015 2016 Total
DOH 7,143.91 26,800.00 43,000.00 40,300.00 4,600.00 - 121,843.91
DPWH 94,318.40 110,386.78 140,107.15 218,320.91 232,415.25 185,438.34 980,986.83
MWSS 250.00 3,500.00 6,129.25 7,376.77 10,326.77 2,267.12 29,849.91
DTI - - 100.00 35.00 - - 135.00
LLDA* - - - - - 11,500.00 11,500.00
LWUA - 1,031.00 2,657.00 4,239.00 4,056.00 4,156.00 16,139.00
MMDA - 2,919.02 6,078.53 5,748.22 4,448.52 4,423.52 23,617.81
NIA 12,790.65 30,000.00 28,361.26 30,610.26 29,722.41 23,958.74 155,443.31
NWRB 4.34 38.73 14.80 30.00 14.80 30.00 132.67
NEDA 98.93 113.77 178.52 178.63 108.95 69.75 748.55
PhilPost* 0.53 0.53 1.05 1.05 1.05 1.05 5.25
PCOO*-PTNI 26.94 231.68 - 1,796.34 3,592.69 3,592.69 9,240.34
PRRC* - 15.00 105.00 70.00 - - 190.00
DOTC & LGU 303.00 541.50 2,875.00 2,875.00 3,250.00 3,375.00 13,219.50
DILG, DOH & LWUA 20.00 800.00 1,500.00 1,500.00 1,500.00 1,500.00 6,820.00
HUDCC* & NHA 4,588.00 20,617.00 22,649.00 26,238.00 29,846.00 30,554.00 134,492.00
DepEd & DPWH 1,000.00 1,000.00 1,000.00 1,000.00 1,000.00 1,000.00 6,000.00
DepEd & NDRRMC* 480.00 550.00 550.00 550.00 550.00 550.00 3,230.00
LTO & LTFRB - 3,105.53 - - 1,948.93 1,020.41 6,074.87
Total 191,615.13 306,216.65 473,853.21 511,501.89 583,793.61 515,073.59 2,582,054.08
Notes: * AFAB - Authority of the Freeport Area of Bataan; BCDA - Bases Conversion Development Authority; CDC - Clark Development Corporation; PPMC - Poro Point Management Corporation; PHIVOLCS - Philippine Institute of Volcanology and Seismology; CIAC - Clark International Airport Corporation; CPA - Cebu Port Authority; MCIAA - Mactan Cebu International Airport Authority; PCG - Philippine Coast Guard; PPA - Philippine Ports Authority; MRT3 - Metro Rail Transit 3; LLDA - Laguna Lake Development Authority; PhilPost - Philippine Postal Corporation; PCOO - Presidential Communications Operations Office; PRRC - Pasig River Rehabilitation Commission; HUDCC - Housing and Urban Development Coordinating Council; NDRRMC - National Disaster Risk Reduction and Management Council.
Source: PIP 2011-2016 (as of 31 May 2012).
Financing ASEAN Connectivity
306
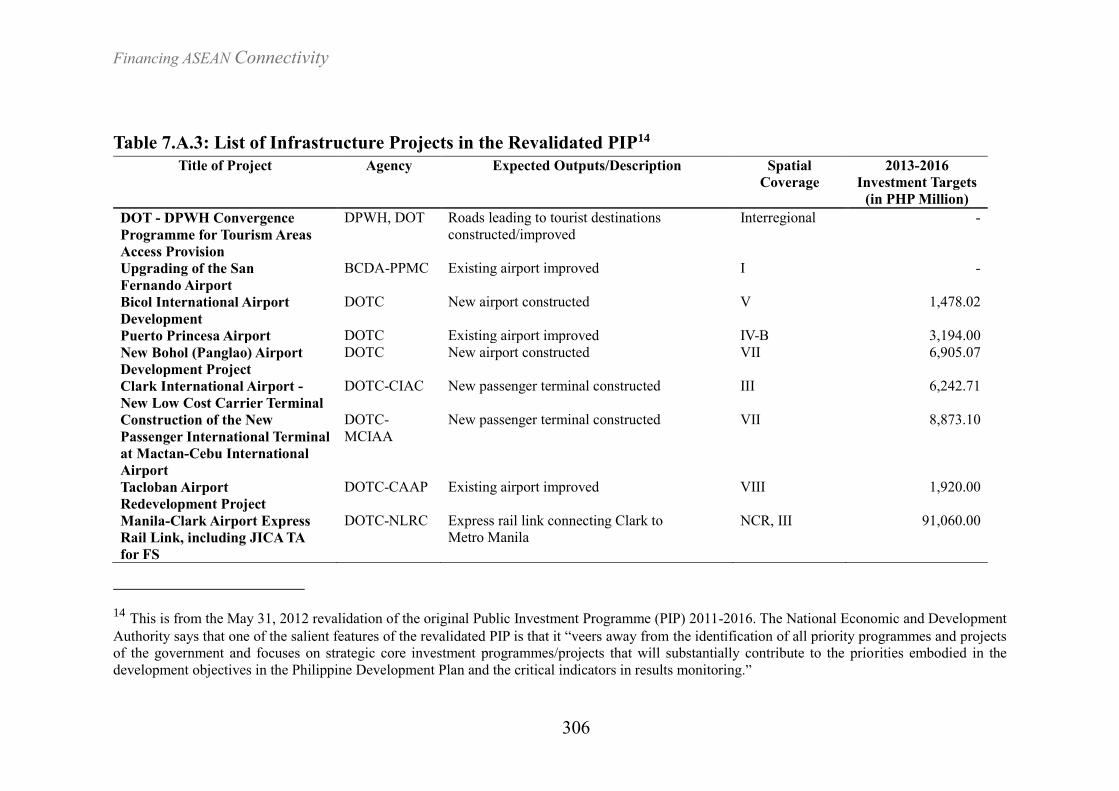
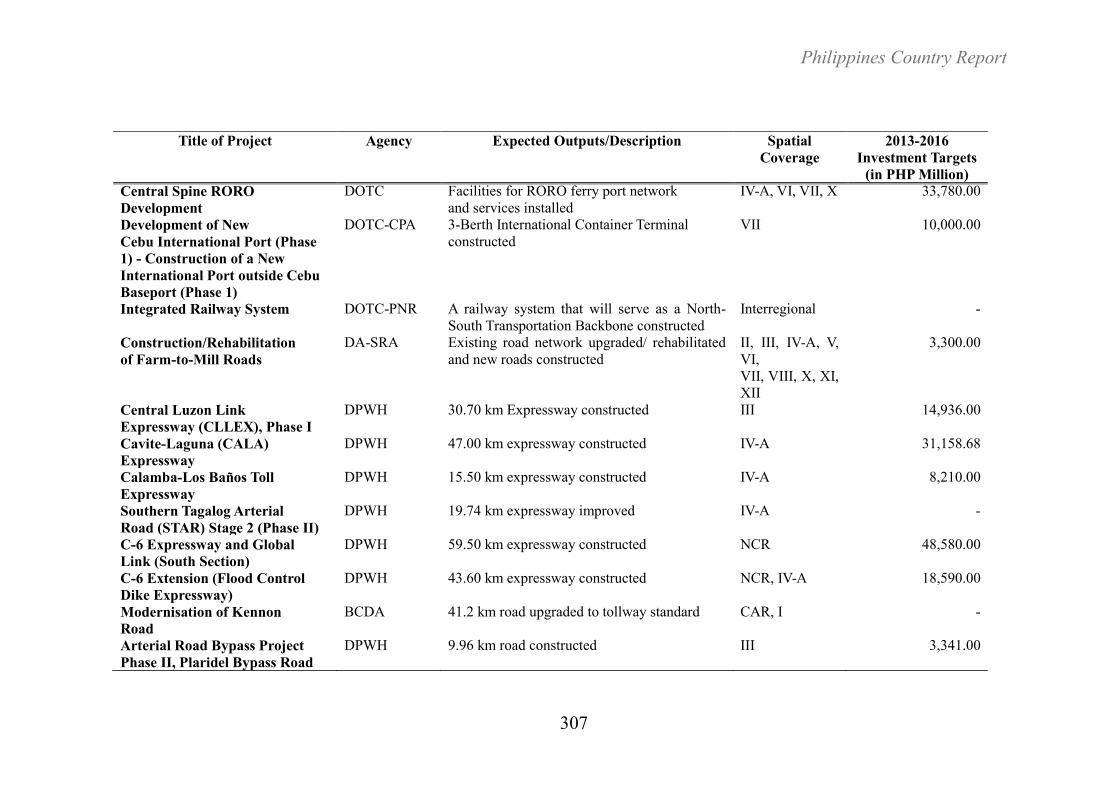
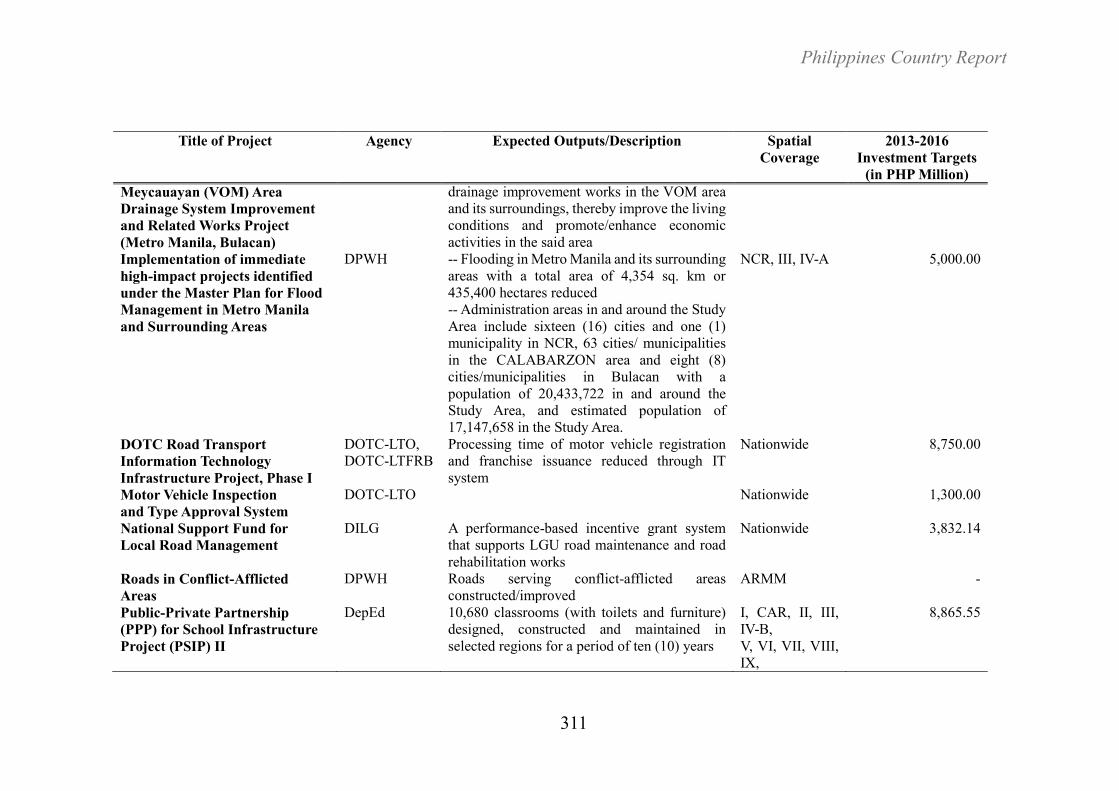
Table 7.A.3: List of Infrastructure Projects in the Revalidated PIP14
Title of Project Agency Expected Outputs/Description Spatial
Coverage
2013-2016
Investment Targets
(in PHP Million)
DOT - DPWH Convergence
Programme for Tourism Areas
Access Provision
DPWH, DOT Roads leading to tourist destinations
constructed/improved
Interregional -
Upgrading of the San
Fernando Airport
BCDA-PPMC Existing airport improved I -
Bicol International Airport
Development
DOTC New airport constructed V 1,478.02
Puerto Princesa Airport DOTC Existing airport improved IV-B 3,194.00
New Bohol (Panglao) Airport
Development Project
DOTC New airport constructed VII 6,905.07
Clark International Airport -
New Low Cost Carrier Terminal
DOTC-CIAC New passenger terminal constructed III 6,242.71
Construction of the New
Passenger International Terminal
at Mactan-Cebu International
Airport
DOTC-
MCIAA
New passenger terminal constructed VII 8,873.10
Tacloban Airport
Redevelopment Project
DOTC-CAAP Existing airport improved VIII 1,920.00
Manila-Clark Airport Express
Rail Link, including JICA TA
for FS
DOTC-NLRC Express rail link connecting Clark to
Metro Manila
NCR, III 91,060.00
14 This is from the May 31, 2012 revalidation of the original Public Investment Programme (PIP) 2011-2016. The National Economic and Development
Authority says that one of the salient features of the revalidated PIP is that it “veers away from the identification of all priority programmes and projects
of the government and focuses on strategic core investment programmes/projects that will substantially contribute to the priorities embodied in the
development objectives in the Philippine Development Plan and the critical indicators in results monitoring.”
Philippines Country Report
307
Title of Project Agency Expected Outputs/Description Spatial
Coverage
2013-2016
Investment Targets
(in PHP Million)
Central Spine RORO
Development
DOTC Facilities for RORO ferry port network
and services installed
IV-A, VI, VII, X 33,780.00
Development of New
Cebu International Port (Phase
1) - Construction of a New
International Port outside Cebu
Baseport (Phase 1)
DOTC-CPA 3-Berth International Container Terminal
constructed
VII 10,000.00
Integrated Railway System DOTC-PNR A railway system that will serve as a North-
South Transportation Backbone constructed
Interregional -
Construction/Rehabilitation
of Farm-to-Mill Roads
DA-SRA Existing road network upgraded/ rehabilitated
and new roads constructed
II, III, IV-A, V,
VI,
VII, VIII, X, XI,
XII
3,300.00
Central Luzon Link
Expressway (CLLEX), Phase I
DPWH 30.70 km Expressway constructed III 14,936.00
Cavite-Laguna (CALA)
Expressway
DPWH 47.00 km expressway constructed IV-A 31,158.68
Calamba-Los Baños Toll
Expressway
DPWH 15.50 km expressway constructed IV-A 8,210.00
Southern Tagalog Arterial
Road (STAR) Stage 2 (Phase II)
DPWH 19.74 km expressway improved IV-A -
C-6 Expressway and Global
Link (South Section)
DPWH 59.50 km expressway constructed NCR 48,580.00
C-6 Extension (Flood Control
Dike Expressway)
DPWH 43.60 km expressway constructed NCR, IV-A 18,590.00
Modernisation of Kennon
Road
BCDA 41.2 km road upgraded to tollway standard CAR, I -
Arterial Road Bypass Project
Phase II, Plaridel Bypass Road
DPWH 9.96 km road constructed III 3,341.00
Financing ASEAN Connectivity
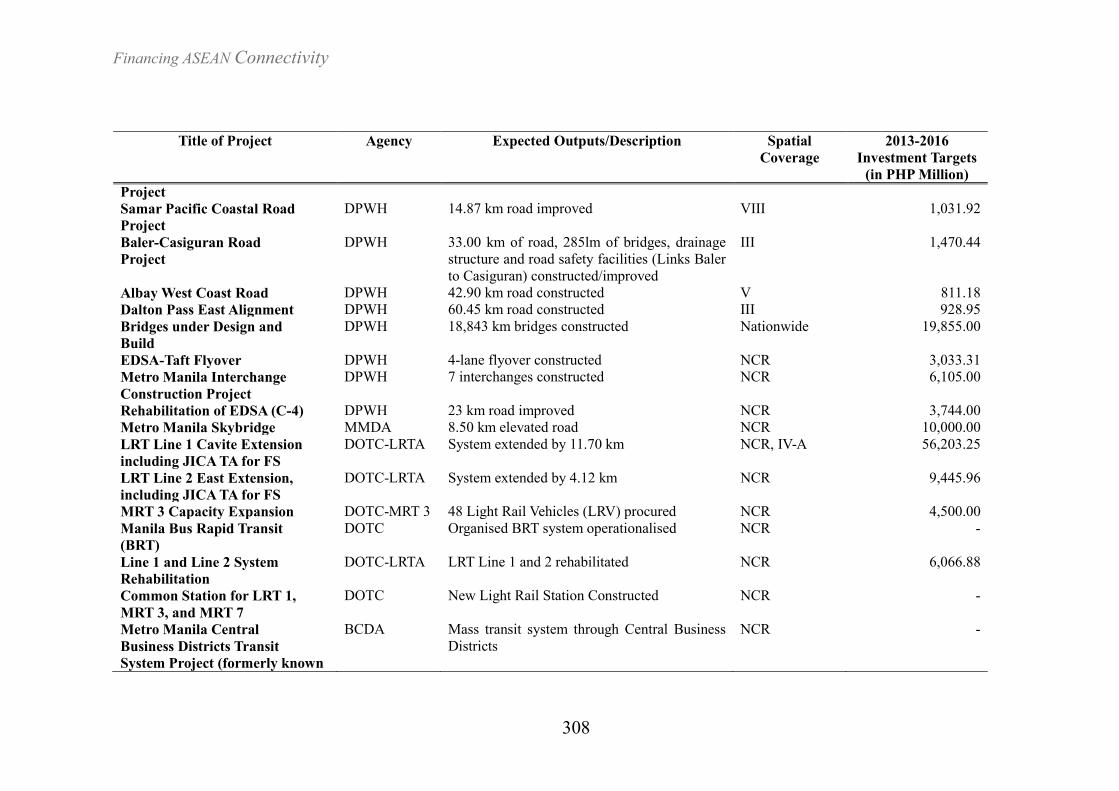
308
Title of Project Agency Expected Outputs/Description Spatial
Coverage
2013-2016
Investment Targets
(in PHP Million)
Project
Samar Pacific Coastal Road
Project
DPWH 14.87 km road improved VIII 1,031.92
Baler-Casiguran Road
Project
DPWH 33.00 km of road, 285lm of bridges, drainage
structure and road safety facilities (Links Baler
to Casiguran) constructed/improved
III 1,470.44
Albay West Coast Road DPWH 42.90 km road constructed V 811.18
Dalton Pass East Alignment DPWH 60.45 km road constructed III 928.95
Bridges under Design and
Build
DPWH 18,843 km bridges constructed Nationwide 19,855.00
EDSA-Taft Flyover DPWH 4-lane flyover constructed NCR 3,033.31
Metro Manila Interchange
Construction Project
DPWH 7 interchanges constructed NCR 6,105.00
Rehabilitation of EDSA (C-4) DPWH 23 km road improved NCR 3,744.00
Metro Manila Skybridge MMDA 8.50 km elevated road NCR 10,000.00
LRT Line 1 Cavite Extension
including JICA TA for FS
DOTC-LRTA System extended by 11.70 km NCR, IV-A 56,203.25
LRT Line 2 East Extension,
including JICA TA for FS
DOTC-LRTA System extended by 4.12 km NCR 9,445.96
MRT 3 Capacity Expansion DOTC-MRT 3 48 Light Rail Vehicles (LRV) procured NCR 4,500.00
Manila Bus Rapid Transit
(BRT)
DOTC Organised BRT system operationalised NCR -
Line 1 and Line 2 System
Rehabilitation
DOTC-LRTA LRT Line 1 and 2 rehabilitated NCR 6,066.88
Common Station for LRT 1,
MRT 3, and MRT 7
DOTC New Light Rail Station Constructed NCR -
Metro Manila Central
Business Districts Transit
System Project (formerly known
BCDA Mass transit system through Central Business
Districts
NCR -
Philippines Country Report
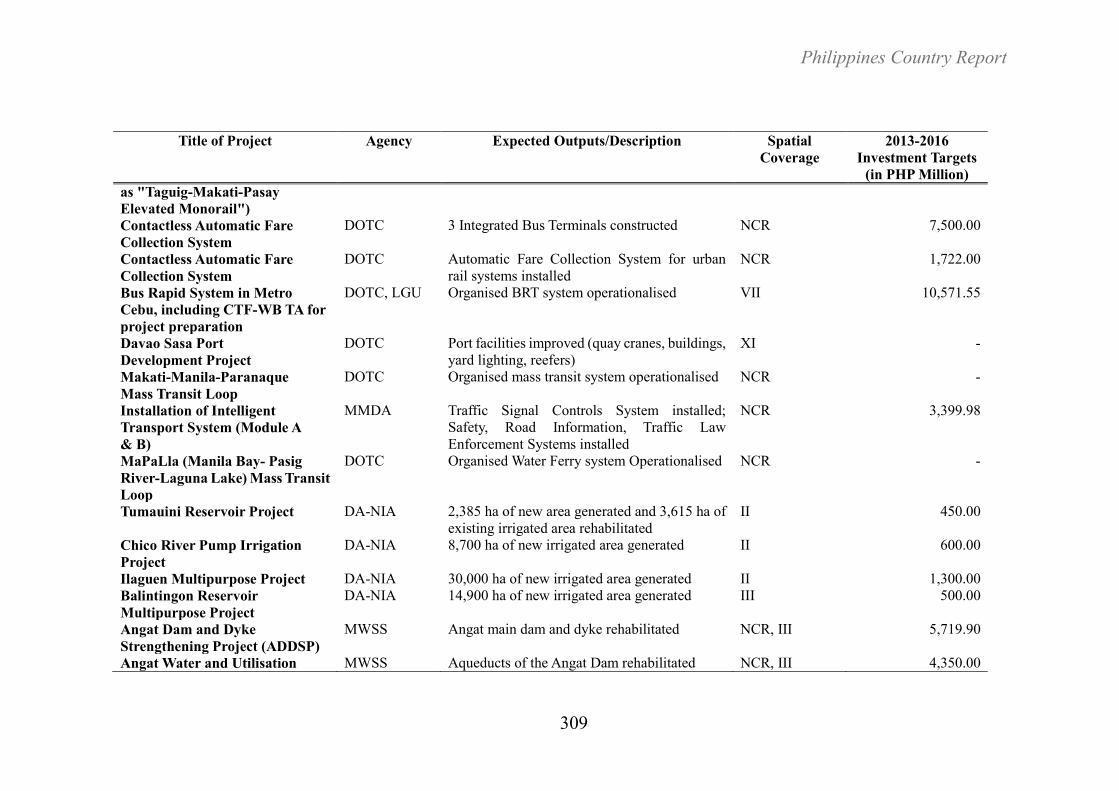
309
Title of Project Agency Expected Outputs/Description Spatial
Coverage
2013-2016
Investment Targets
(in PHP Million)
as "Taguig-Makati-Pasay
Elevated Monorail")
Contactless Automatic Fare
Collection System
DOTC 3 Integrated Bus Terminals constructed NCR 7,500.00
Contactless Automatic Fare
Collection System
DOTC Automatic Fare Collection System for urban
rail systems installed
NCR 1,722.00
Bus Rapid System in Metro
Cebu, including CTF-WB TA for
project preparation
DOTC, LGU Organised BRT system operationalised VII 10,571.55
Davao Sasa Port
Development Project
DOTC Port facilities improved (quay cranes, buildings,
yard lighting, reefers)
XI -
Makati-Manila-Paranaque
Mass Transit Loop
DOTC Organised mass transit system operationalised NCR -
Installation of Intelligent
Transport System (Module A
& B)
MMDA Traffic Signal Controls System installed;
Safety, Road Information, Traffic Law
Enforcement Systems installed
NCR 3,399.98
MaPaLla (Manila Bay- Pasig
River-Laguna Lake) Mass Transit
Loop
DOTC Organised Water Ferry system Operationalised NCR -
Tumauini Reservoir Project DA-NIA 2,385 ha of new area generated and 3,615 ha of
existing irrigated area rehabilitated
II 450.00
Chico River Pump Irrigation
Project
DA-NIA 8,700 ha of new irrigated area generated II 600.00
Ilaguen Multipurpose Project DA-NIA 30,000 ha of new irrigated area generated II 1,300.00
Balintingon Reservoir
Multipurpose Project
DA-NIA 14,900 ha of new irrigated area generated III 500.00
Angat Dam and Dyke
Strengthening Project (ADDSP)
MWSS Angat main dam and dyke rehabilitated NCR, III 5,719.90
Angat Water and Utilisation MWSS Aqueducts of the Angat Dam rehabilitated NCR, III 4,350.00
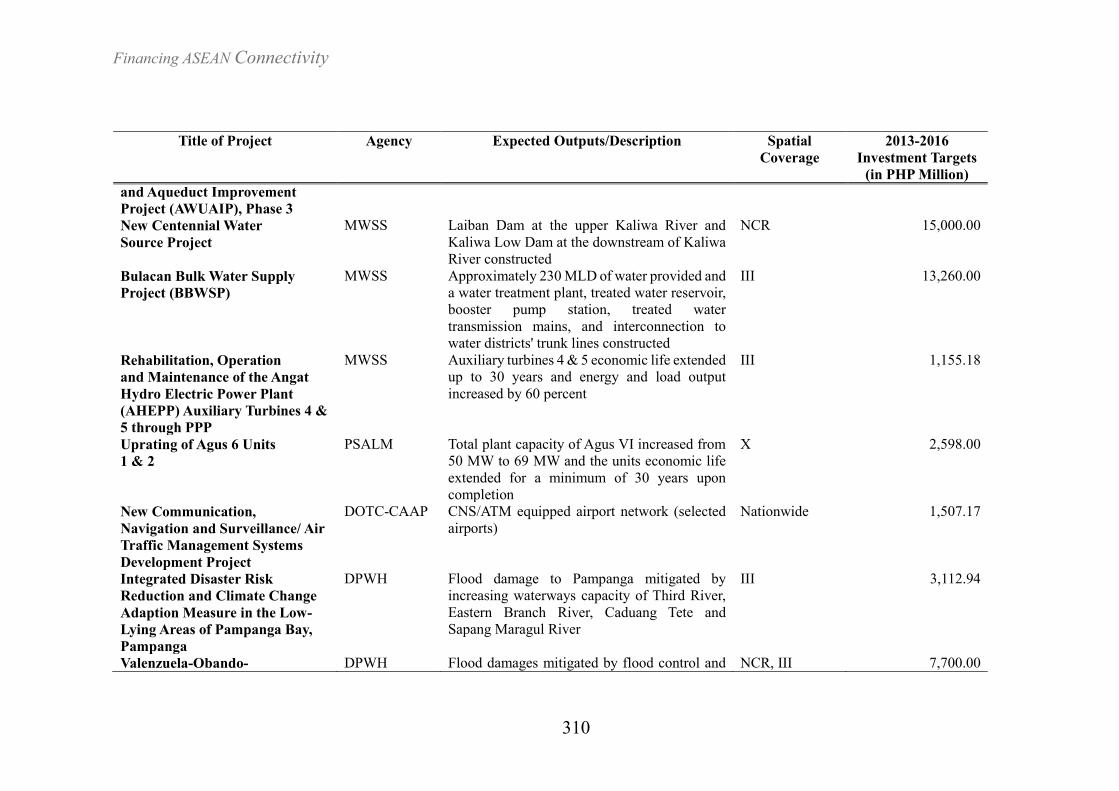
Financing ASEAN Connectivity
310
Title of Project Agency Expected Outputs/Description Spatial
Coverage
2013-2016
Investment Targets
(in PHP Million)
and Aqueduct Improvement
Project (AWUAIP), Phase 3
New Centennial Water
Source Project
MWSS Laiban Dam at the upper Kaliwa River and
Kaliwa Low Dam at the downstream of Kaliwa
River constructed
NCR 15,000.00
Bulacan Bulk Water Supply
Project (BBWSP)
MWSS Approximately 230 MLD of water provided and
a water treatment plant, treated water reservoir,
booster pump station, treated water
transmission mains, and interconnection to
water districts' trunk lines constructed
III 13,260.00
Rehabilitation, Operation
and Maintenance of the Angat
Hydro Electric Power Plant
(AHEPP) Auxiliary Turbines 4 &
5 through PPP
MWSS Auxiliary turbines 4 & 5 economic life extended
up to 30 years and energy and load output
increased by 60 percent
III 1,155.18
Uprating of Agus 6 Units
1 & 2
PSALM Total plant capacity of Agus VI increased from
50 MW to 69 MW and the units economic life
extended for a minimum of 30 years upon
completion
X 2,598.00
New Communication,
Navigation and Surveillance/ Air
Traffic Management Systems
Development Project
DOTC-CAAP CNS/ATM equipped airport network (selected
airports)
Nationwide 1,507.17
Integrated Disaster Risk
Reduction and Climate Change
Adaption Measure in the Low-
Lying Areas of Pampanga Bay,
Pampanga
DPWH Flood damage to Pampanga mitigated by
increasing waterways capacity of Third River,
Eastern Branch River, Caduang Tete and
Sapang Maragul River
III 3,112.94
Valenzuela-Obando- DPWH Flood damages mitigated by flood control and NCR, III 7,700.00
Philippines Country Report
311
Title of Project Agency Expected Outputs/Description Spatial
Coverage
2013-2016
Investment Targets
(in PHP Million)
Meycauayan (VOM) Area
Drainage System Improvement
and Related Works Project
(Metro Manila, Bulacan)
drainage improvement works in the VOM area
and its surroundings, thereby improve the living
conditions and promote/enhance economic
activities in the said area
Implementation of immediate
high-impact projects identified
under the Master Plan for Flood
Management in Metro Manila
and Surrounding Areas
DPWH -- Flooding in Metro Manila and its surrounding
areas with a total area of 4,354 sq. km or
435,400 hectares reduced
-- Administration areas in and around the Study
Area include sixteen (16) cities and one (1)
municipality in NCR, 63 cities/ municipalities
in the CALABARZON area and eight (8)
cities/municipalities in Bulacan with a
population of 20,433,722 in and around the
Study Area, and estimated population of
17,147,658 in the Study Area.
NCR, III, IV-A 5,000.00
DOTC Road Transport
Information Technology
Infrastructure Project, Phase I
DOTC-LTO,
DOTC-LTFRB
Processing time of motor vehicle registration
and franchise issuance reduced through IT
system
Nationwide 8,750.00
Motor Vehicle Inspection
and Type Approval System
DOTC-LTO Nationwide 1,300.00
National Support Fund for
Local Road Management
DILG A performance-based incentive grant system
that supports LGU road maintenance and road
rehabilitation works
Nationwide 3,832.14
Roads in Conflict-Afflicted
Areas
DPWH Roads serving conflict-afflicted areas
constructed/improved
ARMM -
Public-Private Partnership
(PPP) for School Infrastructure
Project (PSIP) II
DepEd 10,680 classrooms (with toilets and furniture)
designed, constructed and maintained in
selected regions for a period of ten (10) years
I, CAR, II, III,
IV-B,
V, VI, VII, VIII,
IX,
8,865.55
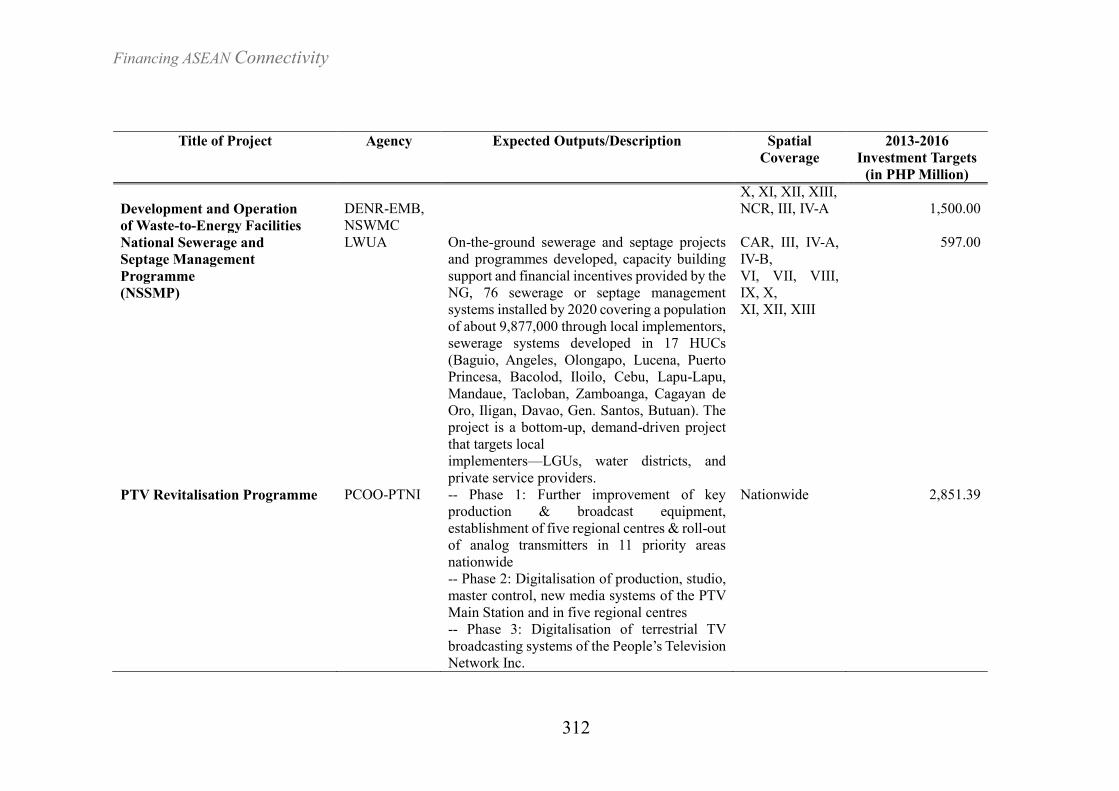
Financing ASEAN Connectivity
312
Title of Project Agency Expected Outputs/Description Spatial
Coverage
2013-2016
Investment Targets
(in PHP Million)
X, XI, XII, XIII,
Development and Operation
of Waste-to-Energy Facilities
DENR-EMB,
NSWMC
NCR, III, IV-A 1,500.00
National Sewerage and
Septage Management
Programme
(NSSMP)
LWUA On-the-ground sewerage and septage projects
and programmes developed, capacity building
support and financial incentives provided by the
NG, 76 sewerage or septage management
systems installed by 2020 covering a population
of about 9,877,000 through local implementors,
sewerage systems developed in 17 HUCs
(Baguio, Angeles, Olongapo, Lucena, Puerto
Princesa, Bacolod, Iloilo, Cebu, Lapu-Lapu,
Mandaue, Tacloban, Zamboanga, Cagayan de
Oro, Iligan, Davao, Gen. Santos, Butuan). The
project is a bottom-up, demand-driven project
that targets local
implementers—LGUs, water districts, and
private service providers.
CAR, III, IV-A,
IV-B,
VI, VII, VIII,
IX, X,
XI, XII, XIII
597.00
PTV Revitalisation Programme PCOO-PTNI -- Phase 1: Further improvement of key
production & broadcast equipment,
establishment of five regional centres & roll-out
of analog transmitters in 11 priority areas
nationwide
-- Phase 2: Digitalisation of production, studio,
master control, new media systems of the PTV
Main Station and in five regional centres
-- Phase 3: Digitalisation of terrestrial TV
broadcasting systems of the People’s Television
Network Inc.
Nationwide 2,851.39
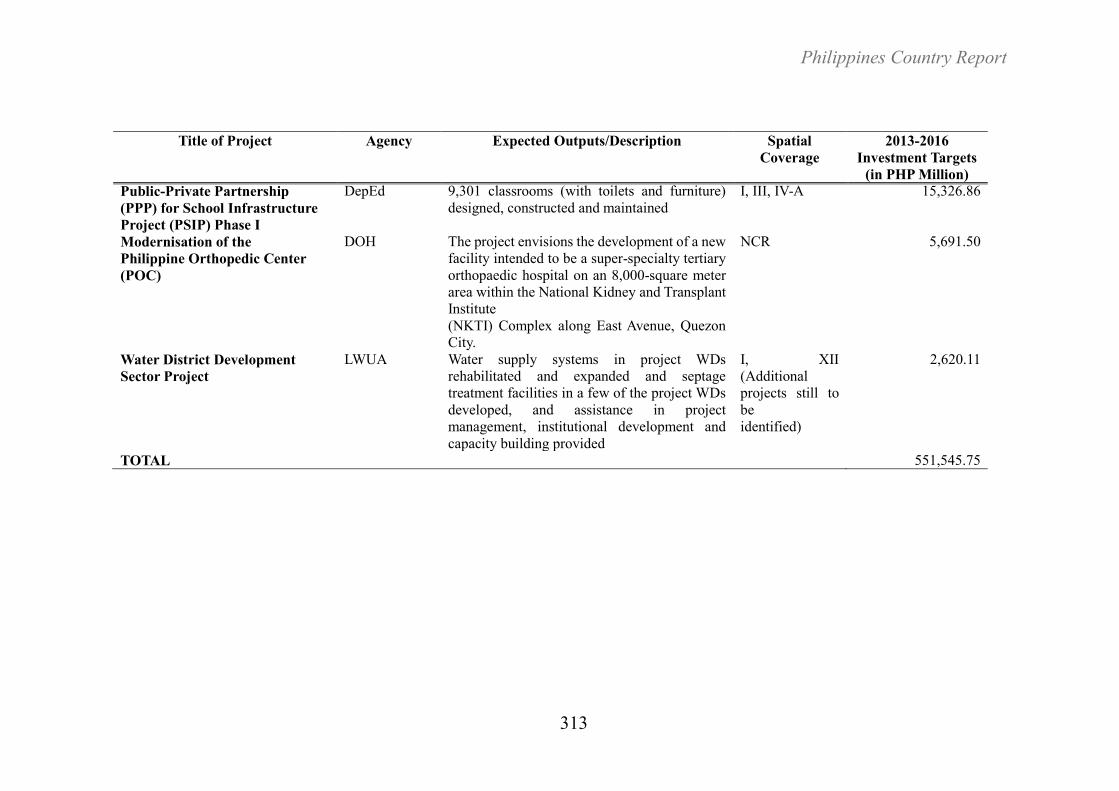
Philippines Country Report
313
Title of Project Agency Expected Outputs/Description Spatial
Coverage
2013-2016
Investment Targets
(in PHP Million)
Public-Private Partnership
(PPP) for School Infrastructure
Project (PSIP) Phase I
DepEd 9,301 classrooms (with toilets and furniture)
designed, constructed and maintained
I, III, IV-A 15,326.86
Modernisation of the
Philippine Orthopedic Center
(POC)
DOH The project envisions the development of a new
facility intended to be a super-specialty tertiary
orthopaedic hospital on an 8,000-square meter
area within the National Kidney and Transplant
Institute
(NKTI) Complex along East Avenue, Quezon
City.
NCR 5,691.50
Water District Development
Sector Project
LWUA Water supply systems in project WDs
rehabilitated and expanded and septage
treatment facilities in a few of the project WDs
developed, and assistance in project
management, institutional development and
capacity building provided
I, XII
(Additional
projects still to
be
identified)
2,620.11
TOTAL 551,545.75
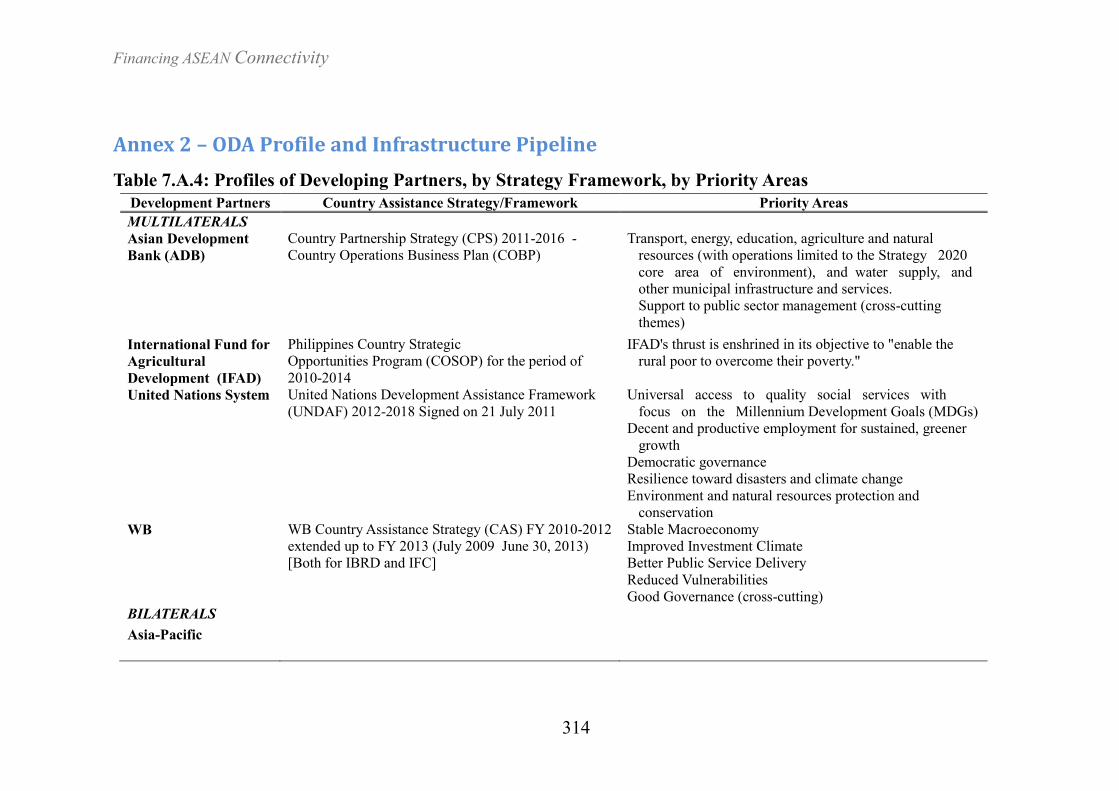
Financing ASEAN Connectivity
314
Annex 2 – ODA Profile and Infrastructure Pipeline
Table 7.A.4: Profiles of Developing Partners, by Strategy Framework, by Priority Areas
Development Partners Country Assistance Strategy/Framework Priority Areas
MULTILATERALS
Asian Development
Bank (ADB)
Country Partnership Strategy (CPS) 2011-2016 -
Country Operations Business Plan (COBP)
Transport, energy, education, agriculture and natural
resources (with operations limited to the Strategy 2020
core area of environment), and water supply, and
other municipal infrastructure and services.
Support to public sector management (cross-cutting
themes)
International Fund for
Agricultural
Development (IFAD)
Philippines Country Strategic
Opportunities Program (COSOP) for the period of
2010-2014
IFAD's thrust is enshrined in its objective to "enable the
rural poor to overcome their poverty."
United Nations System
United Nations Development Assistance Framework
(UNDAF) 2012-2018 Signed on 21 July 2011
Universal access to quality social services with
focus on the Millennium Development Goals (MDGs)
Decent and productive employment for sustained, greener
growth
Democratic governance
Resilience toward disasters and climate change
Environment and natural resources protection and
conservation
WB WB Country Assistance Strategy (CAS) FY 2010-2012
extended up to FY 2013 (July 2009 June 30, 2013)
[Both for IBRD and IFC]
Stable Macroeconomy
Improved Investment Climate
Better Public Service Delivery
Reduced Vulnerabilities
Good Governance (cross-cutting)
BILATERALS
Asia-Pacific
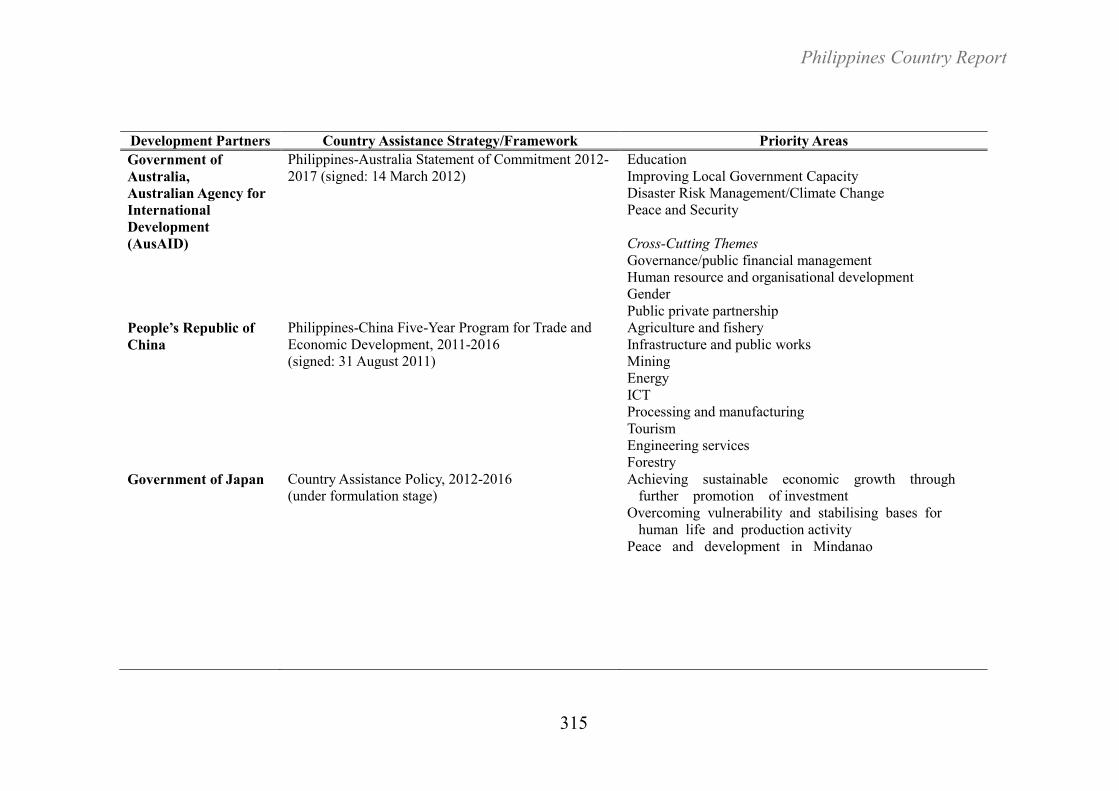
Philippines Country Report
315
Development Partners Country Assistance Strategy/Framework Priority Areas
Government of
Australia,
Australian Agency for
International
Development
(AusAID)
Philippines-Australia Statement of Commitment 2012-
2017 (signed: 14 March 2012)
Education
Improving Local Government Capacity
Disaster Risk Management/Climate Change
Peace and Security
Cross-Cutting Themes
Governance/public financial management
Human resource and organisational development
Gender
Public private partnership
People’s Republic of
China
Philippines-China Five-Year Program for Trade and
Economic Development, 2011-2016
(signed: 31 August 2011)
Agriculture and fishery
Infrastructure and public works
Mining
Energy
ICT
Processing and manufacturing
Tourism
Engineering services
Forestry
Government of Japan Country Assistance Policy, 2012-2016
(under formulation stage)
Achieving sustainable economic growth through
further promotion of investment
Overcoming vulnerability and stabilising bases for
human life and production activity
Peace and development in Mindanao
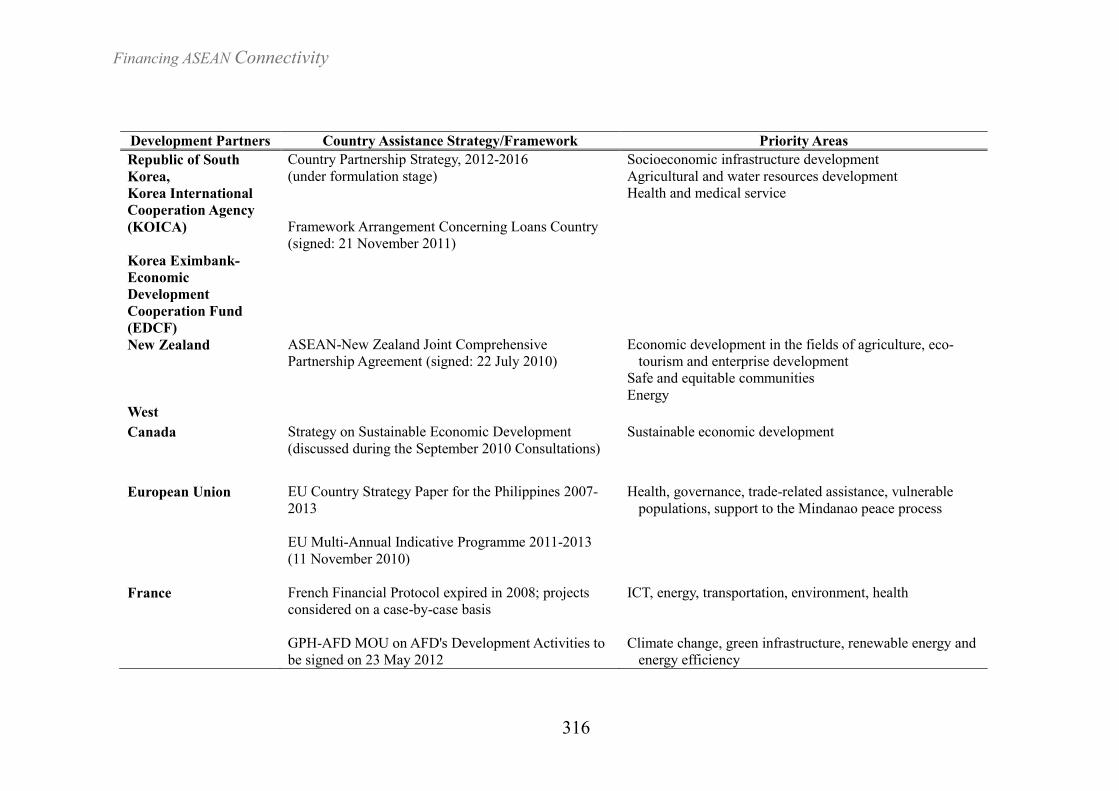
Financing ASEAN Connectivity
316
Development Partners Country Assistance Strategy/Framework Priority Areas
Republic of South
Korea,
Korea International
Cooperation Agency
(KOICA)
Korea Eximbank-
Economic
Development
Cooperation Fund
(EDCF)
Country Partnership Strategy, 2012-2016
(under formulation stage)
Framework Arrangement Concerning Loans Country
(signed: 21 November 2011)
Socioeconomic infrastructure development
Agricultural and water resources development
Health and medical service
New Zealand ASEAN-New Zealand Joint Comprehensive
Partnership Agreement (signed: 22 July 2010)
Economic development in the fields of agriculture, eco-
tourism and enterprise development
Safe and equitable communities
Energy
West
Canada Strategy on Sustainable Economic Development
(discussed during the September 2010 Consultations)
Sustainable economic development
European Union EU Country Strategy Paper for the Philippines 2007-
2013
EU Multi-Annual Indicative Programme 2011-2013
(11 November 2010)
Health, governance, trade-related assistance, vulnerable
populations, support to the Mindanao peace process
France
French Financial Protocol expired in 2008; projects
considered on a case-by-case basis
GPH-AFD MOU on AFD's Development Activities to
be signed on 23 May 2012
ICT, energy, transportation, environment, health
Climate change, green infrastructure, renewable energy and
energy efficiency
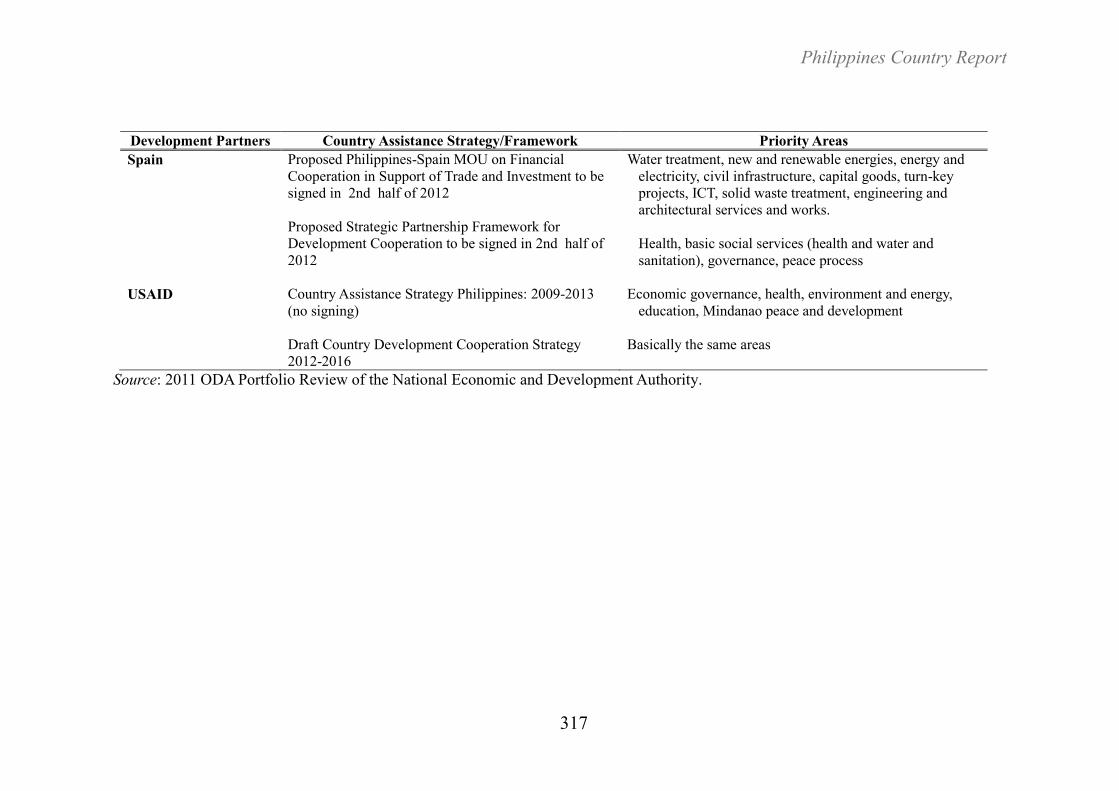
Philippines Country Report
317
Source: 2011 ODA Portfolio Review of the National Economic and Development Authority.
Development Partners Country Assistance Strategy/Framework Priority Areas
Spain Proposed Philippines-Spain MOU on Financial
Cooperation in Support of Trade and Investment to be
signed in 2nd half of 2012
Proposed Strategic Partnership Framework for
Development Cooperation to be signed in 2nd half of
2012
Water treatment, new and renewable energies, energy and
electricity, civil infrastructure, capital goods, turn-key
projects, ICT, solid waste treatment, engineering and
architectural services and works.
Health, basic social services (health and water and
sanitation), governance, peace process
USAID Country Assistance Strategy Philippines: 2009-2013
(no signing)
Draft Country Development Cooperation Strategy
2012-2016
Economic governance, health, environment and energy,
education, Mindanao peace and development
Basically the same areas
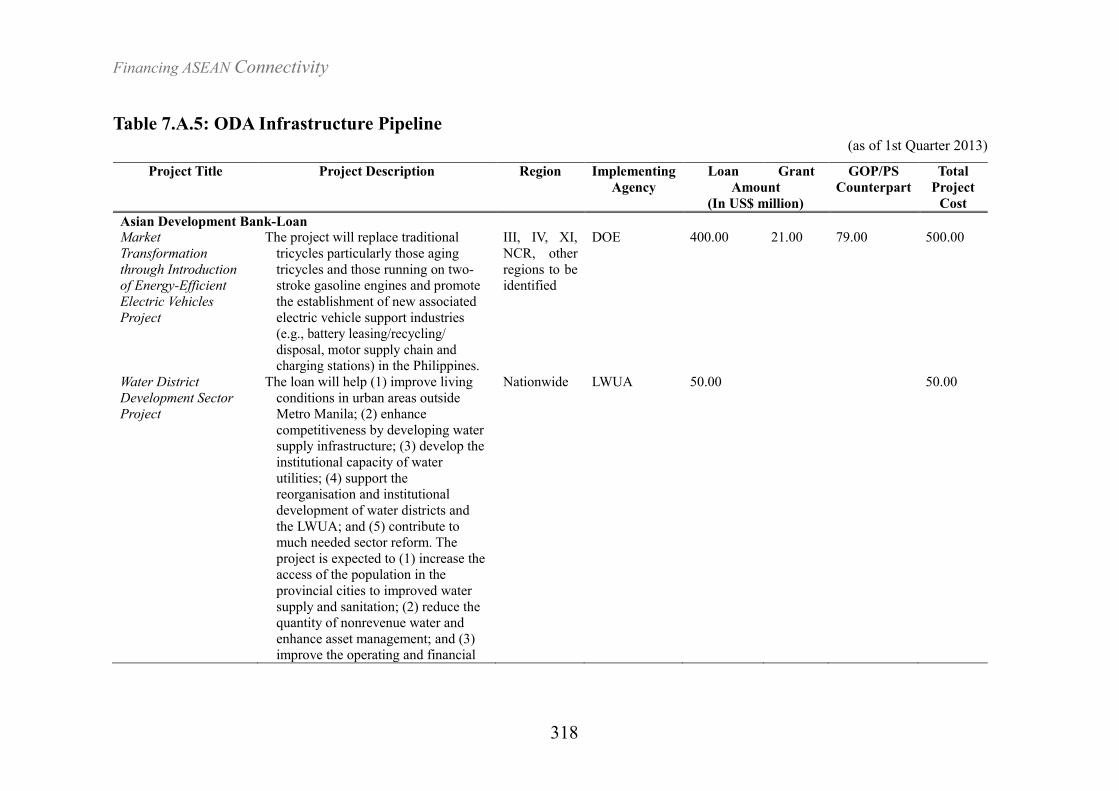
Financing ASEAN Connectivity
318
Table 7.A.5: ODA Infrastructure Pipeline (as of 1st Quarter 2013)
Project Title Project Description Region Implementing
Agency
Loan Grant GOP/PS
Counterpart
Total
Project
Cost
Amount
(In US$ million)
Asian Development Bank-Loan Market
Transformation
through Introduction of Energy-Efficient
Electric Vehicles
Project
The project will replace traditional
tricycles particularly those aging
tricycles and those running on two-
stroke gasoline engines and promote
the establishment of new associated
electric vehicle support industries
(e.g., battery leasing/recycling/
disposal, motor supply chain and
charging stations) in the Philippines.
III, IV, XI,
NCR, other
regions to be
identified
DOE 400.00 21.00 79.00 500.00
Water District
Development Sector Project
The loan will help (1) improve living
conditions in urban areas outside
Metro Manila; (2) enhance
competitiveness by developing water
supply infrastructure; (3) develop the
institutional capacity of water
utilities; (4) support the
reorganisation and institutional
development of water districts and
the LWUA; and (5) contribute to
much needed sector reform. The
project is expected to (1) increase the
access of the population in the
provincial cities to improved water
supply and sanitation; (2) reduce the
quantity of nonrevenue water and
enhance asset management; and (3) improve the operating and financial
Nationwide LWUA 50.00 50.00
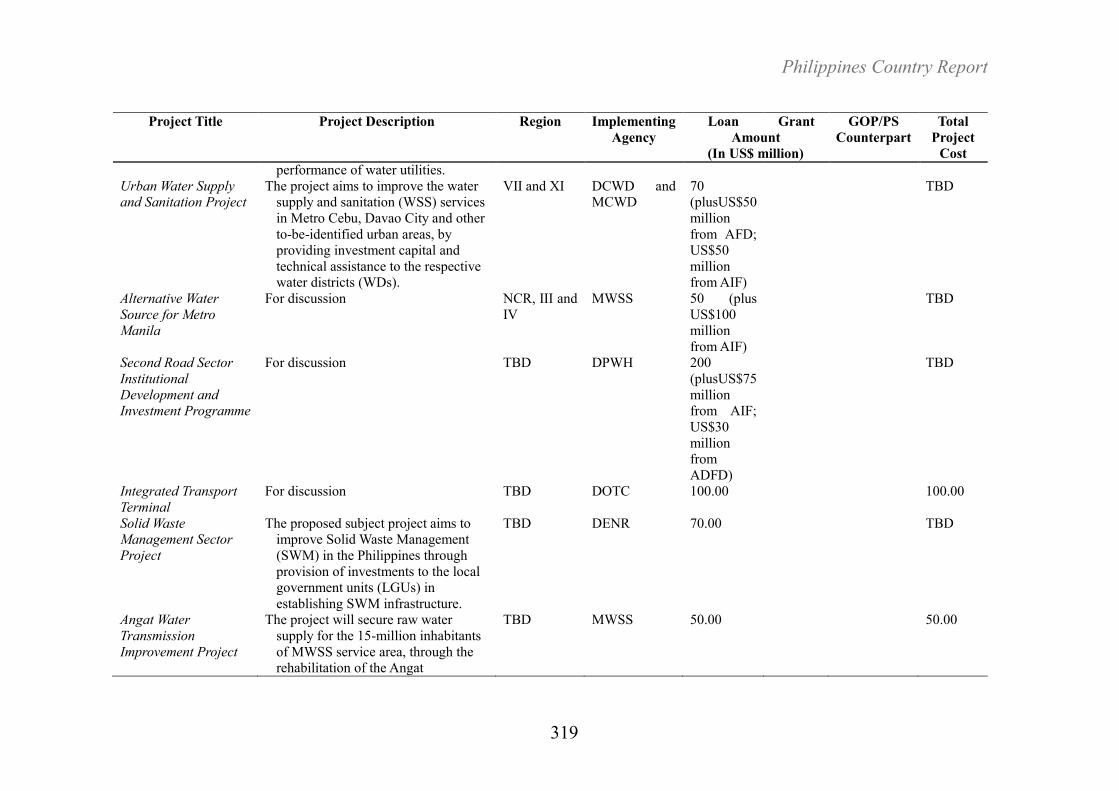
Philippines Country Report
319
Project Title Project Description Region Implementing
Agency
Loan Grant GOP/PS
Counterpart
Total
Project
Cost
Amount
(In US$ million)
performance of water utilities.
Urban Water Supply and Sanitation Project
The project aims to improve the water
supply and sanitation (WSS) services
in Metro Cebu, Davao City and other
to-be-identified urban areas, by
providing investment capital and
technical assistance to the respective
water districts (WDs).
VII and XI DCWD and
MCWD
70
(plusUS$50
million
from AFD;
US$50
million
from AIF)
TBD
Alternative Water
Source for Metro Manila
For discussion NCR, III and
IV
MWSS 50 (plus
US$100
million
from AIF)
TBD
Second Road Sector
Institutional
Development and Investment Programme
For discussion TBD DPWH 200
(plusUS$75
million
from AIF;
US$30
million
from
ADFD)
TBD
Integrated Transport
Terminal
For discussion TBD DOTC 100.00 100.00
Solid Waste Management Sector
Project
The proposed subject project aims to
improve Solid Waste Management
(SWM) in the Philippines through
provision of investments to the local
government units (LGUs) in
establishing SWM infrastructure.
TBD DENR 70.00 TBD
Angat Water
Transmission
Improvement Project
The project will secure raw water
supply for the 15-million inhabitants
of MWSS service area, through the rehabilitation of the Angat
TBD MWSS 50.00 50.00
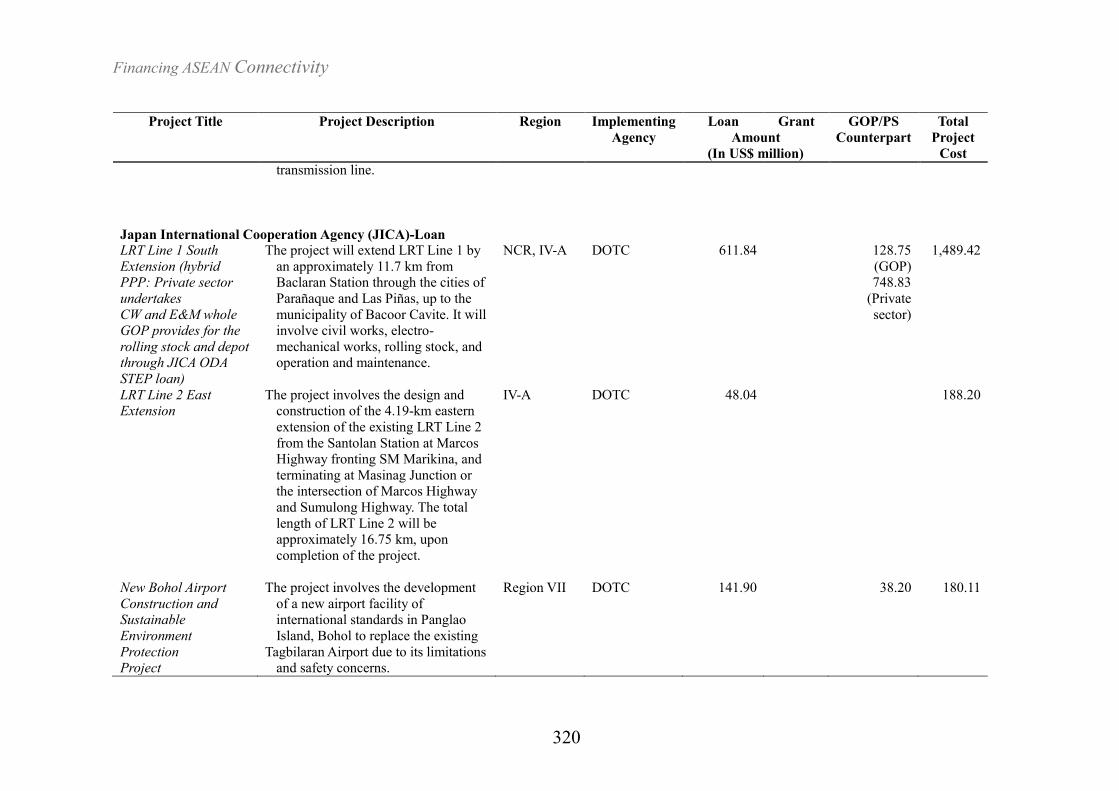
Financing ASEAN Connectivity
320
Project Title Project Description Region Implementing
Agency
Loan Grant GOP/PS
Counterpart
Total
Project
Cost
Amount
(In US$ million)
transmission line.
Japan International Cooperation Agency (JICA)-Loan
LRT Line 1 South
Extension (hybrid PPP: Private sector
undertakes
CW and E&M whole GOP provides for the
rolling stock and depot through JICA ODA
STEP loan)
The project will extend LRT Line 1 by
an approximately 11.7 km from
Baclaran Station through the cities of
Parañaque and Las Piñas, up to the
municipality of Bacoor Cavite. It will
involve civil works, electro-
mechanical works, rolling stock, and
operation and maintenance.
NCR, IV-A DOTC 611.84 128.75
(GOP)
748.83
(Private
sector)
1,489.42
LRT Line 2 East Extension
The project involves the design and
construction of the 4.19-km eastern
extension of the existing LRT Line 2
from the Santolan Station at Marcos
Highway fronting SM Marikina, and
terminating at Masinag Junction or
the intersection of Marcos Highway
and Sumulong Highway. The total
length of LRT Line 2 will be
approximately 16.75 km, upon
completion of the project.
IV-A DOTC 48.04 188.20
New Bohol Airport
Construction and Sustainable
Environment
Protection Project
The project involves the development
of a new airport facility of
international standards in Panglao
Island, Bohol to replace the existing
Tagbilaran Airport due to its limitations and safety concerns.
Region VII DOTC 141.90
38.20 180.11
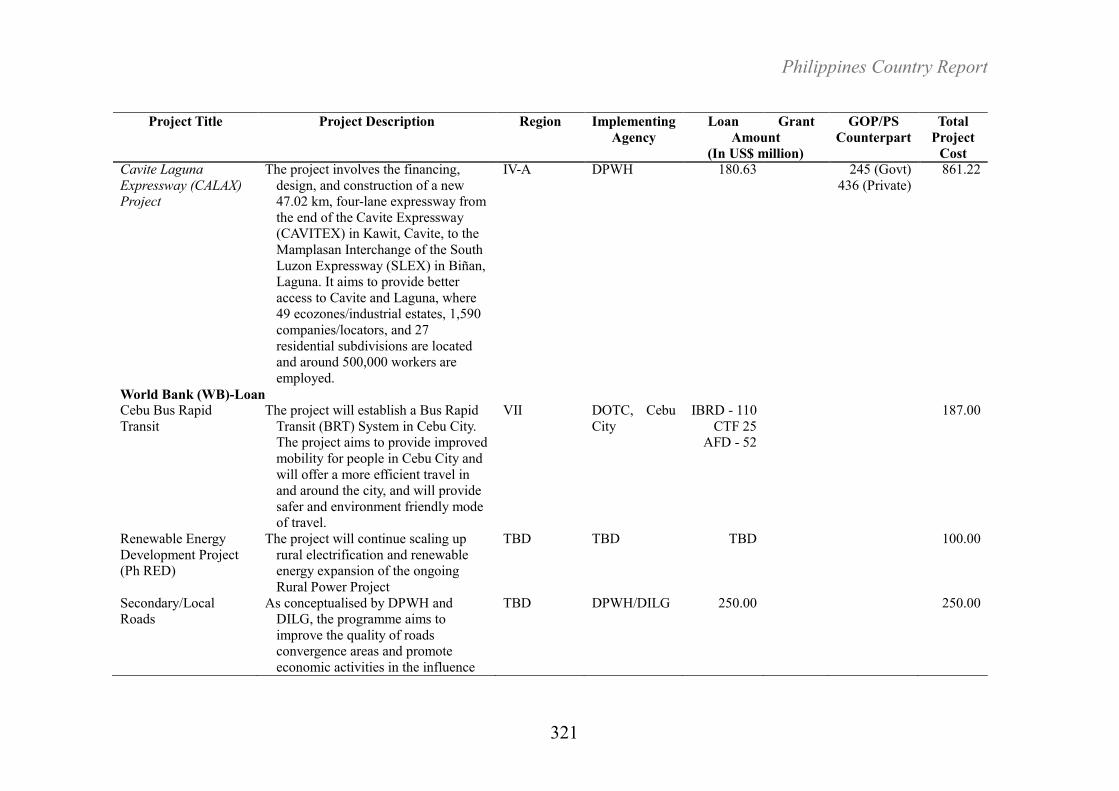
Philippines Country Report
321
Project Title Project Description Region Implementing
Agency
Loan Grant GOP/PS
Counterpart
Total
Project
Cost
Amount
(In US$ million)
Cavite Laguna
Expressway (CALAX) Project
The project involves the financing,
design, and construction of a new
47.02 km, four-lane expressway from
the end of the Cavite Expressway
(CAVITEX) in Kawit, Cavite, to the
Mamplasan Interchange of the South
Luzon Expressway (SLEX) in Biñan,
Laguna. It aims to provide better
access to Cavite and Laguna, where
49 ecozones/industrial estates, 1,590
companies/locators, and 27
residential subdivisions are located
and around 500,000 workers are
employed.
IV-A DPWH 180.63 245 (Govt)
436 (Private)
861.22
World Bank (WB)-Loan Cebu Bus Rapid
Transit
The project will establish a Bus Rapid
Transit (BRT) System in Cebu City.
The project aims to provide improved
mobility for people in Cebu City and
will offer a more efficient travel in
and around the city, and will provide
safer and environment friendly mode
of travel.
VII DOTC, Cebu
City
IBRD - 110
CTF 25
AFD - 52
187.00
Renewable Energy
Development Project
(Ph RED)
The project will continue scaling up
rural electrification and renewable
energy expansion of the ongoing
Rural Power Project
TBD TBD TBD 100.00
Secondary/Local
Roads
As conceptualised by DPWH and
DILG, the programme aims to
improve the quality of roads
convergence areas and promote
economic activities in the influence
TBD DPWH/DILG 250.00 250.00
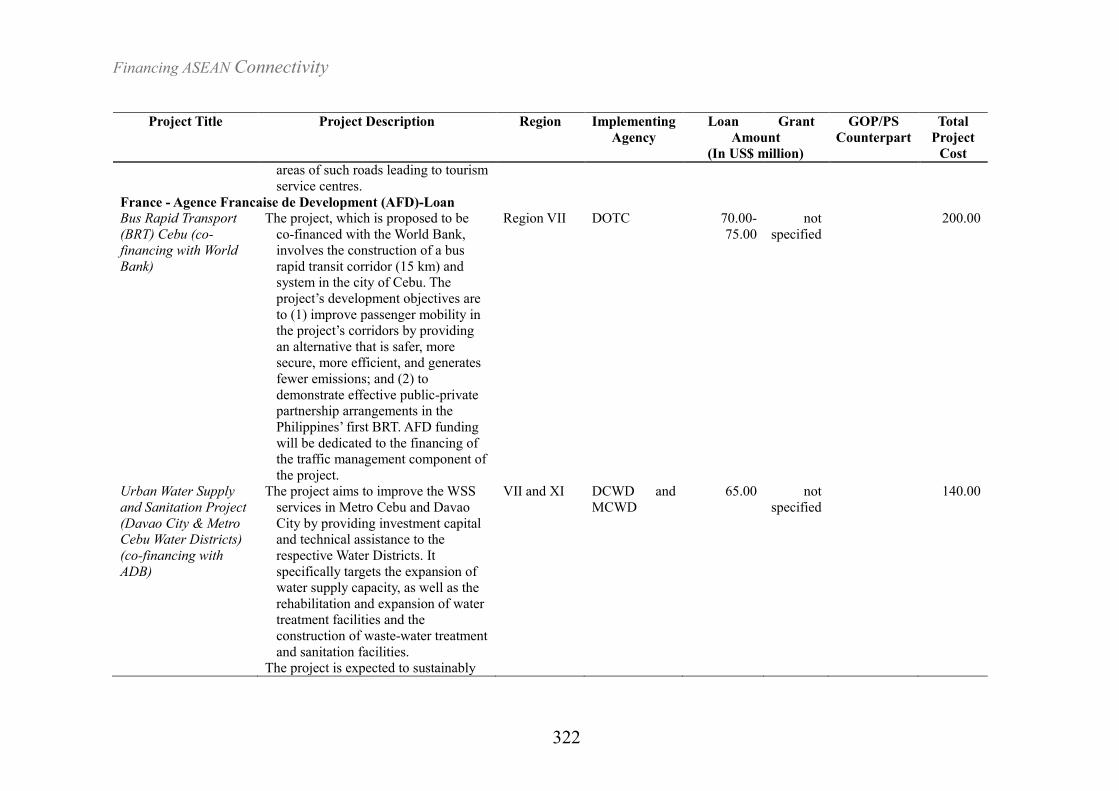
Financing ASEAN Connectivity
322
Project Title Project Description Region Implementing
Agency
Loan Grant GOP/PS
Counterpart
Total
Project
Cost
Amount
(In US$ million)
areas of such roads leading to tourism
service centres.
France - Agence Francaise de Development (AFD)-Loan
Bus Rapid Transport
(BRT) Cebu (co-
financing with World
Bank)
The project, which is proposed to be
co-financed with the World Bank,
involves the construction of a bus
rapid transit corridor (15 km) and
system in the city of Cebu. The
project’s development objectives are
to (1) improve passenger mobility in
the project’s corridors by providing
an alternative that is safer, more
secure, more efficient, and generates
fewer emissions; and (2) to
demonstrate effective public-private
partnership arrangements in the
Philippines’ first BRT. AFD funding
will be dedicated to the financing of
the traffic management component of
the project.
Region VII DOTC
70.00-
75.00
not
specified
200.00
Urban Water Supply
and Sanitation Project
(Davao City & Metro Cebu Water Districts)
(co-financing with
ADB)
The project aims to improve the WSS
services in Metro Cebu and Davao
City by providing investment capital
and technical assistance to the
respective Water Districts. It
specifically targets the expansion of
water supply capacity, as well as the
rehabilitation and expansion of water
treatment facilities and the
construction of waste-water treatment
and sanitation facilities. The project is expected to sustainably
VII and XI DCWD and
MCWD
65.00 not
specified
140.00
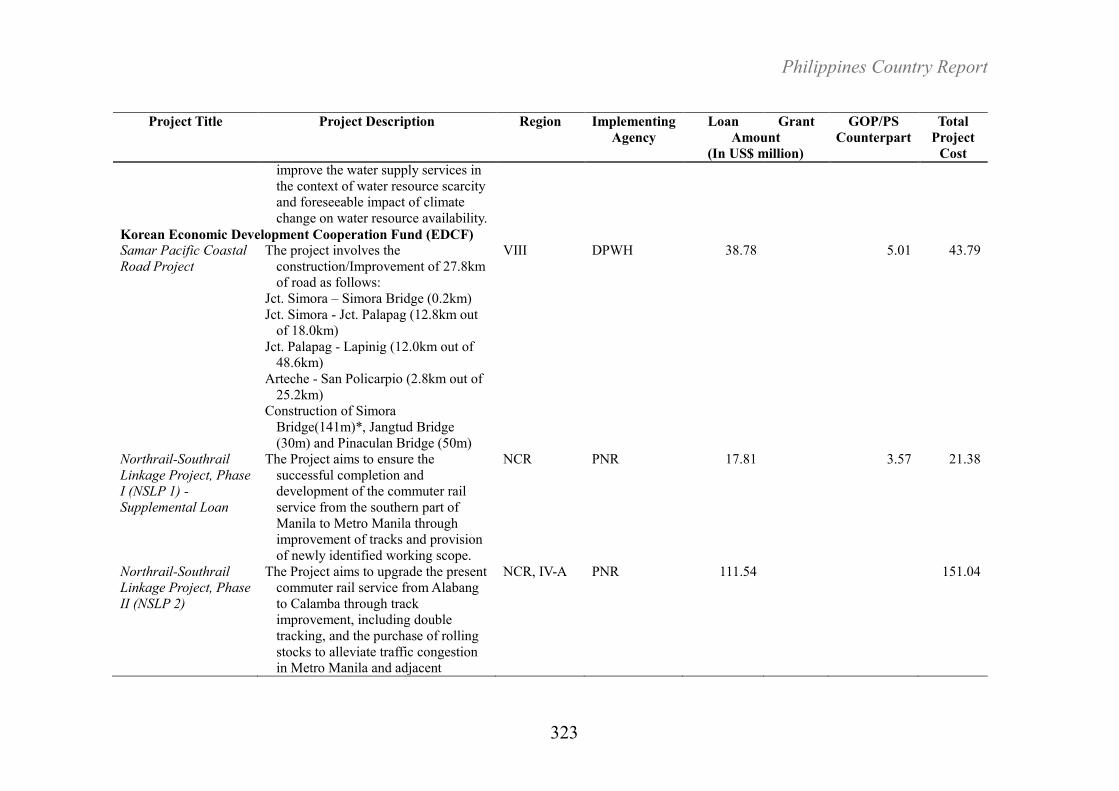
Philippines Country Report
323
Project Title Project Description Region Implementing
Agency
Loan Grant GOP/PS
Counterpart
Total
Project
Cost
Amount
(In US$ million)
improve the water supply services in
the context of water resource scarcity
and foreseeable impact of climate
change on water resource availability.
Korean Economic Development Cooperation Fund (EDCF)
Samar Pacific Coastal
Road Project
The project involves the
construction/Improvement of 27.8km
of road as follows:
Jct. Simora – Simora Bridge (0.2km)
Jct. Simora - Jct. Palapag (12.8km out
of 18.0km)
Jct. Palapag - Lapinig (12.0km out of
48.6km)
Arteche - San Policarpio (2.8km out of
25.2km)
Construction of Simora
Bridge(141m)*, Jangtud Bridge
(30m) and Pinaculan Bridge (50m)
VIII DPWH 38.78 5.01 43.79
Northrail-Southrail
Linkage Project, Phase I (NSLP 1) -
Supplemental Loan
The Project aims to ensure the
successful completion and
development of the commuter rail
service from the southern part of
Manila to Metro Manila through
improvement of tracks and provision
of newly identified working scope.
NCR PNR 17.81 3.57 21.38
Northrail-Southrail
Linkage Project, Phase
II (NSLP 2)
The Project aims to upgrade the present
commuter rail service from Alabang
to Calamba through track
improvement, including double
tracking, and the purchase of rolling
stocks to alleviate traffic congestion in Metro Manila and adjacent
NCR, IV-A PNR 111.54 151.04
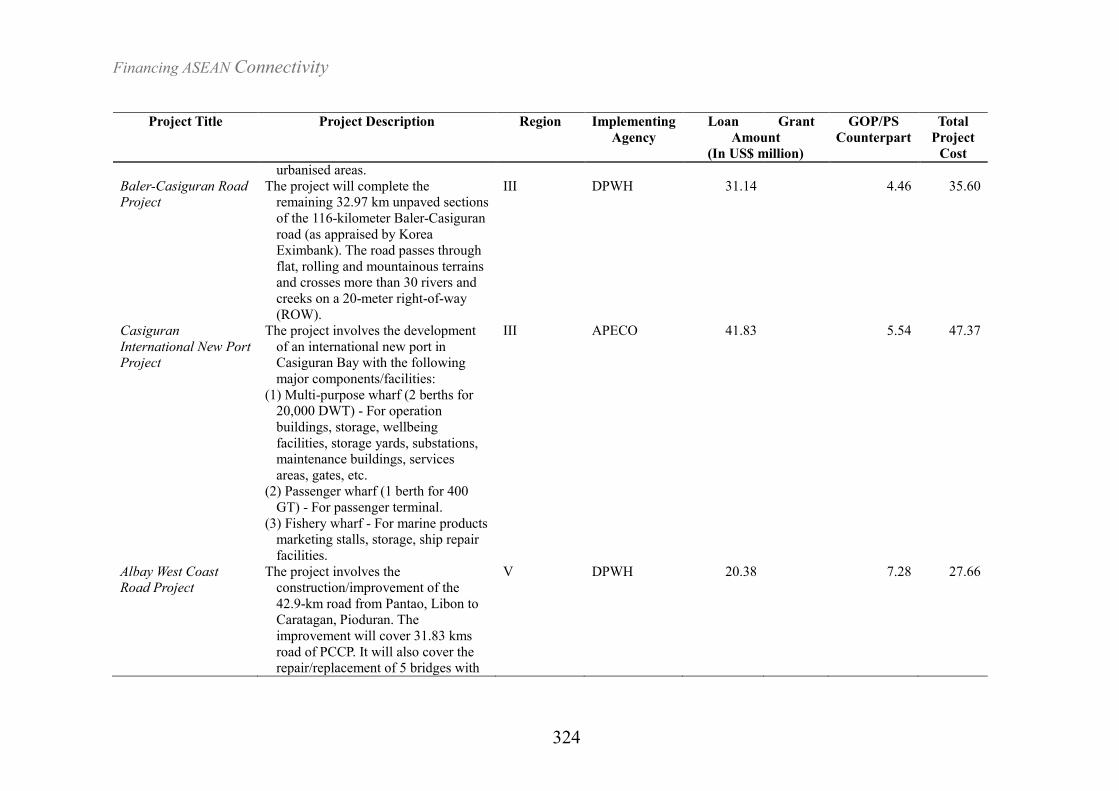
Financing ASEAN Connectivity
324
Project Title Project Description Region Implementing
Agency
Loan Grant GOP/PS
Counterpart
Total
Project
Cost
Amount
(In US$ million)
urbanised areas.
Baler-Casiguran Road Project
The project will complete the
remaining 32.97 km unpaved sections
of the 116-kilometer Baler-Casiguran
road (as appraised by Korea
Eximbank). The road passes through
flat, rolling and mountainous terrains
and crosses more than 30 rivers and
creeks on a 20-meter right-of-way
(ROW).
III DPWH 31.14 4.46 35.60
Casiguran
International New Port Project
The project involves the development
of an international new port in
Casiguran Bay with the following
major components/facilities:
(1) Multi-purpose wharf (2 berths for
20,000 DWT) - For operation
buildings, storage, wellbeing
facilities, storage yards, substations,
maintenance buildings, services
areas, gates, etc.
(2) Passenger wharf (1 berth for 400
GT) - For passenger terminal.
(3) Fishery wharf - For marine products
marketing stalls, storage, ship repair
facilities.
III APECO 41.83 5.54 47.37
Albay West Coast
Road Project
The project involves the
construction/improvement of the
42.9-km road from Pantao, Libon to
Caratagan, Pioduran. The
improvement will cover 31.83 kms
road of PCCP. It will also cover the repair/replacement of 5 bridges with
V DPWH 20.38 7.28 27.66
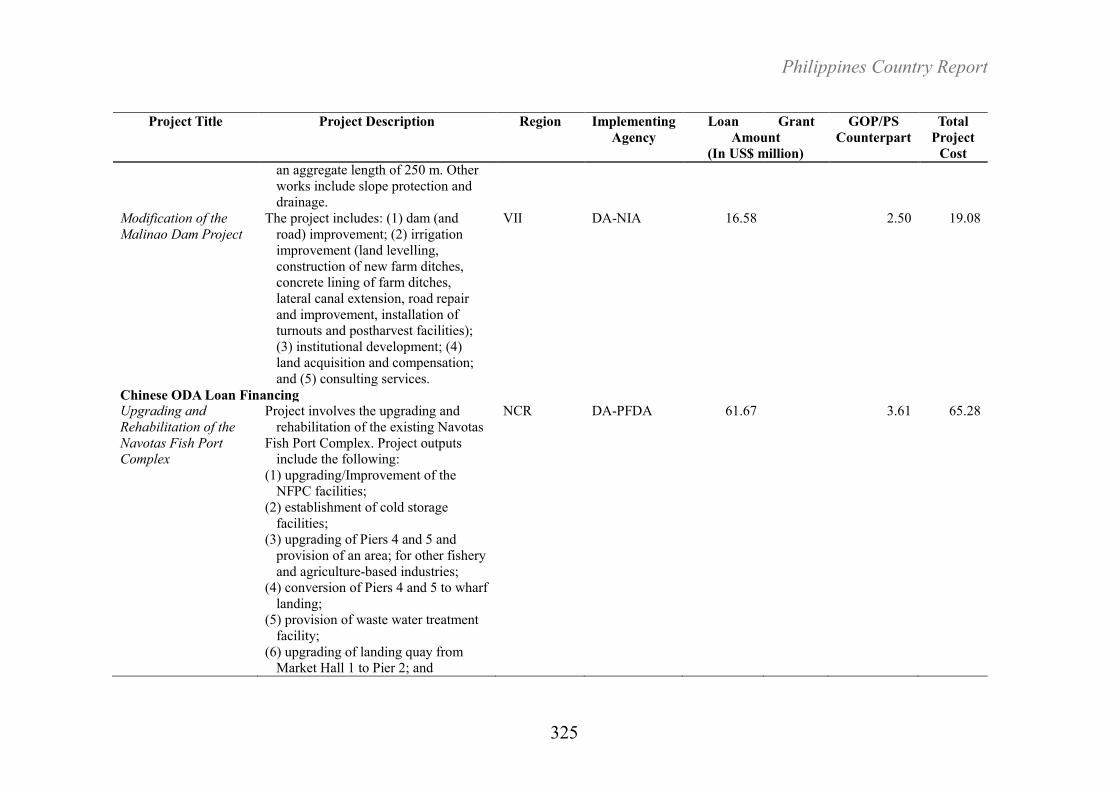
Philippines Country Report
325
Project Title Project Description Region Implementing
Agency
Loan Grant GOP/PS
Counterpart
Total
Project
Cost
Amount
(In US$ million)
an aggregate length of 250 m. Other
works include slope protection and
drainage.
Modification of the
Malinao Dam Project
The project includes: (1) dam (and
road) improvement; (2) irrigation
improvement (land levelling,
construction of new farm ditches,
concrete lining of farm ditches,
lateral canal extension, road repair
and improvement, installation of
turnouts and postharvest facilities);
(3) institutional development; (4)
land acquisition and compensation;
and (5) consulting services.
VII DA-NIA 16.58 2.50 19.08
Chinese ODA Loan Financing Upgrading and
Rehabilitation of the
Navotas Fish Port Complex
Project involves the upgrading and
rehabilitation of the existing Navotas
Fish Port Complex. Project outputs
include the following:
(1) upgrading/Improvement of the
NFPC facilities;
(2) establishment of cold storage
facilities;
(3) upgrading of Piers 4 and 5 and
provision of an area; for other fishery
and agriculture-based industries;
(4) conversion of Piers 4 and 5 to wharf
landing;
(5) provision of waste water treatment
facility;
(6) upgrading of landing quay from Market Hall 1 to Pier 2; and
NCR DA-PFDA 61.67 3.61 65.28
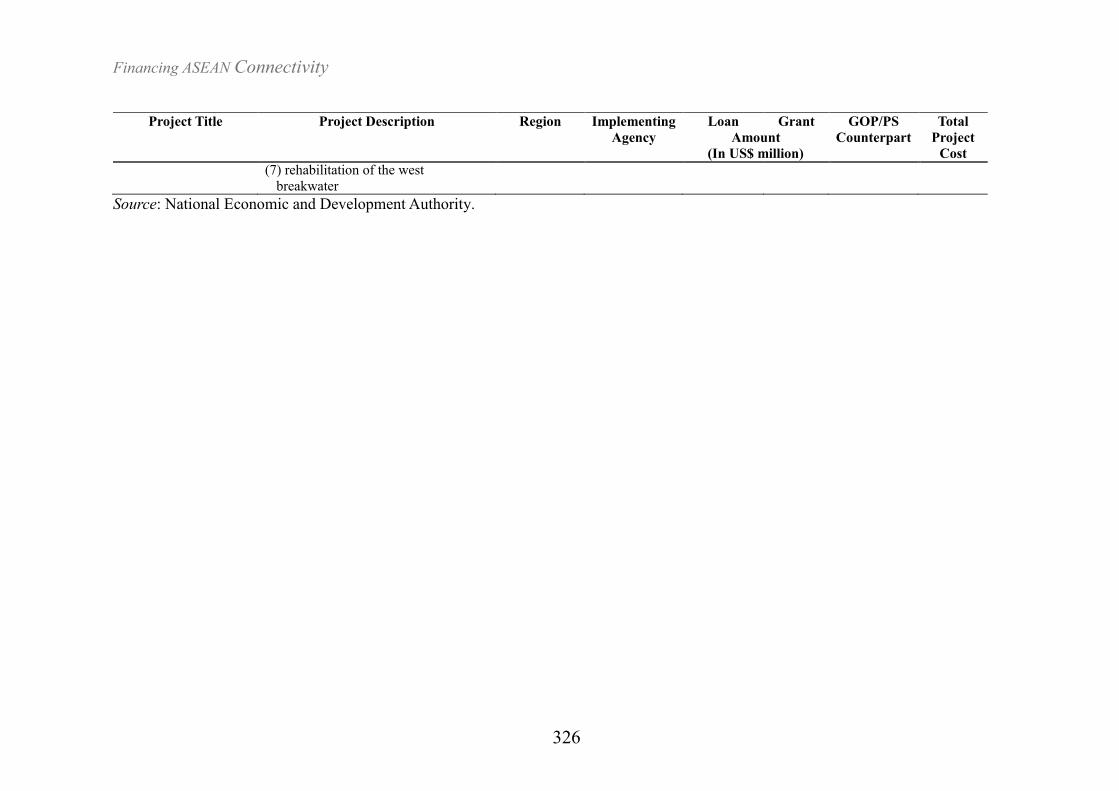
Financing ASEAN Connectivity
326
Project Title Project Description Region Implementing
Agency
Loan Grant GOP/PS
Counterpart
Total
Project
Cost
Amount
(In US$ million)
(7) rehabilitation of the west
breakwater
Source: National Economic and Development Authority.