Embed Size (px)
Citation preview
NREL is a national laboratory of the U.S. Department of Energy Office of Energy Efficiency & Renewable Energy Operated by the Alliance for Sustainable Energy, LLC
This report is available at no cost from the National Renewable Energy Laboratory (NREL) at www.nrel.gov/publications.
Contract No. DE-AC36-08GO28308
Chapter 7: Refrigerator Recycling Evaluation Protocol The Uniform Methods Project: Methods for Determining Energy Efficiency Savings for Specific Measures Created as part of subcontract with period of performance September 2011 – September 2016
This version supersedes the version originally published in April 2013. The content in this version has been updated.
Josh Keeling Cadmus Portland, Oregon
Doug Bruchs Cadeo Portland, Oregon
NREL Technical Monitor: Charles Kurnik
Subcontract Report NREL/SR-7A40-68563 September 2017
NREL is a national laboratory of the U.S. Department of Energy Office of Energy Efficiency & Renewable Energy Operated by the Alliance for Sustainable Energy, LLC
This report is available at no cost from the National Renewable Energy Laboratory (NREL) at www.nrel.gov/publications.
Contract No. DE-AC36-08GO28308
National Renewable Energy Laboratory 15013 Denver West Parkway Golden, CO 80401 303-275-3000 • www.nrel.gov
Chapter 7: Refrigerator Recycling Evaluation Protocol The Uniform Methods Project: Methods for Determining Energy Efficiency Savings for Specific Measures Created as part of subcontract with period of performance September 2011 – September 2016 This version supersedes the version originally published in April 2013. The content in this version has been updated.
Josh Keeling Cadmus Portland, Oregon
Doug Bruchs Cadeo Portland, Oregon
NREL Technical Monitor: Charles Kurnik
Prepared under Subcontract No. LGJ-1-11965-01
Subcontract Report NREL/SR-7A40-68563 September 2017

This publication was reproduced from the best available copy submitted by the subcontractor.
NOTICE
This report was prepared as an account of work sponsored by an agency of the United States government. Neither the United States government nor any agency thereof, nor any of their employees, makes any warranty, express or implied, or assumes any legal liability or responsibility for the accuracy, completeness, or usefulness of any information, apparatus, product, or process disclosed, or represents that its use would not infringe privately owned rights. Reference herein to any specific commercial product, process, or service by trade name, trademark, manufacturer, or otherwise does not necessarily constitute or imply its endorsement, recommendation, or favoring by the United States government or any agency thereof. The views and opinions of authors expressed herein do not necessarily state or reflect those of the United States government or any agency thereof.
This report is available at no cost from the National Renewable Energy Laboratory (NREL) at www.nrel.gov/publications.
Available electronically at SciTech Connect http:/www.osti.gov/scitech
Available for a processing fee to U.S. Department of Energy and its contractors, in paper, from:
U.S. Department of Energy Office of Scientific and Technical Information P.O. Box 62 Oak Ridge, TN 37831-0062 OSTI http://www.osti.gov Phone: 865.576.8401 Fax: 865.576.5728 Email: [email protected]
Available for sale to the public, in paper, from:
U.S. Department of Commerce National Technical Information Service 5301 Shawnee Road Alexandria, VA 22312 NTIS http://www.ntis.gov Phone: 800.553.6847 or 703.605.6000 Fax: 703.605.6900 Email: [email protected]
Cover Photos by Dennis Schroeder: (left to right) NREL 26173, NREL 18302, NREL 19758, NREL 29642, NREL 19795.
NREL prints on paper that contains recycled content.

iii This report is available at no cost from the National Renewable Energy Laboratory (NREL) at www.nrel.gov/publications.
Disclaimer These methods, processes, or best practices (“Practices”) are provided by the National Renewable Energy Laboratory (“NREL”), which is operated by the Alliance for Sustainable Energy LLC (“Alliance”) for the U.S. Department of Energy (the “DOE”).
It is recognized that disclosure of these Practices is provided under the following conditions and warnings: (1) these Practices have been prepared for reference purposes only; (2) these Practices consist of or are based on estimates or assumptions made on a best-efforts basis, based upon present expectations; and (3) these Practices were prepared with existing information and are subject to change without notice.
The user understands that DOE/NREL/ALLIANCE are not obligated to provide the user with any support, consulting, training or assistance of any kind with regard to the use of the Practices or to provide the user with any updates, revisions or new versions thereof. DOE, NREL, and ALLIANCE do not guarantee or endorse any results generated by use of the Practices, and user is entirely responsible for the results and any reliance on the results or the Practices in general.
USER AGREES TO INDEMNIFY DOE/NREL/ALLIANCE AND ITS SUBSIDIARIES, AFFILIATES, OFFICERS, AGENTS, AND EMPLOYEES AGAINST ANY CLAIM OR DEMAND, INCLUDING REASONABLE ATTORNEYS' FEES, RELATED TO USER’S USE OF THE PRACTICES. THE PRACTICES ARE PROVIDED BY DOE/NREL/ALLIANCE "AS IS," AND ANY EXPRESS OR IMPLIED WARRANTIES, INCLUDING BUT NOT LIMITED TO THE IMPLIED WARRANTIES OF MERCHANTABILITY AND FITNESS FOR A PARTICULAR PURPOSE ARE DISCLAIMED. IN NO EVENT SHALL DOE/NREL/ALLIANCE BE LIABLE FOR ANY SPECIAL, INDIRECT OR CONSEQUENTIAL DAMAGES OR ANY DAMAGES WHATSOEVER, INCLUDING BUT NOT LIMITED TO CLAIMS ASSOCIATED WITH THE LOSS OF PROFITS, THAT MAY RESULT FROM AN ACTION IN CONTRACT, NEGLIGENCE OR OTHER TORTIOUS CLAIM THAT ARISES OUT OF OR IN CONNECTION WITH THE ACCESS, USE OR PERFORMANCE OF THE PRACTICES.

iv This report is available at no cost from the National Renewable Energy Laboratory (NREL) at www.nrel.gov/publications.
Preface This document was developed for the U.S. Department of Energy Uniform Methods Project (UMP). The UMP provides model protocols for determining energy and demand savings that result from specific energy-efficiency measures implemented through state and utility programs. In most cases, the measure protocols are based on a particular option identified by the International Performance Verification and Measurement Protocol; however, this work provides a more detailed approach to implementing that option. Each chapter is written by technical experts in collaboration with their peers, reviewed by industry experts, and subject to public review and comment. The protocols are updated on an as-needed basis.
The UMP protocols can be used by utilities, program administrators, public utility commissions, evaluators, and other stakeholders for both program planning and evaluation.
To learn more about the UMP, visit the website, https://energy.gov/eere/about-us/ump-home, or download the UMP introduction document at http://www.nrel.gov/docs/fy17osti/68557.pdf.
v This report is available at no cost from the National Renewable Energy Laboratory (NREL) at www.nrel.gov/publications.
Acknowledgments This chapter was originally developed in 2013 by Doug Bruchs and Josh Keeling of The Cadmus Group, Inc. The 2017 revision, led by Doug Bruchs (Cadeo) and Jason Christensen (Cadmus), benefitted from the input of multiple experts and stakeholders. The authors wish to thank members of the UMP Technical Advisory Group and acknowledge Sami Khawaja (Cadmus) and Peter Franzese (California Public Utilities Commission) for their thoughtful contributions.
Suggested Citation Keeling, J.; Bruchs, D. (2017). Chapter 7: Refrigerator Recycling Evaluation Protocol. The Uniform Methods Project: Methods for Determining Energy-Efficiency Savings for Specific Measures. Golden, CO; National Renewable Energy Laboratory. NREL/SR-7A40-68563. http://www.nrel.gov/docs/fy17osti/68563.pdf
vi This report is available at no cost from the National Renewable Energy Laboratory (NREL) at www.nrel.gov/publications.
Acronyms CDD cooling degree day
DOE U.S. Department of Energy
EUL effective useful life
HDD heating degree day
kWh kilowatt hour
NREL National Renewable Energy Laboratory
NTG net-to-gross
RUL remaining useful life
UEC unit energy consumption
UMP Uniform Methods Project

vii This report is available at no cost from the National Renewable Energy Laboratory (NREL) at www.nrel.gov/publications.
Protocol Updates The original protocol was published in April 2013.
This chapter has been updated to incorporate the following revisions:
• Added a unit energy consumption (UEC) regression model for freezers based on available in situ freezer-specific metering data
• Dropped the induced replacement adjustment as part of the net savings calculation due to the difficulty measuring the adjustment and its small impact on savings
• Highlighted the usefulness of recycling programs in cross-promoting efficiency programs and providing opportunities for positive customer engagement.
viii This report is available at no cost from the National Renewable Energy Laboratory (NREL) at www.nrel.gov/publications.
Table of Contents 1 Measure Description ............................................................................................................................ 1 2 Application Conditions of Protocol .................................................................................................... 2 3 Savings Calculations ........................................................................................................................... 3 4 Measurement and Verification Plan .................................................................................................... 4
4.1 International Performance Measurement and Verification Protocol Option ................................. 4 4.2 Measure Verification (N) .............................................................................................................. 4 4.3 Annual Energy Consumption (EXISTING_UEC) ......................................................................... 5
4.3.1 About In Situ Metering .................................................................................................... 5 4.3.2 About Regression Modeling ............................................................................................. 8 4.3.3 Using Secondary Data .................................................................................................... 11
4.4 Part-Use Factor (PART_USE) ..................................................................................................... 12 4.5 Refrigerator Replacement............................................................................................................ 15
5 Net Savings ......................................................................................................................................... 16 5.1 Free-Ridership and Secondary Market Impacts (NET_FR_SMI_kWh) ....................................... 16
5.1.1 Free-Ridership ................................................................................................................ 16 5.1.2 Secondary Market Impacts ............................................................................................. 19 5.1.3 Integration of Free-Ridership and Secondary Market Impacts ...................................... 21
5.2 Spillover ...................................................................................................................................... 21 5.3 Data Sources ................................................................................................................................ 22
6 Other Evaluation Issues ..................................................................................................................... 24 6.1 Remaining Useful Life ................................................................................................................ 24 6.2 Freezers ....................................................................................................................................... 24 6.3 Customer Satisfaction ................................................................................................................. 24
7 Looking Forward................................................................................................................................. 26 8 Resources ........................................................................................................................................... 27
ix This report is available at no cost from the National Renewable Energy Laboratory (NREL) at www.nrel.gov/publications.
List of Figures Figure 1. Secondary market impacts ........................................................................................................... 20 Figure 2. Savings net of free-ridership and secondary market impacts ...................................................... 21
List of Tables Table 1. Example Refrigerator UEC Calculation Using Regression Model and Program Values ............. 10 Table 2. Example Freezer UEC Calculation Using Regression Model and Program Values ..................... 11 Table 3. Part-Use Factors by Category ....................................................................................................... 12 Table 4. Example Calculation of Historical Part-Use Factors .................................................................... 13 Table 5. Example Calculation of Prospective Program Part-Use ............................................................... 14 Table 6. Determination of Discard and Keep Distribution ......................................................................... 17
1 This report is available at no cost from the National Renewable Energy Laboratory (NREL) at www.nrel.gov/publications.
1 Measure Description Refrigerator recycling programs are designed to save energy by removing operable, albeit less efficient, refrigerators from service. By offering free pickup, providing incentives, and disseminating information about the operating cost of less efficient refrigerators, these programs are designed to encourage consumers to:
• Limit the use of secondary refrigerators1
• Relinquish refrigerators previously used as primary units when they are replaced (rather than keeping the existing refrigerator as a secondary unit)
• Prevent the continued use of less efficient refrigerators in another household through a direct transfer (giving it away or selling it) or indirect transfer (resale on the used appliance market).
Commonly implemented by third-party contractors (who collect and decommission participating appliances), these programs generate energy savings through the retirement of inefficient appliances. The decommissioning process captures environmentally harmful refrigerants and foam, and enables recycling of the plastic, metal, and wiring components.
1 Secondary refrigerators are units not located in the kitchen.
2 This report is available at no cost from the National Renewable Energy Laboratory (NREL) at www.nrel.gov/publications.
2 Application Conditions of Protocol Recycling programs currently have a range of designs:
• Recycling both primary and secondary refrigerators;
• Accepting only secondary refrigerators;
• Imposing restrictions on vintage eligibility;
• Offered in conjunction with point-of-sale rebates to encourage the purchase of ENERGY STAR®-rated refrigerators; and/or
• Offered as part of low-income, direct-install programs that install high-efficiency replacement units.2
The evaluation protocols described in this document, which pertain to all program variations listed, cover the energy savings from retiring operable-but-inefficient refrigerators. This protocol does not discuss the potential energy savings associated with the subsequent installation of a high-efficiency replacement refrigerator (which may occur as part of a separate retail products program).3
2 Low-income, direct-install programs target refrigerators that otherwise would have continued to operate and replace them with comparably sized, new high-efficiency models. Therefore, the basis for estimating savings from these types of programs is different from the other program variations noted. This difference is discussed further in Section 3 of this chapter. 3 As discussed under the section Considering Resource Constraints of the “Introduction” chapter to this UMP report, small utilities (as defined under the U.S. Small Business Administration (SBA) regulations) may face additional constraints in undertaking this protocol. Therefore, alternative methodologies should be considered for such utilities.
3 This report is available at no cost from the National Renewable Energy Laboratory (NREL) at www.nrel.gov/publications.
3 Savings Calculations This protocol provides guidance for estimating both gross and net savings.
The total gross energy savings4 (kilowatt hours [kWhs] per year) achieved from recycling less efficient-but-operable refrigerators is calculated using the following general algorithm:
Equation 1 GROSS_kWh = N * EXISTING_UEC * PART_USE
Where:
GROSS_kWh = Annual electricity savings measured in kilowatt hours
N = The number of refrigerators recycled through the program
EXISTING_UEC = The average annual unit energy consumption of participating refrigerators
PART_USE = The portion of the year the average refrigerator would likely have operated if not recycled through the program
Due to the considerable potential for free-ridership in appliance recycling programs in general, this protocol includes a discussion of net savings. For this protocol, the net adjustment accounts for current early replacement and recycling practice. The total net energy savings (kWhrs/year) is calculated as follows:
Equation 2 NET_kWh = N * NET_FR_SMI_kWh
Where: NET_FR_SMI_kWh = Average per-unit energy savings net of naturally
occurring removal from grid and secondary market impacts
The recommended techniques for estimating each of these parameters are described in the sections below.
4 The evaluation protocol methods focus on energy savings; they do not include other parameter assessments such as peak coincidence factor (demand reduction), incremental cost, or measure life.
4 This report is available at no cost from the National Renewable Energy Laboratory (NREL) at www.nrel.gov/publications.
4 Measurement and Verification Plan This section provides instructions for determining the parameters required to estimate a refrigerator recycling program’s total gross savings (GROSS_kWh).
The key parameters are:
• Measure verification (N)
• Annual energy consumption (EXISTING_UEC)
• Part-use factor (PART_USE).
4.1 International Performance Measurement and Verification Protocol Option
Option B (Retrofit Isolation) is the recommended International Performance Measurement and Verification Protocol Option for this measure. Option B, which relies on short-term or continuous metering, most commonly includes both pre- and post-retrofit metering, or, when pre- retrofit metering is not possible, just post-metering. However, in the case of refrigerator recycling, evaluators should conduct just pre-retrofit metering to determine the energy consumption of the appliance that will be recycled by the program.
4.2 Measure Verification (N) The program administrator or the third-party implementation contractor should record the number of refrigerators recycled through a program. Ideally, the data for all participating refrigerators are compiled electronically in a database that tracks the following information (at a minimum):
• Age (in years, or year of manufacture)
• Size (in cubic feet)
• Configuration (top freezer, bottom freezer, side-by-side, or single door)
• Date the refrigerator was removed
• Complete customer contact information. This protocol recommends that early in the evaluation process, the evaluators review the program databases to ensure they are being fully populated and contain sufficient information to inform subsequent evaluation activities.
Self-reported verification of program recycling records via a survey of randomly sampled participants has proven to be a reliable methodology. Survey efforts should include a sufficient sample of participants to meet the required level of statistical significance. When no requirements exist, this protocol recommends a sample that achieves, at minimum, a 90% level of confidence with a ±10% margin of error. Past evaluations have shown that participants typically have little difficulty confirming the number of units recycled and the approximate date the removal took place (Cadmus 2010).
5 This report is available at no cost from the National Renewable Energy Laboratory (NREL) at www.nrel.gov/publications.
4.3 Annual Energy Consumption (EXISTING_UEC) To determine the average per-unit annual energy consumption, use a regression-based analysis that relies on either:
• Metering a sample of participating units or
• Using metered data that was collected as part of other recycling program evaluations (when evaluation resources do not support primary data collection).
Average savings, as determined through either of these approaches, may be used but need to be updated at least every three years to account for program maturation.
This protocol strongly recommends that evaluators conduct a metering study, if possible. As this method is the preferred evaluation approach, the remainder of this section outlines the best practices for (1) implementing a metering study and (2) using the results to estimate annual energy consumption and, subsequently, energy savings.
4.3.1 About In Situ Metering Historically, recycling evaluations have primarily relied on unit energy consumption (UEC) estimates from the U.S. Department of Energy (DOE) testing protocols (DOE 2008).5 However, recent evaluations indicate that DOE test conditions (for example, empty refrigeration and freezers cabinets, no door openings, and 90˚F test chamber) may not accurately reflect UECs for recycled appliances (ADM 2008, Cadmus 2010). As a result, evaluations have increasingly used in situ (meaning “in its original place”) metering to assess energy consumption.
In situ metering is recommended for two reasons:
• It accounts for environmental conditions and usage patterns within participating homes (for example, door openings, unit location, and exposure to weather), which are not explicitly accounted for in DOE testing.
• Most of the DOE-based UECs that are publicly available in industry databases were made at the time the appliance was manufactured, rather than when the unit was retired. Using testing data from the time of manufacture requires that assumptions be made about the degree of an appliance’s degradation. In situ metering is conducted immediately prior to program participation (that is, at the time of the unit’s retirement), so it is unnecessary to make such an adjustment or assumption.
In summary, while the DOE testing protocols provide accurate insights into the relative efficiency of appliances (most commonly at their time of manufacture), in situ metering yields the most accurate estimate of energy consumption (and, therefore, savings) for operable appliances that are less efficient.
5 Evaluations have also used forms of billing analysis; however, this protocol does not recommend billing analysis or any other whole-house approach. The magnitude of expected savings―given total household energy consumption and changes in consumption unrelated to the program―could result in a less certain estimate than can be obtained from an end-use specific approach.

6 This report is available at no cost from the National Renewable Energy Laboratory (NREL) at www.nrel.gov/publications.
4.3.1.1 Key Factors for In Situ Metering The following factors should be considered when implementing an in situ metering study:
• Sample Size. The recommended levels of statistical significance, which dictate the necessary sample size, are outlined in UMP Chapter 11: Sample Design Cross-Cutting Protocol. It is recommended that evaluators assume a minimum coefficient of variation of 0.5 to ensure that a sufficient sample is available to compensate for attrition issues that routinely occur in field measurement.6 For refrigerators, these attrition issues may include simple meter failure, relocation of the unit during metering, and atypical usage (for example, the refrigerator is prematurely emptied in preparation for program pickup). This protocol recommends that evaluators educate study participants (and provide written leave-behind materials) about not relocating the refrigerator or otherwise using the unit in any manner inconsistent with historical usage.
• Stratification. The program theory assumes that most recycled appliances would have been used as secondary units had they not been decommissioned through the program.7 However, some units may continue to operate as a primary unit within the same home. To correctly account for differences in usage patterns, it is critical to stratify the metering sample to represent the different usage types.8
For programs evaluated previously, information may be available about the proportion of refrigerators likely to have been used as primary versus secondary units. If so, that information can be leveraged to develop stratification quotas for the metering study.
Once established, strict quotas should be enforced during the recruitment process because participants who recycle secondary appliances are typically more willing to participate in a metering study than those who recycle primary appliances. Participants who are recycling their primary appliance are typically replacing them, and they are often unwilling to deal with the logistics related to rescheduling the delivery of their new unit.
Additional stratification is not critical, due to the high degree of collinearity between refrigerator age, size, and configuration. However, when sufficient evaluation resources are available, targeting a sample of appliances with less common characteristics can reduce collinearity and increase the final model’s explanatory power.
• Duration. To capture a range of appliance usage patterns, meters need to be installed for a minimum of 10 to 14 days.9 Collecting approximately two weeks’ worth of energy-consumption data ensures that the metering period covers weekdays and weekends. Longer metering periods will provide a greater range of usage (and more data points);
6 For a broader discussion of the coefficient of variation, see the UMP Chapter 11. 7 This includes several scenarios: The refrigerator may continue as a secondary appliance within the same home, be transitioned from a primary to a secondary appliance within the same home, or become a secondary unit in another home. 8 This protocol recommends stratification by usage type, even for programs that only accept secondary units, as primary units are typically still recycled through these programs (via gaming or confusion about requirements). 9 The previously cited evaluations in California (ADM 2008, Cadmus 2010) both collected metering data for a minimum of from 10 to 14 days.
7 This report is available at no cost from the National Renewable Energy Laboratory (NREL) at www.nrel.gov/publications.
however, the duration needs to be balanced with the customers’ desire to have their refrigerator removed and recycled.
• Equipment. To capture information on compressor cycling, record the data in intervals of five minutes or less. If the meters’ data capacity permits, a shorter interval (of one or two minutes) is preferable. When possible, meter the following parameters; however, if metering efforts are limited, prioritize the parameters in this order:
o Current and/or power
o Internal refrigerator and/or freezer cabinet temperature
o Ambient temperature
o Frequency and duration of door openings.10
Not all the aforementioned metered values are used to determine energy consumption. Some help identify potential problems in the metering process, and thus increase the quality of the data. (For example, a comparison of ambient room temperature to internal cabinet temperature can be used to determine if the appliance was operational throughout the entire metering period.) This protocol recommends that evaluators perform similar diagnostics on all raw metering data before including an appliance in the final analysis dataset.
• Seasonality. Previous metering studies have shown that the energy consumption of secondary appliances in unconditioned spaces differs by season―especially in regions that experience extreme summer and/or winter weather.11 As a result, metering needs to be conducted in waves on separate samples. By capturing a range of weather conditions using multiple metering waves (which include winter and summer peaks, as well as shoulder seasons), it is possible to annualize metering results more accurately. If it is not possible to meter appliances during multiple seasons, then annualize the metered data using existing refrigerator load shapes (that are utility specific, when available) to avoid producing seasonally biased estimates of annual unit consumption.
• Recruitment. When arranging for metering, evaluators must contact participating customers before the appliance is removed. By working closely with the program implementers (who can provide daily lists of recently scheduled pickups), evaluators can contact those customers to determine their eligibility and solicit their participation in the metering study.
This protocol recommends providing incentives to participants. Incentives aid in recruitment because they both provide recognition of the participants’ cooperation and offset the added expense of continuing to operate their refrigerator during metering.
10 The Cadmus 2010 evaluation used the following metering equipment: HOBO U9-002 Light Sensor (recorded the frequency and duration of door openings), HOBO U12-012 External Data Logger (recorded the ambient temperature and humidity), HOBO U12-012 Internal Data Logger (recorded the cabinet temperature), HOBO CTV-A (recorded the current), and the Watts up? Pro ES Power Meter (recorded energy consumption). 11 Michigan Energy Efficiency Measure Database memo by Cadmus regarding Consumers Energy and DTE Energy appliance recycling programs.
8 This report is available at no cost from the National Renewable Energy Laboratory (NREL) at www.nrel.gov/publications.
Once participants are recruited, the evaluator and the implementer should collaborate in scheduling the participants’ pickup after all the metering equipment is removed.
• Installation and Removal. Evaluators can install and remove all metering equipment, or, to minimize costs, program implementers can perform these functions. However, when program implementers are involved in the metering process, the evaluator must still independently conduct all sampling design and selection, recruitment, metering equipment programming, data extraction, and data analysis.
To ensure installations and removals are performed correctly, evaluators should train the implementers’ field staff members and, ideally, accompany them on a sample of sites. If time and evaluation resources permit, evaluators should verify early in the data collection phase that the metering equipment is installed properly at a small sample of participating homes, in order to identify and correct any installation issues.
Because the metering process requires an additional trip to customer homes, evaluators need to compensate the implementers for their time. Consequently, the evaluators should contact implementers as early as possible to determine the viability of this approach and agree upon the appropriate compensation.
• Frequency. Because the characteristics of recycled refrigerators change as a program matures and greater market penetration is achieved, metering should be conducted approximately every three years. Savings estimates that rely exclusively on metering data older than three years reflect the current program year inaccurately. This is most commonly due to changes in the mix of recycled appliances manufactured before and after the establishment of appliance-related standards (including various state, regional, or federal standards) between program years. The main impact of these changes is a long-term downward effect on the savings associated with recycling programs.
4.3.2 About Regression Modeling To estimate the annual UEC of the average recycled refrigerator, this protocol recommends that evaluators use a multivariate regression model that relates observed energy consumption to refrigerator characteristics.
Evaluators should employ models that use daily or hourly observed energy consumption as the dependent variable. Independent variables should include key refrigerator characteristics or environmental factors determined to be statistically significant. This functional form allows the coefficient of each independent variable to indicate the relative influence of that variable (or appliance characteristic) on the observed energy consumption, holding all other variables constant. This approach allows evaluators to estimate the energy consumption of all participating appliances based on the set of characteristics maintained in the program tracking database.
In estimating UEC, both time and cross-sectional effects must be accounted for. This can be done in one of two ways:
• Use a model that simultaneously estimates the impacts of longitudinal (time) and cross-sectional effects on energy consumption. This approach is recommended if the sample size is reasonably large and if units are observed across both summer and winter peak periods.
9 This report is available at no cost from the National Renewable Energy Laboratory (NREL) at www.nrel.gov/publications.
• Use a set of time-series models. If metering is done during only the winter or summer, use a refrigerator load shape from a secondary source to extrapolate the annual UEC for each metered refrigerator. Then apply a regression model using the entire metering sample to predict annualized consumption as a function of cross-sectional variables.
Once model parameters are estimated, the results may be used to estimate UEC for each refrigerator recycled through a program, based on each unit’s unique set of characteristics. An example is provided later in this section.
The exact model specification (a set of appliance characteristics or independent variables) yielding the greatest explanatory power varies from study to study, based on the underlying metering data. Thus, this protocol does not mandate a certain specification. However, evaluators should consider―at a minimum―the following independent variables:
• Age (years) and corresponding vintage (compliance with relevant efficiency code)
• Size (in cubic feet)
• Configuration (top freezer, bottom freezer, side-by-side, or single door)
• Primary or secondary designation
• Conditioned or unconditioned space12
• Location (kitchen, garage, basement, porch, etc.)
• Weather (cooling degree days [CDD] and heating degree days [HDD]). For each set of potential independent variables, evaluators should assess the variance inflation factors, adjusted R2, residual plots, and other measures of statistical significance and fit.
In the specification process, evaluators should also consider the following elements:
• Estimating model parameters by using an ordinary least squares or generalized least squares method
• Transforming explanatory variables (logged and squared values) based on theoretical and empirical methods
• Considering interaction terms (such as between refrigerators located in unconditioned spaces and CDD/HDD) when they are theoretically sound (that is, not simply to increase the adjusted R2 or any other diagnostic metric)
• Balancing model parsimony with explanatory power (It is very important not to over-specify the model(s). As the regression models are used to predict consumption for a wide variety of units, overly specified models can lose their predictive validity.).
12 The primary or secondary designation and conditioned or unconditioned space variables may exhibit a strong collinearity; consequently, do not include both in the final model.
10 This report is available at no cost from the National Renewable Energy Laboratory (NREL) at www.nrel.gov/publications.
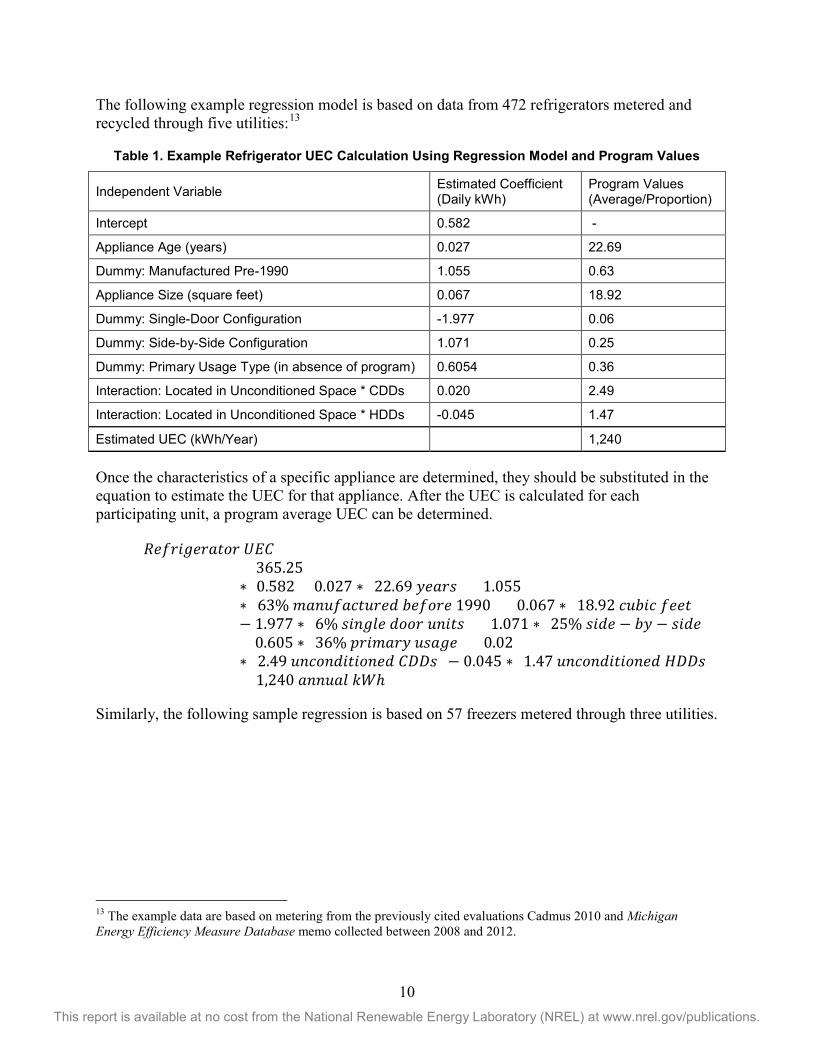
The following example regression model is based on data from 472 refrigerators metered and recycled through five utilities:13
Table 1. Example Refrigerator UEC Calculation Using Regression Model and Program Values
Independent Variable Estimated Coefficient (Daily kWh)
Program Values (Average/Proportion)
Intercept 0.582 -
Appliance Age (years) 0.027 22.69
Dummy: Manufactured Pre-1990 1.055 0.63
Appliance Size (square feet) 0.067 18.92
Dummy: Single-Door Configuration -1.977 0.06
Dummy: Side-by-Side Configuration 1.071 0.25
Dummy: Primary Usage Type (in absence of program) 0.6054 0.36
Interaction: Located in Unconditioned Space * CDDs 0.020 2.49
Interaction: Located in Unconditioned Space * HDDs -0.045 1.47
Estimated UEC (kWh/Year)
1,240
Once the characteristics of a specific appliance are determined, they should be substituted in the equation to estimate the UEC for that appliance. After the UEC is calculated for each participating unit, a program average UEC can be determined.
𝑅𝑅𝑅𝑅𝑅𝑅𝑅𝑅𝑖𝑖𝑔𝑔𝑅𝑅𝑅𝑅𝑔𝑔𝑔𝑔𝑔𝑔𝑅𝑅 𝑈𝑈𝑈𝑈𝑈𝑈= 365.25∗ [0.582 + 0.027 ∗ (22.69 𝑦𝑦𝑅𝑅𝑔𝑔𝑅𝑅𝑦𝑦) + 1.055∗ (63% 𝑚𝑚𝑔𝑔𝑚𝑚𝑚𝑚𝑅𝑅𝑔𝑔𝑚𝑚𝑔𝑔𝑚𝑚𝑅𝑅𝑅𝑅𝑚𝑚 𝑏𝑏𝑅𝑅𝑅𝑅𝑔𝑔𝑅𝑅𝑅𝑅 1990) + 0.067 ∗ (18.92 𝑚𝑚𝑚𝑚𝑏𝑏𝑖𝑖𝑚𝑚 𝑅𝑅𝑅𝑅𝑅𝑅𝑔𝑔)− 1.977 ∗ (6% 𝑦𝑦𝑖𝑖𝑚𝑚𝑔𝑔𝑠𝑠𝑅𝑅 𝑚𝑚𝑔𝑔𝑔𝑔𝑅𝑅 𝑚𝑚𝑚𝑚𝑖𝑖𝑔𝑔𝑦𝑦) + 1.071 ∗ (25% 𝑦𝑦𝑖𝑖𝑚𝑚𝑅𝑅 − 𝑏𝑏𝑦𝑦 − 𝑦𝑦𝑖𝑖𝑚𝑚𝑅𝑅)+ 0.605 ∗ (36% 𝑝𝑝𝑅𝑅𝑖𝑖𝑚𝑚𝑔𝑔𝑅𝑅𝑦𝑦 𝑚𝑚𝑦𝑦𝑔𝑔𝑔𝑔𝑅𝑅) + 0.02∗ (2.49 𝑚𝑚𝑚𝑚𝑚𝑚𝑔𝑔𝑚𝑚𝑚𝑚𝑖𝑖𝑔𝑔𝑖𝑖𝑔𝑔𝑚𝑚𝑅𝑅𝑚𝑚 𝑈𝑈𝐶𝐶𝐶𝐶𝑦𝑦) − 0.045 ∗ (1.47 𝑚𝑚𝑚𝑚𝑚𝑚𝑔𝑔𝑚𝑚𝑚𝑚𝑖𝑖𝑔𝑔𝑖𝑖𝑔𝑔𝑚𝑚𝑅𝑅𝑚𝑚 𝐻𝐻𝐶𝐶𝐶𝐶𝑦𝑦)]= 1,240 𝑔𝑔𝑚𝑚𝑚𝑚𝑚𝑚𝑔𝑔𝑠𝑠 𝑘𝑘𝑘𝑘ℎ
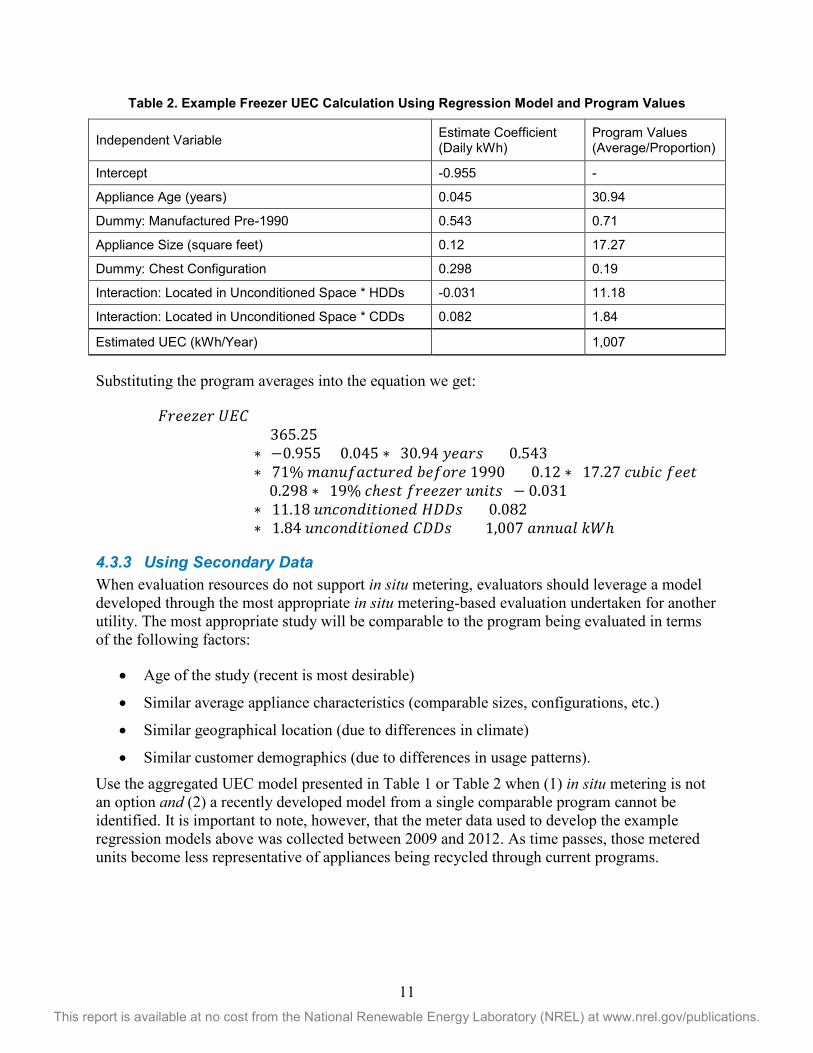
Similarly, the following sample regression is based on 57 freezers metered through three utilities.
13 The example data are based on metering from the previously cited evaluations Cadmus 2010 and Michigan Energy Efficiency Measure Database memo collected between 2008 and 2012.
11 This report is available at no cost from the National Renewable Energy Laboratory (NREL) at www.nrel.gov/publications.
Table 2. Example Freezer UEC Calculation Using Regression Model and Program Values
Independent Variable Estimate Coefficient (Daily kWh)
Program Values (Average/Proportion)
Intercept -0.955 -
Appliance Age (years) 0.045 30.94
Dummy: Manufactured Pre-1990 0.543 0.71
Appliance Size (square feet) 0.12 17.27
Dummy: Chest Configuration 0.298 0.19
Interaction: Located in Unconditioned Space * HDDs -0.031 11.18
Interaction: Located in Unconditioned Space * CDDs 0.082 1.84
Estimated UEC (kWh/Year) 1,007
Substituting the program averages into the equation we get:
𝐹𝐹𝑅𝑅𝑅𝑅𝑅𝑅𝐹𝐹𝑅𝑅𝑅𝑅 𝑈𝑈𝑈𝑈𝑈𝑈= 365.25∗ [−0.955 + 0.045 ∗ (30.94 𝑦𝑦𝑅𝑅𝑔𝑔𝑅𝑅𝑦𝑦) + 0.543∗ (71% 𝑚𝑚𝑔𝑔𝑚𝑚𝑚𝑚𝑅𝑅𝑔𝑔𝑚𝑚𝑔𝑔𝑚𝑚𝑅𝑅𝑅𝑅𝑚𝑚 𝑏𝑏𝑅𝑅𝑅𝑅𝑔𝑔𝑅𝑅𝑅𝑅 1990) + 0.12 ∗ (17.27 𝑚𝑚𝑚𝑚𝑏𝑏𝑖𝑖𝑚𝑚 𝑅𝑅𝑅𝑅𝑅𝑅𝑔𝑔)+ 0.298 ∗ (19% 𝑚𝑚ℎ𝑅𝑅𝑦𝑦𝑔𝑔 𝑅𝑅𝑅𝑅𝑅𝑅𝑅𝑅𝐹𝐹𝑅𝑅𝑅𝑅 𝑚𝑚𝑚𝑚𝑖𝑖𝑔𝑔𝑦𝑦) − 0.031∗ (11.18 𝑚𝑚𝑚𝑚𝑚𝑚𝑔𝑔𝑚𝑚𝑚𝑚𝑖𝑖𝑔𝑔𝑖𝑖𝑔𝑔𝑚𝑚𝑅𝑅𝑚𝑚 𝐻𝐻𝐶𝐶𝐶𝐶𝑦𝑦) + 0.082∗ (1.84 𝑚𝑚𝑚𝑚𝑚𝑚𝑔𝑔𝑚𝑚𝑚𝑚𝑖𝑖𝑔𝑔𝑖𝑖𝑔𝑔𝑚𝑚𝑅𝑅𝑚𝑚 𝑈𝑈𝐶𝐶𝐶𝐶𝑦𝑦)] = 1,007 𝑔𝑔𝑚𝑚𝑚𝑚𝑚𝑚𝑔𝑔𝑠𝑠 𝑘𝑘𝑘𝑘ℎ
4.3.3 Using Secondary Data When evaluation resources do not support in situ metering, evaluators should leverage a model developed through the most appropriate in situ metering-based evaluation undertaken for another utility. The most appropriate study will be comparable to the program being evaluated in terms of the following factors:
• Age of the study (recent is most desirable)
• Similar average appliance characteristics (comparable sizes, configurations, etc.)
• Similar geographical location (due to differences in climate)
• Similar customer demographics (due to differences in usage patterns). Use the aggregated UEC model presented in Table 1 or Table 2 when (1) in situ metering is not an option and (2) a recently developed model from a single comparable program cannot be identified. It is important to note, however, that the meter data used to develop the example regression models above was collected between 2009 and 2012. As time passes, those metered units become less representative of appliances being recycled through current programs.
12 This report is available at no cost from the National Renewable Energy Laboratory (NREL) at www.nrel.gov/publications.
4.4 Part-Use Factor (PART_USE) “Part-use” is an appliance recycling-specific adjustment factor used to convert the UEC (determined through the methods detailed above) into an average per-unit gross savings value. The UEC itself is not equal to the gross savings value for two reasons:
• The UEC model yields an estimate of annual consumption
• Not all recycled refrigerators would have operated year-round had they not been decommissioned through the program.
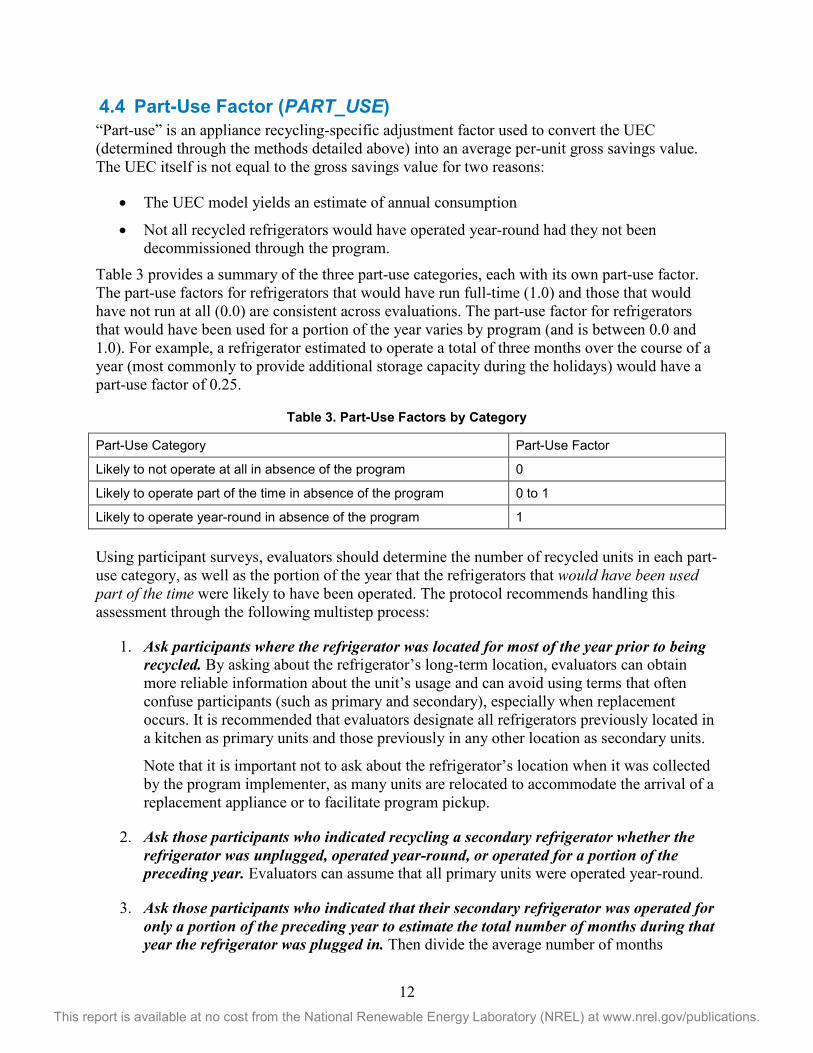
Table 3 provides a summary of the three part-use categories, each with its own part-use factor. The part-use factors for refrigerators that would have run full-time (1.0) and those that would have not run at all (0.0) are consistent across evaluations. The part-use factor for refrigerators that would have been used for a portion of the year varies by program (and is between 0.0 and 1.0). For example, a refrigerator estimated to operate a total of three months over the course of a year (most commonly to provide additional storage capacity during the holidays) would have a part-use factor of 0.25.
Table 3. Part-Use Factors by Category
Part-Use Category Part-Use Factor
Likely to not operate at all in absence of the program 0
Likely to operate part of the time in absence of the program 0 to 1
Likely to operate year-round in absence of the program 1 Using participant surveys, evaluators should determine the number of recycled units in each part-use category, as well as the portion of the year that the refrigerators that would have been used part of the time were likely to have been operated. The protocol recommends handling this assessment through the following multistep process:
1. Ask participants where the refrigerator was located for most of the year prior to being recycled. By asking about the refrigerator’s long-term location, evaluators can obtain more reliable information about the unit’s usage and can avoid using terms that often confuse participants (such as primary and secondary), especially when replacement occurs. It is recommended that evaluators designate all refrigerators previously located in a kitchen as primary units and those previously in any other location as secondary units.
Note that it is important not to ask about the refrigerator’s location when it was collected by the program implementer, as many units are relocated to accommodate the arrival of a replacement appliance or to facilitate program pickup.
2. Ask those participants who indicated recycling a secondary refrigerator whether the refrigerator was unplugged, operated year-round, or operated for a portion of the preceding year. Evaluators can assume that all primary units were operated year-round.
3. Ask those participants who indicated that their secondary refrigerator was operated for only a portion of the preceding year to estimate the total number of months during that year the refrigerator was plugged in. Then divide the average number of months
13 This report is available at no cost from the National Renewable Energy Laboratory (NREL) at www.nrel.gov/publications.
specified by this subset of participants by 12 to calculate the part-use factor for all refrigerators operated for only a portion of the year.
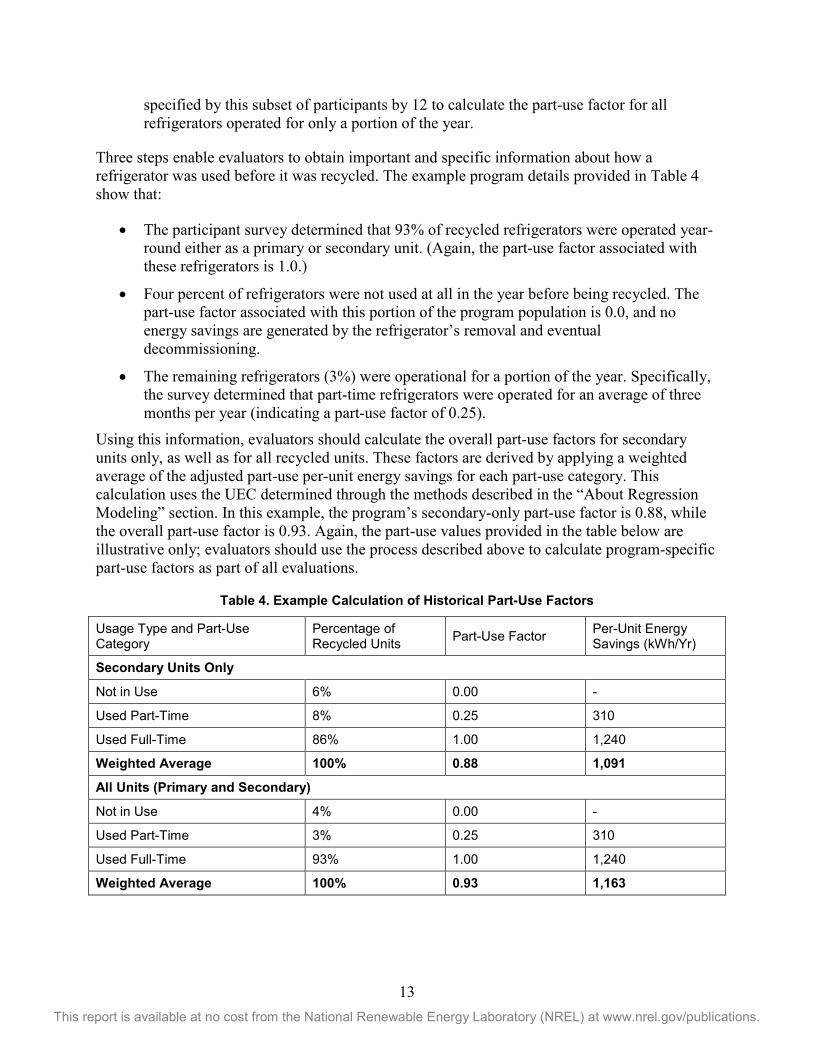
Three steps enable evaluators to obtain important and specific information about how a refrigerator was used before it was recycled. The example program details provided in Table 4 show that:
• The participant survey determined that 93% of recycled refrigerators were operated year-round either as a primary or secondary unit. (Again, the part-use factor associated with these refrigerators is 1.0.)
• Four percent of refrigerators were not used at all in the year before being recycled. The part-use factor associated with this portion of the program population is 0.0, and no energy savings are generated by the refrigerator’s removal and eventual decommissioning.
• The remaining refrigerators (3%) were operational for a portion of the year. Specifically, the survey determined that part-time refrigerators were operated for an average of three months per year (indicating a part-use factor of 0.25).
Using this information, evaluators should calculate the overall part-use factors for secondary units only, as well as for all recycled units. These factors are derived by applying a weighted average of the adjusted part-use per-unit energy savings for each part-use category. This calculation uses the UEC determined through the methods described in the “About Regression Modeling” section. In this example, the program’s secondary-only part-use factor is 0.88, while the overall part-use factor is 0.93. Again, the part-use values provided in the table below are illustrative only; evaluators should use the process described above to calculate program-specific part-use factors as part of all evaluations.
Table 4. Example Calculation of Historical Part-Use Factors
Usage Type and Part-Use Category
Percentage of Recycled Units Part-Use Factor Per-Unit Energy
Savings (kWh/Yr)
Secondary Units Only
Not in Use 6% 0.00 -
Used Part-Time 8% 0.25 310
Used Full-Time 86% 1.00 1,240
Weighted Average 100% 0.88 1,091
All Units (Primary and Secondary)
Not in Use 4% 0.00 -
Used Part-Time 3% 0.25 310
Used Full-Time 93% 1.00 1,240
Weighted Average 100% 0.93 1,163
14 This report is available at no cost from the National Renewable Energy Laboratory (NREL) at www.nrel.gov/publications.
Next, evaluators should combine these historically observed part-use factors with participants’ self-reported action had the program not been available. (That is, the participants’ report as to whether they would they have kept or discarded their refrigerator.)14
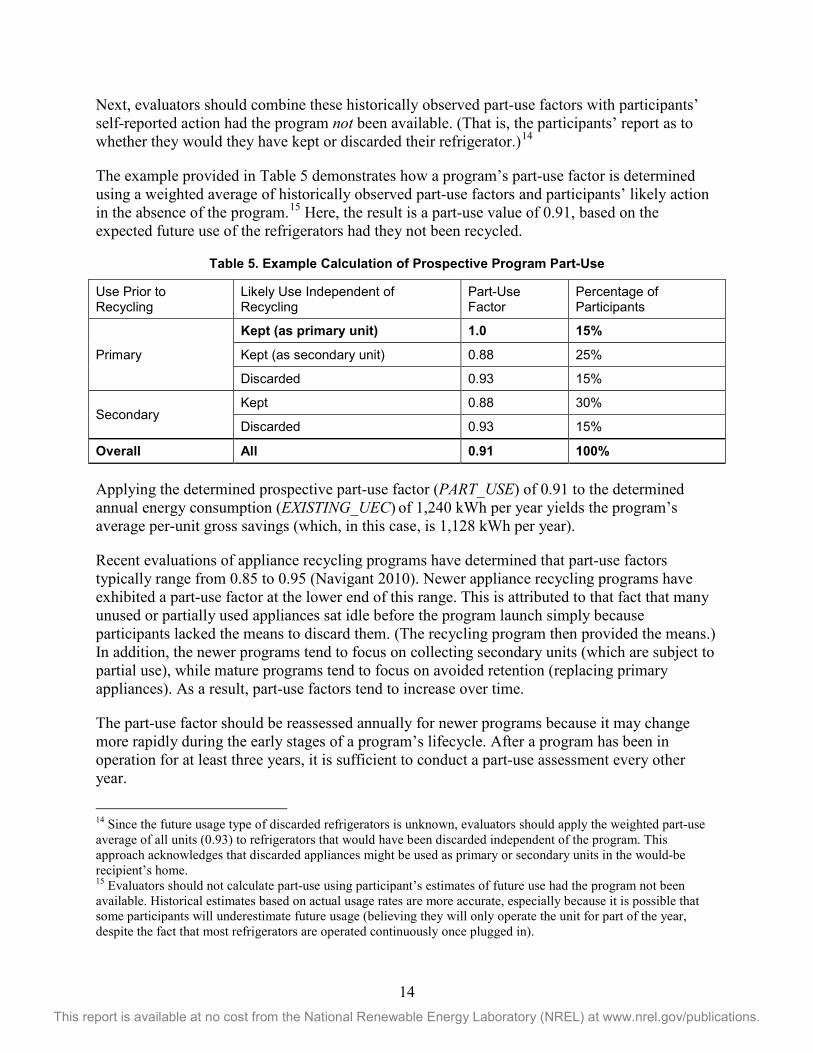
The example provided in Table 5 demonstrates how a program’s part-use factor is determined using a weighted average of historically observed part-use factors and participants’ likely action in the absence of the program.15 Here, the result is a part-use value of 0.91, based on the expected future use of the refrigerators had they not been recycled.
Table 5. Example Calculation of Prospective Program Part-Use
Use Prior to Recycling
Likely Use Independent of Recycling
Part-Use Factor
Percentage of Participants
Primary
Kept (as primary unit) 1.0 15%
Kept (as secondary unit) 0.88 25%
Discarded 0.93 15%
Secondary Kept 0.88 30%
Discarded 0.93 15%
Overall All 0.91 100%
Applying the determined prospective part-use factor (PART_USE) of 0.91 to the determined annual energy consumption (EXISTING_UEC) of 1,240 kWh per year yields the program’s average per-unit gross savings (which, in this case, is 1,128 kWh per year).
Recent evaluations of appliance recycling programs have determined that part-use factors typically range from 0.85 to 0.95 (Navigant 2010). Newer appliance recycling programs have exhibited a part-use factor at the lower end of this range. This is attributed to that fact that many unused or partially used appliances sat idle before the program launch simply because participants lacked the means to discard them. (The recycling program then provided the means.) In addition, the newer programs tend to focus on collecting secondary units (which are subject to partial use), while mature programs tend to focus on avoided retention (replacing primary appliances). As a result, part-use factors tend to increase over time.
The part-use factor should be reassessed annually for newer programs because it may change more rapidly during the early stages of a program’s lifecycle. After a program has been in operation for at least three years, it is sufficient to conduct a part-use assessment every other year.
14 Since the future usage type of discarded refrigerators is unknown, evaluators should apply the weighted part-use average of all units (0.93) to refrigerators that would have been discarded independent of the program. This approach acknowledges that discarded appliances might be used as primary or secondary units in the would-be recipient’s home. 15 Evaluators should not calculate part-use using participant’s estimates of future use had the program not been available. Historical estimates based on actual usage rates are more accurate, especially because it is possible that some participants will underestimate future usage (believing they will only operate the unit for part of the year, despite the fact that most refrigerators are operated continuously once plugged in).
15 This report is available at no cost from the National Renewable Energy Laboratory (NREL) at www.nrel.gov/publications.
4.5 Refrigerator Replacement In most cases, the per-unit gross energy savings attributable to the program is equal to the energy consumption of the recycled appliance (rather than being equal to the difference between the consumption of the participating appliance and its replacement, when applicable). This is because the energy savings generated by the program are not limited to the change within the participant’s home but rather to the total change in energy consumption at the grid level.
This concept is best explained with an example. Suppose a customer decides to purchase a new refrigerator to replace an existing one. When the customer mentions this to a neighbor, the neighbor asks for that existing refrigerator to use as a secondary unit. The customer agrees to give the existing appliance to the neighbor; however, before this transfer is made, the customer learns about a utility-sponsored appliance recycling program. The customer decides to participate in the program because the incentive helps offsets the cost of the new refrigerator. As a result of program intervention, the customer’s appliance is permanently removed from operation in the utility’s service territory.
From the utility’s perspective, the difference in grid-level energy consumption―and the corresponding increase in program savings―are equal to the consumption of the recycled appliance and not to the difference between the energy consumption of the participating appliance and its replacement. In this example, it is important to note that the participant planned to replace the appliance.
In general, the purchase of new refrigerators is part of the naturally occurring appliance lifecycle, typically independent of the program and tantamount to refrigerator load growth. It is not the purpose of the program to prevent these inevitable purchases, but rather to minimize the grid-level refrigerator load growth by limiting the number of existing appliances that continue to be operated once they are replaced.
It may be possible that a recycling program could induce a replacement (that is, the participant would not have purchased the new refrigerator in absence of the recycling program). However, accurately measuring this effect is difficult, as surveyed program participants are often confused by the questions about their intentions to purchase another appliance absent the recycling program. Past evaluations that assessed induced replacement rates found that customers may initially state that they would not have purchased a replacement absent the influence of a program. But when asked follow-up questions about which aspect of the program influenced their decision, customers often mentioned factors unrelated to the program, such as wanting a larger appliance or that the prior unit was old and they wanted something more dependable. These follow-up answers contradict the earlier answers that the program was the reason they decided to acquire a new unit. Given the relatively small impact of potential program induced replacements, the difficulty in measuring accurately, and the general confusion resulting from these questions during customer surveys, this protocol recommends against estimating induced replacement and using as a factor when determining net program savings.
Appliances that, independent of the program, would have been discarded in a way leading to destruction (such as being taken to a landfill)―rather than being transferred to a new user―are captured by the program net-to-gross (NTG) ratio. Thus, no net savings are generated by the program. This is a separate issue from estimating gross energy savings and is discussed in Section 5 in more detail.
16 This report is available at no cost from the National Renewable Energy Laboratory (NREL) at www.nrel.gov/publications.
5 Net Savings This section provides instructions for determining the additional parameters required to estimate a refrigerator recycling program’s net savings (NET_kWh). In the case of refrigerator recycling, net savings are only generated when the recycled appliance would have continued to operate absent program intervention (either within the participating customer’s home or at the home of another utility customer).
5.1 Free-Ridership and Secondary Market Impacts (NET_FR_SMI_kWh)
To estimate free-ridership and secondary market impacts, this protocol recommends using a combination of the responses of surveyed participants, surveyed nonparticipants, and (if possible) secondary market research. Use all these data together to populate a decision tree of all possible savings scenarios. Then take a weighted average of these scenarios to calculate the savings that can be credited to the program after accounting for either free-ridership or the program’s interaction with the secondary market. Populate this decision tree based on what the participating households would have done outside the program and, if the unit would have been transferred to another household, whether the would-be acquirer of that refrigerator finds an alternate unit instead.
In general, independent of program intervention, participating refrigerators would have been subject to one of the following scenarios:
1. The refrigerator would have been kept by the household
2. The refrigerator would have been discarded by a method that transfers it to another customer for continued use
3. The refrigerator would have been discarded by a method leading to its removal from service.
These scenarios encompass what has often been referred to as free-ridership (the proportion of units that would have been taken off the grid absent the program).
For units that would have been transferred to another household, the question then becomes what purchasing decisions are made by the would-be acquirers of participating units now that these units are unavailable:
1. They could not purchase or acquire another unit
2. They could purchase or acquire another unit.
Adjustments to savings based on these factors are referred to as the program’s secondary market impacts.
5.1.1 Free-Ridership The first step is to estimate the distribution of participating units likely to have been kept or discarded absent the program. Further, there are two possible scenarios for discarded units, so in total, there are three possible scenarios independent of program intervention:
17 This report is available at no cost from the National Renewable Energy Laboratory (NREL) at www.nrel.gov/publications.
1. Unit is discarded and transferred to another household
2. Unit is discarded and destroyed
3. Unit is kept in the home.
As participants often do not have full knowledge of the available options for and potential barriers to disposing refrigerators (Scenarios 1 and 2), this document recommends using nonparticipant16 survey data to mitigate potential self-reporting errors. The proportion of units that would have been kept in the home (Scenario 3) can be estimated exclusively through the participant surveys, as participants can reliably provide this information.
Nonparticipant surveys provide information from other utility customers regarding how they actually discarded their refrigerator independent of the program. Evaluators can use this information to estimate the proportion of discarded units that are transferred (Scenario 1) versus destroyed (Scenario 2).
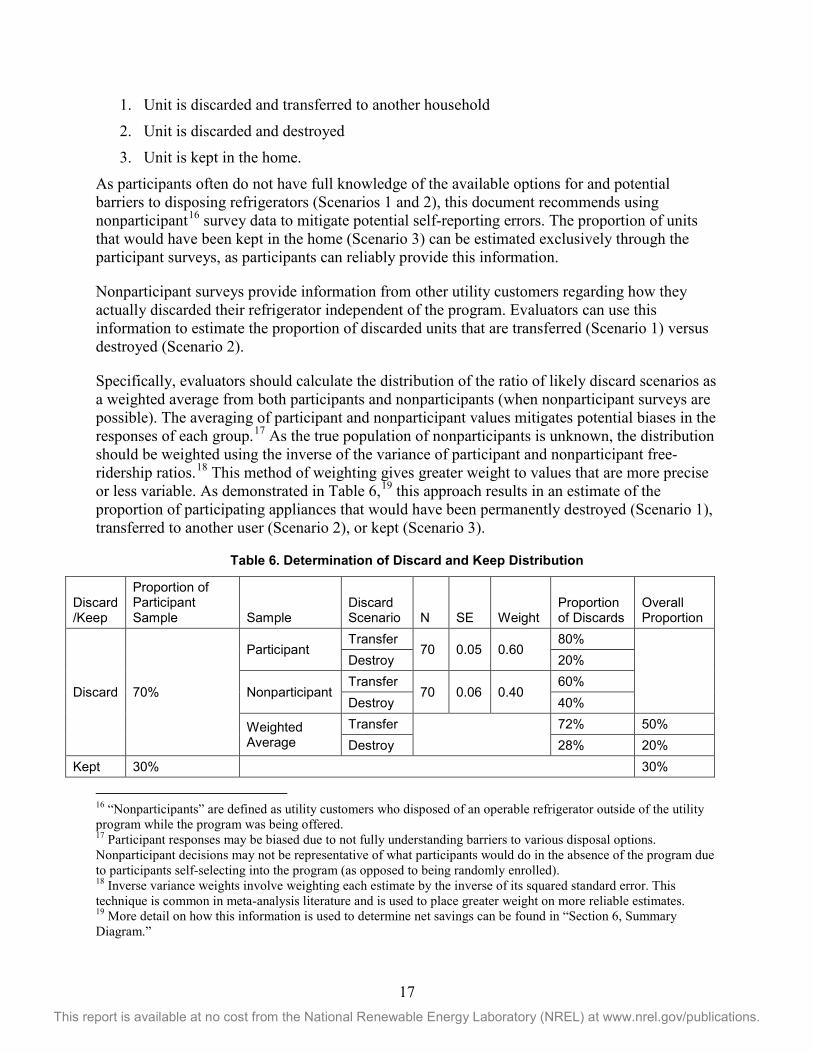
Specifically, evaluators should calculate the distribution of the ratio of likely discard scenarios as a weighted average from both participants and nonparticipants (when nonparticipant surveys are possible). The averaging of participant and nonparticipant values mitigates potential biases in the responses of each group.17 As the true population of nonparticipants is unknown, the distribution should be weighted using the inverse of the variance of participant and nonparticipant free-ridership ratios.18 This method of weighting gives greater weight to values that are more precise or less variable. As demonstrated in Table 6,19 this approach results in an estimate of the proportion of participating appliances that would have been permanently destroyed (Scenario 1), transferred to another user (Scenario 2), or kept (Scenario 3).
Table 6. Determination of Discard and Keep Distribution
Discard/Keep
Proportion of Participant Sample Sample
Discard Scenario N SE Weight
Proportion of Discards
Overall Proportion
Discard 70%
Participant Transfer
70 0.05 0.60 80%
Destroy 20%
Nonparticipant Transfer
70 0.06 0.40 60%
Destroy 40%
Weighted Average
Transfer
72% 50% Destroy 28% 20%
Kept 30%
30%
16 “Nonparticipants” are defined as utility customers who disposed of an operable refrigerator outside of the utility program while the program was being offered. 17 Participant responses may be biased due to not fully understanding barriers to various disposal options. Nonparticipant decisions may not be representative of what participants would do in the absence of the program due to participants self-selecting into the program (as opposed to being randomly enrolled). 18 Inverse variance weights involve weighting each estimate by the inverse of its squared standard error. This technique is common in meta-analysis literature and is used to place greater weight on more reliable estimates. 19 More detail on how this information is used to determine net savings can be found in “Section 6, Summary Diagram.”
18 This report is available at no cost from the National Renewable Energy Laboratory (NREL) at www.nrel.gov/publications.
Another option for informing free-ridership is to interview local used appliance dealers. These interviews can help determine the viability of selling used refrigerators of given ages or set of characteristics. This information can provide insight into the transferability of these units and supplement the self-reported actions of participants had they not participated in the recycling program.
5.1.1.1 Participant Self-Reported Actions To determine the percentage of participants in each of the three scenarios, evaluators should begin by asking surveyed participants about the likely fate of their recycled appliance had it not been decommissioned through the utility program. Responses provided by participants can be categorized as follows:
• Kept the refrigerator
• Sold the refrigerator to a private party (either an acquaintance or through a posted advertisement)
• Sold or gave the refrigerator to a used appliance dealer
• Gave the refrigerator to a private party, such as a friend or neighbor
• Gave the refrigerator to a charity organization, such as Goodwill Industries or a church
• Had the refrigerator removed by the dealer from whom the new or replacement refrigerator was obtained
• Hauled the refrigerator to a landfill or recycling center
• Hired someone else to haul the refrigerator away for junking, dumping, or recycling. To ensure the most reliable responses possible and to mitigate socially desirable response bias, evaluators should ask some respondents additional questions. For example, participants may say they would have sold their unit to a used appliance dealer. However, if the evaluation market research revealed that used appliance dealers were unlikely to purchase the older unit (due to its age or condition), then participants should be asked what they would have likely done had they been unable to sell the unit to a dealer. Evaluators should then use the response to this question in assessing free-ridership.
If market research reveals that local waste transfer stations charge a fee for dropping off refrigerators, inform participants about the fee if they initially specify this as their option and then ask them to confirm what they would have done in the absence of the program. Again, evaluators should use this response to assess free-ridership.
Use this iterative approach with great care. It is critical that evaluators find the appropriate balance between increasing the plausibility of participants’ stated actions (by offering context that might have impacted their decision) while not upsetting participants by appearing to invalidate their initial response.
Next, evaluators should assess whether each participant’s final response indicates free-ridership.
19 This report is available at no cost from the National Renewable Energy Laboratory (NREL) at www.nrel.gov/publications.
• Some final responses clearly indicate free-ridership, such as: “I would have taken it to the landfill or recycling center myself.”
• Other responses clearly indicate no free-ridership, such as when the refrigerator would have remained active within the participating home (“I would have kept it and continued to use it”) or used elsewhere within the utility’s service territory (“I would have given it to a family member, neighbor, or friend to use.”).
5.1.2 Secondary Market Impacts If it is determined that the participant would have directly or indirectly (through a market actor) transferred the unit to another customer on the grid, the next question addresses what that potential acquirer did when that unit was unavailable. There are three possibilities:
A. None of the would-be acquirers would find another unit. That is, program participation would result in a one-for-one reduction in the total number of refrigerators operating on the grid. In this case, the total energy consumption of avoided transfers (participating appliances that otherwise would have been used by another customer) should be credited as savings to the program. This position is consistent with the theory that participating appliances are essentially convenience goods for would-be acquirers. (That is, the potential acquirer would have accepted the refrigerator had it been readily available, but would not seek out an alternate unit because the refrigerator was not a necessity.)
B. All the would-be acquirers would find another unit. Thus, program participation has no effect on the total number of refrigerators operating on the grid. This position is consistent with the notion that participating appliances are necessities and that customers will always seek alternative units when participating appliances are unavailable.
C. Some of the would-be acquirers would find another unit, while others would not. This possibility reflects the awareness that some acquirers were in the market for a refrigerator and would acquire another unit, while others were not (and would only have taken the unit opportunistically).
It is difficult to answer this question with certainty, absent utility-specific information regarding the change in the total number of refrigerators (overall and used appliances specifically) that were active before and after program implementation. In some cases, evaluators have conducted in-depth market research to estimate both the program’s impact on the secondary market and the appropriate attribution of savings for this scenario. Although these studies are imperfect, they can provide utility-specific information related to a program’s net energy impact. Where feasible, evaluators and utilities should design and implement such an approach. Unfortunately, this type of research tends to be cost-prohibitive, or the necessary data may simply be unavailable.
Because the data to inform such a top-down market-based approach may be unavailable, evaluators have employed a bottom-up approach that centers on identifying and surveying recent acquirers of non-program used appliances and asking what they would have done had the specific used appliance they acquired not been available. While this approach results in quantitative data to support evaluation efforts, it is uncertain if:
• The used appliances these customers acquired are in fact comparable in age and condition to those recycled through the program
20 This report is available at no cost from the National Renewable Energy Laboratory (NREL) at www.nrel.gov/publications.
• These customers can reliably respond to the hypothetical question. Further, any sample composed entirely of customers who recently acquired a used appliance seems inherently likely to produce a result that aligns with the second possibility (B) presented above.
As a result of these difficulties and budget limitations, this protocol recommends the last possibility (C) when primary research cannot be undertaken. Specifically, evaluators should assume that half (0.5, the midpoint of possibilities A and B) of the would-be acquirers of avoided transfers found an alternate unit.
Once the proportion of would-be acquirers who are assumed to find an alternate unit has been determined, the next question is whether the alternate unit was likely to be another used appliance (similar to those recycled through the program) or, with fewer used appliances presumably available in the market due to program activity, would the customer acquire a new standard-efficiency unit instead.20 For the reasons previously discussed, it is difficult to estimate this distribution definitively. Thus, this protocol recommends a midpoint approach when primary research is unavailable: evaluators should assume that half (0.5) of the would-be acquirers of program units would find a similar, used appliance and half (0.5) would acquire a new, standard-efficiency unit.21
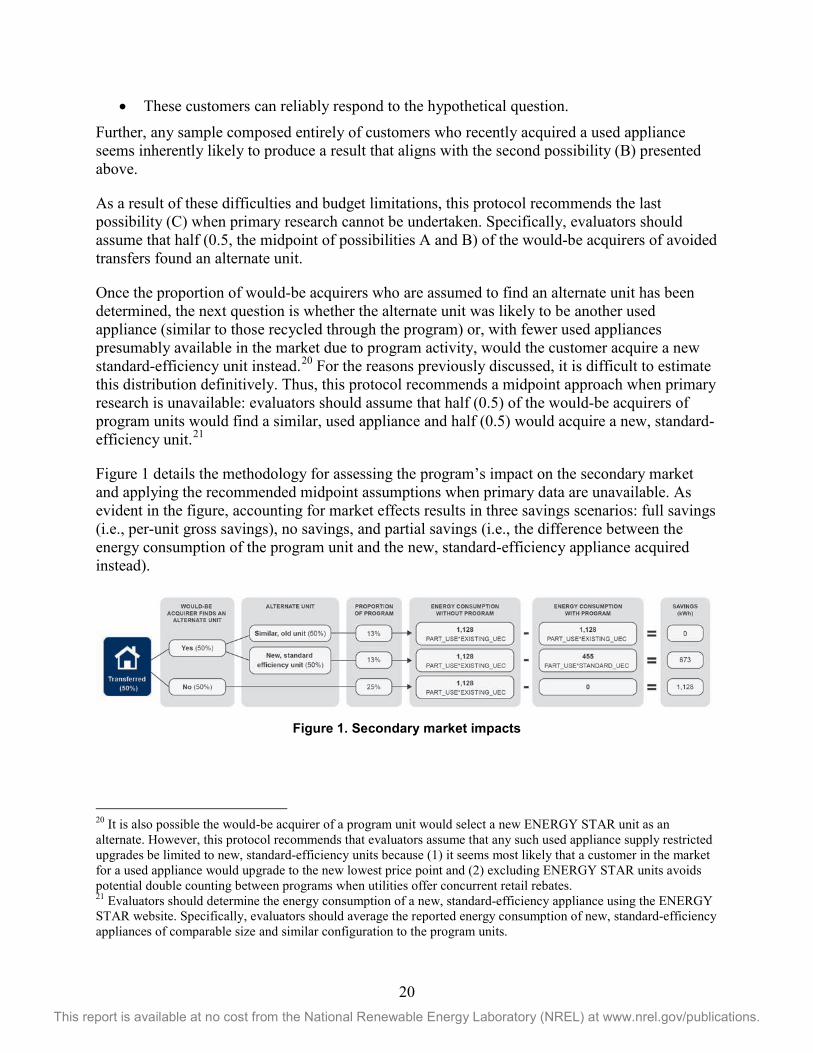
Figure 1 details the methodology for assessing the program’s impact on the secondary market and applying the recommended midpoint assumptions when primary data are unavailable. As evident in the figure, accounting for market effects results in three savings scenarios: full savings (i.e., per-unit gross savings), no savings, and partial savings (i.e., the difference between the energy consumption of the program unit and the new, standard-efficiency appliance acquired instead).
Figure 1. Secondary market impacts
20 It is also possible the would-be acquirer of a program unit would select a new ENERGY STAR unit as an alternate. However, this protocol recommends that evaluators assume that any such used appliance supply restricted upgrades be limited to new, standard-efficiency units because (1) it seems most likely that a customer in the market for a used appliance would upgrade to the new lowest price point and (2) excluding ENERGY STAR units avoids potential double counting between programs when utilities offer concurrent retail rebates. 21 Evaluators should determine the energy consumption of a new, standard-efficiency appliance using the ENERGY STAR website. Specifically, evaluators should average the reported energy consumption of new, standard-efficiency appliances of comparable size and similar configuration to the program units.
21 This report is available at no cost from the National Renewable Energy Laboratory (NREL) at www.nrel.gov/publications.
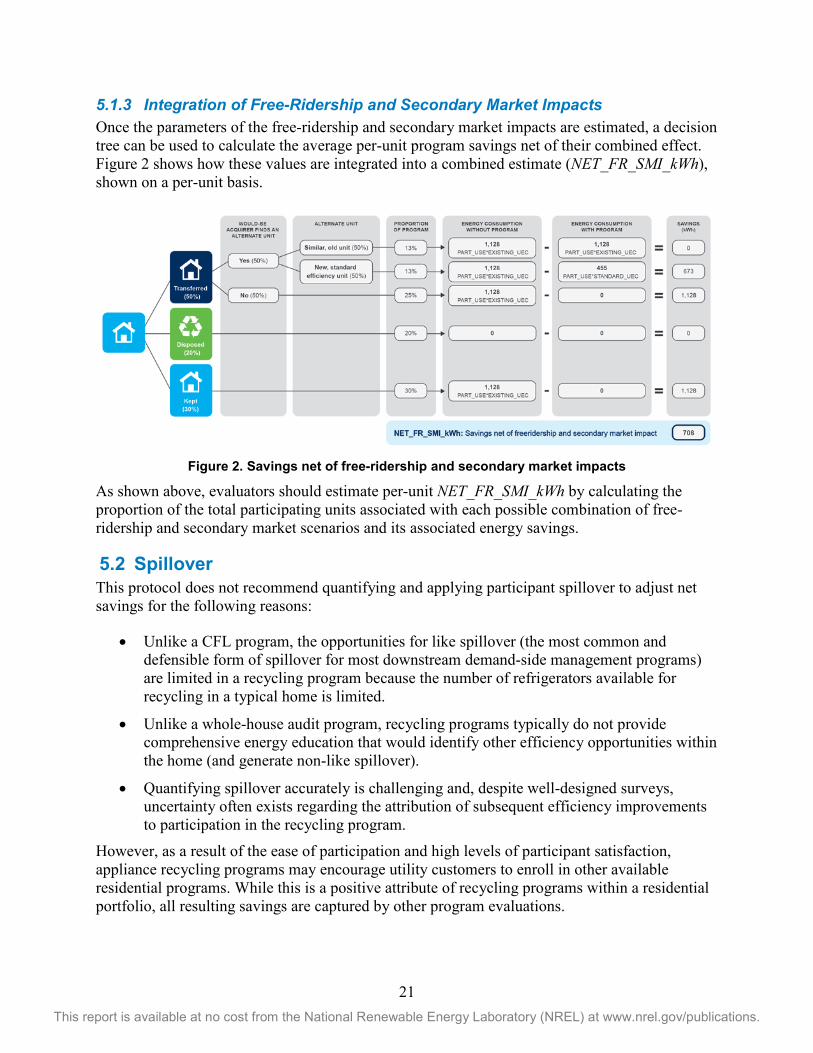
5.1.3 Integration of Free-Ridership and Secondary Market Impacts Once the parameters of the free-ridership and secondary market impacts are estimated, a decision tree can be used to calculate the average per-unit program savings net of their combined effect. Figure 2 shows how these values are integrated into a combined estimate (NET_FR_SMI_kWh), shown on a per-unit basis.
Figure 2. Savings net of free-ridership and secondary market impacts
As shown above, evaluators should estimate per-unit NET_FR_SMI_kWh by calculating the proportion of the total participating units associated with each possible combination of free-ridership and secondary market scenarios and its associated energy savings.
5.2 Spillover This protocol does not recommend quantifying and applying participant spillover to adjust net savings for the following reasons:
• Unlike a CFL program, the opportunities for like spillover (the most common and defensible form of spillover for most downstream demand-side management programs) are limited in a recycling program because the number of refrigerators available for recycling in a typical home is limited.
• Unlike a whole-house audit program, recycling programs typically do not provide comprehensive energy education that would identify other efficiency opportunities within the home (and generate non-like spillover).
• Quantifying spillover accurately is challenging and, despite well-designed surveys, uncertainty often exists regarding the attribution of subsequent efficiency improvements to participation in the recycling program.
However, as a result of the ease of participation and high levels of participant satisfaction, appliance recycling programs may encourage utility customers to enroll in other available residential programs. While this is a positive attribute of recycling programs within a residential portfolio, all resulting savings are captured by other program evaluations.
22 This report is available at no cost from the National Renewable Energy Laboratory (NREL) at www.nrel.gov/publications.
5.3 Data Sources After determining a program’s gross energy savings, the net savings are determined by applying a NTG adjustment using several data sources:22
• Participant Surveys. Surveys with a random sample of participants offer self-report estimates regarding whether participating refrigerators would have been kept or discarded independent of the program.23 When participants indicate that the recycled refrigerator would have been discarded, ask for further details as to their likely method of disposal in the absence of the program. For example, ask whether the appliance would have been given to a neighbor, taken to recycling center, or sold to a used appliance dealer.
• Nonparticipant Surveys. To mitigate potential response bias,24 this protocol recommends using nonparticipant surveys to obtain information for estimating NTG. Information about how nonparticipants actually discarded their operable refrigerators outside of the program can reveal and mitigate potential response bias from participants. (Participants may overstate the frequency with which they would have recycled their old-but-operable refrigerator because they respond with what they perceive as being socially acceptable answers.) Nonparticipants, however, can only provide information about how units were actually discarded.25 Because nonparticipant surveys require greater evaluation resources, it is acceptable to use smaller sample sizes.26,27
• Market Research. Some participant and nonparticipant responses require additional information for determining definitively whether the old-but-operable refrigerator would have been kept in use absent the program. Responses requiring follow-up include:
o “I would have sold it to a used appliance dealer”
o “I would have had the dealer who delivered my new refrigerator take the old refrigerator.”
To inform a more robust NTG analysis, conduct market research by interviewing senior management from new appliance dealers and used appliance dealers (both local chains and big-box retailers). Ask about the viability of recycled refrigerators being resold on the used market had they not been decommissioned through the program. For example, do market actors resell none, some, or all picked-up refrigerators? If only some are resold, what are characteristics (for example, age, condition, features) that determine when a refrigerator is for resale. Information gained through this research (which should be conducted before the participant surveys) can be used to assess the reasonableness of
22 When it is cost-prohibitive to survey nonparticipants and interview market actors, calculate free-ridership using participant surveys and secondary data from a comparable set of market actors. 23 As noted previously, the number of participant surveys should be sufficient to meet the required level of statistical significance. A minimum of 90% confidence with ±10% precision is suggested. 24 See UMP Chapter 11 for a broader discussion of sources of bias. 25 Information regarding the likelihood that the recycled refrigerator would have been retained independent of
program intervention can be obtained reliably through the participant surveys. 26 The cost of identifying nonparticipants can be minimized by adding the nonparticipant NTG module to concurrent participant surveys for evaluations of other utility programs within the portfolio. 27 For a general discussion of issues related to conducting surveys, see UMP Chapter 11.

23 This report is available at no cost from the National Renewable Energy Laboratory (NREL) at www.nrel.gov/publications.
participants’ self-reported hypothetical actions independent of the program. This information can also be used to prompt participants to offer alternative hypothetical actions.28
28 More detail is provided in the Section 5.1.1, “Free-Ridership.”
24 This report is available at no cost from the National Renewable Energy Laboratory (NREL) at www.nrel.gov/publications.
6 Other Evaluation Issues 6.1 Remaining Useful Life It is difficult to determine the number of years that a recycled refrigerator would have continued to operate absent the program and, therefore, the longevity of the savings generated by recycling old-but-operable refrigerators through the program. Participant self-reports are speculative and cannot account for unexpected appliance failure. Also, the standard evaluation measurements of remaining useful life (RUL) are not applicable, as most participating refrigerators are already past their effective useful life (EUL) estimates.
More primary research is needed on this topic to identify a best practice. In the interim and in lieu of a formal recommendation, this protocol offers two examples of estimation methods.
• RUL can be estimated as a function of a utility’s new refrigerator EUL, using the following formula:29 RUL = EUL/3
• RUL can be estimated using survival analysis (when appropriate data are available).30
6.2 Freezers Although this protocol is focused on refrigerators, most utility appliance recycling programs also decommission stand-alone freezers. While differences exist between the evaluation approach for each appliance type (for example, all stand-alone freezers are secondary units, while refrigerators may be primary or secondary units), this protocol can also be used to evaluate the savings for freezers.
6.3 Customer Satisfaction As recycling program mature, they experience a decrease in per-unit savings over time as the stock of available refrigerators to be recycled by the program were manufactured more recently and are therefore more efficient. The average age of appliances recycled tends to decline over time and fewer participating appliances were manufactured prior to the introduction of national appliance efficiency standards. This often leads to recycling programs being only marginally cost-effective.
While cost-effectiveness is an important criterion for considering whether to continue to offer a program, there are specific benefits generated by recycling programs beyond cost-effectiveness that are worth consideration.
Recycling programs tend to have very high levels of customer satisfaction. Evaluations have consistently found that well over 90% of customers are very satisfied with their experience. This gives utilities an opportunity to leave a positive impression with customers.
29 This formula was obtained from the Database for Energy Efficient Resources (http://www.energy.ca.gov/deer/). 30 In an evaluation of the NV Energy appliance recycling program, ADM Associates used survival analysis using secondary data from the 2009 California RASS. This involved estimating hazard rates for refrigerators based on the observed destruction of appliances at various ages. Once the hazard rate function was estimated, a table of expected RULs at each age was calculated. Where feasible, this approach should be followed using data specific to the given utility service area.

25 This report is available at no cost from the National Renewable Energy Laboratory (NREL) at www.nrel.gov/publications.
Additionally, recycling programs reach large numbers of customers who may be harder to reach via more traditional residential program offerings. Participants’ positive experience with the recycling program provides an opportunity for the utility to educate them about energy efficiency and cross-promote other program offerings, which in turn can increase participation in other efficiency programs.
26 This report is available at no cost from the National Renewable Energy Laboratory (NREL) at www.nrel.gov/publications.
7 Looking Forward As mentioned in Section 0, the metering data used to develop the regression models in this protocol are aging and, over time, will be increasingly less representative of the appliances recycled through programs. Though several recycling programs have recently been relaunched because of the customer service benefits, energy savings and cost-effectiveness, will ultimately determine the continued deployment of recycling programs. As a result, it is important that future evaluations include metering.
Few metering studies have been conducted since this protocol was first published in April 2013, so there were no new metering data available to update this protocol’s regression models. Future metering studies will provide valuable insight into how rapidly per-unit energy savings are declining and, consequently, how long recycling programs can remain viable.
Although it may not be cost-effective to conduct a metering study solely for an appliance recycling program, evaluators can leverage other in-home metering efforts—such as those primarily designed to inform end-use disaggregation; residential heating, ventilating, and air conditioning; or lighting loggers—to collect refrigerator or freezer meter data. This approach may not yield a sufficient sample size for a primary metering study with one effort. However, if the data are collected in accordance with the guidance in Section 4.3.1, collective efforts among evaluators could yield robust samples that are sufficient to update the models included in this protocol.
27 This report is available at no cost from the National Renewable Energy Laboratory (NREL) at www.nrel.gov/publications.
8 Resources 10 CFR 430.23(A1). (2008). www.gpo.gov/fdsys/pkg/CFR-2011-title10-vol3/pdf/CFR-2011-title10-vol3-part430-subpartB-appA.pdf
ADM Associates, Inc. (April 2008). Athens Research, Hiner & Partners and Innovologie LLC. Evaluation Study of the 2004-05 Statewide Residential Appliance Recycling Program. www.calmac.org/publications/EM&V_Study_for_2004-2005_Statewide_RARP_-_Final_Report.pdf
ADM Associates, Inc. (June 2011). 2010 Second Refrigerator Recycling Program; NV Energy – Southern Nevada; Program Year 2010. https://nwcouncil.app.box.com/s/uljdixyot1i9vcbl44r0ll0xt0xt8w19
Cadmus Group, Inc. (February 8, 2010). Residential Retrofit High Impact Measure Evaluation Report. www.calmac.org/publications/FinalResidentialRetroEvaluationReport_11.pdf.
Kema, Inc. (October 24, 2014). Appliance Recycling Program Impact Evaluation – Volume 1: Report, Work Order 35. http://www.calmac.org/publications/2010-2012_ARP_Impact_Evaluation_Final_Report.pdf
Khawaja, M. Sami; Rushton, J.; Keeling, J. (2017). Chapter 11: Sample Design Cross-Cutting Protocol. The Uniform Methods Project: Methods for Determining Energy-Efficiency Savings for Specific Measures. Golden, CO; National Renewable Energy Laboratory. NREL/SR-7A40-68567. http://www.nrel.gov/docs/fy17osti/68567.pdf
Navigant Consulting. (December 21, 2010). Energy Efficiency/Demand Response Plan: Plan Year 2 (6/1/2009-5/31/2010) Evaluation Report: Residential Appliance Recycling. https://www.epa.gov/sites/production/files/2013-12/documents/cee_eval_comedappliancerecyclingpy2evaluationreport2010.pdf