Embed Size (px)
Citation preview
Chapter 8: Confidence Intervals
8.1 Confidence Interval for a Mean, Standard Deviation Known
Introduction
Assume we have a sample from a previous class, with sample size 36, where the mean age of
students in the class was 23.1 years old. Using this sample, can we make a statement about the
population mean of all Cabrillo College students? Assume in this situation that the population
standard deviation of the age of all Cabrillo students is known to be 4.5 years.
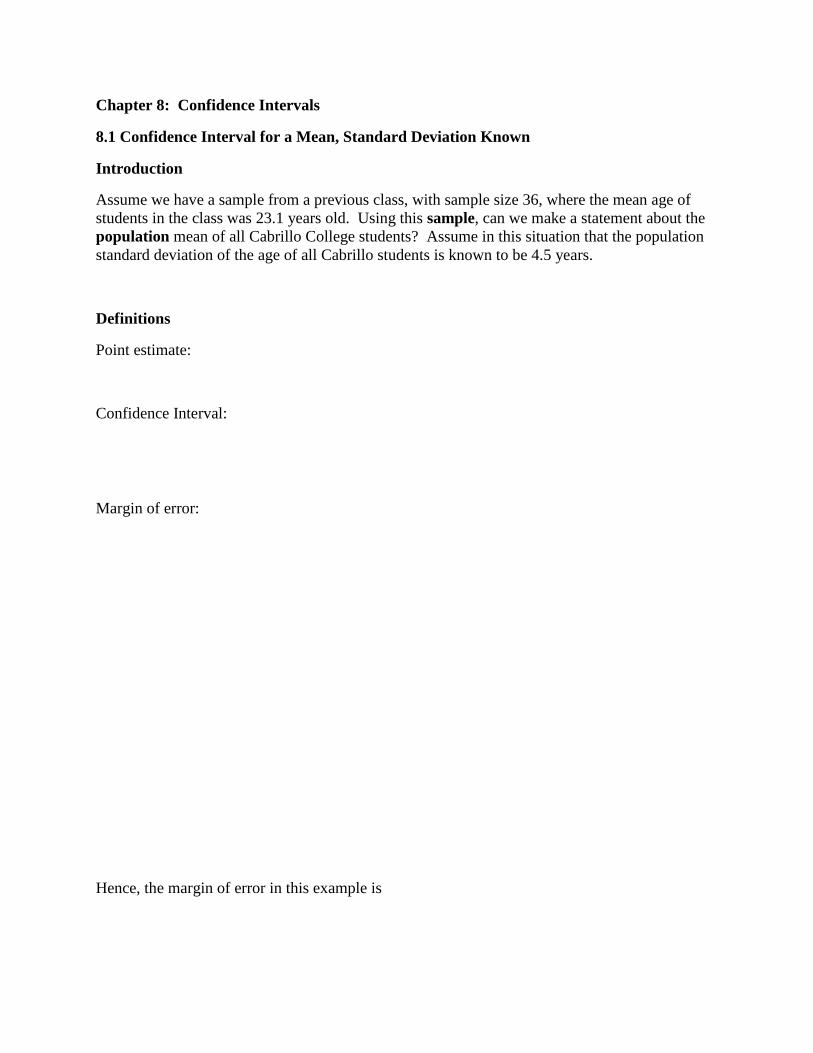
Definitions
Point estimate:
Confidence Interval:
Margin of error:
Hence, the margin of error in this example is
Margin of error =
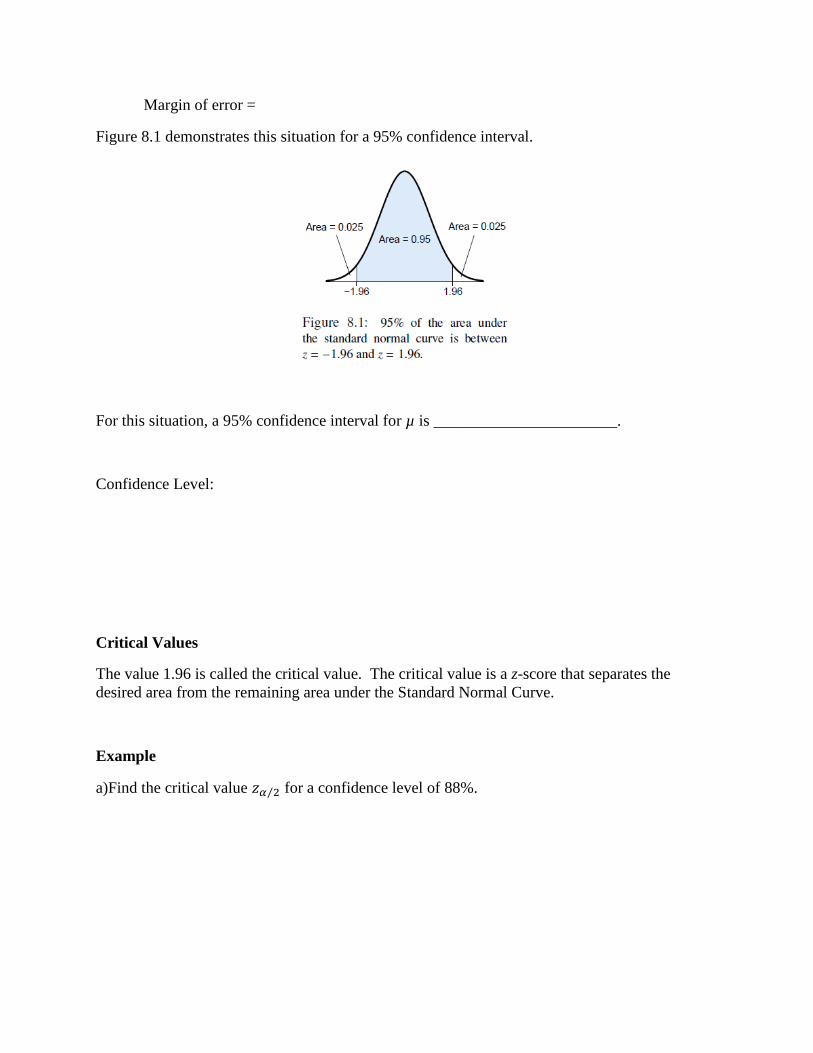
Figure 8.1 demonstrates this situation for a 95% confidence interval.
For this situation, a 95% confidence interval for µ is _______________________.
Confidence Level:
Critical Values
The value 1.96 is called the critical value. The critical value is a z-score that separates the
desired area from the remaining area under the Standard Normal Curve.
Example
a)Find the critical value 𝑧𝛼 2⁄ for a confidence level of 88%.
b)Assume we have a sample of size 43, a sample mean of 44.5, and the population standard
deviation is known to be 1.3. Construct an 88% confidence interval in this situation.
Example
Find the confidence level associated with a critical value of 1.04.
Assumptions
The method we have described for constructing a confidence interval requires the following
assumptions.
1.
2.
Procedure for Constructing a Confidence Interval for µ When σ is Known
Check to be sure the assumptions are satisfied. If they are, then proceed with the following
steps.
Step 1:
Step 2:
Step 3:
Step 4:
Step 5:
OR USE A CALCULATOR…
Rounding off the final result
If you are given the value of �̅�, round the final result of the confidence interval to the same
number of decimal places as �̅�. If you are given data, then round �̅� and the final result of the
confidence interval to one more decimal place than is given in the data. Do not round off the
calculations you make along the way for this may affect the accuracy of your final answer.
Note that 95% is the most common confidence level - if a question at any point asks you to
construct a confidence interval and DOES NOT give you a confidence level, assume 95%
confidence is desired.
Example
Find a 95% confidence interval for the starting salary of college graduates who have taken a
statistics class, given a simple random sample of 28 such college graduates who have a mean
salary of $45,678 and the population standard deviation is known to be $9900. Assume this
population is normally distributed.
Solution
We check the assumptions. We find that
More confidence means a bigger margin of error
Example
In a sample of 150 households, the sample mean number of personal computers was 1.32.
Assume the population standard deviation is 0.41 . Construct a confidence interval for the
mean number of personal computers per household at the
a)90% confidence level
b)98% confidence level
We check the assumptions. We find that we have a problem…
Let’s make the proper assumption…(so just assume for now that we are good to go)
Example
The volume of beverage in 6 12oz bottles was measured. The volumes found were:
12.3 12.3 12.2 12.4 12.2 12.5
Assume that the volumes of beverage in 12 oz bottles is normally distributed with a population
standard deviation of 0.35 oz. Construct a 97% confidence interval for the mean volume of
beverage in 12 oz. bottles. What does this suggest about 12 oz. bottles?
Solution
The confidence level measures the success rate of the method used to construct the interval
We cannot be sure whether we got one of the confidence intervals that covers µ, or whether we
were unlucky enough to get one of the unsuccessful ones. What we do know is that our
confidence interval was constructed by a method that succeeds 95% (or whatever the confidence
level is) of the time. The confidence level describes the success rate of the method used to
construct a confidence interval, not the success of any particular interval. See picture page 349.
More Confidence Interval Fun:
Example
Suppose you are told that a 95% confidence interval estimate for the mean weight of a peanut is
(0.35,0.47).
a)What is the point estimate for the mean weight of a peanut?
b)What is the margin of error for this confidence interval?
c)Could (0.30,0.52) be a 90% confidence interval or a 99% confidence interval for the mean
weight of a peanut?
d)If the Planters company makes the claim that the mean weight of their peanuts is 0.46 grams,
would that be a problem? What if they claim that the mean weight of their peanuts is 0.50
grams?
Finding the Necessary Sample Size
We have seen that we can make the margin of error smaller if we reduce _________________.
We can also reduce the margin of error by increasing the _________________. The formula for
the margin of error is
m =
We can manipulate the formula using algebra to express the sample size n in terms of the margin
of error m.
With this formula, if we know how small we want the margin of error to be, we can compute the
sample size needed to achieve the desired margin of error.
If the value of n given by the formula is not a whole number, then round it up to the
nearest whole number.
Example
Find the sample size necessary to estimate the mean number of minutes per day college students
watch TV to within 15 minutes with 96% confidence. Assume that the population standard
deviation is known to be 112.2 minutes.
Solution
𝑧𝛼 2⁄ =
σ =
m =
SO n =
We must sample______________college students to obtain a 96% confidence interval with a
margin of error of 15 minutes.
Factors that limit sample size
Since larger sample size result in narrower confidence intervals, it is natural to wonder why we
don’t always collect a large sample when we want to construct a confidence interval. Can you
think of some reason why large samples are not always feasible in practice?
Distinguish Between Confidence and Probability
Example
A survey organization drew a simple random sample of 625 households from a city of 100,000
households. The sample mean number of people per household was 2.30, and a 95% confidence
interval for the mean number of people in the city was (2.16,2.44). True or false:
a)We are 95% confident that the mean number of people in the 625 households is between 2.16
and 2.44.
b)We are 95% confident that the mean number of people per household in the city is between
2.16 and 2.44.
c)The probability is 0.95 that the mean number of people per household in the city is between
2.16 and 2.44.
d)95% of the households in the sample contain between 2.16 and 2.44 people.
Do You Know
How to construct and interpret confidence intervals for a population mean when the
population standard deviation is known?
How to find critical values for confidence intervals?
How to describe the relationship between the confidence level and the margin of error?
How to find the sample size necessary to obtain a confidence interval of a given width?
The difference between confidence and probability?
8.2 Confidence Interval for Mean, Standard Deviation Unknown
Introduction
In Section 8.1, we showed how to construct a confidence interval for the mean µ of a normal
population when the population standard deviation σ is known. The critical value is __________
because the quantity
�̅� − 𝜇
𝜎 √𝑛⁄
has a normal distribution.
In practice, it is more common that σ is unknown. When we don’t know the value of σ, we
replace it with the sample standard deviation s. However, we cannot then use 𝑧𝛼 2⁄ as the critical
value, because the quantity
�̅� − 𝜇
𝑠 √𝑛⁄
does not have a normal distribution. The distribution of this quantity is called the
degrees of freedom:
Number of degrees of freedom =
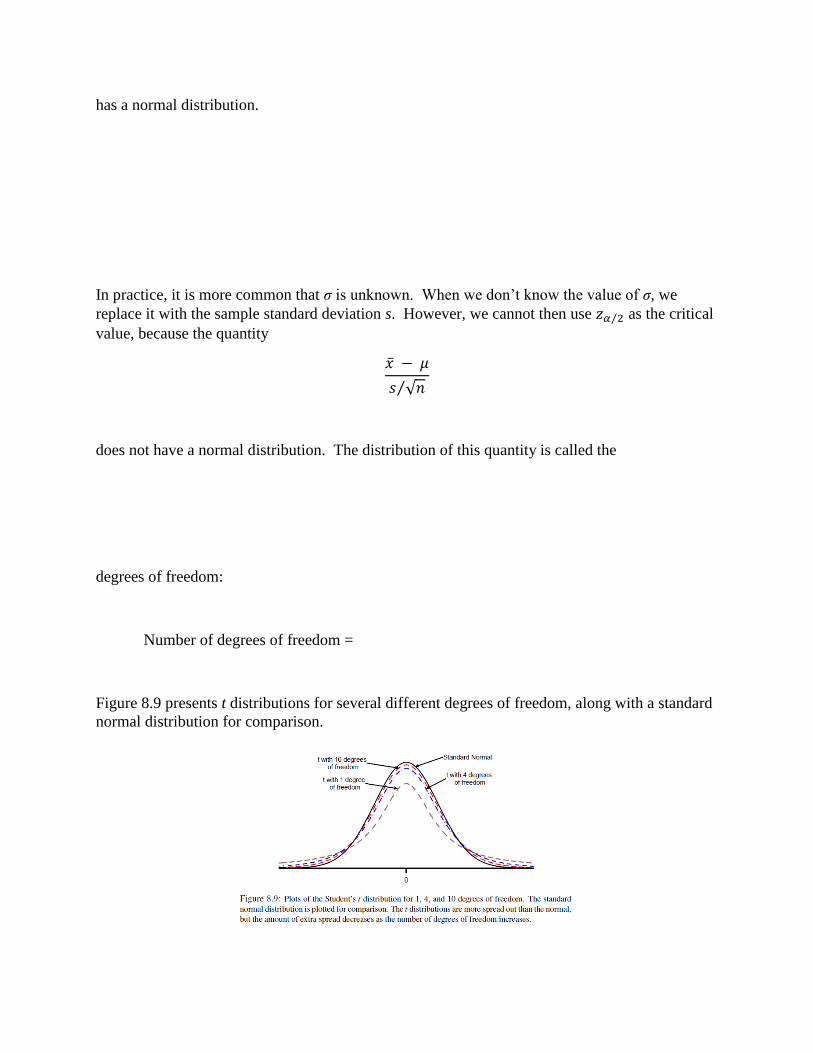
Figure 8.9 presents t distributions for several different degrees of freedom, along with a standard
normal distribution for comparison.
Summary
The Student’s t distribution has the following properties:
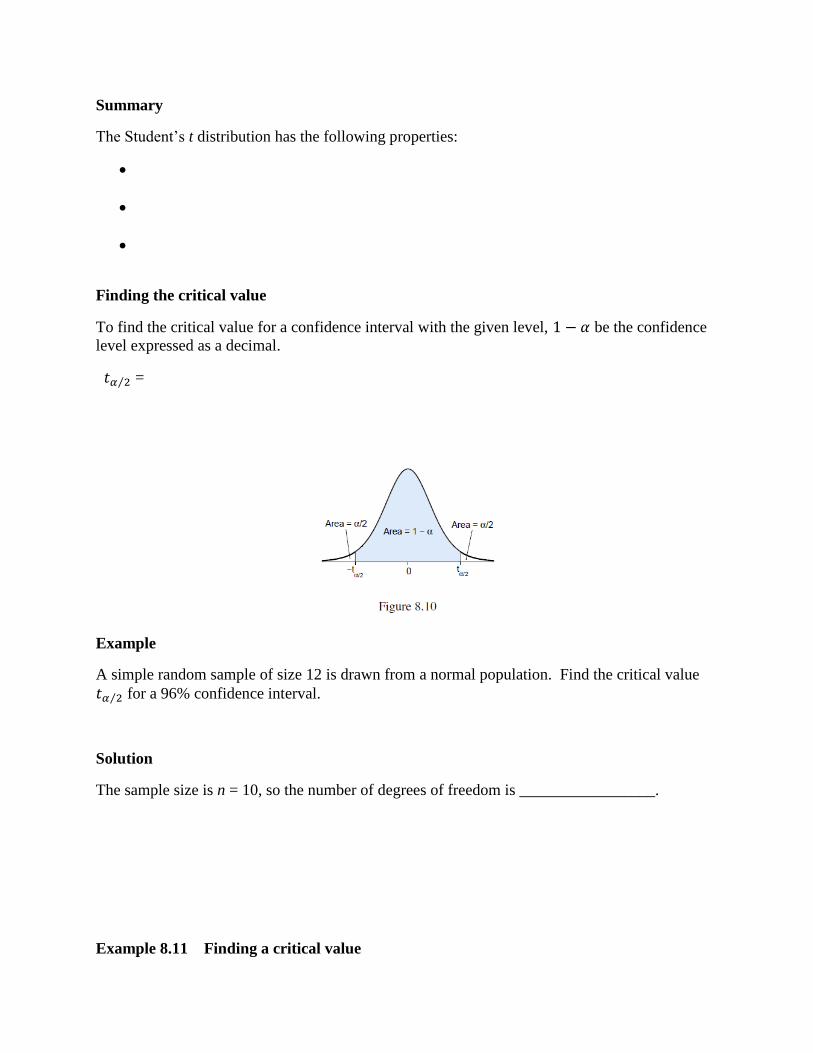
Finding the critical value
To find the critical value for a confidence interval with the given level, 1 − 𝛼 be the confidence
level expressed as a decimal.
𝑡𝛼 2⁄ =
Example
A simple random sample of size 12 is drawn from a normal population. Find the critical value
𝑡𝛼 2⁄ for a 96% confidence interval.
Solution
The sample size is n = 10, so the number of degrees of freedom is _________________.
Example 8.11 Finding a critical value
Find the critical value for a 99% confidence interval for a sample of size 58.
Solution
Assumptions for Constructing a Confidence Interval for µ When σ Is Unknown
1.
2.
When the sample size is small (n ≤ 30), we must check to determine whether the sample comes
from a population that is approximately normal. A simple method is to draw a dotplot or boxplot
of the sample. If there are no outliers, and if the sample is not strongly skewed, then it is
reasonable to construct a confidence interval using the t statistic.
Constructing a Confidence Interval for µ
The ingredients for a confidence interval for a population mean µ when σ is unknown are
The margin of error is ____________________.
When the assumptions for the Student’s t distribution are met, we can use the following
procedure for constructing a confidence interval for a population mean.
Step 1:
Step 2:
Step 3:
Step 4:
Step 5:
OR USE A CALCULATOR
Example
Construct a 99% confidence interval for elbow to fingertip length of men, given a simple random
sample of size 32, with sample mean 14.50 inches, sample standard deviation 0.70 inches,
a)by Steps 1-5 above
b)by calculator
Solution
We check the assumptions. We have
Step 1:
Step 2:
Step 3:
Step 4:
Step 5:
Example
The EPA air quality standard for lead is 1.5 microgram per cubic meter. On 6 different days
following 9/11/01, measured amounts of lead in the air around New York City were:
5.40 1.10 0.42 0.73 0.48 1.10
Construct a 95% confidence interval for the mean amount of lead in the air. Let’s just do this
blindly, and then talk about the problems with this question.
Example
Would you use a z or t-distribution, or neither, to construct a confidence interval for the mean in
the following situations?
a)95% confidence level, population appears normal, s = 32.5
b)98% confidence level, n = 45, population is skewed, 3.2
c)90% confidence level, n = 9, 4.5 , population skewed
Note: use the same formula as in the last section to do sample size determination, but replace
population standard deviation with sample standard deviation.
Do You Know
The properties of the Student’s t distribution?
How to construct confidence intervals for a population mean when the population
standard deviation is unknown?
8.3 Confidence Interval for a Proportion
Introduction
Example
Suppose we take a simple random sample of 80 Cabrillo students and find that 60% of those
sampled think the cafeteria should remain open for breakfast after 10am. Could we use this
information to find a confidence interval to estimate the population proportion of students who
want the cafeteria to remain open?
This is an example of a population whose items fall into two categories.
1.
2.
We are interested in the population proportion of those who believe the cafeteria should remain
open.
Notation
______________ is the population proportion of individuals who are in a specified
category.
______________ is the number of individuals in the sample who are in the specified
category.
______________ is the sample size.
______________ is the sample proportion of individuals who are in the specified
category. It is equal to ______________.
To construct a confidence interval, we need:
The point estimate for the population proportion is
The margin of error is
The confidence interval is
Assumptions for Constructing a Confidence Interval for p
1.
2.
3.
4.
Procedure for Constructing a Confidence Interval for p
Check to be sure the assumptions are satisfied. If they are then proceed with the following steps.
Step 1:
Step 2:
Step 3:
Step 4:
Step 5:
OR AS ALWAYS, USE A CALCULATOR…
When constructing confidence intervals for a proportion, we will round the final result to
three decimal places. Only round the final result and not the calculations along the way.
Example
Suppose we take a simple random sample of 80 Cabrillo students and find that 60% of those
sampled think the cafeteria should remain open for breakfast after 10am
(a) Construct a 90% confidence interval for the proportion of Cabrillo students who think the
cafeteria should remain open for breakfast after 10am.
(b)Taher Foods claims that less than 50% of Cabrillo students think the cafeteria should remain
open past 10am for breakfast. Does the confidence interval contradict this claim?
Solution
(a) We check the assumptions. We have
Step 1:
Step 2:
Step 3:
Step 4:
Step 5:
OR BY CALCULATOR
(b)
Example
In a Gallup poll, a simple random sample of 491 adults were asked whether they are in favor of
the death penalty for a person convicted of murder and 319 said yes.
a)Find a95% confidence interval for the proportion of adults in favor of the death penalty in this
situation.
b)What is the point estimate for this proportion?
c)What is the margin of error in this confidence interval?
d)Can we conclude that the majority of adults are in favor of the death penalty in this situation?
Finding the Necessary Sample Size
If we wish to make the margin of error of a confidence interval smaller while keeping the
confidence level the same, we can do this by making the ______________ larger. Sometimes
we have a specific value m that we would like the margin of error to attain, and we wish to
compute a sample size n that is likely to give us a margin of error of that size.
Recall the formula of the margin of error:
Manipulating this formula algebraically, we can solve for n:
Therefore, sample size n depends on
We don’t know ahead of time what �̂� is going to be. There are two ways to determine the value
of �̂�.
1.
2.
Summary
Let m be the desired margin of error, and let be the critical value. The sample size n needed so
that a confidence interval for a proportion will have margin of error approximately equal to m is
n = if a value for �̂� is available
n = if no value of �̂� is available
If the value of n is not a whole number, round it up to the nearest whole number.
Note:The margin of error does not depend on the population size, only on sample size. So
we could find the margin of error for a proportion about Cabrillo students or about
California residents with the same sample size.
Example
Determine the sample size needed to estimate the population proportion with a margin of error of
0.038, a 95% confidence level, where no previous studies have been performed.
Solution
Example
60 Minutes recently had a share of 20, meaning 20% of TV’s in use at the time it aired were
turned to 60 Minutes.
a)Based on a sample size of 4000 randomly selected TV’s, construct a 97% confidence interval
estimate for the proportion of all TV sets turned to 60 Minutes when it aired.
b)What sample size would be required to estimate the percentage of TV’s tuned to 60 Minutes if
we wanted 99% confidence and a margin of error of 0.5%? (Here, we can assume that a sample
proportion is 20%, since that is the information given to us in the question).
c)At the same time 60 Minutes aired, “Exposed: Pro Wrestling” was on another network. It got a
share of 11. Can we conclude 60 Minutes had a greater proportion of viewers?
Do You Know
How to construct a confidence interval for a population proportion?
How to find the sample size necessary to obtain a confidence interval for a population
proportion of a given width?
How to construct confidence intervals with small samples?
8.4 Confidence Interval for a Standard Deviation
Introduction
When the population is normal, it is possible to construct confidence intervals for the standard
deviation or variance. These confidence intervals are based on a distribution known as the
________________________ distribution, denoted ____________________.
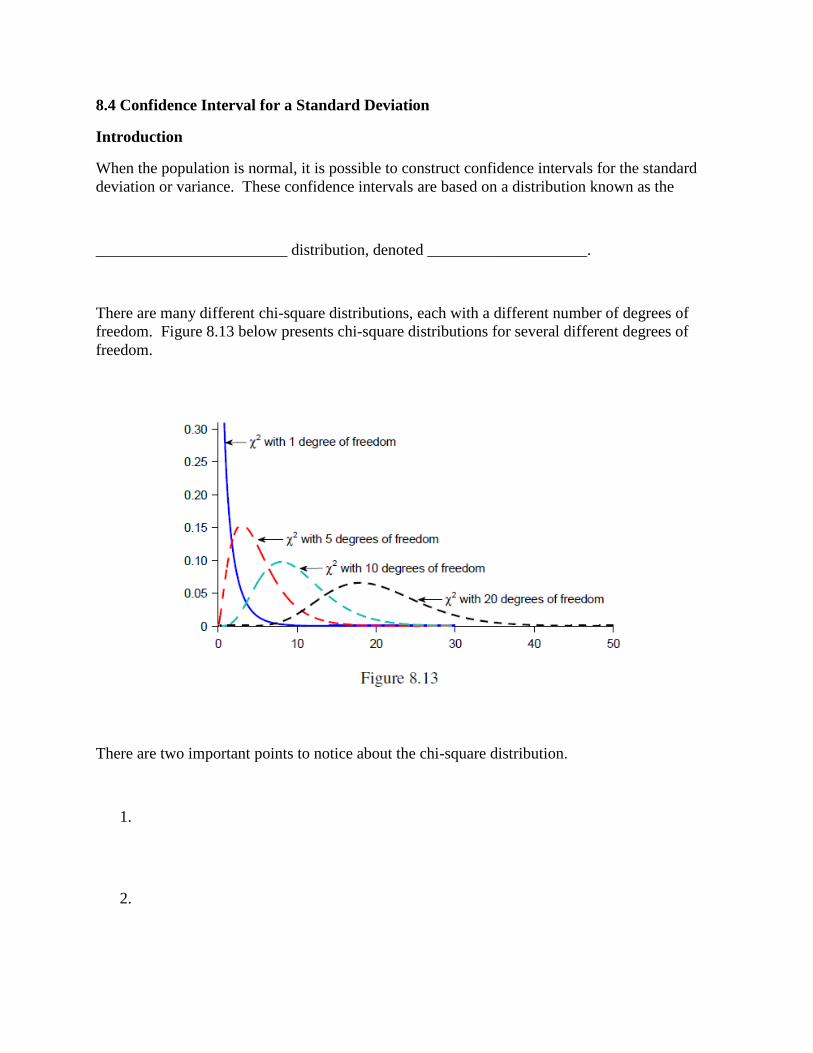
There are many different chi-square distributions, each with a different number of degrees of
freedom. Figure 8.13 below presents chi-square distributions for several different degrees of
freedom.
There are two important points to notice about the chi-square distribution.
1.
2.
A confidence interval for a standard deviations and variances consists of only a couple of things
which is different than confidence intervals for means and proportions.
1.
2.
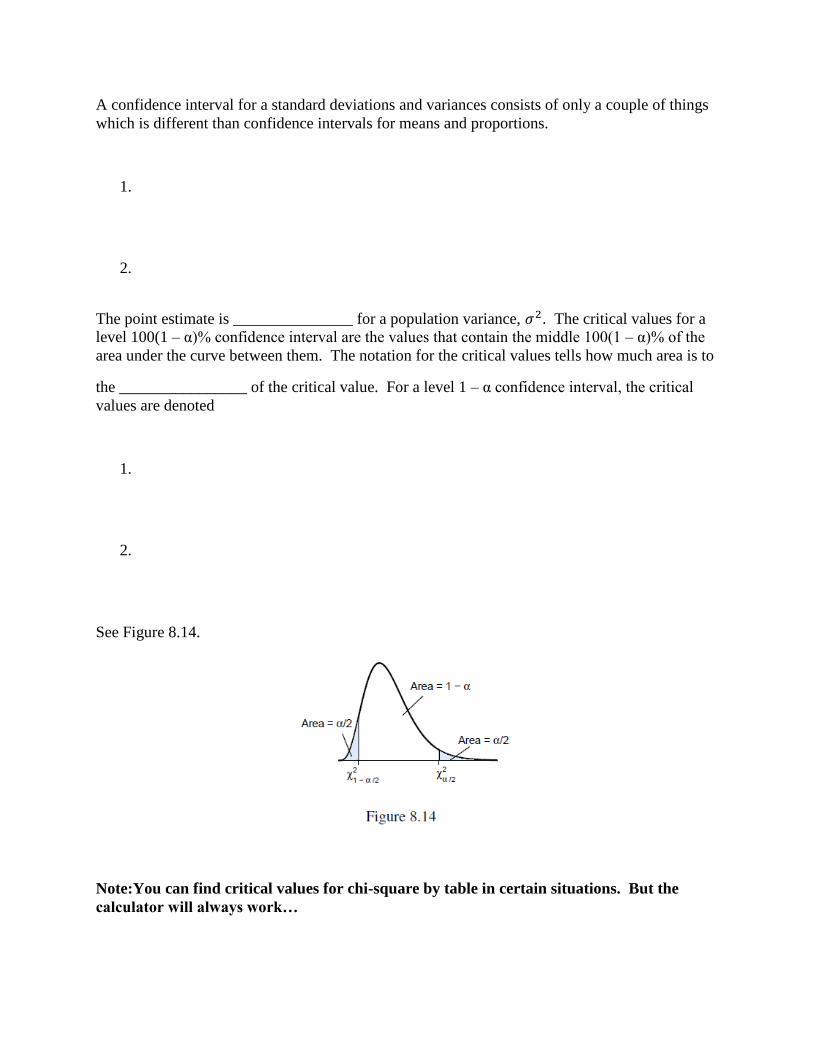
The point estimate is _______________ for a population variance, 𝜎2. The critical values for a
level 100(1 – α)% confidence interval are the values that contain the middle 100(1 – α)% of the
area under the curve between them. The notation for the critical values tells how much area is to
the ________________ of the critical value. For a level 1 – α confidence interval, the critical
values are denoted
1.
2.
See Figure 8.14.
Note:You can find critical values for chi-square by table in certain situations. But the
calculator will always work…
Example
Find the critical values of 2 :
a)that contain an area of 0.05 in each tail, if n = 10
b)for a 98% confidence interval with n = 53
.
Confidence Intervals for the Variance and Standard Deviation
Let 𝑠2 be the sample variance from a simple random sample of size n from a normal population.
A level 100(1 – α)% confidence interval for the population variance 𝜎2 is
A level 100(1 – α)% confidence interval for the population standard deviation σ is
The critical values are taken from a chi-square distribution with ____________ degrees of
freedom.
Procedure for Constructing Confidence Intervals for the Variance and Standard Deviation
of a Normal Distribution
Note: You can only do this with a population that is normally distributed. n > 30 is not good
enough with 2 .
Step 1:
Step 2:
Step 3:
Step 4:
NOTE: There is no calculator shortcut for this. You can find the necessary values on your
calculator, but there is no one-step calculator program for this confidence interval as there was in
the previous 3 sections.
Example
The starting salaries of college graduates who have taken statistics are normally distributed. A
sample of 51 such graduates has a mean salary of $45,678 and a sample standard deviation of
$9900. Construct a 95% confidence interval for the population standard deviation σ.
Solution
Step 1:
Step 2:
Step 3:
Step 4:
Example
A package of 12 doughnuts is advertised to weigh 42 ounces. A quality control supervisor at the
doughnut company knows that he is in “good shape” if the doughnuts he is producing have a
mean weight of 3.50 ounces and a standard deviation of 0.06 ounces or less (not too large to lose
profit, and not too small for customers to realize that their doughnuts are not as large as what
they paid for). Assume doughnuts have normally distributed weights.
12 doughnuts are randomly selected from the production line and are found to have the following
weights:
3.43 3.37 3.58 3.50 3.68 3.61 3.42 3.52 3.66 3.50 3.36 3.42
Construct a 95% confidence interval for the population standard deviation of the doughnuts that
are being produced.
Do You Know
How to find critical values of the chi-square distribution?
How to construct confidence intervals for the variance and standard deviation of a normal
distribution?