Embed Size (px)
Citation preview

1 | Massachusetts State Health Assessment
CHAPTER 8 Wellness and Chronic Disease

Wellness and Chronic DiseaseThis chapter provides information on wellness and chronic disease in Massachusetts, related trends,
disparities, and resources. It includes the following topics:
Nutrition Physical Activity Tobacco Use and Exposure Smoking Cessation Obesity Cardiovascular Disease Diabetes Chronic Lower Respiratory Disease Cancer Selected Resources, Programs, and Services
2 | Massachusetts State Health Assessment
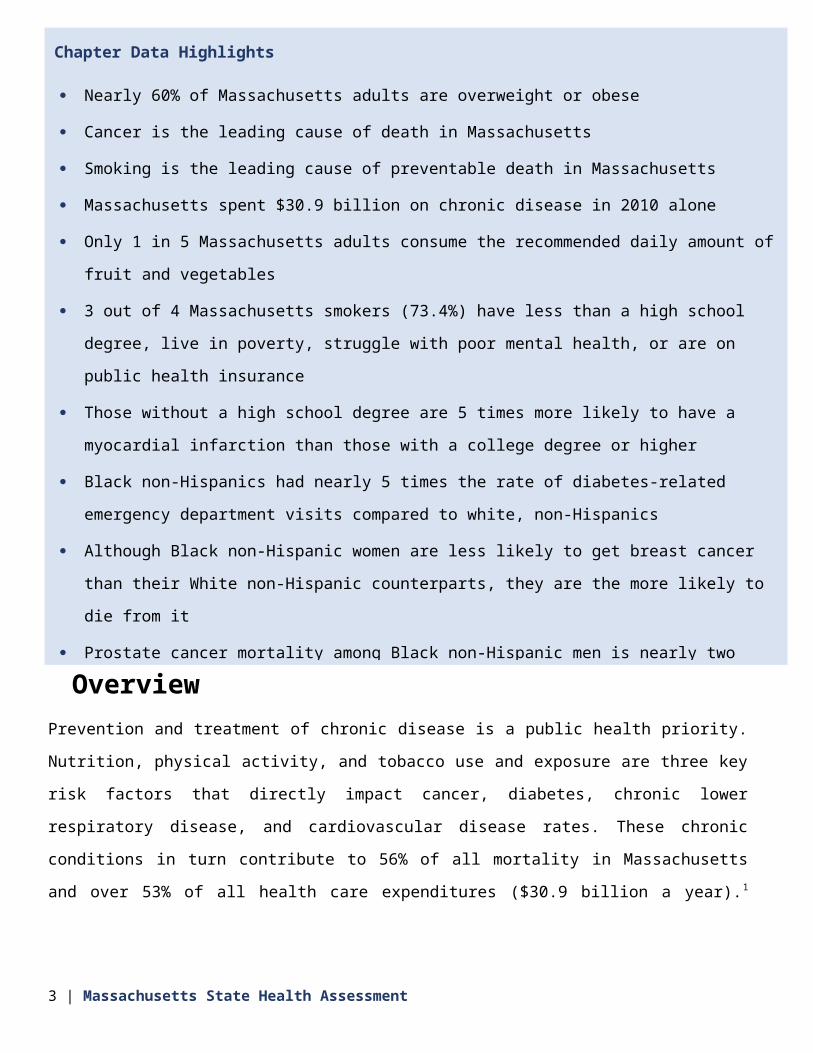
OverviewPrevention and treatment of chronic disease is a public health priority. Nutrition, physical activity, and
tobacco use and exposure are three key risk factors that directly impact cancer, diabetes, chronic lower
respiratory disease, and cardiovascular disease rates. These chronic conditions in turn contribute to 56% of
all mortality in Massachusetts and over 53% of all health care expenditures ($30.9 billion a year). 1 This
chapter provides an overview of the burden and distribution of chronic diseases and their risk factors across
the Commonwealth.
Although the three leading risk factors are modifiable, the conditions in which people live, learn, work, and
play do not offer equal access or opportunity to make this possible. For example, a history of policies rooted
3 | Massachusetts State Health Assessment
Chapter Data Highlights
Nearly 60% of Massachusetts adults are overweight or obese
Cancer is the leading cause of death in Massachusetts
Smoking is the leading cause of preventable death in Massachusetts
Massachusetts spent $30.9 billion on chronic disease in 2010 alone
Only 1 in 5 Massachusetts adults consume the recommended daily amount of fruit and vegetables
3 out of 4 Massachusetts smokers (73.4%) have less than a high school degree, live in poverty, struggle
with poor mental health, or are on public health insurance
Those without a high school degree are 5 times more likely to have a myocardial infarction than those with
a college degree or higher
Black non-Hispanics had nearly 5 times the rate of diabetes-related emergency department visits
compared to white, non-Hispanics
Although Black non-Hispanic women are less likely to get breast cancer than their White non-Hispanic
counterparts, they are the more likely to die from it
Prostate cancer mortality among Black non-Hispanic men is nearly two times higher than their White
counterparts
1 in 4 Massachusetts high school students have recently used an electronic nicotine delivery product (E-
NDP), such as e-cigarettes, more than all other tobacco products combined
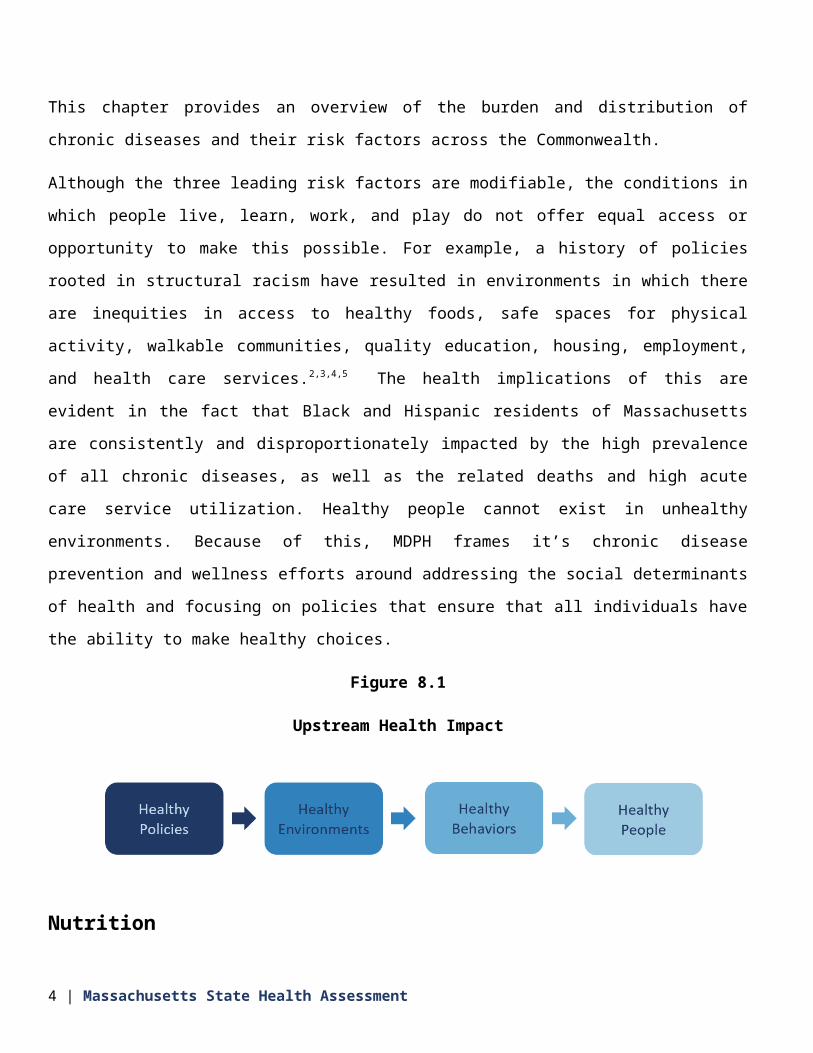
in structural racism have resulted in environments in which there are inequities in access to healthy foods,
safe spaces for physical activity, walkable communities, quality education, housing, employment, and
health care services.2,3,4,5 The health implications of this are evident in the fact that Black and Hispanic
residents of Massachusetts are consistently and disproportionately impacted by the high prevalence of all
chronic diseases, as well as the related deaths and high acute care service utilization. Healthy people cannot
exist in unhealthy environments. Because of this, MDPH frames it’s chronic disease prevention and wellness
efforts around addressing the social determinants of health and focusing on policies that ensure that all
individuals have the ability to make healthy choices.
Figure 8.1
Upstream Health Impact
Nutrition
Poor diet is associated with 45.4% of cardiovascular and metabolic-related deaths nationwide 6 and several
preventable chronic diseases, including cardiovascular disease, type 2 diabetes, certain types of cancer, and
obesity.7,8 Fruit and vegetable consumption is protective against several chronic conditions while consumption
of sugar-sweetened beverages enhances chronic disease risk.9,10,11
4 | Massachusetts State Health Assessment
“Food insecurity is a big issue in some communities; it’s not just about having access to food, but having access to nutritious foods that are accessible to low-income families.”
Focus Group Participant

Because improved access to healthy food results in better quality of
dietary intake and better health outcomes; 12 addressing food access
is imperative for prevention of chronic disease.
Features of the physical and social environment affect access to
healthy, affordable food.13 Low-income communities, rural
communities, and communities of color are more likely to live close to unhealthy fast food outlets and far
from retail food outlets that offer a variety of healthy foods.14
Generally, a healthy diet costs more than an unhealthy diet.15 High costs of living can also prevent access to
healthy food. For example, high costs of energy and housing, particularly relative to total household income,
affect a household’s ability to access healthy food, thus enhancing the risk of negative health outcomes for
children.16 Because transportation is important for food access,
inequalities in vehicle ownership, access to reliable public
transportation, and community walkability exacerbate food
insecurity.17 The majority of those living below the poverty line are
people of color; this income inequality further compounds food insecurity. 18
Trends/Disparities
According to the BRFFS In 2015, only one in five (19.6%) Massachusetts adults consumed at least five daily
servings of fruits and vegetables, a pattern that has not changed from 2011 to 2015. Fruit and vegetable
consumption varies by educational attainment. Adults with a college education or higher (23.1%) are more
likely to consume the recommended amount of fruits and vegetables than individuals with less than a college
education (less than high school, 14.2%; high school education, 17.2%). Further, adults with a disability are less
likely to consume the recommended amount of fruits and vegetables daily than those without a disability at
16.7% compared to 20.7% for the rest of the survey respondents.19
5 | Massachusetts State Health Assessment
“Depending on where you’re located, a lot of people don’t have access or even the funds to get healthy food.”
Key Informant Interviewee
“Many of our clients rely on food pantries to make ends meet.”
Focus Group Participant

Figure 8.2
Percent of Adults Reporting Consumption of at Least Five or More Fruits or Vegetables Daily, by Educational
Attainment, Massachusetts, 2015
Less than HS HS College 1-3 yrs College 4+ yrs0
10
20
30
40
50
14.2 17.2 18.8 23.1
Perc
ent o
f Adu
lts
In 2015, 90% of Massachusetts high school students did not eat the recommended daily servings of fruits and
vegetables. Sugar-sweetened beverage consumption among high school students has remained stable since
2013. But racial/ethnic disparities in this category persist where Hispanic (71.4%) and Black non-Hispanic
(68.9%) students are more likely to consume one or more sugar-sweetened beverages a day than White non-
Hispanic students (58.3%).20
6 | Massachusetts State Health Assessment

Figure 8.3
Percent of High School Students Reporting Consumption of at Least One Sugar-Sweetened Beverage in Past
Day, Massachusetts, 2015
White non-Hispanic Black non-Hispanic Hispanic Asian non-Hispanic0
20
40
60
80
100
58.3 68.9 71.4 56.9
Perc
ent o
f Hig
h Sc
hool
Stud
ents
“Food desert” locations are classified by the US Department of Agriculture (USDA) as low-income areas with
limited access to healthy food outlets. These food deserts (see Figure 8.4) are concentrated in and around the
Commonwealth’s largest cities and towns, including Boston, Brockton, Lowell, Worcester, Springfield, New
Bedford, and Fall River.21
Focus group and key informant interview participants expressed concerns about limited healthy food options
in lower income communities across Massachusetts. Participants reported a dearth of grocery stores and a
prevalence of convenience stores and fast food outlets in these communities. They viewed these limited
options as directly linked to obesity and chronic disease among residents. As one focus group participant
explained, “Every day I pass by six fast-food restaurants before I see a supermarket with fresh produce.”
7 | Massachusetts State Health Assessment
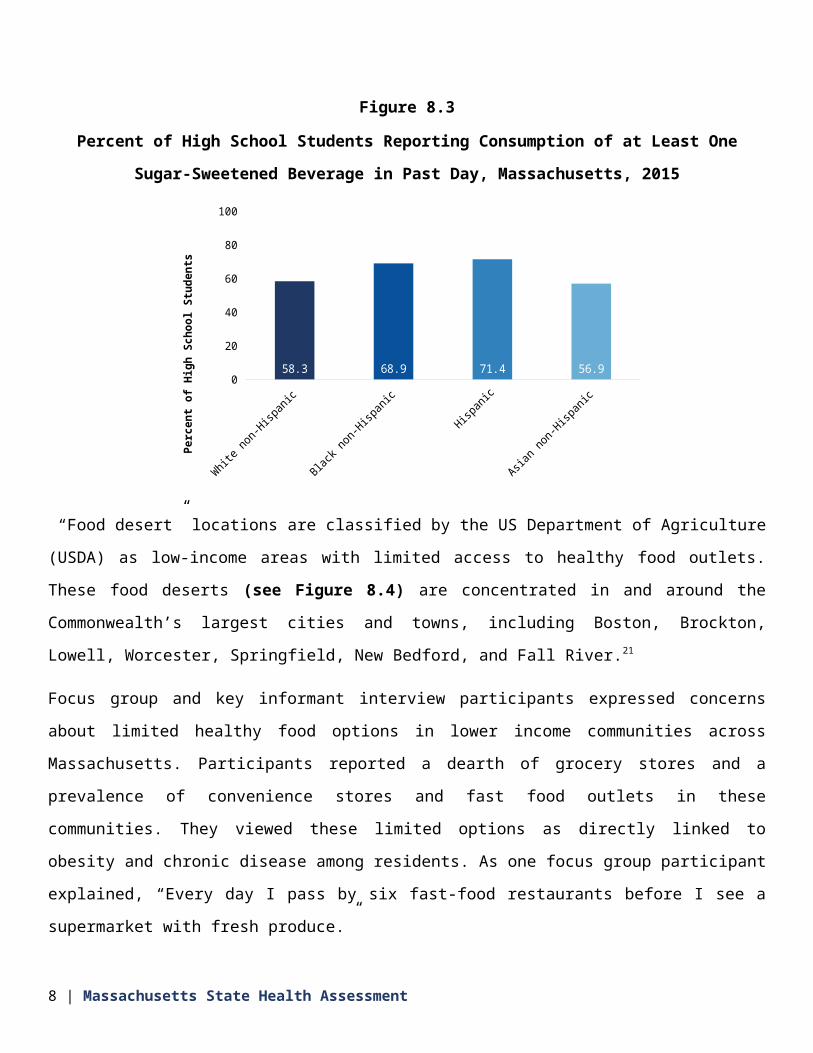
Figure 8.4
Food Desert Locations by Census Tract, Massachusetts, 2015
SOURCE: USDA FOOD ACCESS RESEARCH ATLAS. FOOD DESERTS INCLUDE LOW-INCOME AND LOW ACCESS
CENSUS TRACTS MEASURED AT UP TO 1 MILE FOR URBAN AREAS AND 20 MILES FOR RURAL AREAS.
In Massachusetts, 11.7% of residents participated in the state’s Supplemental Nutrition Assistance Program
(SNAP) in 2013.22 In 2014, SNAP served 85.4% of those eligible for benefits (household median income
$16,200-$21,600). This indicates a negative gap between those who are eligible for benefits and those who
are receiving them. 23,24
Overall food insecurity (i.e. problems with food access) has declined from 11.9% in 2011 to 9.7% in 2016.
However, that rate is 24% higher than the recession of 2009 numbers.25 The emergency food system including
food banks and food pantries has seen a general increase in usage since the recession of 2009, and is
distributing increasing amounts of food. 26,27,28,29,30
8 | Massachusetts State Health Assessment

Physical Activity
Physical activity is a primary contributor to health and quality of life. Physical inactivity is a risk factor for
cardiovascular disease, type 2 diabetes, cancer of the colon and breast, obesity, hypertension, bone and joint
diseases, and depression.31 Physical inactivity along with tobacco use and poor diet are the leading causes of
premature mortality. Physical inactivity alone accounts for upwards of 11% of all health care costs.
Meanwhile, the rates of people not getting sufficient physical activity are increasing.32
Massachusetts residents who meet all physical activity guidelines (both aerobic and muscle-strengthening) are
less likely to have depression, diabetes, poor mental health, and are less likely to be obese as compared to
those who do not meet either of these guidelines.
Figure 8.5
Percent of Adults Who Report Meeting Recommended Guidelines for Physical Activity (Aerobic and Muscle-
Strengthening), by Depression, Diabetes, Mental Health, and Obesity, Massachusetts, 2015
Depression Diabetes Mental Health Obesity0
10
20
30
40
26.0
11.914.3
31.7
17.1
4.8
9.0
14.6
Did not meet either guideline Met both guidelines
Perc
ent o
f Adu
lts
These outcomes can be supported by opportunities available in the physical and social environment.33,34 For
example: the quality of walking and biking infrastructure; the availability of and access to parks, playgrounds
9 | Massachusetts State Health Assessment

and recreation areas; how well infrastructure connects to destinations such as food outlets, employment
centers, and health care facilities; and the location of housing in proximity to transit stops. These factors affect
the opportunity and desirability to incorporate physical activity in daily activities.35,36,37
Individuals who live in walkable neighborhoods are twice as likely to meet physical activity guidelines. 38 The
availability of sidewalks and protected bike lanes has been consistently and positively associated with physical
activity.39 Access to and use of public transportation also increases regular physical activity.40 Furthermore, the
design of recreational spaces and surrounding access to those spaces, such as the presence of trees, well-
maintained buildings, water views, and walkable and bikeable infrastructure access are important for making
parks, playgrounds, and recreation areas accessible and desirable for use.41
Additionally, neighborhood safety and risk of injury (e.g., vehicle
traffic) rank high on parents’ concerns whether to allow their
children to walk or bike to school.42 Furthermore, increasing
physical activity in Massachusetts is complicated by increasing
levels of screen time among youth, a risk factor associated with
sedentary behavior.
Neighborhood environments that are conducive to physical activity are often limited in low-income
communities and communities of color across the state.43 For example, youth who live in low-income areas or
communities of color are 50% less likely to have recreational facilities near their homes.44 Therefore, it is
necessary to approach physical activity as a policy, systems, and environmental change issue in order to begin
to address socioeconomic and racial/ethnic inequalities in the built and social environment to promote active
living.
Trends/Disparities
The percentage of Massachusetts adults who are physically inactive increased, from 23.5% in 2011 to 26.5% in
2015. Figure 8.6 indicates that physical inactivity patterns varied according to age, educational attainment,
and race/ethnicity during that time period. For example, older adults are more likely to be physically inactive
than younger adults (65 years and older: 33.3% versus 25-34 years: 23.1%).
10 | Massachusetts State Health Assessment
“There are very few affordable options to get kids out of the house and active during the summer months. Summer programming is very expensive, so lower-income children can’t access these resources.”
Focus Group Participant

When compared to adults with college degrees or higher (15.2%), the prevalence of physical inactivity was
three times as high among adults with less than a high school degree (47.8%), and twice as high among adults
with a high school degree (33%). People making less than $35,000 per year had approximately twice the
prevalence of physical inactivity as those making more than $50,000 a year (42.3% versus 16.9%). (see Figure
8.6)
Similarly, racial disparities are evident in people’s ability to meet physical activity guidelines. Hispanic (43%)
and Black non-Hispanic (34%) adults were significantly more likely to be physically inactive than White non-
Hispanic adults (23.8%). Race and ethnicity, in particular, have consistently been a predictor of physical
inactivity (even after controlling for confounding factors such as income).45,46 Neighborhood safety concerns,
lack of recreational space, and fear of deportation among immigrants likely contribute to this disparity.47
In addition, among the Commonwealth’s youth, inequities in being able to achieve physical activity guidelines
are evident. Figure 8.7 shows a greater percentage of White non-Hispanic high school students (50.8%) meet
physical activity guidelines than their Black non-Hispanic (32.4%) and Hispanic (31.8%) peers.
Screen time is an important contributor to physical inactivity. Among middle school students, more reported
playing three or more hours of video/computer games per day (42.4%) in 2015 than they did in 2013 (36%).
In 2015, Black non-Hispanic (30.1%) and Hispanic (24.4%) middle-school and high-school students were more
likely to watch three or more hours of television on an average school day than White non-Hispanic students
(15.5%), a risk factor associated with sedentary behavior. 48
11 | Massachusetts State Health Assessment
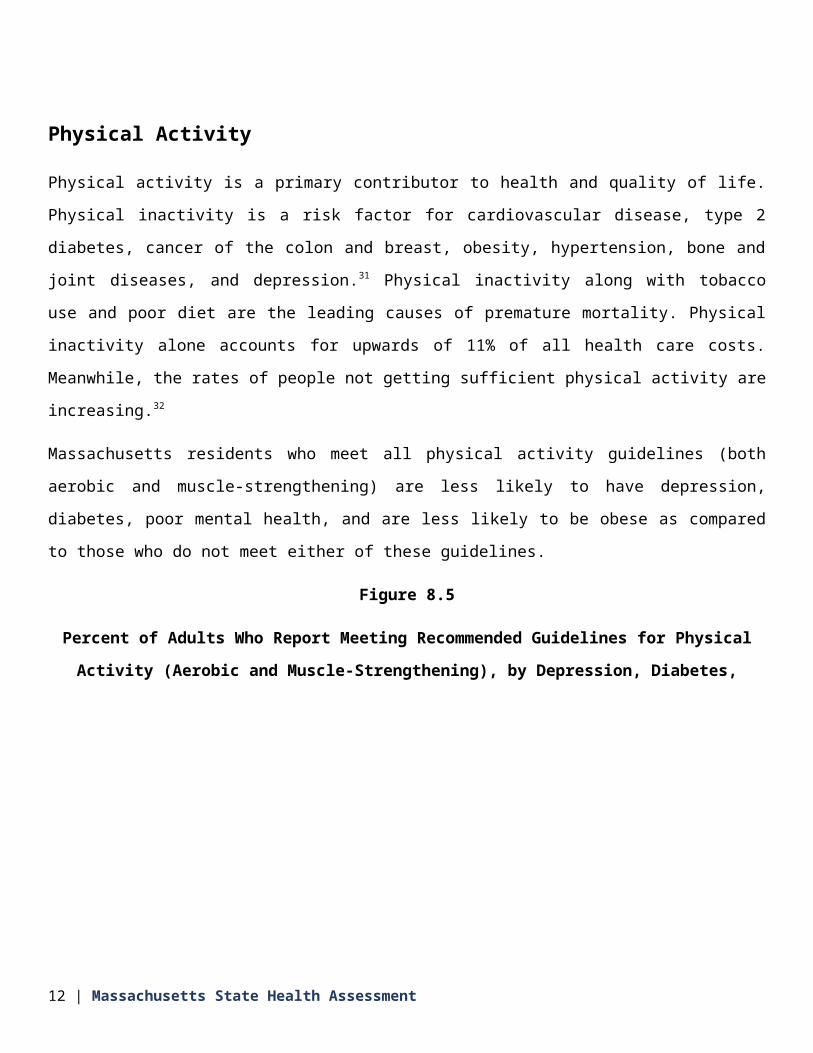
Figure 8.6
Percent of Adults Who Report Not Engaging in Physical Activity in the Past 30 Days, Massachusetts, 2015
18-2425-3435-4445-5455-64
65+
Less than H.S.H.S. or G.E.D.
Some post-H.S.College graduate
< $15,000$15,000-$24,999$25,000-$34,999$35,000-$49,999
$50,000+
White non-HispanicBlack non-HispanicAsian non-Hispanic
Hispanic0 10 20 30 40 50 60
17.623.1
25.626.9
28.433.3
47.833
26.515.2
38.639.8
42.327.9
16.9
23.834.6
26.543.1
Percent of Adults
Age
Gro upEd
-uca tion
Hou se-
hol d In-
com e
Rac e/ Eth nic-
ity
12 | Massachusetts State Health Assessment

Figure 8.7
Percent of High School Students who Meet 60+ minutes of Physical Activity, 5+ days per week, by
Race/Ethnicity, Massachusetts, 2015
White non-Hispanic Black non-Hispanic Hispanic Asian non-Hispanic0
20
40
60
80
100
50.8 32.4 31.8 40.4
Perc
ent o
f High
Scho
ol St
uden
ts
Tobacco Use and Exposure
Smoking remains the leading cause of preventable death and
disease in the United States, with nearly 500,000 Americans
dying prematurely each year due to smoking.49 Smoking affects
nearly every organ in the body and is associated with multiple
preventable chronic diseases including coronary heart disease,
stroke, type 2 diabetes, chronic obstructive pulmonary disease,
asthma, and numerous types of cancer.50 Nicotine is addictive and
has the potential to severely compromise the long-term health of the brain, particularly for individuals under
the age of 26 for whom the brain is still developing.51
In Massachusetts, the total medical cost incurred from smoking is more than $4 billion annually. More than
$1.26 billion is incurred by Medicaid alone as a result of the high proportion of smokers covered by
MassHealth insurance. This amount does not include health costs caused by exposure to secondhand smoke,
13 | Massachusetts State Health Assessment
“People [don’t recognize] that smoking is one of the biggest health risks that they face…they’re willing to work on their cholesterol level when smoking is five times more of a cardiovascular risk than their cholesterol.”
Key Informant Interviewee

smoking-caused fires, and use of other tobacco products such as smokeless tobacco, cigars, and pipe
tobacco.52,53
Significant gaps in the prevalence of smoking and quitting exist among different populations. Higher smoking
rates, lower quit rates, and/or higher rates of tobacco-related health outcomes are reported more for the
following groups of people than the Massachusetts overall population: 49
Black non-Hispanics and Hispanics
Individuals that have MassHealth insurance
Individuals with lower income
Individuals with less than a high school education
Persons with disabilities
Individuals experiencing poor mental health
Individuals who identify as LGBTQ
Adult Smoking
Smoking is the leading cause of death and disease in Massachusetts with more than 9,000 premature smoking
related deaths each year.54
Trends/Disparities
Over the past 20 years, the prevalence of reported smoking among Massachusetts adults has declined from
22.7% in 1996 to 14% in 2015, a historic low. Today, an estimated 708,000 Massachusetts residents still smoke
cigarettes.
While the smoking prevalence has declined since 1996, individuals with poor mental health and those of low
socioeconomic status report consistently higher rates of smoking compared to the general population. This
gap has not closed over time (see Figure 8.8). Consequently, three out of four smokers (73.4%) in
Massachusetts today fall within one or more of the following socioeconomic or mental health categories: have
poor mental health, are low socioeconomic status (less than a high school education or an income less than
$25k), and/or have MassHealth insurance.55
14 | Massachusetts State Health Assessment

Figure 8.8
Prevalence of Adult Smoking, by Socioeconomic and Mental Health Status, Massachusetts, 1996-2015
1996 1997 1998 1999 2000 2001 2002 2003 2004 2005 2006 2007 2008 2009 2010 2011 2012 2013 2014 20150
10
20
30
40
50
22.7
14.0
39.2
30.129.7
20.7
12.68.4
All adults Poor mental healthLow SES High SES
Pe
rce
nt
of
Ad
ult
s
NOTES: POOR MENTAL HEALTH IS DEFINED AS 15+ DAYS OF POOR MENTAL HEALTH IN THE PAST MONTH;
LOW SES IS DEFINED AS HOUSEHOLD INCOME OF LESS THAN $25K OR HIGH SCHOOL EDUCATION OR LESS;
AND HIGH SES IS DEFINED AS HOUSEHOLD INCOME OF $75K OR MORE OR COLLEGE DEGREE; IN 2011 THERE
WAS A CHANGE IN SURVEY METHODOLOGY / WEIGHTING WHICH RESULTED IN A BREAK IN TREND
While adults of low socioeconomic status and/or poor mental health experience the highest smoking rates,
disparities in smoking are also seen in adults with a disability and in adults who identify as LGBTQ. In 2015,
compared to the overall adult smoking prevalence of 14%, the smoking rate was 30.1% among adults with 15
or more poor mental health days in the past month, 24.2% among adults with MassHealth insurance, 23.6%
among adults with less than $25,000 in annual household income, 23.4% among adults with a disability, 20.9%
among adults with a high school education or less, and 17.8% among adults who identify as LGBTQ.56
Prevention/Other Tobacco Products
A total of 82% percent of adult smokers in Massachusetts smoked their first cigarette before age 19.57 The
earlier young people begin to smoke, the more likely they are to become addicted. In Massachusetts, more
than 103,000 youth aged 0 to 17 years are projected to die from smoking. 58 Tobacco prevention efforts among
youth therefore remain an important initiative in Massachusetts.
15 | Massachusetts State Health Assessment
Trends/Disparities
Over the last 20 years, regular cigarette use among Massachusetts youth has declined by 78% to a historic low
of 7.7% in 2015. However, tobacco products such as cigars, smokeless tobacco, and e-cigarettes have
increased in popularity among youth because of their wide availability, attractive flavors, lower costs, and
pervasive marketing.59
In 2015, the rate of current cigar use was 10.4% and rate of Electronic Nicotine Delivery Products (E-NDP) use
(i.e. e-cigarettes and e-hookah) was 23.7% among high school students (Figure 8.9). The prevalence of E-NDP
use far exceeded use of all other tobacco products combined (23.7% vs. 15.9%). Furthermore, nearly 1 in 2
high school students (44.8%) reported ever trying E-NDPs compared to 27.8% of high school students who
have ever tried smoking a cigarette.60
Smoking Cessation
Stress due to social, emotional, and environmental factors is a
barrier to cessation shared by many subpopulations that have
more difficulty quitting.61,62 Oftentimes, these individuals have less
support for quitting, lower motivation to quit, stronger addiction to
tobacco, increased likelihood of not completing courses of pharmacotherapy or behavioral support sessions,
and greater exposure to tobacco industry marketing that prevent them from successfully quitting.63
16 | Massachusetts State Health Assessment
“Vaping and e-cigarettes are all the rage right now, especially with young people, yet we don’t have any data showing how it’s affecting population health.”
Focus Group Participant
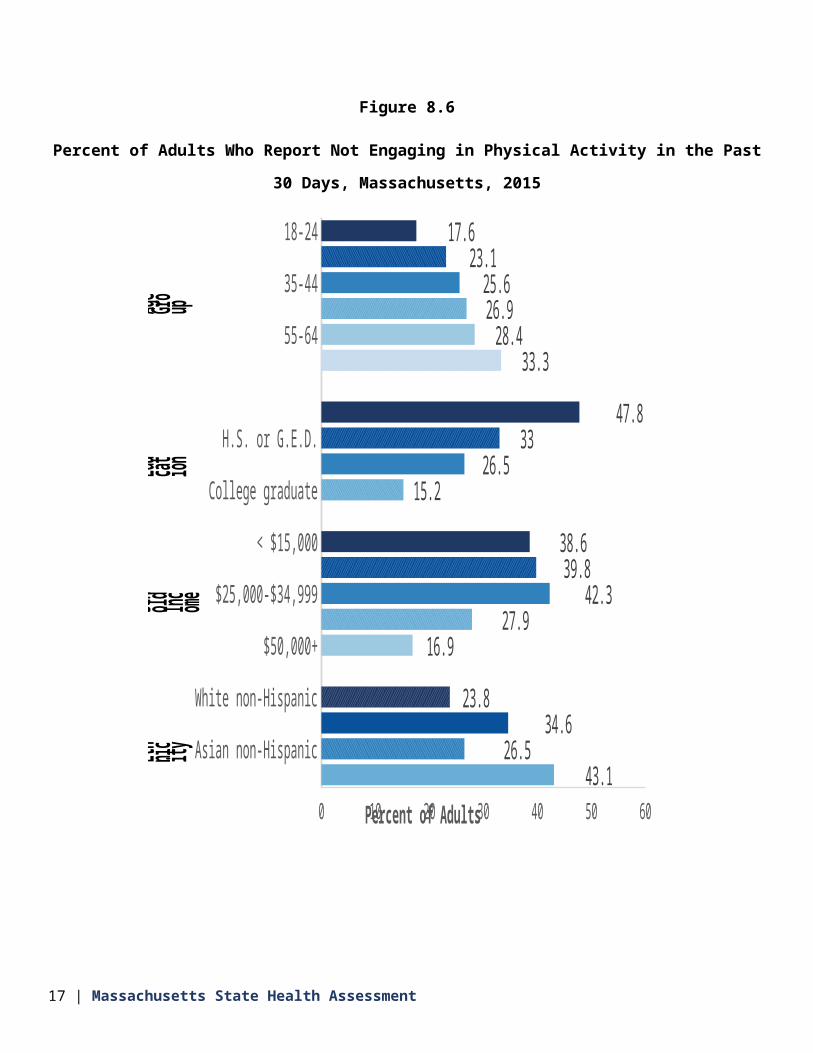
Figure 8.9
Percent of High School Students Reporting Current Use of Tobacco Products, by Product, Massachusetts,
2015
Any Tobacco (excluding E-
NDPs)
Cigarettes Cigars Smokeless Tobacco
E-NDPs0
10
20
30
40
50
15.9 7.7 10.4 5.5 23.7
Perc
ent o
f Hig
h Sc
hool
Stu
dent
s
Trends/Disparities
In 2015, 61% of current smokers in Massachusetts tried to quit in the
past year and the prevalence of successful quitting among adults who
ever smoked was 65.8%.
Although the percentage of smokers who made a quit attempt were
similar among different population groups, the prevalence of successful
quitting varied by social and economic factors.
The prevalence of successful quitting experiences was lower among smokers with poor mental health (44.4%),
adults with less than $25,000 household income (52.3%), those with a high school education or less (57.5%),
adults with a disability (58.2%), and adults who identified as LGBTQ (58.2%) (see Figure 8.10) The prevalence
of successful quitting is also significantly lower among Black non-Hispanic (51.1%) and Hispanic (58.7%) adults
compared to White non-Hispanic adults (67.9%).
17 | Massachusetts State Health Assessment
“I know I shouldn’t be smoking -- especially with a lung collapse. But I’m not ready now. There’s too much stress.”
Key Informant Interviewee

Secondhand Smoke
In Massachusetts, an estimated 1,000 or more adults and children die from exposure to secondhand smoke
each year.64 In 2004, the Massachusetts Legislature enacted a statewide smoking ban in workplaces,
restaurants, and bars. Since then, exposure to secondhand tobacco smoke has declined. However,
nonsmokers continue to report exposure to secondhand smoke in their homes or in worksites that are non-
compliant and in private vehicles.65
Currently, more than 896,000 adults and 148,000 children are potentially exposed to secondhand smoke
because they live in a household and/or building that allows smoking indoors. Residents living in multi-unit
housing without a smoke-free policy are nearly twice as likely to have a child with asthma compared to
residents living in housing with a smoke-free policy (16.3% versus 8.8%).66
18 | Massachusetts State Health Assessment

Figure 8.10
Percent of Adults Who Reported Successfully Quitting Smoking, by Subgroup, Massachusetts, 2015
All adults
Mass Health
15+ days of poor mental health in past month
<25k household income
High school or less
LGBT
Have disability
Private health insurance
$75k+ household income
College degree
0 20 40 60 80 100
65.8
42.5
44.4
52.3
57.5
58.2
58.2
67.8
74.8
80.8
Percent of Adults
Les
s Lik ely
to Qui
t
Mo re Like
ly to Qui
t
Trends/Disparities
Exposure to secondhand smoke among adult nonsmokers declined in Massachusetts from 32% in 2002 to
12.6% in 2015. However, an estimated 459,772 adult nonsmokers continue to be exposed to secondhand
smoke at home, work, or other places for more than one hour per week.67
In 2015, exposure to secondhand smoke among nonsmokers was most prevalent among adults with
MassHealth insurance (18.6%), adults who identify as LGBT (18.1%), and adults who were unemployed
(14.4%).
19 | Massachusetts State Health Assessment

Figure 8.11
Percent of Non-Smoking Adults who Reported Exposure to Second-Hand Smoke, by Subgroup,
Massachusetts, 2015
All Adults
Mass Health
Have disability
<$25K household income
LGBT
Unemployed
Private health insurance
$75k+ household income
College degree
0 5 10 15 20 25 30
12.6
19.3
18.1
17.3
15.9
14.4
10.7
8.5
7.0
Percent of Adults
More
likey to
be
ex-
posed
to
SHS
Less
likey to
be
ex-
posed
to
SHS
Obesity
Obesity is both a chronic disease and a risk factor for other chronic conditions.68 Overweight or obese people
are more likely to have type 2 diabetes, cardiovascular disease, gall bladder disease, and musculoskeletal
disorders.69 In addition, overweight and obesity are associated with asthma, some forms of cancer, and many
other health problems that interfere with daily living and reduce the quality of life. 70 Engaging in physical
activity and maintaining a healthy diet have been proven to lower the incidence of obesity, however structural
barriers to accessing healthy foods and beverages and opportunities to be physically active (as described
20 | Massachusetts State Health Assessment

elsewhere in Chapter 8) disproportionately affect people of color in the Commonwealth.71 As a result, not all
Massachusetts residents have the same opportunities to prevent obesity.
Adults
Overweight is defined as having a body mass index (BMI) of 25.0 to 29.9 kg/m2. Obesity is defined as a BMI
greater than or equal to 30.0kg/m2. Both conditions are linked to poor nutrition and inadequate physical
activity. There has been a shift in the leading cause of death over the past 50 years from acute conditions to
chronic diseases. Given the tie between obesity and so many other chronic diseases, the need to address
obesity is a public health imperative to control morbidity and mortality as well as ballooning health care costs
in an aging population.
Trends/ Disparities
In 2015, nearly 60% of Massachusetts adults met the criteria for being overweight or obese and 24.3% were
obese. Figure 8.12 indicates that more than one-third of Black non-Hispanic adults (35.6%) were obese
compared to Hispanic (28.9%), and White non-Hispanics (22.7%). Adults with disabilities (34.3%) were
significantly more likely to be obese than adults with no disability (20.7%). Adults who have less than a high
school education are almost twice as likely to be obese than adults with four or more years of college.
21 | Massachusetts State Health Assessment

Figure 8.12
Percent of Adults Meeting Criteria for Obesity, Massachusetts, 2015
White non-Hispanic
Black non-Hispanic
Hispanic
Asian non-Hispanic
Disability
No disability
< High school
High school
College 1–3 yrs
College 4+ yrs
0 5 10 15 20 25 30 35 40 45 50
22.7
35.6
28.9
*
34.3
20.7
32.5
27.7
23.7
18.0
Percent of Adults
R ac e/ Et hn ic-
ity
Di sa bil ity
Ed uc ati on
NOTE: *INSUFFICIENT DATA
Children
Child overweight is defined as a body mass index (BMI) at or above the 85 th percentile for age. Child obesity is
defined as BMI at or above the 95th percentile of expected for age.72 As in adults, child obesity is linked to poor
nutrition and inadequate physical activity; and inequities persist across socioeconomic status and
race/ethnicity.73
22 | Massachusetts State Health Assessment
Trends/Disparities
Massachusetts is ranked as the fifth worst US state on the prevalence of obesity among children enrolled in
the Women, Infant and Children (WIC) program who are two to four years old.74,75
Figure 8.13
Percent of WIC Children Aged 2-4 Years who have Obesity in the US by State, 2000-2014
2000 2004 2008 2010 2012 20140
5
10
15
20
25
16.3 16.6
Perc
ent
of C
hild
ren MA
Other
states
SOURCE: SPECIAL SUPPLEMENTAL NUTRITION PROGRAM FOR WOMEN, INFANTS, AND CHILDREN BIENNIAL
SURVEY FOR PARTICIPANTS AGES 2-4 WHO HAVE OBESITY
BMI screening reports conducted by school districts indicate that the prevalence of overweight and obesity
decreased 2.1 percentage points from 2009 (34.3%) to 2015 (31.3%).76 However, this reduction in overweight
and obesity was not shared evenly across all school districts. Between 2009 and 2014, school districts with
median household incomes greater than $37,000 experienced significant improvements. However, the
prevalence of overweight and obesity for the poorest school districts (less than $37,000 median household
income) did not change and remained the highest across the state with approximately 40% of students being
overweight or obese.77
23 | Massachusetts State Health Assessment

Cardiovascular Disease
Nationally, cardiovascular disease is the leading cause of death for both men and women, representing
600,000 deaths annually.78 In Massachusetts, cardiovascular disease is the second leading cause of death after
cancer. Cardiovascular disease is a broad term that encompasses a number of adverse health outcomes,
including congestive heart failure, myocardial infarction, and stroke. Every year, a staggering 735,000
Americans have a heart attack, while every 40 seconds someone in the United States has a stroke.79,80
Nutrition, physical activity, access to healthy foods and safe communities also shape cardiovascular risk. 81 For
example, poor nutrition due to food insecurity and lack of access to affordable produce contribute to
cardiovascular risk.82Lack of access to safe neighborhoods, parks, and active transportation infrastructure
contribute to physical inactivity that similarly enhances risk for cardiovascular disease.83 Additionally, chronic
stress from exposure to trauma and discrimination contribute to that risk.84
Hypertension
Hypertension is a critical risk factor for adverse cardiovascular and cerebrovascular outcomes including stroke,
heart attacks, and congestive heart failure.85 In 2014, hypertension contributed to $19 million in total
hospitalization costs in Massachusetts.86 Hypertension disproportionately impacts people of color. These
disparities are grounded in social and economic inequities such as access to health care and poverty.87,88
Trends/Disparities
Although hypertension alone is not a major contributor to health care costs, it is widely prevalent. In 2015,
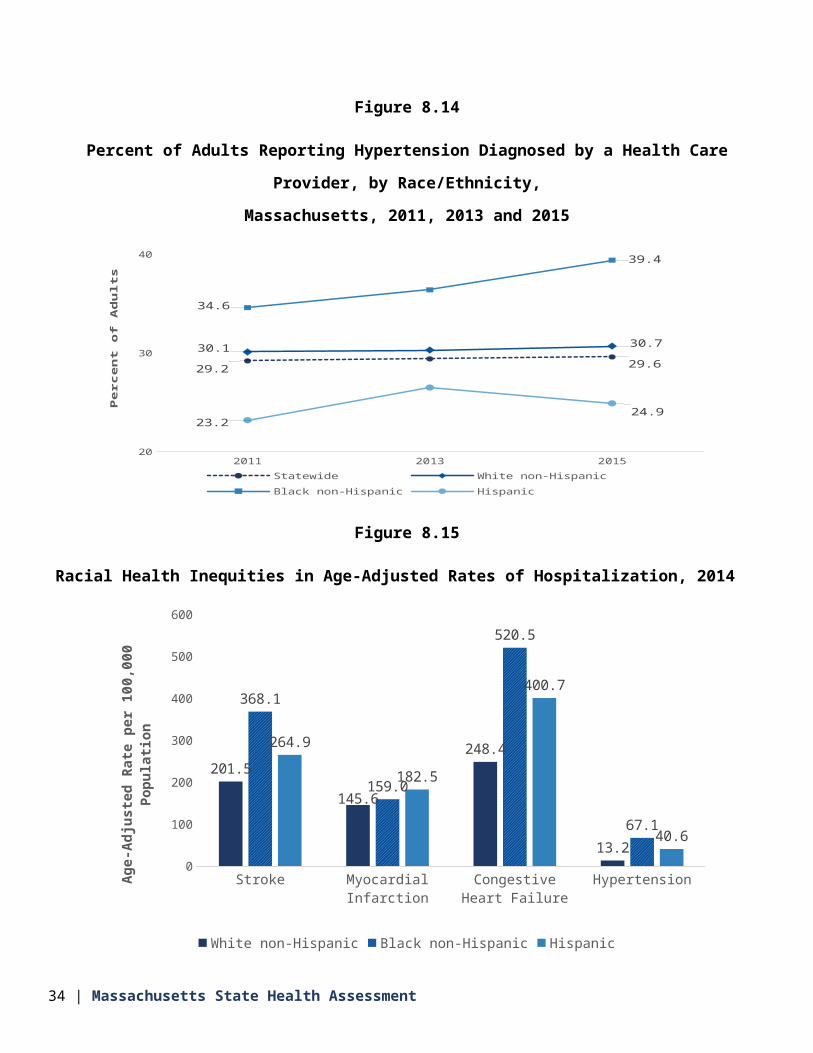
29.6% of Massachusetts adults said they had been diagnosed with hypertension, similar to previous years.
In 2015, a larger percentage of Black non-Hispanic adults were diagnosed with hypertension (39.4%)
compared to White non-Hispanic adults (30.7%). Racial/ethnic disparities in hypertension are likely an
important contributing factor to hospitalizations for congestive heart failure, myocardial infarction, and
stroke.
24 | Massachusetts State Health Assessment
Figure 8.14
Percent of Adults Reporting Hypertension Diagnosed by a Health Care Provider, by Race/Ethnicity,
Massachusetts, 2011, 2013 and 2015
2011 2013 201520
30
40
29.2 29.630.1 30.7
34.6
39.4
23.224.9
Statewide White non-HispanicBlack non-Hispanic Hispanic
Pe
rce
nt
of
Ad
ult
s
Figure 8.15
Racial Health Inequities in Age-Adjusted Rates of Hospitalization, 2014
Stroke Myocardial Infarction Congestive Heart Failure
Hypertension0
100
200
300
400
500
600
201.5
145.6
248.4
13.2
368.1
159.0
520.5
67.1
264.9
182.5
400.7
40.6
White non-Hispanic Black non-Hispanic Hispanic
Age-
Adju
sted
Rat
e pe
r 100
,000
Pop
ulati
on
SOURCE: CHIA, CASE MIX HOSPITALIZATION DATA
25 | Massachusetts State Health Assessment

In 2014, Black non-Hispanic residents (67.1 per 100,000 population) experienced more than five times the rate
of hospitalizations for hypertension compared to White non-Hispanic residents (13.2 per 100,000 population).
Also in 2014, the rate of hypertension-related hospitalizations for Hispanic residents (40.6 per 100,000
population) was more than three times the rate than White non-Hispanic residents (13.2 per 100,000
population).
Heart Failure
Congestive heart failure can be debilitating and challenging for patients to manage. It is also a costly disease,
amounting to $540 million in total hospitalization costs in Massachusetts in 2014.89 If not managed properly,
congestive heart failure is associated with high readmission rates, poor quality of life, and high health care
utilization.90,91
Trends/Disparities
In 2014, heart failure accounted for 273.9 hospitalizations per 100,000 population, a 1.7% decline from 2010.
In 2014, the rate of hospitalizations attributed to congestive heart failure for Black non-Hispanic residents
(520.5 per 100,000 population) was more than twice as high than that for non-Hispanic White residents (248.4
per 100,000 population). Similarly, Hispanic residents (400.7 per 100,000 population) were hospitalized for
congestive heart failure at a rate that was 1.6 times higher than that for non-Hispanic White residents (248.4
per 100,000 population).
Myocardial Infarction
Myocardial infarction contributed to $566 million in total hospitalization costs in 2014 in Massachusetts. 92
Prevalence of myocardial infarction is connected to social determinants of health such as education and
income.93
Trends/Disparities
In 2015, 5.7% of adults in Massachusetts were ever told they had a myocardial infarction.
There are important and persistent disparities in reported myocardial infarction by educational attainment. In
2015, Massachusetts adults without a high school degree (14.1%) were nearly five times more likely to report
26 | Massachusetts State Health Assessment

they had a heart attack than persons with four or more years of post-high school education (2.9%).
Figure 8.16
Percent of Adults Reporting Myocardial Infarction Diagnosis, by Educational Attainment, Massachusetts,
2011-2015
2011 2012 2013 2014 20150
5
10
15
5.1 5.7
9.1
14.1
6.1 6.9
5.1 5.4
3.22.9
Statewide Less than HS HS College 1-3 yrs College 4+ yrs
Perc
ent o
f Adu
lts
The rate of myocardial infarction-related hospitalizations declined 9.5% from 2010 (169.9 per 100,000
population) to 2014 (153.7 per 100,000 population).
In 2014, the myocardial infarction hospitalization rate for Hispanic residents in Massachusetts (182.5 per
100,000 population) and Black non-Hispanic residents (159.0 per 100,000 population) exceeded the state
average (153.7 per 100,000 population) and the average for White non-Hispanic residents (145.6 per 100,000
population).
Stroke
Strokes were responsible for $613 million in total hospitalization costs in Massachusetts in 2014.94 These
hospitalization costs does not include other economic costs of stroke, such as lost productivity or outpatient
health care expenditures, nor loss of life, reduced quality of life, and increased disability.
27 | Massachusetts State Health Assessment

Trends/Disparities
In 2015, 3.3% of Massachusetts residents reported having been told by a provider that they had a stroke. In
2014, Massachusetts residents experienced 222.1 stroke-related hospitalizations per 100,000 population, a 3%
decline from 2010 (228.9 per 100,000 population).
Racial/ethnic disparities continue to exist in stroke-related hospitalizations. In 2014, Black non-Hispanic
residents (368.1 per 100,000 population) experienced stroke-related hospitalization at a rate that was nearly
twice as high as that for White non-Hispanic residents (201.5 per 100,000 population). Similarly, Hispanic
residents (264.9 per 100,000 population) had a stroke hospitalization rate that was 1.3 times that for White
non-Hispanic residents (201.5 per 100,000 population).
Diabetes Mellitus
Diabetes mellitus is a condition where the body either does not make or cannot respond to the hormone
insulin, resulting in high levels of sugar (glucose) in the blood. Diabetes mellitus is a term that includes type 1
and type 2 diabetes. It is a common chronic condition with profound impact on quality of life, currently
impacting 29 million US adults, or approximately 9% of the population.95 Most concerning, however, is that
25% of persons with diabetes and 90% of persons with prediabetes do not know they have these conditions,
which has serious implications for disease management and prevention.96,97
Nationwide, the prevalence of diabetes is projected to increase dramatically. The prevalence of type 1 and
type 2 diabetes is anticipated to increase 54% by 2030, affecting 54.9 million Americans.
In Massachusetts, the prevalence of diagnosed diabetes has more than doubled over a 22-year period. For
example, in 1993, an estimated 3.9% of Massachusetts residents were told by a provider that they had
diabetes. By 2015, an estimated 8.9% of Massachusetts residents were told they had diabetes.
Trends/Disparities
Socioeconomic disparities exist in diabetes prevalence. In Massachusetts, adults with an annual household
income of less than $25,000 (15.6%) have three times the prevalence of diabetes as compared to those with
an annual household income more than $75,000 (5%).
28 | Massachusetts State Health Assessment

The prevalence of diabetes also decreases as educational attainment increases. A total of 14.5% of adults
without a high school degree were diagnosed with diabetes compared to 5% of adults with four or more years
of post-high school education.
Diabetes prevalence and mortality in Massachusetts also differs by race/ethnicity. In 2015, a greater
proportion of Black non-Hispanic (12.3%) and Hispanic (11.7%) adults reported being diagnosed with diabetes
compared to White non-Hispanic adults (8.7%). In 2014, Black non-Hispanic residents were more than 2.1
times more likely to die from diabetes than White non-Hispanic residents (29.5 versus 13.8 per 100,000
population).
In 2014, Black non-Hispanic residents had more than four times the rate for diabetes emergency department
visits as White non-Hispanics (419.1 versus 99.3 per 100,000 population). Further, the diabetes emergency
department visit rate among Hispanic residents was almost four times that for White non-Hispanics (376.5
versus 99.3 per 100,000 population).98
Figure 8.17
Age-Adjusted Diabetes Emergency Department Visit Rate, by Race/Ethnicity, Massachusetts, 2014
White non-Hispanic Hispanic Black non-Hispanic0
100
200
300
400
500
99.3 376.5 419.1
Age-
Adjus
ted R
ate p
er 10
0,000
Popu
lation
SOURCE: CHIA, CASE MIX HOSPITALIZATION DATA
29 | Massachusetts State Health Assessment

30 | Massachusetts State Health Assessment

Chronic Lower Respiratory Disease
Chronic lower respiratory diseases are diseases of the airways and other structures of the lung. Chronic lower
respiratory diseases include asthma, chronic obstructive pulmonary disease (COPD), emphysema, and
bronchitis.
In 2014, chronic lower respiratory disease was the third leading cause of death in the United States 99 and the
fourth leading cause of death in Massachusetts. Among adults aged 65 to 84, chronic lower respiratory disease
is the third leading cause of death, after cancer and cardiovascular disease.
Risk factors for chronic lower respiratory disease include, but are not limited to, exposure to tobacco smoke,
air pollution, occupational chemicals, and dust.100
The development and management of chronic lower respiratory disease is strongly linked with the social
determinants of health, such as housing, tobacco exposure, and workplace exposures such as chemicals,
smoke, dust, fumes or mold.101
Adult Asthma
Asthma is a chronic inflammation of the airways that affects people of all ages and is a significant public health
problem both in Massachusetts and the United States. Asthma is exacerbated when airways become
constricted with swelling and excessive mucous production, making it difficult to breathe.
Symptoms of asthma include wheezing, coughing, and chest tightness. Sometimes asthma symptoms become
so severe that they result in an asthma attack that requires immediate medical treatment. Asthma attacks can
be triggered by certain environmental factors such as air pollution, mold, pet dander or saliva, pests such as
rodents and cockroaches, and dust mites in the environment. Asthma affects individuals differently, resulting
in differing severity, presentation of symptoms and responsiveness to treatment. Asthma is among the top
seven conditions that contribute to high costs and emergency room expenditures in the Commonwealth.102
On average, asthma patients in Massachusetts incur $58,600 in medical expenditures per person annually. 103
Although the percent of adults who have ever been told that they have asthma does not differ significantly by
31 | Massachusetts State Health Assessment

race/ethnicity, stark racial/ethnic disparities in emergency department visits and hospitalizations strongly
suggest the role that the social determinants of health play in asthma outcomes.
Trends/Disparities
The percentage of adults reporting that they have ever been told by a health provider that they have asthma
(lifetime asthma) as well as the percentage reporting that they still have asthma (current asthma) were
consistently higher in Massachusetts than in the US as a whole from 2000 through 2013. In 2015, the overall
prevalence was 10.2%.
Following national patterns, lifetime and current asthma prevalence in Massachusetts increased significantly
from 2000 through 2010 (28.6% and 22.4% increase, respectively). While both lifetime and current asthma
prevalence also appear to be increasing in more recent years, additional years of data are needed to estimate
the magnitude of this increase.
Current asthma prevalence among Massachusetts adults differs based on demographic and socioeconomic
factors and by geographic location. As seen in Figure 8.18, statistically significant disparities exist by gender,
age, education, income, disability status, and weight.
32 | Massachusetts State Health Assessment

Figure 8.18
Prevalence of Current Asthma among Adults, by Social and Economic Characteristics, Massachusetts, 2015
TotalMale
35-64
Black non-Hispanic
HS
$25-75K
Former smoker
No disabilityOverweight
Urban0 5 10 15 20
10.27.3
12.811.4
10.67.7
10.413.8
9.513.6
11.59.2
12.99.59.5
13.410.4
1015.7
8.412
8.89.3
10.8Percent of Adults
S e x
A g e G ro u pRace
/ Eth-
nic-
ity
E d uc a ti o nHou
seho
ld In
-com e
Smo king
Sta-
tus
Di sa bi lit yW ei g ht
C o m m u ni ty
In 2012, the asthma hospitalization rate for Hispanic and Black non-Hispanic adults was 2.2 times higher than
that for White non-Hispanic adults. That same year, emergency department visit rates for Black non-Hispanic
33 | Massachusetts State Health Assessment
and Hispanic adults were 3.4 and 3.1 times higher than the rate for White non-Hispanic adults respectively.
There are several features of the social and physical environment that enhance vulnerability for asthma. These
include housing, health care access, stressors, workplace exposures, and outdoor air quality. Lack of access to
safe and affordable housing can lead to environmental inequities that exacerbate asthma, including living in
areas with high levels of air pollution or areas prone to flooding; poor physical and structural condition of
housing, such as water leaks or dampness, holes in walls, and poor ventilation that increases risk of mold
growth and pest infestations; and exposure to environmental tobacco smoke in multi-unit housing. Historical
and structural inequalities that place greater sources of pollution in low-income and racial/ethnic minority
communities contribute to asthma disparities.104
In the workplace, factors such as chemicals, smoke, dust, fumes or mold, may cause or exacerbate asthma. 105
Work-related asthma is often under recognized and under diagnosed. 106 In Massachusetts, 44.5% of adults
with current asthma who have ever been employed reported that their asthma was caused or made worse by
their work. Yet only 15.5% had discussed how work affected their asthma with their health care provider.
Further, only 8.3% had been diagnosed with work-related asthma. 107
Qualitatively, residents living in urban areas were described as especially vulnerable to adult asthma. As one
participant shared: “In Boston’s Chinatown, for example, we see a lot of problems with the built environment.
The residents live right beside the highway and there’s lots of pollution in the area, including many smokers
who work in the restaurants; lots of residents suffer from asthma because of it.”
Pediatric Asthma
The prevalence of pediatric asthma is high in Massachusetts.108 Two out of every three Massachusetts children
with asthma have asthma that is not well controlled or is very poorly controlled.109 The rate of asthma
hospitalizations among children aged 19 and younger is increasing, and children had the highest rate of
asthma emergency department visits compared to other age groups. Disparities exist in poor asthma
outcomes, with statistically significantly higher rates of emergency department visits and hospitalizations for
asthma found among Black non-Hispanic and Hispanic children compared to White non-Hispanic children.110
Trends/Disparities
34 | Massachusetts State Health Assessment
From 2005 to 2010, current and lifetime asthma prevalence among Massachusetts children decreased by an
average of 2.3% and 1.3% annually. Despite this progress, in 2006-2010, two out of every three Massachusetts
children with asthma still had asthma that was not well controlled, or was poorly controlled.
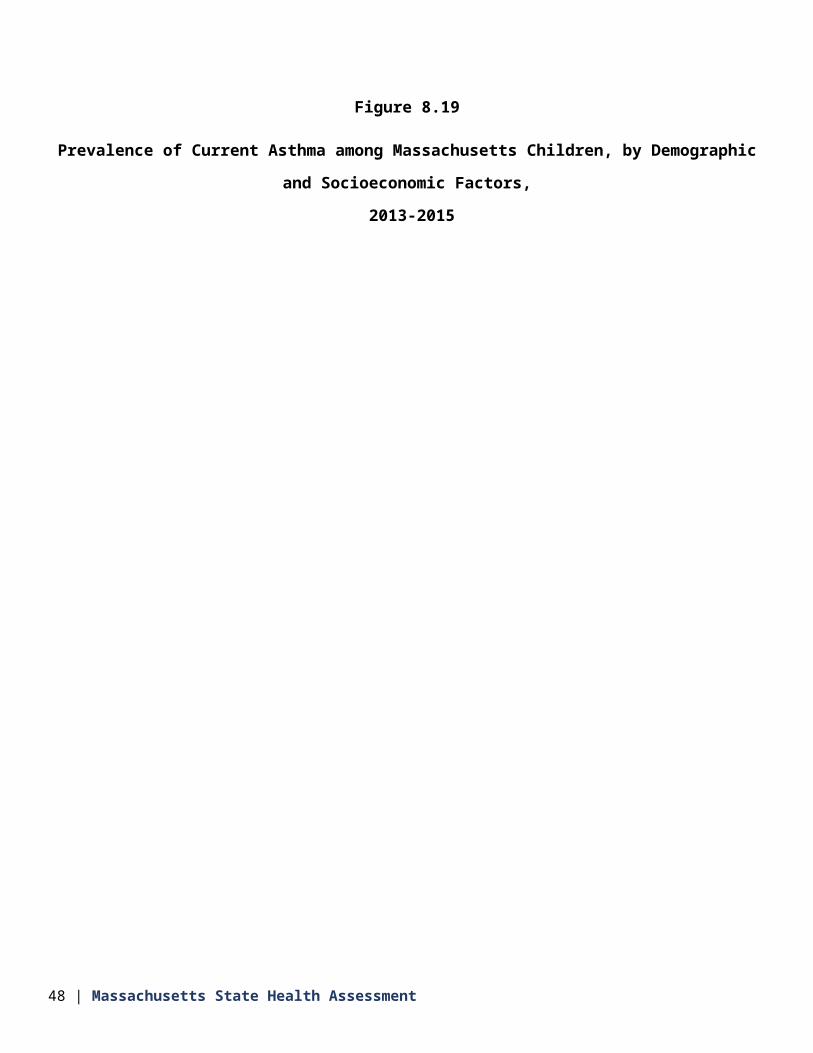
The prevalence of asthma among children in Massachusetts varies based on social and economic
characteristics as well as geography. The three-year (2013-2015) average annual prevalence of asthma among
children in Massachusetts was 9.9%. High asthma prevalence among children is associated with being
between the ages of 12 and 17 (12.7%) and having a household income of less than $25,000 per year (15.8%).
35 | Massachusetts State Health Assessment

Figure 8.19
Prevalence of Current Asthma among Massachusetts Children, by Demographic and Socioeconomic Factors,
2013-2015
Total
MaleFemale
0-45-11
12-17
White non-HispanicBlack non-Hispanic
Hispanic
Less than HSHS
At least some college
<$25,000$25-75K
$75K+
Current smokerFormer smoker
Never smoker0 10 20 30
9.9
10.39.7
3.612.212.7
913.2
15.2
10.914
9
15.810.6
8.1
15.912.6
8.2
Percent of Children
Se xAg e Gr ou p
Ra ce / Et hn ic-
ityEd uc ati on
House
hoold
In-
come
Adult
Respon
-dent
's Smo
king
Status
36 | Massachusetts State Health Assessment

NOTE: MULTIPLE YEARS OF DATA WERE COMBINED FROM THE BRFSS FOR SUFFICIENT SAMPLE SIZE
In 2012, the asthma hospitalization rate for Black non-Hispanic children and Hispanic children was 3.6 and 2.6
times higher than the rate for White non-Hispanic children.
Social determinants of health affect inequities in asthma-related outcomes. For example, housing stock,
residential segregation, tenancy laws, insurance coverage, and schools are factors associated with asthma
inequities.
37 | Massachusetts State Health Assessment

Figure 8.20:
Prevalence of COPD among Massachusetts Adults, by Social and Economic Factors, Massachusetts, 2015
Total
Male
35-44
55-64
75+
White non-Hispanic
Hispanic
Less than HS
College 1-3 yrs
<$25,000
$35-50K
$75K+
Disability
0 2 4 6 8 10 12 14 16 18 20
5.75.1
6.23.1
36.4
6.98.8
14.26.3
4.64
11.57.7
62.2
11.56.8
7.14
2.614.5
2.2
Percent of Adults
Se xAg e Gr ou p
Ra ce / Et hn ic-
ityEd uc ati on
Hous
ehold
In-
come
Di sa bil ity
38 | Massachusetts State Health Assessment

Chronic Obstructive Pulmonary Disease
Chronic Obstructive Pulmonary Disease (COPD) refers to a group of diseases that cause airflow blockage and
breathing-related problems. COPD includes emphysema, chronic bronchitis, and in some cases asthma.
In the US, exposure to tobacco smoke is a key risk factor for COPD.111 Exposure to air pollutants in the home
and workplace, genetic factors, and respiratory infections are also risk factors.112
Trends/Disparities
In 2015, the prevalence of COPD among Massachusetts adults was 5.7% (see Figure 8.20 on the previous
page). Those with prevalence exceeding the state average include women (6.2%); adults older than 75 years of
age (14.2%); white non-Hispanic adults (6.3%); adults with less than a high school (11.5%); persons with lower
household incomes (e.g., household income less than $25,000 (11.5%), and persons with a disability (14.5%).
COPD is consistently among the top ten reasons for hospital admission in Massachusetts and the rate of
potentially preventable hospitalizations due to COPD in Massachusetts exceeds the national average.
Cancer
The burden of cancer in the United States and Massachusetts remains high in terms of prevalence, health care
utilization, health care costs, and mortality.113 Since 2006, cancer surpassed heart disease as the leading cause
of death in Massachusetts.
Although cancer incidence and mortality rates decreased in Massachusetts from 2010 to 2014, there were still
more than 36,000 new cancer cases diagnosed annually during this period. The age-adjusted cancer incidence
rate in Massachusetts was 471.1 per 100,000 population with men having a higher cancer incidence rate than
women (505.7 versus 450.4 per 100,000 population). From 2010 to 2014, cancer incidence decreased 3.2%
annually among men. Black non-Hispanic men and White non-Hispanic women had the highest incidence rate
of all cancer types during this period.
Across the Commonwealth, breast cancer among women and prostate cancer among men is most common.
Lung cancer, colon cancer, and melanoma are also among the leading types of cancer among both women and
men. Together, these five cancers account for more than half of all cancer cases across the Commonwealth.
39 | Massachusetts State Health Assessment

In addition, the overall cancer mortality rate decreased in Massachusetts from 2010 to 2014 (1.5% annually for
women and 2% annually for men). Overall, cancer mortality for men was 1.4 times the overall cancer mortality
rate for women (190.2 versus 135.9 per 100,000 population). Despite this decrease in mortality rate, an
average of 12,734 people in Massachusetts die each year from cancer.
Several socioeconomic factors contribute to the prevalence of cancer and/or late stage cancer diagnoses.
Obesity, tobacco use, and tobacco exposure are leading risk factors for many cancers including colorectal and
breast cancer.114 Additionally, lack of access to healthy foods, limited physical activity, and lack of access to
smoking cessation services are also risk factors. 115,116 Gaps in health care coverage represent a barrier to
covering the costs of diagnostic testing. For examples, individuals with high deductibles, low premiums, or
high co-pays must pay for diagnostic tests to confirm a cancer diagnosis, contributing to delays in diagnosis.117
Lung Cancer
Lung cancer was the second leading cause of cancer among both men and women in Massachusetts between
2010 and 2014 and the leading cause of cancer deaths among both men and women. Lung cancer represents
almost 14% of all cancers in men and women in Massachusetts, and more than one fourth (26.5%) of all
cancer deaths in both men and women in Massachusetts were due to lung cancer.
Nearly one in 15 (6.4%) adults in the US will develop lung cancer at some point during their lifetime. 118
Cigarette smoking is the most important risk factor for lung cancer. In the US, 90% of lung cancers are linked
to cigarette smoking. The risk of developing lung cancer or dying from lung cancer is 15 to 30 times greater
among people who smoke cigarettes than among people who do not. Other risk factors for lung cancer include
second-hand smoke, exposure to asbestos, personal or family history of lung cancer, age, and air pollution.119
The overall lung cancer incidence in Massachusetts from 2010 -2014 was 70.8 per 100,000 among men and
60.7 per 100,000 among women. During the same period, the overall lung cancer mortality rate in
Massachusetts was 60.3 per 100,000 and 36.9 per 100,000 among men and women, respectively.
Trends/Disparities
Lung cancer incidence decreased significantly among women from 2010 to 2014 (1.4% per year) but not for
men. During the same period, the lung cancer incidence rate was statistically significantly higher among White
40 | Massachusetts State Health Assessment
non-Hispanic women (64.1 per 100,000) when compared to the state average (60.7 per 100,000 population).
Between 2010-2014, mortality significantly decreased by 1.4% per year among men and 1% per year among
women. Over this same period, the lung cancer mortality rate for White non-Hispanic men and women (51.7
and 39.2 per 100,000 population) exceeded the rate for all racial/ethnic groups combined.
Figure 8.21
Age-Adjusted Lung Cancer Incidence and Mortality Rate, by Race/Ethnicity and Sex, Massachusetts, 2010-
2014
All Races White non-Hispanic Black non-Hispanic Asian non-Hispanic Hispanic0
10
20
30
40
50
60
70
80
70.8 72.569.7
58.5
39.7
50.3 51.7 50.2
37.7
24.2
60.764.1
46.8
33.728.4
36.9 39.2
27.9
17.512
Male (incidence) Male (mortality) Female (incidence) Female (mortality)
Age-
Adju
sted
Rat
e pe
r 100
,000
Pop
ulati
on
NOTE: MULTIPLE YEARS OF DATA WERE COMBINED FROM THE BRFSS FOR SUFFICIENT SAMPLE SIZE
Breast Cancer
Breast cancer was the most commonly diagnosed cancer among Massachusetts women from 2010 to 2014,
representing almost a third (29.8%) of all cancers among women, and was the second leading cause of cancer
deaths among Massachusetts women. About one in seven (13.2%) of all cancer deaths in women were due to
breast cancer.
41 | Massachusetts State Health Assessment

Risk factors for breast cancer include race, family history, age, and personal history of breast cancer. Other risk
factors include having a period at an early age, having a child at an older age, never having children, radiation
therapy to the breast or chest, obesity, and alcohol use.120
Between 2010 and 2014 the overall breast cancer incidence rate among Massachusetts women was 136.3 per
100,000 and the mortality rate was 18.2 per 100,000.
Trends/Disparities
There was no significant change in breast cancer incidence or mortality between 2010 and 2014. Breast cancer
incidence was highest for White non-Hispanic women (142.3 per 100,000 population), followed by Black non-
Hispanic women (116.4 per 100,000 population).
Breast cancer mortality rates exceeded the state average (18.2 per 100,000 population) for Black non-Hispanic
women (19.7 per 100,000 population), followed by White non-Hispanic women (18.8 per 100,000 population).
While Black non-Hispanic women had a lower breast cancer incidence rate, they had the highest mortality
rate.
Figure 8.22
Age-Adjusted Breast Cancer Incidence and Mortality Rate, by Race/Ethnicity and Sex,
Massachusetts, 2010-2014
All Races White non-Hispanic Black non-Hispanic Asian non-Hispanic Hispanic0
50
100
150
200
136.3 142.3
116.4
90.2 88.4
18.2 18.8 19.77.9 10.5
Incidence Mortality
Age
-Adj
uste
d Ra
te p
er 1
00,0
00 P
opul
ation
42 | Massachusetts State Health Assessment

NOTE: MULTIPLE YEARS OF DATA WERE COMBINED FROM THE BRFSS FOR SUFFICIENT SAMPLE SIZE
Colorectal Cancer
Colorectal cancer was the third leading cause of cancer and was the third leading cause of cancer deaths
among both women and men in Massachusetts between 2010 and 2014, representing 7.8% of cancer
diagnoses among women and 8.3% of cancer diagnoses among men. Colorectal cancer also contributed to 8%
and 8.5% of cancer deaths in Massachusetts men and women, respectively. Risk factors for colorectal cancer
include age, race, personal or family history of colon or rectal cancer, personal history of other cancers,
personal history of other gastrointestinal issues, certain types of diet, physical inactivity, overweight and
obesity, smoking, heavy alcohol use, and inherited or genetic syndromes.121
The overall colorectal cancer incidence in Massachusetts from 2010 -2014 was 43.0 per 100,000 among men
and 33.7 per 100,000 among women. During the same period, the overall colorectal cancer mortality rate in
Massachusetts was 15.3 per 100,000 and 10.9 per 100,000 among men and women, respectively.
Trends/Disparities
The incidence rate for cancer of the colon decreased 2.4% annually for women in Massachusetts from 2010 to
2014. Colorectal cancer incidence was highest for Black non-Hispanic men (46.8 per 100,000 population),
followed by White non-Hispanic men (43.0 per 100,000 population), Black non-Hispanic women (37.2 per
100,000 population), and Hispanic men (36.2 per 100,000 population).
Figure 8.23
Age-Adjusted Colorectal Cancer Incidence and Mortality Rate, by Race/Ethnicity and Sex, Massachusetts,
2010-2014
43 | Massachusetts State Health Assessment

All Races White non-Hispanic Black non-Hispanic Asian non-Hispanic Hispanic0
10
20
30
40
50
60
43.0 43.046.8
34.5 36.2
15.3 15.6 17.2
8.7 10.4
33.7 33.737.2
28.5 27.2
10.9 10.813.9
8.9 9.2
Male (incidence) Male (mortality) Female (incidence) Female (mortality)
Age-
Adju
sted
Rat
e pe
r 100
,000
Pop
ulati
on
NOTE: MULTIPLE YEARS OF DATA WERE COMBINED FROM THE BRFSS FOR SUFFICIENT SAMPLE SIZE
Colorectal cancer mortality was significantly higher among Black non-Hispanic women than any other racial
group (13.9 per 100,000). Among men, however, mortality rates were higher among Black non-Hispanic men
(17.2 per 100,000) than either Asian (8.7 per 100,000) or Hispanic men (10.4 per 100,000). Racial disparities in
colorectal cancer mortality may reflect unequal access to timely, quality preventive care and cancer
treatment.
Prostate Cancer
Most prostate cancers grow slowly. In most men, the cancer never causes serious health issues. But in some
cases, prostate cancer can grow rapidly and spread outside the prostate and over time can cause death.
Prostate cancer was the most commonly diagnosed type of cancer in Massachusetts men from 2010 to 2014
and was the second leading cause of cancer deaths among men during this period. Nearly one-quarter (24.2%)
of cancer diagnoses among men and one in 10 (9.3%) of all cancer deaths among men were due to prostate
cancer in 2010-2014.
Risk factors for prostate cancer include race, family history and age.122 Approximately one in eight men (11.6%)
in the US will be diagnosed with prostate cancer at some point during their lifetime.123
44 | Massachusetts State Health Assessment
Between 2010 and 2014 the overall prostate cancer incidence rate among Massachusetts men was 114.4 per
100,000 and the mortality rate was 18.6 per 100,000.
Trends/ Disparities
From 2010 to 2014, the incidence of prostate cancer decreased 11.1% annually. The incidence of prostate
cancer for Black non-Hispanic men was 1.9 times that for White non-Hispanic men (198.5 versus 106.3 per
100,000 population). Prostate cancer incidence for Hispanic men (123.1 per 100,000 population) exceeded the
state average (114.4 per 100,000 population).
In 2010-2014, the prostate cancer mortality rate for Black non-Hispanic men was 2.1 times the state average
(39.8 versus 18.6 per 100,000).
45 | Massachusetts State Health Assessment

Figure 8.24
Age-Adjusted Prostate Cancer Incidence and Mortality Rate, by Race/Ethnicity, Massachusetts, 2010-2014
All Races White non-Hispanic Black non-Hispanic Asian non-Hispanic Hispanic0
50
100
150
200
250
114.4106.3
198.5
56.7
123.1
18.6 18.1
39.8
7.215.8
Incidence Mortality
Age
-Adj
uste
d Ra
te p
er 1
00,0
00 P
opul
ation
Melanoma
Skin cancer is the most common form of cancer in the United States. Skin cancers fall into three groups:
melanoma, basal cell carcinoma, and squamous cell carcinoma. Almost all (97%) skin cancers are due to basal
cell and squamous carcinomas. Melanoma is less common, accounting for only about 3% of skin cancers.
However, melanoma is more dangerous than basal and squamous cell cancers as it is more likely to spread to
other parts of the body if not caught early. Risk factors for melanoma include chronic sun exposure, indoor
tanning, fair skin, family history, previous skin cancer, and age. Other risk factors are repeated sunburns,
especially as a child, having a tendency to freckle or sunburn easily, and inability to tan.
Melanoma of the skin was the fifth leading cause of cancer among men and the sixth leading cause of cancer
among women in Massachusetts between 2010 and 2014 and it accounted for 3.7% of cancer diagnoses
among women and 4.9% of cancer diagnoses among men. It was also the 12th and 14th leading cause of
cancer death in Massachusetts men and women, respectively. In Massachusetts, melanoma is responsible for
2.1% of all cancer deaths among men and 1.3% of all cancer deaths among women.
46 | Massachusetts State Health Assessment

The overall incidence of melanoma in Massachusetts from 2010 -2014 was 25.5 per 100,000 among men and
17.3 per 100,000 among women. During the same period, the overall mortality rate for melanoma in
Massachusetts was 4.1 per 100,000 and 1.9 per 100,000 among men and women, respectively.
Trends/Disparities
The incidence of melanoma among White non-Hispanic men was 1.4 times that for White non-Hispanic
women (27.8 versus 19.3 per 100,000). For women, the incidence of melanoma decreased 4.6% annually from
2010 to 2014.
White non-Hispanic men had a melanoma mortality rate that was approximately double that for White non-
Hispanic women (4.5 versus 2.1 per 100,000). Melanoma cases were too few among racial/ethnic minorities to
generate age-adjusted incidence and mortality rates.
Figure 8.25
Age-Adjusted Melanoma Incidence and Mortality Rate, by Race/Ethnicity and Sex, Massachusetts, 2010-
2014
All Races White non-Hispanic Black non-Hispanic Asian non-Hispanic Hispanic0
10
20
30
40
25.527.8
* * *
4.1 4.5
* * *
17.319.3
* * *1.9 2.1
* * *
Male (incidence) Male (mortality) Female (incidence) Female (mortality)
Age-
Adju
sted
Rat
e pe
r 100
,000
Pop
ulati
on
NOTE: *AN AGE-ADJUSTED INCIDENCE RATE WAS NOT CALCULATED WHEN THERE WERE FEWER THAN 20
CASES
47 | Massachusetts State Health Assessment
Selected Resources, Programs, and Services
Following are selected resources, services, and programs that support the topics discussed in this chapter.
General
The Massachusetts Partnership for Health Promotion and Chronic Disease Prevention is a coalition of
statewide partners organized around seven priority objectives in Communities of Practice (CoPs). The
CoPs develop strategies and activities to address common risk factors for chronic disease. Content-
specific CoPs are featured below.
The Prevention and Wellness Trust Fund (PWTF) was established by the state legislature and
administered by the Massachusetts Department of Public Health for local partnerships to reduce rates
of chronic disease.
MDPH supports health system interventions and community-clinical linkages that focus on both the
general population and priority populations experiencing increased risk for chronic disease through
two CDC-funded initiatives, State Public Health Actions to Prevent and Control Diabetes, Heart Disease,
Obesity and Associated Risk Factors and Promote School Health and State and Local Public Health
Actions to Prevent Obesity, Diabetes, Heart Disease and Stroke.
The Mass in Motion Municipal Wellness and Leadership Program works with 27 partners and 60
municipalities to promote equitable food access.
Nutrition
There are strict regulatory standards for both the sale of foods and beverages that are part of the
federal reimbursable school lunch meal in public schools as well as those foods sold at other times.
The Healthy Incentives Program (HIP) works to subsidize SNAP purchases at farmer’s markets, farm
stands, mobile markets, and Community Supported Agriculture (CSA) farms.
There are four regional food banks and a related emergency food system (SNAP-Ed).
The Massachusetts Local Food Action Plan focuses on improving food access, food security, and health.
Children’s Health Watch’s Hunger Vital Signs, is a simple-to-use tool to screen individuals and their
households for food insecurity.
48 | Massachusetts State Health Assessment

By Executive Order, all foods purchased by state agencies who have dependent clients in the
Commonwealth must meet a set of nutrition standards based on the Dietary Guidelines for Americans.
The Massachusetts Food Trust Program, established in 2014, provides loans, grants, and technical
assistance to support new and expanded healthy food retailers and local food enterprises in low and
moderate income communities.
Physical Activity
The Healthy Transportation Compact integrates health into transportation decision-making and assists
with the development and implementation of MassDOT’s Complete Streets Funding Program.
The Massachusetts Partnership for Health Promotion and Chronic Disease Prevention’s Built
Environment Community of Practice helps implement Complete Streets Policies.
The Massachusetts Healthy Community Design Toolkit provides municipalities with tools and best
practices for local community design decisions that support more walkable and bikeable environments.
Tobacco Use and Exposure
The Massachusetts Tobacco Cessation and Prevention (MTCP) program works to reduce the health and
economic burden of tobacco use in the Commonwealth by helping current smokers to quit, preventing
young people from starting to use tobacco, and protecting all Massachusetts residents from
secondhand smoke.
MTCP funds the Massachusetts Smokers’ Helpline which provides free, confidential coaching to help
tobacco users quit. Coaching is available 24/7 by calling (800)QUIT NOW, or online at
www.KeepTryingMA.org.
The QuitWorks program, a free, evidence-based referral service that helps clinicians refer patients to
quit smoking programs and services.
MassHealth provides comprehensive cessation coverage including mediation and counseling to all
MassHealth members to ensure that tobacco use treatment is available, affordable, and easy to use.
Smoking Prevention
MTCP provides comprehensive statewide technical assistance to local boards of health and
community-based programs to increase capacity for tobacco policy and enforcement, community
49 | Massachusetts State Health Assessment

education, and youth engagement.
MTCP works directly with 186 municipal boards of health help to inform local tobacco regulations that
reduce youth exposure to tobacco industry targeting. These strategies include increasing the price of
tobacco, limiting the availability of tobacco, and decreasing youth exposure to tobacco products.
The 84, an MTCP statewide movement of high school students who work to educate peers and adults
about the tobacco industry’s marketing tactics, creates local and statewide change to reduce the
influence of tobacco on communities, and promotes social norms against tobacco use.
Second Hand Smoke
MTCP provides the Smoke-free Workplace Law Complaint line (800)992-1895 for residents to report
violations of the Commonwealth’s smoke-free workplace law.
The Massachusetts Smoke-Free Housing Project’s toll-free information line (877)830-8795 provides
free information and technical assistance to landlords and condo associations that are interested in
implementing a smoke-free rule and provides tenants with information about their rights to a smoke-
free environment and referrals to organizations that may be able to help.
MTCP technical assistance providers and local community partnership programs work closely with
public housing authorities to develop and implement smoke-free policies.
Obesity
State tax credit for small businesses who offer a wellness program to their employees.
The Prevention and Wellness Trust Fund supports the adoption of workplace wellness programs.
Mandatory BMI screenings take place annually in public school grades 1, 4, 7, and 10.
Cardiovascular Disease
All nine community partnerships in the Prevention and Wellness Trust Fund (PWTF) included strategies
to address hypertension in their population.
The Massachusetts Paul Coverdell National Acute Stroke Program (Coverdell) strives to decrease the
rate of premature death and disability from stroke in collaboration with emergency medical services,
hospitals and post-acute care providers in the Commonwealth.
50 | Massachusetts State Health Assessment

The Face, Arm, Speech and Time (FAST) media campaign targets communities with higher incidence of
stroke by providing information about the signs and symptoms of stroke and the need to seek medical
care immediately by dialing 911.
Diabetes
The State Diabetes Prevention Network to increase awareness of prediabetes and the evidence-based
Diabetes Prevention Program among residents and health care providers.
The Prevention and Wellness Trust Fund program focuses on improved identification, management
and referral of patients with prediabetes and diabetes for the purposes of prevention and self-
management.
Collaboration with New England Quality Improvement Network and Quality Improvement
Organizations (NE QIN-QIO) to sustain and expand diabetes self-management education.
Chronic Lower Respiratory Disease
The Massachusetts Department of Housing and Community Development and US Office of Housing and
Urban Development provides guidance to public housing authorities on adopting smoke-free policies.
Adult Asthma
The Reducing Older Adult Asthma Disparities (ROAAD) study to improve asthma management and
decrease health care utilization among older adults with poorly controlled asthma in Lowell, MA.
Pediatric Asthma
The Prevention and Wellness Trust Fund (PWTF) forges local partnerships to address pediatric asthma
in multiple settings.
The Massachusetts Asthma Prevention and Control Program (MAPCP) implements standardized
training, technical assistance and assessment protocols.
The Promoting Policies for Asthma in Local Communities (PALC) project provides technical assistance
and support protect the health of children with asthma.
The Logan Airport Health Study Trust, a collaboration among MassPort (Massachusetts Port Authority),
the Massachusetts League of Community Health Centers, and five community health centers in
51 | Massachusetts State Health Assessment

communities with increased probable rates of asthma (i.e. Chelsea, East Boston/Winthrop,
Charlestown, the North End, and South Boston).
COPD
The Reducing Older Adult Asthma Disparities (ROAAD) study to improve asthma and COPD
management and decrease health care utilization among older adults with COPD in Lowell, MA.
Tobacco treatment or cessation services to reduce the burden of and management of COPD .
All Cancers
Several collaborative partnerships focused on eliminating cancer disparities and promoting health
equity for the most common cancers.
The Massachusetts Comprehensive Cancer Prevention and Control Network (MCCPCN), a statewide
partnership that resulted in a State Cancer Plan focused on action to reduce cancer risk, find cancer
earlier, improve and increase access to quality cancer care, and improve the health and well-being of
cancer survivors.
Lung Cancer
The Lung Cancer Workgroup to provide support to existing and emerging lung cancer screening
programs across the state to ensure they follow screening guidelines for lung cancer by the US
Preventative Services Task Force.
Breast Cancer
The Breast Cancer Equity Coalition (comprised of city and state health department representatives,
patient navigators, public health policy makers, researchers, oncology and primary-care clinicians,
advocates, and patients) to work with health centers to implement evidence-based interventions
among patient navigators and community health workers to assist patients in navigating potential
barriers to care.
Colorectal Cancer
52 | Massachusetts State Health Assessment

A Massachusetts Division of Prevention and Wellness (DPW) program that works with the
Massachusetts League of Community Health Centers (MLCHC) to improve the rate of colorectal cancer
screening in federally qualified health centers (FQHCs).
The Massachusetts Comprehensive Cancer Prevention and Control Network (MCCPCN) state cancer
plan for 2017-2022 to help meet a national goal of 80% of people screened for colorectal cancer by
2018.
The Massachusetts Partnership for Health Promotion and Chronic Disease Prevention’s Clinical
Preventive Services and Population Health Management Community of Practice has a goal of
increasing colorectal cancer screening rates by 5% by 2017. In addition, they support provider use and
recommendation of home-based stool testing through professional development opportunities and
increased public awareness campaigns specific to fecal testing as a colorectal cancer screening option.
Prostate Cancer
The Prostate Cancer Work Group developed information for men and provider’s about prostate cancer
screening guidelines and shared decision making. The workgroup also developed a Continuing Medical
Education (CME) course on Prostate Cancer and Primary Care in collaboration with the Massachusetts
Medical Society.
53 | Massachusetts State Health Assessment

Melanoma
Funding sunscreen dispensers in public and recreational areas and a sun safety and melanoma
awareness program.
Legislation was implemented in 2016 that bans anyone under the age 18 in Massachusetts from using
or operating a tanning facility.
Health departments across Massachusetts have increased the number of school age children who
follow protective measures by conducting skin cancer education and outreach to schools, parents, and
teachers.
Major hospitals are promoting sun protective measures through intensive community outreach at
beaches and wide dissemination of written educational materials.
54 | Massachusetts State Health Assessment

References
55 | Massachusetts State Health Assessment

1MDPH, Massachusetts Deaths 2014. Available at: http://www.mass.gov/eohhs/docs/dph/research-epi/death-data/death-report-2014.pdf. Accessed July 17, 2017.2 Structural racism and health inequities in the USA: evidence and interventions Bailey, Zinzi D et al. The Lancet, Volume 389 , Issue 10077, 1453-1463.3 Elsheikh E, Barhoum N. Haas Institute for a Fair and Inclusive Society. Structural Racialization and Food Insecurity. Available at: http://haasinstitute.berkeley.edu/sites/default/files/Structural%20Racialization%20%20%26%20Food%20Insecurity%20in%20the%20US-%28Final%29.pdf. Accessed June 22, 2017. 4 National Center for Health Statistics. Health, United States, 2015: With Special Feature on Racial and Ethnic Health Disparities. Hyattsville, MD. 2016.5 Roux A, Merkin S, Arnett D, et al. Neighborhood of Residence and Incidence of Coronary Heart Disease. New England Journal of Medicine. July 2001. 345:99-106.6 Micha, R et al. Association Between Dietary Factors and Mortality From Heart Disease, Stroke, and Type 2 Diabetes in the United States. JAMA. 2017;317(9):912-924. doi:10.1001/jama.2017.0947.7 Ibid8 Centers for Disease Control. Factors that Contribute to Health Disparities in Cancer. Available at: https://www.cdc.gov/cancer/healthdisparities/basic_info/challenges.htm. Accessed July 20, 2017.9 Hung HC, et al. Fruit and vegetable intake and risk of major chronic disease. J Natl Cancer Inst. 2004; 96(21): 1577-84.10 Bazzano, LA, et al. Intake of fruit, vegetables, and fruit juices and risk of diabetes in women. Diabetes Care. 2008; 31(7): 1311-7.11 Ludwig DS, Peterson KE, Gortmaker SL. Relation between consumption of sugar-sweetened drinks and childhood obesity: a prospective, observational analysis. Lancet. 2001; 357: 505–508.12 Bell J, et al. Policy Link and The Food Trust. Available at: http://thefoodtrust.org/uploads/media_items/access-to-healthy-food.original.pdf. Accessed June 22, 2017.13Centers for Disease Control. Healthy Places. Available at: https://www.cdc.gov/healthyplaces/healthtopics/healthyfood_environment.htm. Accessed July 20, 201714 Ibid15 Rao M, et al. Do healthier foods and diet patterns cost more than less healthy options? BMJ Open [serial online]. 2013; 3: e004277. doi: 10.1136/bmjopen-2013-004277.16 De Cuba SE et al. Food Insecurity Among Children in Massachusetts. New England J of Pub Policy. 2013; 25(1): Article 9.17 Centers for Disease Control and Prevention. Transportation and Food Access. Available at: https://www.cdc.gov/healthyplaces/healthtopics/healthyfood/transportation.htm. Accessed June 22, 2017. 18 Elsheikh E, Barhoum N. Haas Institute for a Fair and Inclusive Society. Structural Racialization and Food Insecurity. Available at: http://haasinstitute.berkeley.edu/sites/default/files/Structural%20Racialization%20%20%26%20Food%20Insecurity%20in%20the%20US-%28Final%29.pdf. Accessed June 22, 2017. 19 Massachusetts Department of Public Health, MA BRFSS Report 2015. Available at: http://www.mass.gov/eohhs/gov/departments/dph/programs/admin/dmoa/health-survey/brfss/statewide-reports-and-presentations.html. Accessed June 22, 2017.20 MDPH, Massachusetts Youth Health Survey, 2015.21 United States Department of Agriculture. Food Access Research Atlas. Available at: https://www.ers.usda.gov/data-products/food-access-research-atlas/go-to-the-atlas/. Accessed June 22, 2017.22 ACS 2013 5-year estimates. Households with Food Stamp/SNAP benefits in the past 12 months. Available at: https://factfinder.census.gov/faces/tableservices/jsf/pages/productview.xhtml?pid=ACS_15_5YR_S2201&prodType=table. Accessed June 22, 2017. 23 United States Department of Agriculture. SNAP Community Characteristics- Massachusetts. Available at: https://www.fns.usda.gov/ops/snap-community-characteristics-massachusetts. Accessed June 22, 2017.24 Tableau. Massachusetts SNAP Gap. Available at: https://public.tableau.com/profile/food.bank.of.western.ma#!/vizhome/MHandSNAP/Story1. Accessed June 22, 2017.

25 Project Bread. The 2016 Status Report on Hunger in Massachusetts. Available at: http://www.projectbread.org/get-the-facts/reports-and-studies/. Accessed June 22, 2017.26 GBFB. GBFB FY16 Impact. 27 Worcester County Food Bank. Hunger in Worcester County. Available at: https://foodbank.org/learn-more/hunger-in-worcester-county/. Accessed June 22, 2017. 28 The Food Bank of Western Massachusetts. Local Hunger Facts. Available at: https://www.foodbankwma.org/learn/local-hunger-facts/. Accessed June 22, 2017. 29 The Greater Boston Food Bank. GBFB FY16 Impact. Available at: https://www.gbfb.org/our-impact/our-results/gbfb-impact/?_ga=2.55944802.894750628.1497635496-115627245.1497635496. Accessed June 22, 2017. 30 The Greater Boston Food Bank. Hunger in Eastern Massachusetts 2014. Available at: http://gbfb.org/wp-content/uploads/2016/10/hunger-eastern-ma-2014.pdf. Accessed June 22, 2017. 31 Warburton, Darren ER, Crystal Whitney Nicol, and Shannon SD Bredin. Health benefits of physical activity: the evidence. Canadian medical association journal. 2006: 801-809.32 Carlson, Susan A., et al. Inadequate physical activity and health care expenditures in the United States. Progress in cardiovascular diseases. 2015: 315-323.33 Wilson-Frederick, Shondelle M., et al. Examination of race disparities in physical inactivity among adults of similar social context. Ethnicity & disease. 2014: 363.34 Li, Kelin, and Ming Wen. Racial and ethnic disparities in leisure-time physical activity in California: Patterns and mechanisms. Race and social problems. 2013: 147-156.35 Centers for Disease Control and Prevention. 2008 Physical Activity Guidelines for Americans. Available at: https://www.cdc.gov/physicalactivity/basics/index.htm. Accessed on June 22, 2017.36 Durand CP, Andalib M, Dunton GF, Wolch J, Pentz MA. A Systematic Review of Built Environment Factors Related to Physical Activity and Obesity Risk: Implications for Smart Growth Urban Planning. Obes Rev. 2011:12(501).37 American Planning Association. (2007.) “How Cities Use Parks to Improve Public Health.” Available at: https://www.planning.org/cityparks/briefingpapers/physicalactivity.htm. Accessed July 17, 2017.38 Frank, Lawrence D., et al. Linking objectively measured physical activity with objectively measured urban form: findings from SMARTRAQ. American journal of preventive medicine 2005: 117-125.39 Sallis, James F., and Karen Glanz. Physical activity and food environments: solutions to the obesity epidemic. Milbank Quarterly 2009: 123-154.40 de Nazelle A, Nieuwenhuijsen MJ, Antó JM, et al. Improving health through policies that promote active travel: a review of evidence to support integrated health impact assessment. Environ Int. 2011; 37(4):766-77.41 Frank, Lawrence D., Thomas L. Schmid, James F. Sallis, James Chapman, and Brian E. Saelens. Linking objectively measured physical activity with objectively measured urban form: findings from SMARTRAQ. American journal of preventive medicine 2005: 117-125.42 Reynolds, Conor, et al. Active Transportation in Urban Areas: Exploring Health Benefits and Risks. National Collaborating Centre for Environmental Health. Available at: http://www.ncceh.ca/sites/default/files/Active_Transportation_in_Urban_Areas_June_2010.pdf. Accessed on June 22, 2017.43 Parks, S. E., Robyn A. Housemann, and Ross C. Brownson. Differential correlates of physical activity in urban and rural adults of various socioeconomic backgrounds in the United States. Journal of Epidemiology & Community Health 2003: 29-35.44 Gordon-Larsen, Penny, et al. Inequality in the built environment underlies key health disparities in physical activity and obesity. Pediatrics 2006: 417-424.45 Pray, Leslie, ed. Physical Activity: Moving Toward Obesity Solutions: Workshop Summary. National Academies Press. 2015.46 McGinnis, J.M. Actual causes of death, 1990–2010. Presentation at the Workshop on Determinants of Premature Mortality, September 18, National Research Council, Washington, DC. 2013.47 Larsen BA, Pekmezi D, Marquez B, Benitez TJ, Marcus BH. Physical activity in Latinas: social and environmental influences. Women’s health (London, England). 2013;9(2):10.2217/whe.13.9. doi:10.2217/whe.13.9.

48 MDPH, MA YRBS Report 2015. Available at: http://www.mass.gov/eohhs/docs/dph/behavioral-risk/youth-health-risk-report-2015.pdf. Accessed June 12, 2010.49 Centers for Disease Control and Prevention, "Best Practices for Comprehensive Tobacco Control - 2014," US Department of Health and Human Services, Centers for Disease Control and Prevention, National Center for Chronic Disease Prevention and Health Promotion, Office on Smoking and Health, Atlanta, 2014.50 The Health Consequences of Smoking—50 Years of Progress: A Report of the Surgeon General https://www.surgeongeneral.gov/library/reports/50-years-of-progress/exec-summary.pdf, accessed July 21, 2017.51 Benowitz, NL. Nicotine Addiction. N Engl J Med 2010; 362:2295-2303. June 17, 2010. Available at: http://www.nejm.org/doi/full/10.1056/NEJMra0809890. 52 Centers for Disease Control and Prevention, "Best Practices for Comprehensive Tobacco Control - 2014," US Department of Health and Human Services, Centers for Disease Control and Prevention, National Center for Chronic Disease Prevention and Health Promotion, Office on Smoking and Health, Atlanta, 2014.53 “The Toll of Tobacco in Massachusetts.” Campaign for Tobacco-free Kids. Updated March 1, 2017. Available at: https://www.tobaccofreekids.org/facts_issues/toll_us/massachusetts. Accessed June 12, 2017.54 Centers for Disease Control and Prevention, "Best Practices for Comprehensive Tobacco Control - 2014," US Department of Health and Human Services, Centers for Disease Control and Prevention, National Center for Chronic Disease Prevention and Health Promotion, Office on Smoking and Health, Atlanta, 2014.55 MDPH, Massachusetts Behavioral Risk Factor Surveillance System, 2015.56 MDPH, Massachusetts Adults: Who Smokes Factsheet”. Massachusetts Tobacco Cessation and Prevention Program. Available at: http://www.mass.gov/eohhs/gov/departments/dph/programs/mtcp/data-about-tobacco-use-in-mass-reports-and-fact-sheets.html. Accessed July 17, 2017.57 MDPH, 2007 Massachusetts Behavioral Risk Factor Surveillance System.58 Centers for Disease Control and Prevention, "Best Practices for Comprehensive Tobacco Control - 2014," US Department of Health and Human Services, Centers for Disease Control and Prevention, National Center for Chronic Disease Prevention and Health Promotion, Office on Smoking and Health, Atlanta, 2014.59 Campaign for Tobacco Free Kids, Electronic Cigarettes and Youth (2015). Available at https://www.tobaccofreekids.org/research/factsheets/pdf/0382.pdf. Accessed July 17, 2017.60 Electronic Nicotine Delivery Produce Use Among High School Youth in Massachusetts”. Massachusetts Tobacco Cessation & Prevention Program. Available at:http://www.mass.gov/eohhs/docs/dph/tobacco-control/end-use-hgh-school.pdf Accessed July 12, 2017.61 Pampel FC, Krueger PM, Denney JT. Socioeconomic Disparities in Health Behaviors. Annual review of sociology. 2010;36:349-370. doi:10.1146/annurev.soc.012809.102529.62 Link BG, Phelan J. Social conditions as fundamental causes of disease. J. Health Soc. Behav. 1995:80–94. Extra Issue.63 Hiscock, R., Bauld, L., Amos, A., Fidler, J. A., & Munafò, M. (2012). Socioeconomic status and smoking: a review. Annals of the New York Academy.64 “Secondhand Smoke Exposure”. Massachusetts Tobacco Cessation & Prevention Program. Massachusetts Department of Public Health. Available at: http://www.mass.gov/eohhs/gov/departments/dph/programs/mtcp/secondhand-smoke/secondhand-smoke.html. Accessed June 12, 2017.65 “Non-smoking adults exposed to secondhand smoke” Massachusetts Fact Sheet. Massachusetts Department of Public Health 2015. Available at: http://www.mass.gov/eohhs/docs/dph/tobacco-control/adults-exposed-to-secondhand-smoke.pdf. Accessed June 12, 2017.66 “Secondhand Smoke at Home” Factsheet. Massachusetts Tobacco Cessation & Prevention Program. Available online at http://www.mass.gov/eohhs/docs/dph/tobacco-control/secondhand-smoke-at-home.pdf67 “Non-smoking adults exposed to secondhand smoke” Massachusetts Fact Sheet. Massachusetts Department of Public Health 2015. Available at: http://www.mass.gov/eohhs/docs/dph/tobacco-control/adults-exposed-to-secondhand-smoke.pdf. Accessed June 12, 2017.68 Centers for Disease Control and Prevention. Adult Obesity Facts. Available at: https://www.cdc.gov/obesity/data/adult.html. Accessed July 20, 2017.69 [National Institutes for Health. Clinical Guidelines on the Identification, Evaluation, and Treatment of Overweight and Obesity in Adults (1998). Available at:

https://www.nhlbi.nih.gov/files/docs/guidelines/obesity_guidelines_archive.pdf. Accessed July 20, 2017.70 Ibid71 May, Ashleigh et al. Centers for Disease Control and Prevention. Health Disparities and Inequalities Report: Obesity Supplement (2013). Available at: https://www.cdc.gov/mmwr/preview/mmwrhtml/su6203a20.htm?s_cid=su6203a20_w. Accessed July 20, 2017.72 Centers for Disease Control and Prevention. Childhood Obesity Facts. Available at: https://www.cdc.gov/healthyschools/obesity/facts.htm. Accessed July 21, 2017.73 May, Ashleigh et al. Centers for Disease Control and Prevention. Health Disparities and Inequalities Report: Obesity Supplement (2013). Available at: https://www.cdc.gov/mmwr/preview/mmwrhtml/su6203a20.htm?s_cid=su6203a20_w. Accessed July 20, 2017.74 Pan L, Freedman DS, Sharma AJ, et al. Trends in Obesity Among Participants Aged 2–4 Years in the Special Supplemental Nutrition Program for Women, Infants, and Children — United States, 2000, 2004, 2010, 2014. MMWR Morb Mortal Wkly Rep 2016;65:1256–1260. DOI: http://dx.doi.org/10.15585/mmwr.mm6545a2. 75 Centers for Disease Control and Prevention. National Center for Chronic Disease Prevention and Health Promotion, Division of Nutrition, Physical Activity, and Obesity. Data, Trend and Maps [online], Years 2008, 2012. Available at: https://www.cdc.gov/nccdphp/dnpao/data-trends-maps/index.html. Accessed June 20, 2017.76Results from the Body Mass Index Screening in Massachusetts Public School Districts, 2015 (May, 2017). 77 Li, W., Buszkiewicz, J. H., Leibowitz, R. B., Gapinski, M. A., Nasuti, L. J., & Land, T. G. (2015). Declining Trends and Widening Disparities in Overweight and Obesity Prevalence Among Massachusetts Public School Districts, 2009–2014. American Journal of Public Health, e1–e7. https://doi.org/10.2105/AJPH.2015.302807.78 Centers for Disease Control and Prevention. Fast Stats: Heart Disease. Available at: https://www.cdc.gov/nchs/fastats/heart-disease.htm. Accessed June 20, 2017.79 Centers for Disease Control and Prevention. Heart Disease Facts. Available at: https://www.cdc.gov/heartdisease/facts.htm. Accessed June 29, 2017.80 Centers for Disease Control and Prevention. Stroke Facts. Available at: https://www.cdc.gov/stroke/facts.htm. Accessed June 29, 2017.81 Mendis, S. & Banerjee, A. (2010) Cardiovascular disease: equity and social determinants.World Health Organization: Equity, Social Determinants and Public Health Programmes, Chapter 3, pp. 31-40.82 Ibid83 Brownson, Ross C., et al. "Environmental and policy determinants of physical activity in the United States." American journal of public health 91.12 (2001): 1995-2003.84 VanItallie, Theodore B. "Stress: a risk factor for serious illness." Metabolism 51.6 (2002): 40-45.85 American Medical Association. Health Threats From High Blood Pressure. Available at: http://www.heart.org/HEARTORG/Conditions/HighBloodPressure/LearnHowHBPHarmsYourHealth/Health-Threats-From-High-Blood-Pressure_UCM_002051_Article.jsp#.WVVP0esrKM8. Accessed June 29, 2017.86 Center for Health Information and Analysis (2014). Case Mix Hospitalization Data.87 Roux A, Merkin S, Arnett D, et al. Neighborhood of Residence and Incidence of Coronary Heart Disease. New England Journal of Medicine. July 2001. 345:99-106.88 Ostchega Y, Hughes J, Wright J, McDowell M, Louis T. Are Demographic Characteristics, Health Care Access and Utilization, and Comorbid Conditions Associated With Hypertension Among US Adults? American Journal of Hypertension. February 2008. 21(2):159-165.89 Center for Health Information and Analysis (2014). Case Mix Hospitalization Data.90 Krumholz H, Parent E, Tu N. Readmission After Hospitalization for Congestive Heart Failure Among Medicare Beneficiaries. Archives of Internal Medicine. January 1997. 157(1):99-104.91 Heo S, Lennie T, Okoli C, Moser D. Quality of Life in Patients With Heart Failure: Ask the Patients. Heart & Lung: The Journal of Acute and Critical Care. September 2009. 38(2):100–108.92 Center for Health Information and Analysis (2014). Case Mix Hospitalization Data.93 Telfair, J. & Shelton, T.L. (Sept/Oct 2012) Educational Attainment as a Social Determinant of Health.North Carolina Medical Journal, Vol 73 (5), pp. 358-365.94 Center for Health Information and Analysis (2014). Case Mix Hospitalization Data.

95 Centers for Disease Control and Prevention. National Diabetes Statistics Report: Estimates of Diabetes and Its Burden in the United States, 2014. Atlanta, GA: US Department of Health and Human Services; 2014.96 Ibid97 Ibid98 Center for Health Information and Analysis (2014). Case Mix Hospitalization Data.99 Kochanek KD, Murphy SL, Xu JQ, Tejada-Vera B. Deaths: Final data for 2014. National vital statistics reports. 2016;; vol 65( no 4). Hyattsville, MD: National Center for Health Statistics. 2016.100 National Heart, Lung, and Blood Institute; National Asthma Education and Prevention Program. Expert Panel Report 3: Guidelines for the Diagnosis and Management of Asthma - Full Report, 2007. NIH Pub. No. 07-4051. Bethesda, MD: US 2007. Available at: http://www.nhlbi.nih.gov/guidelines/asthma/asthgdln.htm. Accessed July 20, 2017.101 Ibid102 Massachusetts Health Policy Commission. 2014 Cost trends report. January 2015. Available at: http://www.mass.gov/anf/budget-taxes-and-procurement/oversight-agencies/health-policy-commission/2014-cost-trends-report.pdf. Accessed July 20, 2017. 2014 103 Ibid104 Wright RJ, Epidemiology of stress and asthma: from constricting communities and fragile families to epigenetics, Imunol All Clin N Am. 2011;31:19-39.105 Tarlo SM, Balmes J, Balkissoon R, et al. Diagnosis and management of work-related asthma: American College Of Chest Physicians Consensus Statement. Chest. 2008;134:1S–41S.106 Shofer S, Haus BM, Kuschner WG. Quality of occupational history assessments in working age adults with newly diagnosed asthma. Chest. 2006;130:455-462.107 Massachusetts Department of Public Health (2012-2014). Behavioral Risk Factor Surveillance System Adult Asthma Call-back Survey.108 MDPH, Asthma Prevalence Report 2017 (under MDPH review).109 MDPH, Burden of Asthma in Massachusetts, 2009.110 MDPH, Pediatric Asthma Bulletin, 2016.111 Centers for Disease Control and Prevention. Chronic Obstructive Pulmonary Disease (COPD). Available at: https://www.cdc.gov/copd/index.html.https://www.cdc.gov/copd/index.html#1. Accessed July 12, 2017. 112 Ibid 113 American Cancer Society. Colorectal Cancer Facts & Figures 2017-2019. Available at: https://www.cancer.org/content/dam/cancer-org/research/cancer-facts-and-statistics/colorectal-cancer-facts-and-figures/colorectal-cancer-facts-and-figures-2017-2019.pdf. Accessed July 20, 2017.114 National Cancer Institute. Obesity. Available at: https://www.cancer.gov/about-cancer/causes-prevention/risk/obesity. Accessed July 20, 2017.115 Stewart B. W. and Kleihues P. (Eds): World Cancer Report. IARC Press. Lyon 2003.116 World Cancer Research Fund and American Institute for Cancer Research. Food, nutrition, physical activity and the prevention of cancer: a global perspective.Washington, DC:World Cancer Research Fund and American Institute for Cancer Research; 2007.117 Zheng S; Ren ZJ; Heineke J; Geissler KH. Reductions in Diagnostic Imaging with High Deductible Health Plans. Medical Care. 2016; 54(2): 110–117. 118 National Cancer Institute. Available at: https://seer.cancer.gov/statfacts/html/lungb.html. Accessed July 20, 2017.119 National Cancer Institute. Available at: https://www.cancer.gov/about-cancer/causes-prevention/risk. Accessed July 20, 2017.120 National Cancer Institute. Breast Cancer Treatment (PDQ®)–Patient Version. Available at: https://www.cancer.gov/types/breast/patient/breast-treatment-pdq. Accessed July 20, 2017.121 American Cancer Society. What Is Colorectal Cancer? Available at: https://www.cancer.org/cancer/colon-rectal-cancer/about/what-is-colorectal-cancer.html. Accessed July 21, 2017.122 American Cancer Society. Prostate cancer. Available at: https://www.cancer.org/cancer/prostate-cancer.html. Accessed July 21, 2017.

123 National Cancer Institute. Cancer Stat Facts: Prostate Cancer. Available at: https://seer.cancer.gov/statfacts/html/prost.html. Accessed July 21, 2017.


![[XLS]upmsp.edu.in · Web view92.8 91.8 91.8 90 89.6 89.2 88.4 88 87.8 87.4 87.2 86.8 86.8 86.8 86.8 86.8 86.8 86.6 86.6 86.4 86.2 86.2 85.8 85.8 85.4 85.4 85.4 85.4 85.2 85.2 85 85](https://img.pdfslide.net/doc/110x75/5ae6d2da7f8b9ae1578e34e1/xlsupmspeduin-view928-918-918-90-896-892-884-88-878-874-872-868-868.jpg)


![¥16,200 - heiandoh.co.jpheiandoh.co.jp/heiando_catalog.pdf · 盛籠[コーヒー] ¥16,200 盛籠[麩] ¥16,200 ¥24,840 ¥18,900 ¥13,500 ¥10,800~¥16,200. 消費税込](https://img.pdfslide.net/doc/110x75/5c5c4ca409d3f263368d290b/16200-16200-16200-24840-18900.jpg)


![[XLS]upmsp.edu.in · Web view91.6 91.4 91 90.4 90.4 90.2 90.2 90.2 90 89.6 89 89 88.6 88.2 88.2 87.8 87.4 87.4 87.2 87 86.8 86.6 86.6 86.4 86.2 86.2 86 85.8 85.8 85.6 85.4 85.4 85.2](https://img.pdfslide.net/doc/110x75/5ac03a7f7f8b9a4e7c8ba3b5/xlsupmspeduin-view916-914-91-904-904-902-902-902-90-896-89-89-886-882.jpg)