Embed Size (px)
Citation preview
Chapter 8 Performance Management
and Evaluation
Fall 2007
Crosson
Use only with permission of Susan Crosson
Learning Objectives:
Management Responsibility, Accountability, and PerformanceResponsibility centers and performance measuresEnd-to-end accountability with the balanced scorecardLinking executive compensation and performance
Use only with permission of Susan Crosson
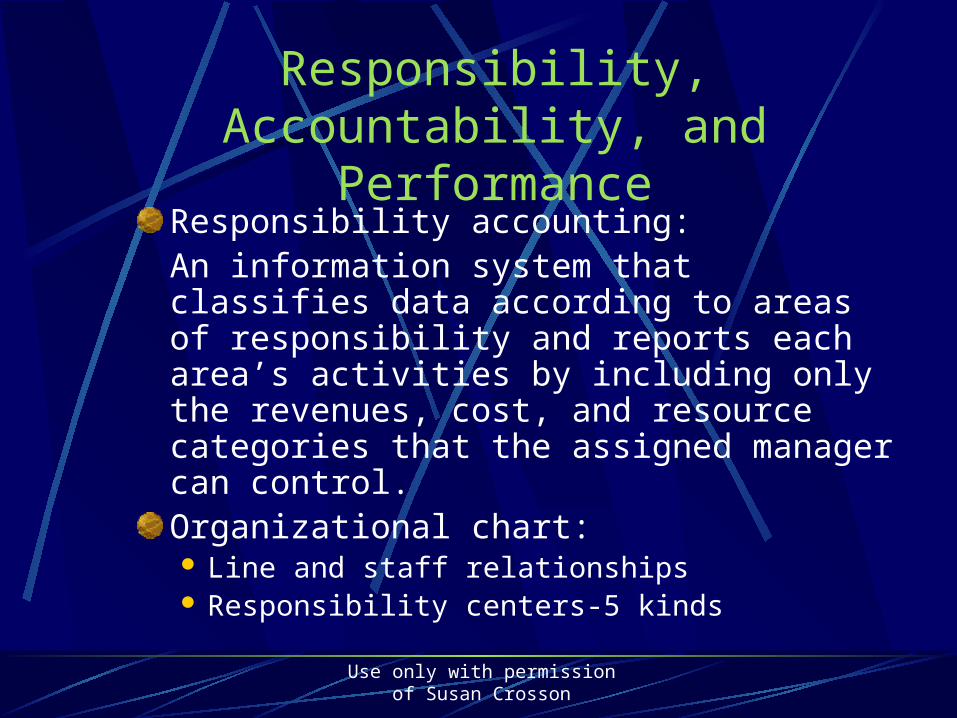
Responsibility, Accountability, and Performance
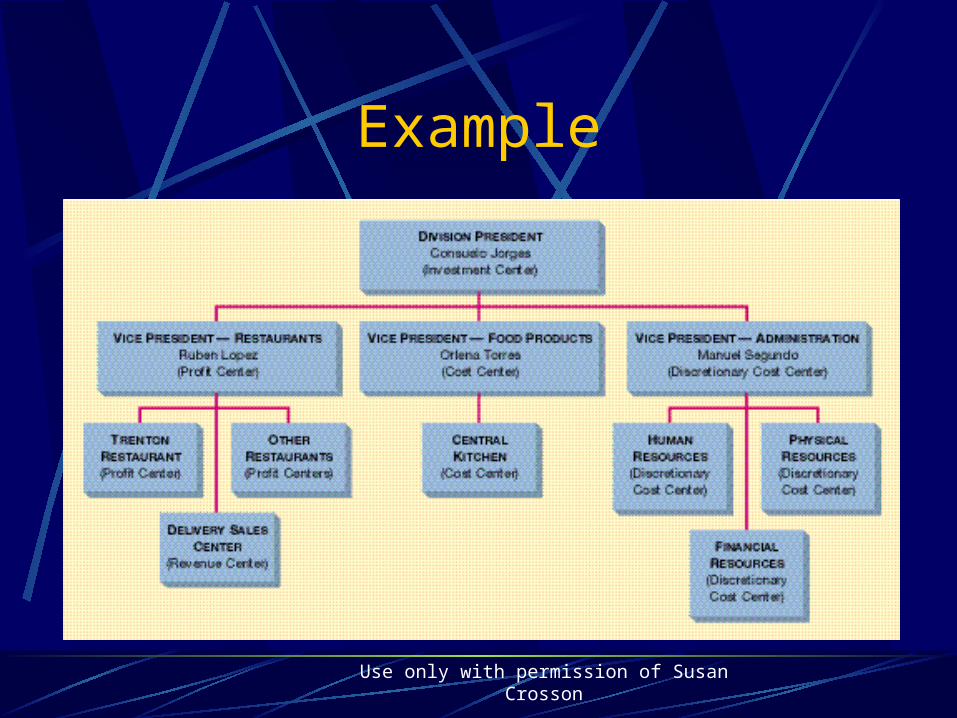
Responsibility accounting:An information system that classifies data according to areas of responsibility and reports each area’s activities by including only the revenues, cost, and resource categories that the assigned manager can control.Organizational chart: Line and staff relationships Responsibility centers-5 kinds
Use only with permission of Susan Crosson
Example
Use only with permission of Susan Crosson
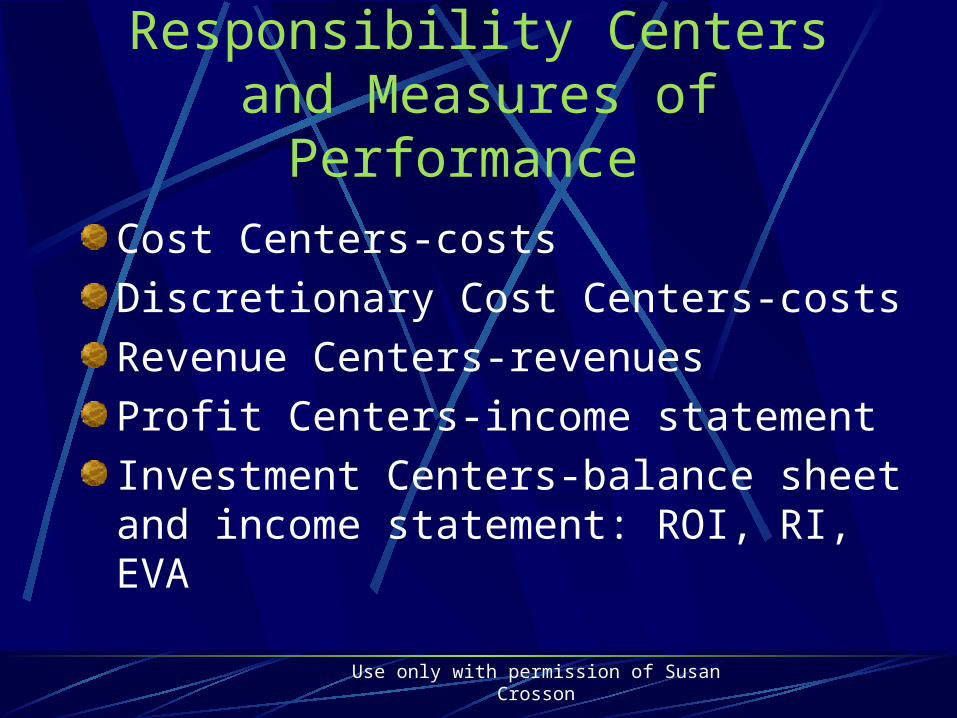
Responsibility Centers and Measures of Performance
Cost Centers-costs
Discretionary Cost Centers-costs
Revenue Centers-revenues
Profit Centers-income statement
Investment Centers-balance sheet and income statement: ROI, RI, EVA
Use only with permission of Susan Crosson
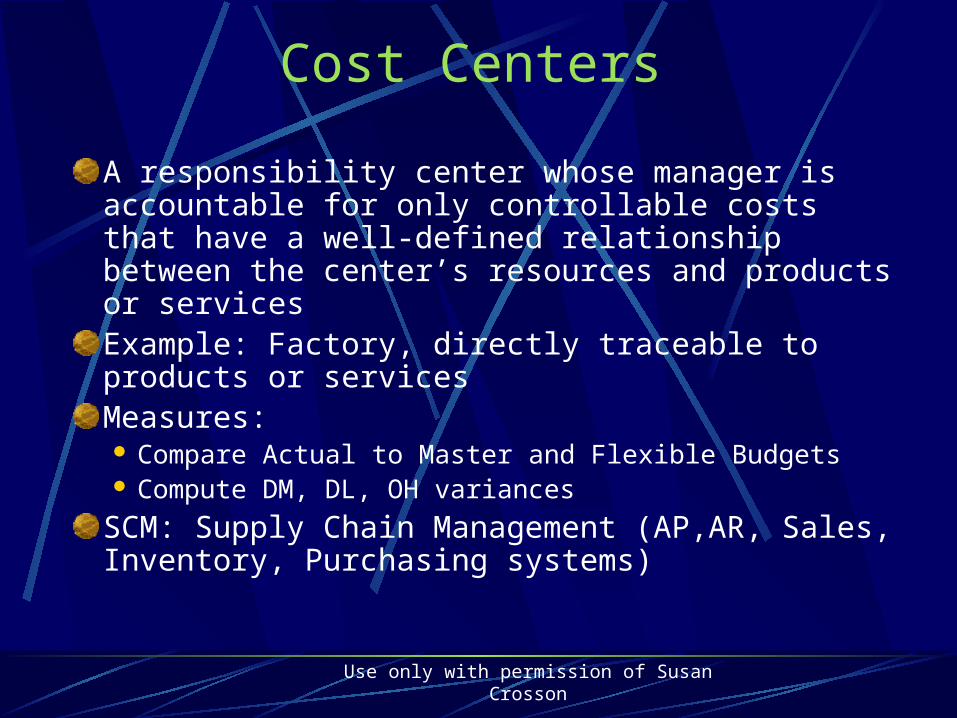
Cost Centers
A responsibility center whose manager is accountable for only controllable costs that have a well-defined relationship between the center’s resources and products or servicesExample: Factory, directly traceable to products or servicesMeasures: Compare Actual to Master and Flexible Budgets Compute DM, DL, OH variances
SCM: Supply Chain Management (AP,AR, Sales, Inventory, Purchasing systems)
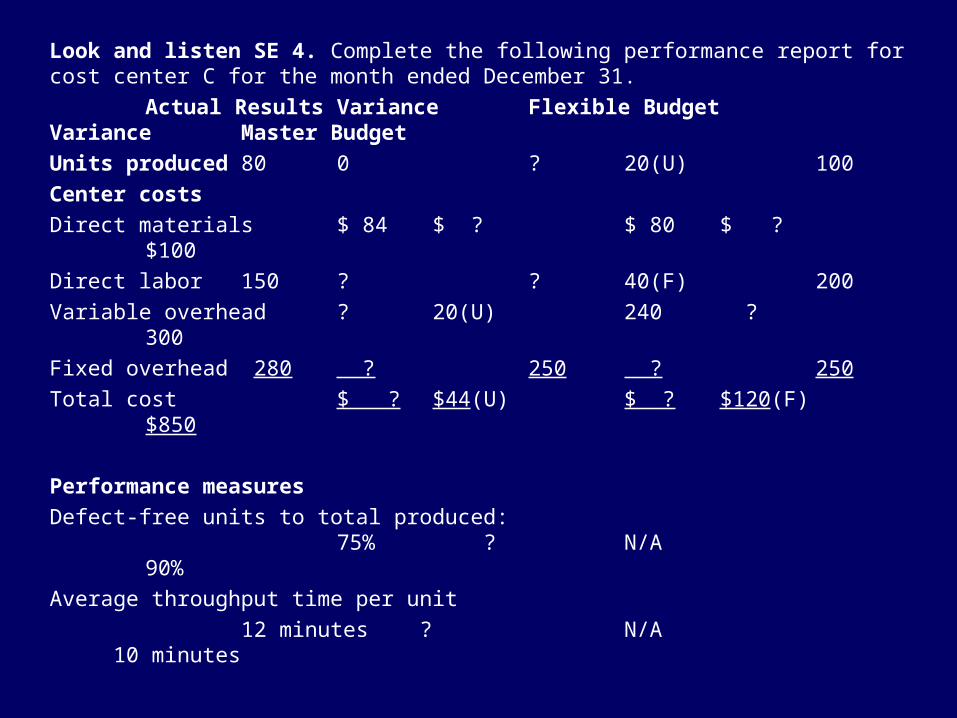
Look and listen SE 4. Complete the following performance report for cost center C for the month ended December 31.
Actual Results Variance Flexible Budget Variance Master Budget
Units produced 80 0 ? 20(U) 100
Center costs
Direct materials $ 84 $ ? $ 80 $ ? $100
Direct labor 150 ? ? 40(F) 200
Variable overhead ? 20(U) 240 ? 300
Fixed overhead 280 ? 250 ? 250
Total cost $ ? $44(U) $ ? $120(F) $850
Performance measures
Defect-free units to total produced:75% ? N/A 90%
Average throughput time per unit
12 minutes ? N/A 10 minutes
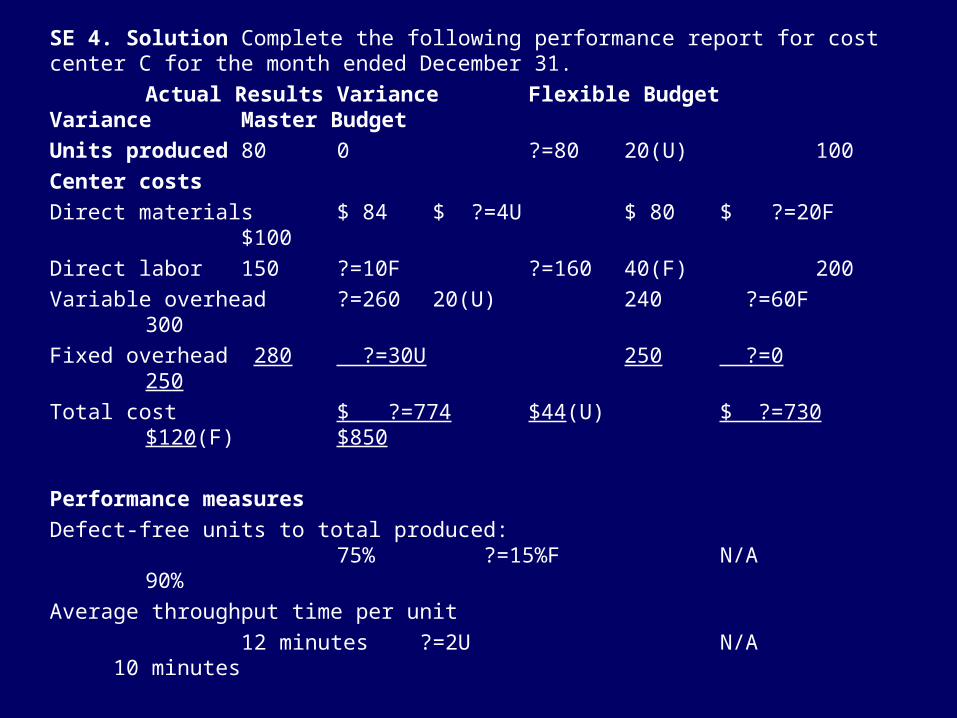
SE 4. Solution Complete the following performance report for cost center C for the month ended December 31.
Actual Results Variance Flexible Budget Variance Master Budget
Units produced 80 0 ?=80 20(U) 100
Center costs
Direct materials $ 84 $ ?=4U $ 80 $ ?=20F $100
Direct labor 150 ?=10F ?=160 40(F) 200
Variable overhead ?=260 20(U) 240 ?=60F 300
Fixed overhead 280 ?=30U 250 ?=0 250
Total cost $ ?=774 $44(U) $ ?=730 $120(F) $850
Performance measures
Defect-free units to total produced:75% ?=15%F N/A 90%
Average throughput time per unit
12 minutes ?=2U N/A 10 minutes
Use only with permission of Susan Crosson
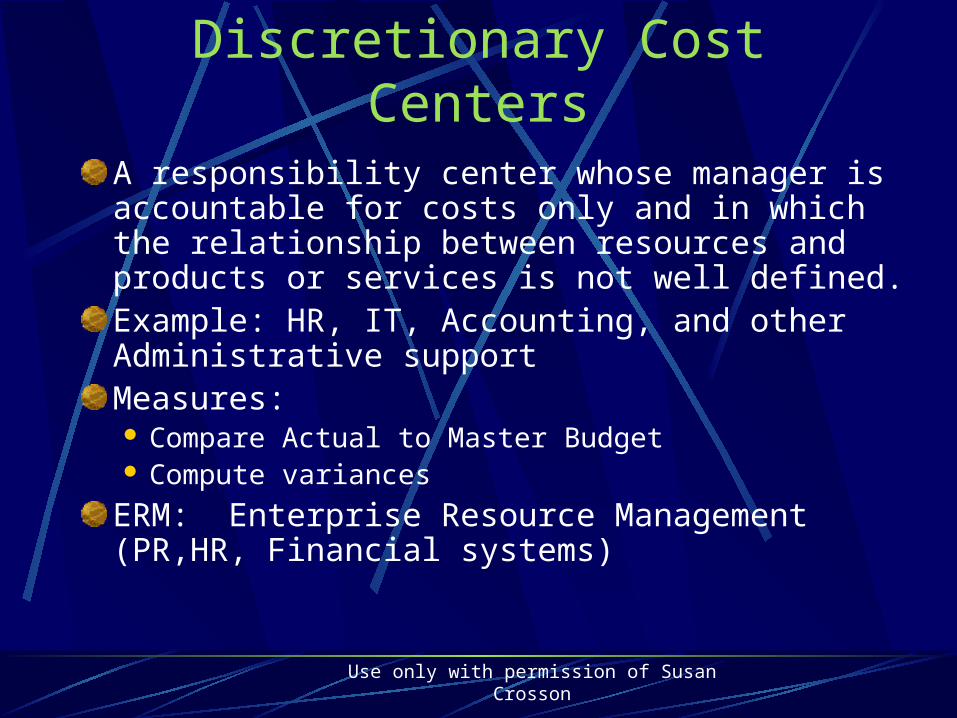
Discretionary Cost Centers
A responsibility center whose manager is accountable for costs only and in which the relationship between resources and products or services is not well defined.Example: HR, IT, Accounting, and other Administrative supportMeasures: Compare Actual to Master Budget Compute variances
ERM: Enterprise Resource Management (PR,HR, Financial systems)
Use only with permission of Susan Crosson
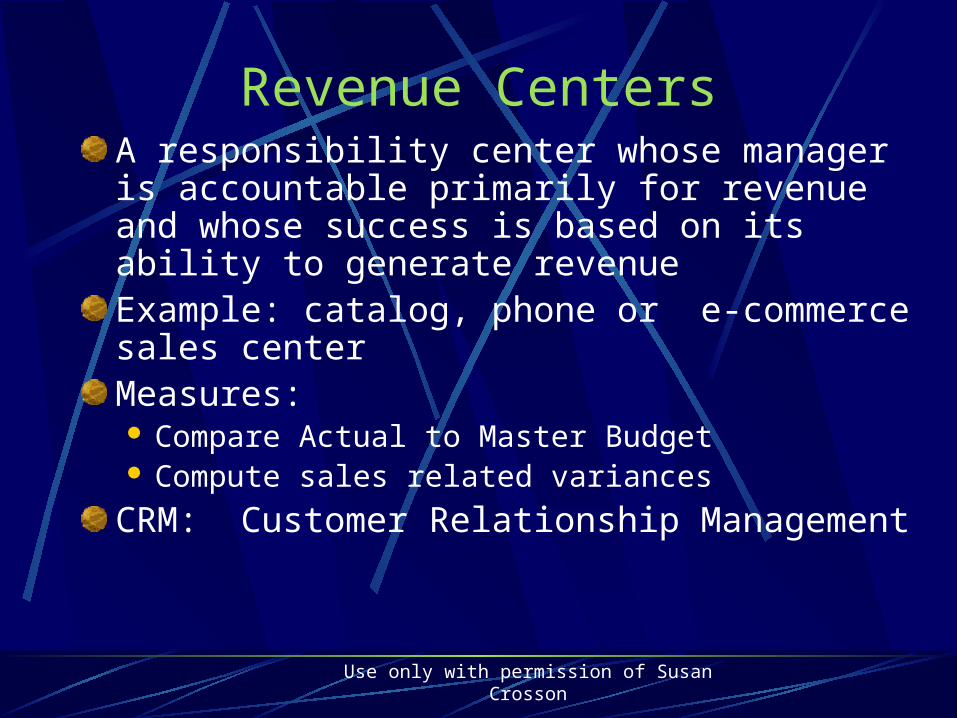
Revenue CentersA responsibility center whose manager is accountable primarily for revenue and whose success is based on its ability to generate revenueExample: catalog, phone or e-commerce sales center Measures: Compare Actual to Master Budget Compute sales related variances
CRM: Customer Relationship Management
Use only with permission of Susan Crosson
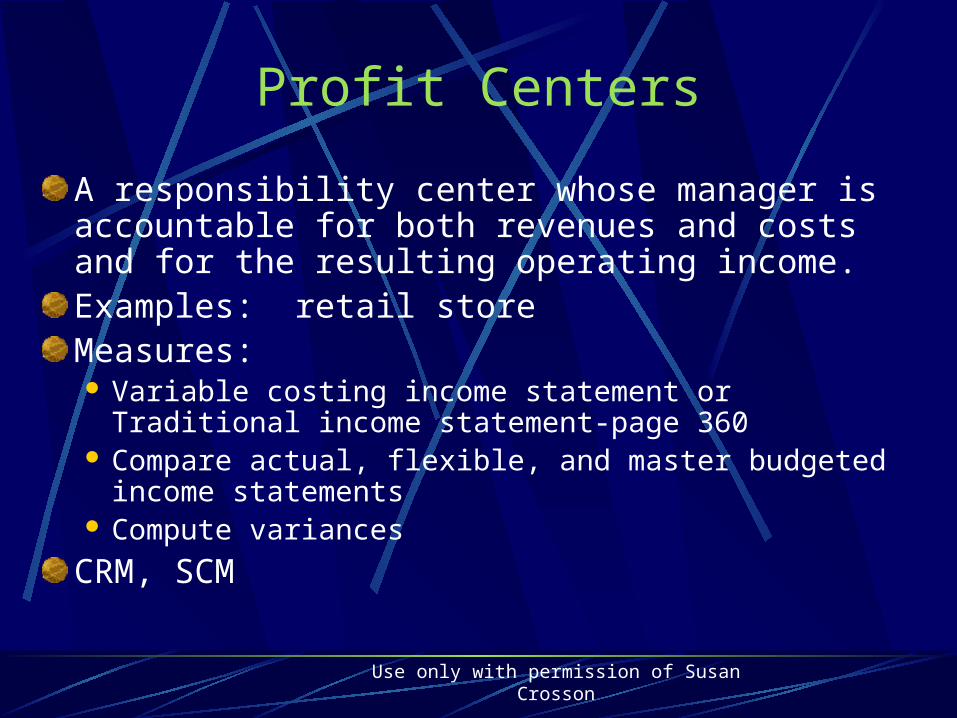
Profit Centers
A responsibility center whose manager is accountable for both revenues and costs and for the resulting operating income.Examples: retail store Measures: Variable costing income statement or Traditional income
statement-page 360 Compare actual, flexible, and master budgeted income
statements Compute variances
CRM, SCM
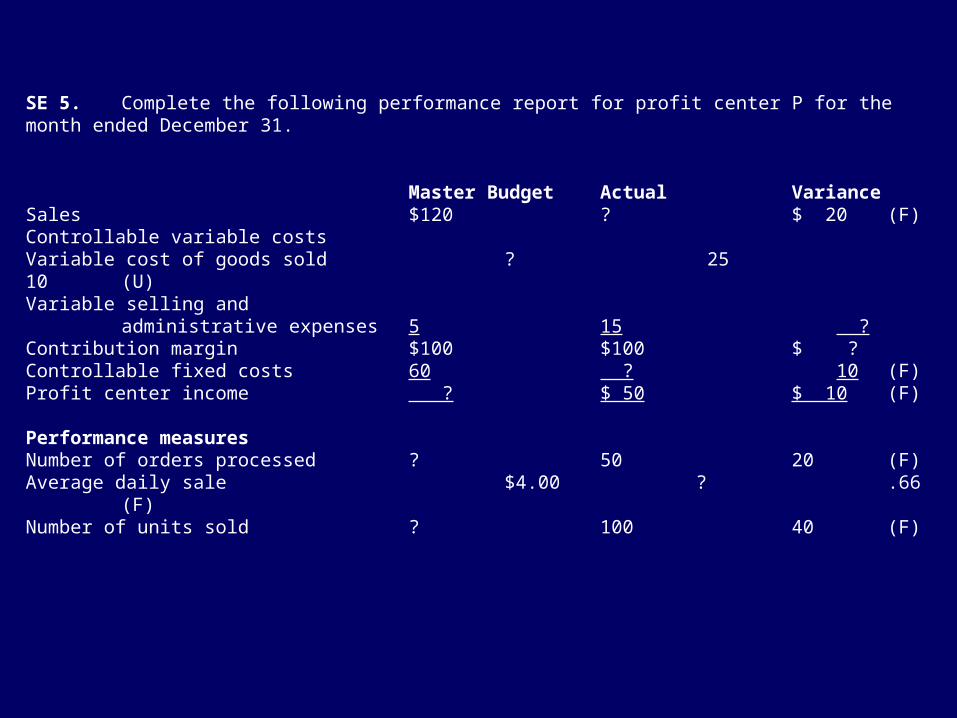
SE 5. Complete the following performance report for profit center P for the month ended December 31.
Master Budget Actual VarianceSales $120 ? $ 20 (F)Controllable variable costsVariable cost of goods sold ? 25 10 (U)Variable selling and
administrative expenses 5 15 ?Contribution margin $100 $100 $ ?Controllable fixed costs 60 ? 10 (F)Profit center income ? $ 50 $ 10 (F) Performance measuresNumber of orders processed ? 50 20 (F)Average daily sale $4.00 ? .66 (F)Number of units sold ? 100 40 (F)
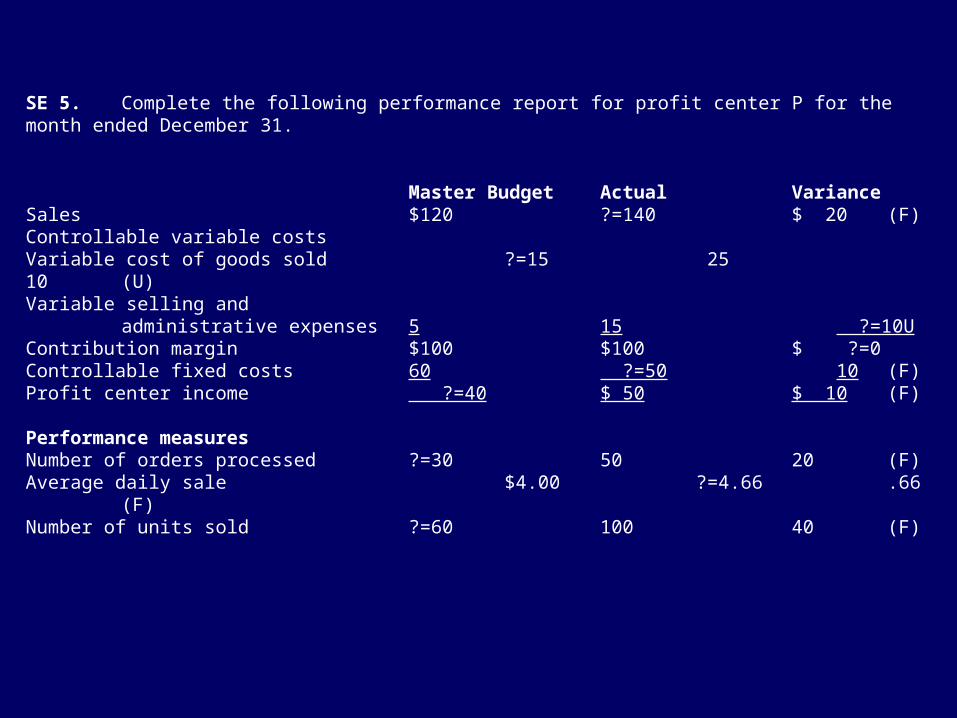
SE 5. Complete the following performance report for profit center P for the month ended December 31.
Master Budget Actual VarianceSales $120 ?=140 $ 20 (F)Controllable variable costsVariable cost of goods sold ?=15 25 10 (U)Variable selling and
administrative expenses 5 15 ?=10UContribution margin $100 $100 $ ?=0Controllable fixed costs 60 ?=50 10 (F)Profit center income ?=40 $ 50 $ 10 (F) Performance measuresNumber of orders processed ?=30 50 20 (F)Average daily sale $4.00 ?=4.66 .66 (F)Number of units sold ?=60 100 40 (F)
Use only with permission of Susan Crosson
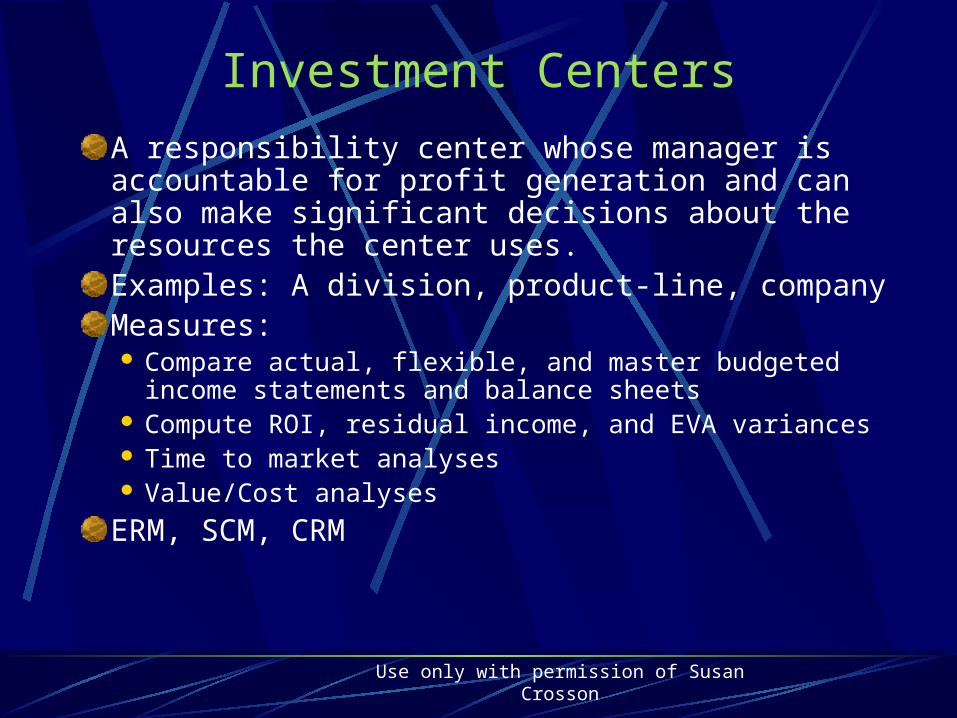
Investment Centers
A responsibility center whose manager is accountable for profit generation and can also make significant decisions about the resources the center uses.Examples: A division, product-line, companyMeasures: Compare actual, flexible, and master budgeted income
statements and balance sheets Compute ROI, residual income, and EVA variances Time to market analyses Value/Cost analyses
ERM, SCM, CRM
Use only with permission of Susan Crosson
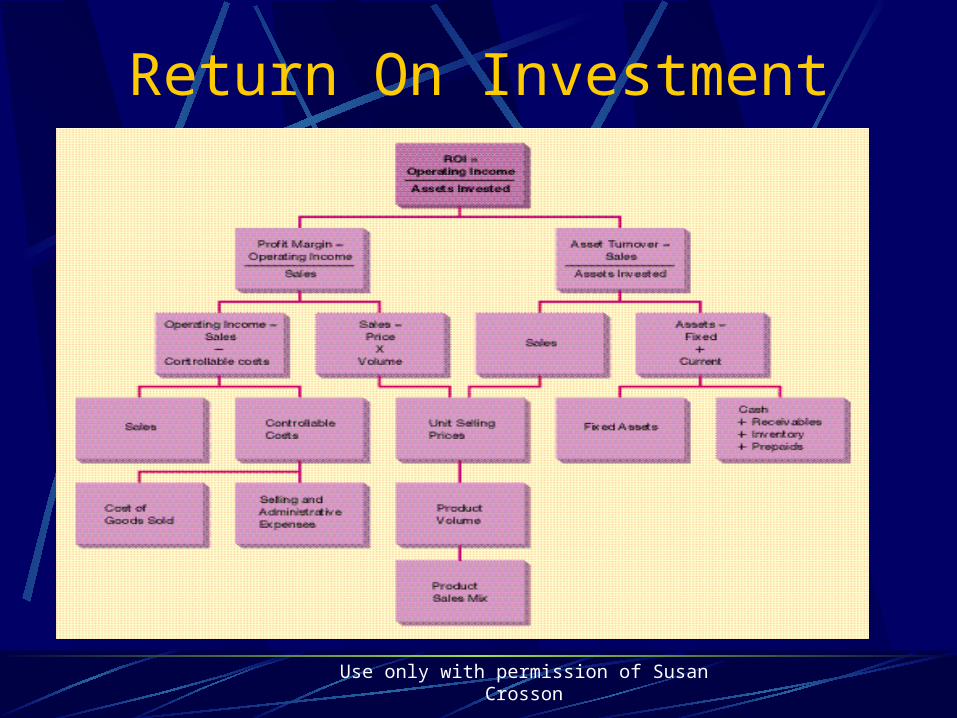
Return On Investment
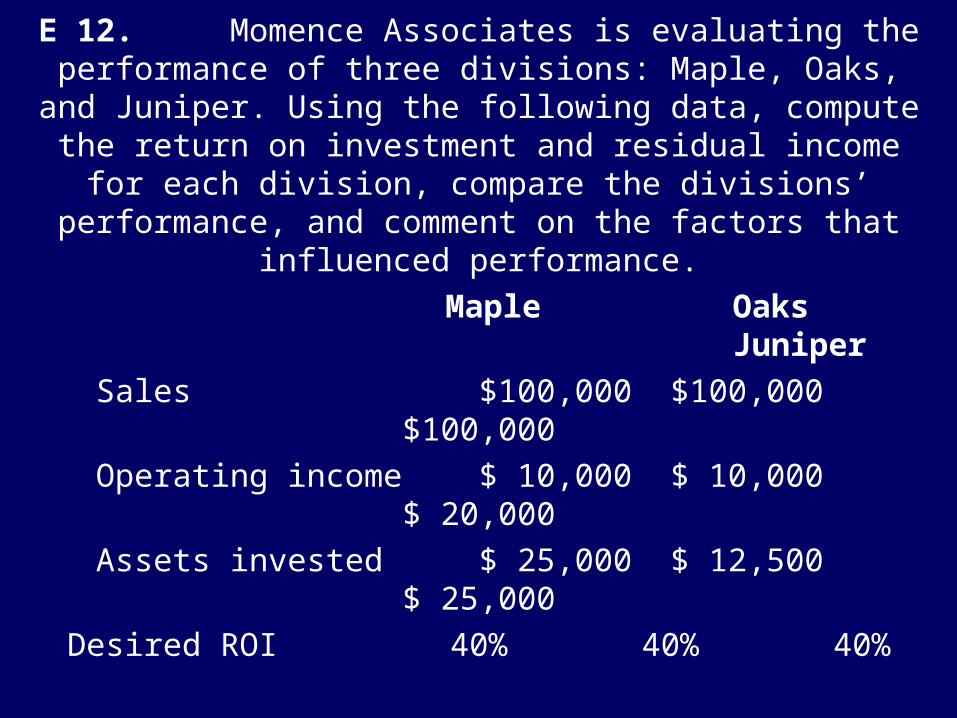
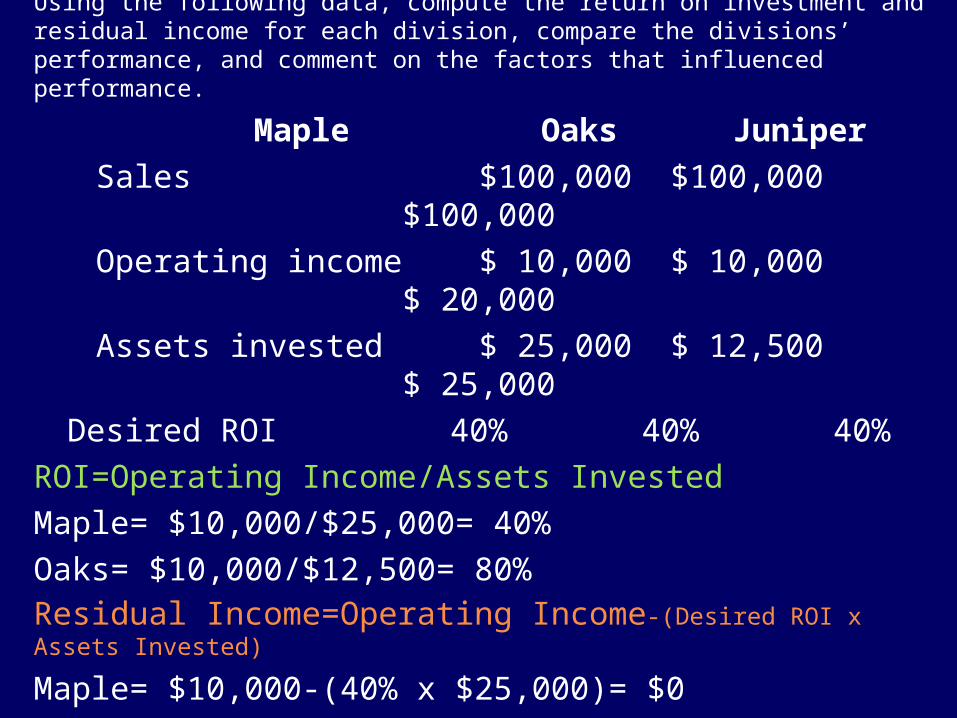
E 12. Momence Associates is evaluating the performance of three divisions: Maple, Oaks, and Juniper. Using the following data, compute the return on investment and residual income for each division, compare the divisions’ performance, and
comment on the factors that influenced performance.
Maple Oaks Juniper
Sales $100,000 $100,000 $100,000
Operating income $ 10,000 $ 10,000 $ 20,000
Assets invested $ 25,000 $ 12,500 $ 25,000
Desired ROI 40% 40% 40%
E 12. Solution Momence Associates is evaluating the performance of three divisions: Maple, Oaks, and Juniper. Using the following data, compute the return on investment and residual income for each division, compare the divisions’ performance, and comment on the factors that influenced performance.
Maple Oaks Juniper
Sales $100,000 $100,000 $100,000
Operating income $ 10,000 $ 10,000 $ 20,000
Assets invested $ 25,000 $ 12,500 $ 25,000
Desired ROI 40% 40% 40%
ROI=Operating Income/Assets Invested
Maple= $10,000/$25,000= 40%
Oaks= $10,000/$12,500= 80% Residual Income=Operating Income-(Desired ROI x Assets Invested)
Maple= $10,000-(40% x $25,000)= $0
Oaks= $10,000-(40% x $12,500)= $5,000
Use only with permission of Susan Crosson
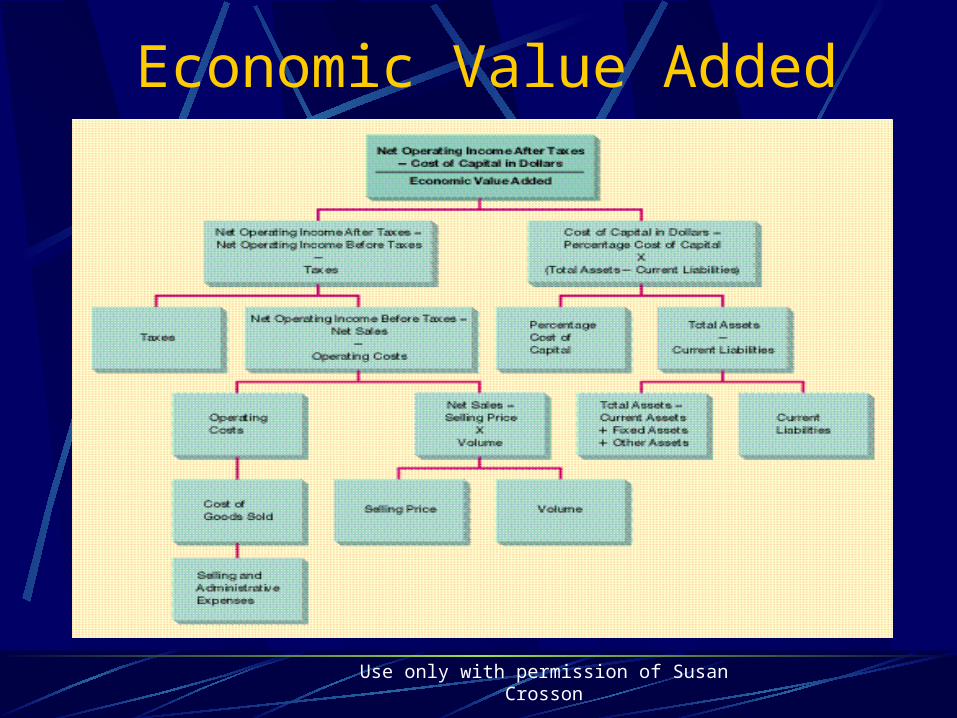
Economic Value Added
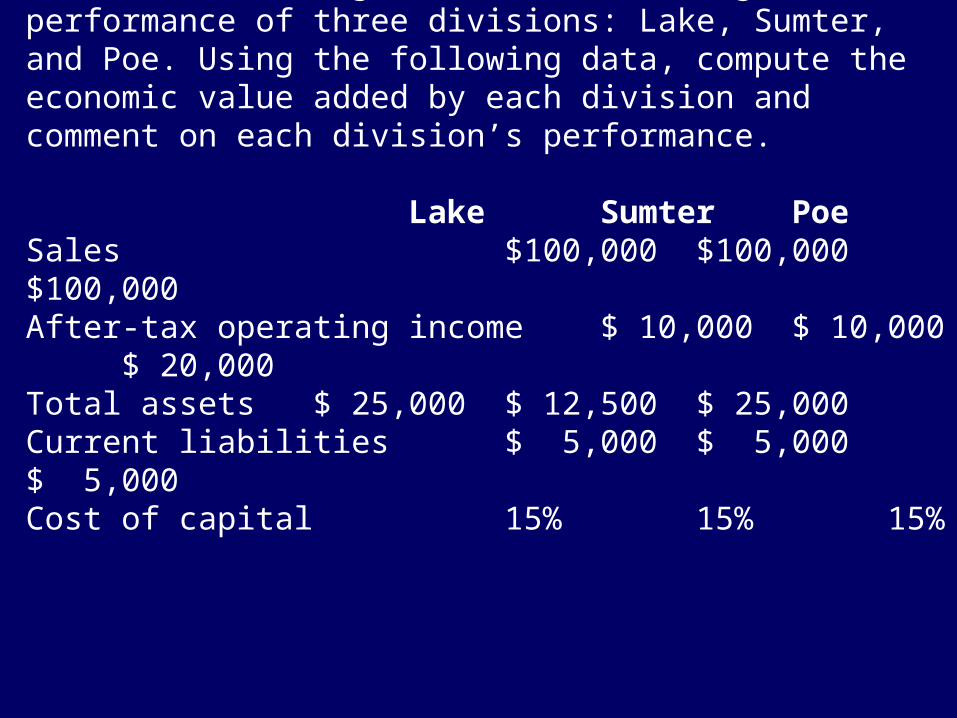
E 13. Leesburg, LLP, is evaluating the performance of three divisions: Lake, Sumter, and Poe. Using the following data, compute the economic value added by each division and comment on each division’s performance.
Lake Sumter PoeSales $100,000 $100,000 $100,000After-tax operating income $ 10,000 $ 10,000 $ 20,000Total assets $ 25,000 $ 12,500 $ 25,000Current liabilities $ 5,000 $ 5,000 $ 5,000Cost of capital 15% 15% 15%
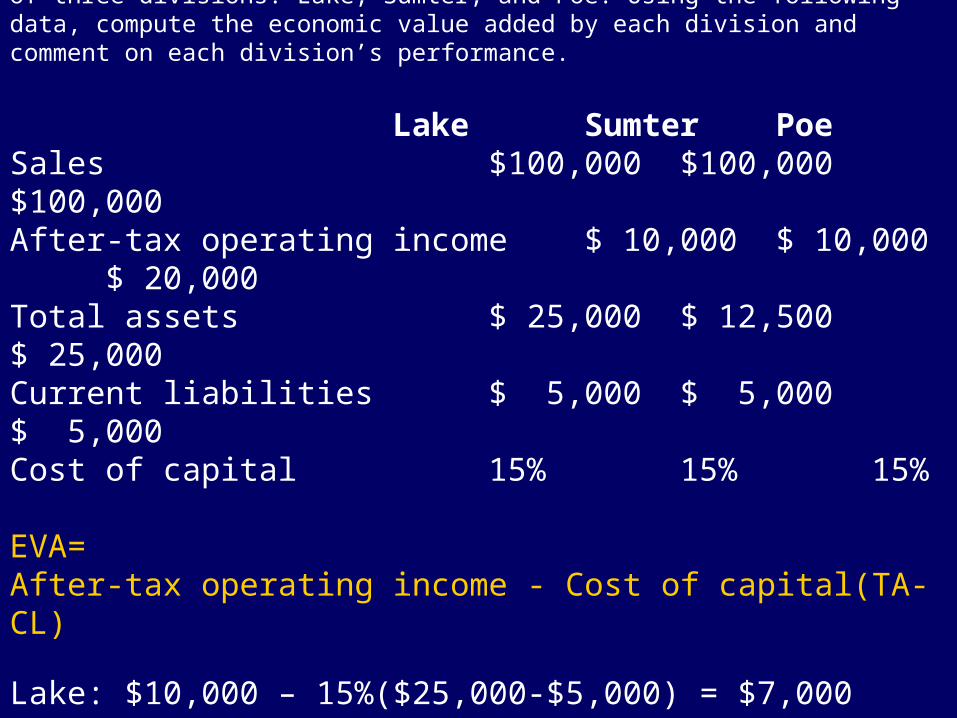
E 13. Solution Leesburg, LLP, is evaluating the performance of three divisions: Lake, Sumter, and Poe. Using the following data, compute the economic value added by each division and comment on each division’s performance.
Lake Sumter PoeSales $100,000 $100,000 $100,000After-tax operating income $ 10,000 $ 10,000 $ 20,000Total assets $ 25,000 $ 12,500 $ 25,000Current liabilities $ 5,000 $ 5,000 $ 5,000Cost of capital 15% 15% 15%
EVA= After-tax operating income - Cost of capital(TA-CL)
Lake: $10,000 – 15%($25,000-$5,000) = $7,000Sumter: $10,000 – 15%($12,500-$5,000) = $8,875
Use only with permission of Susan Crosson
What Do You Know?Responsibility Centers
Types: E 5, Look and listen SE2
Cost Center: C2
Profit Center: E9, E 10
Investment Center: P 8, Look and listen SE7, SE8, SE9.
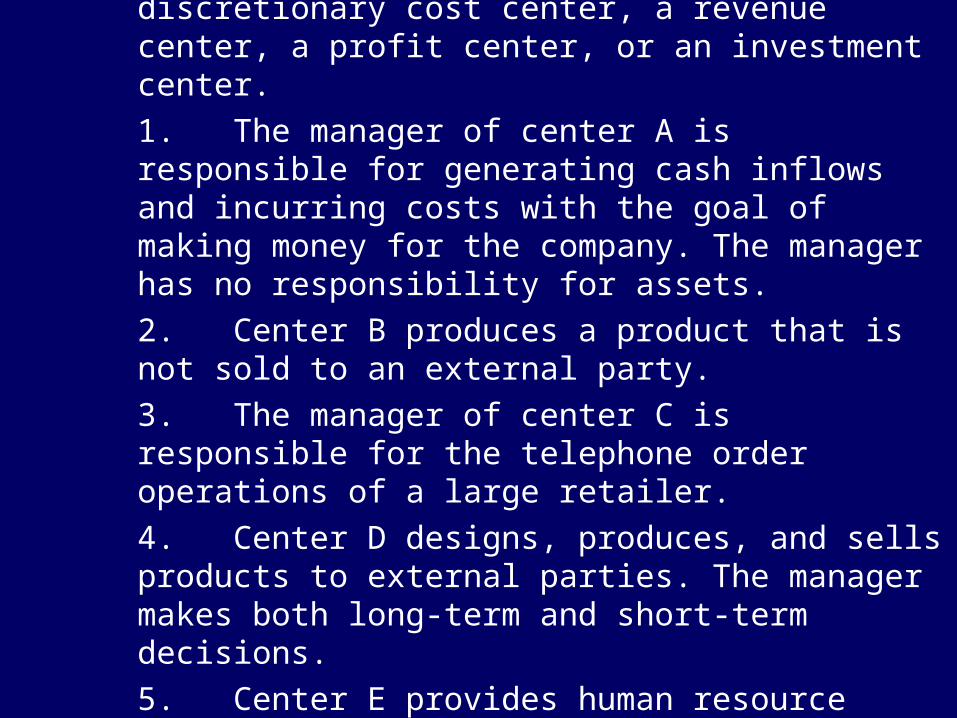
Look and listen SE 2. Identify each of the following as a cost center, a discretionary cost center, a revenue center, a profit center, or an investment center.
1. The manager of center A is responsible for generating cash inflows and incurring costs with the goal of making money for the company. The manager has no responsibility for assets.
2. Center B produces a product that is not sold to an external party.
3. The manager of center C is responsible for the telephone order operations of a large retailer.
4. Center D designs, produces, and sells products to external parties. The manager makes both long-term and short-term decisions.
5. Center E provides human resource support for the other centers in the company.
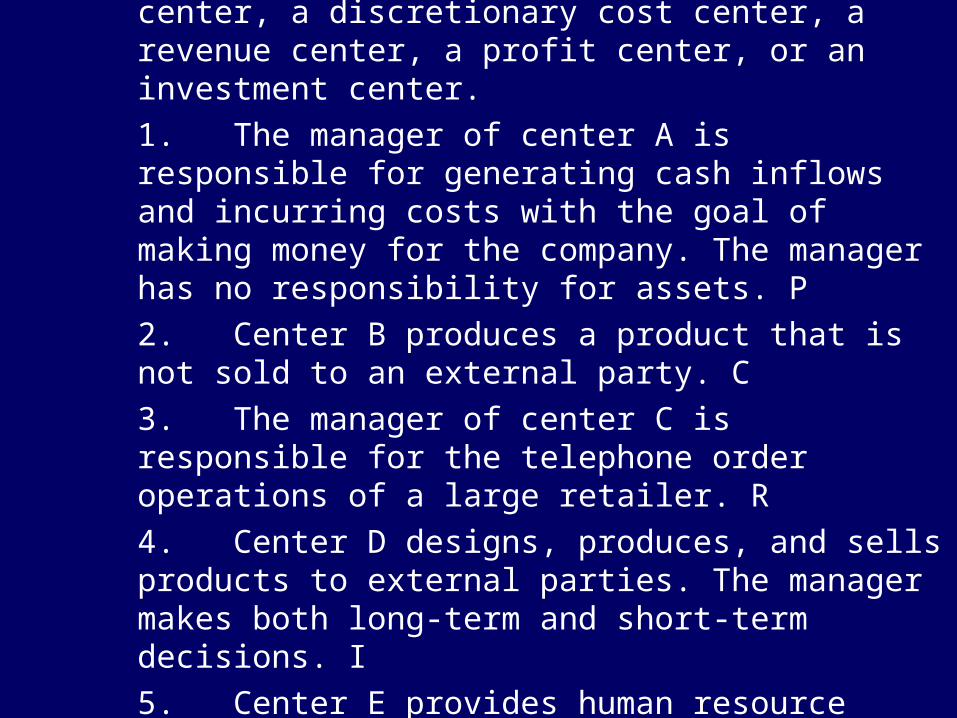
SE 2.Solution
Identify each of the following as a cost center, a discretionary cost center, a revenue center, a profit center, or an investment center.
1. The manager of center A is responsible for generating cash inflows and incurring costs with the goal of making money for the company. The manager has no responsibility for assets. P
2. Center B produces a product that is not sold to an external party. C
3. The manager of center C is responsible for the telephone order operations of a large retailer. R
4. Center D designs, produces, and sells products to external parties. The manager makes both long-term and short-term decisions. I
5. Center E provides human resource support for the other centers in the company. DC
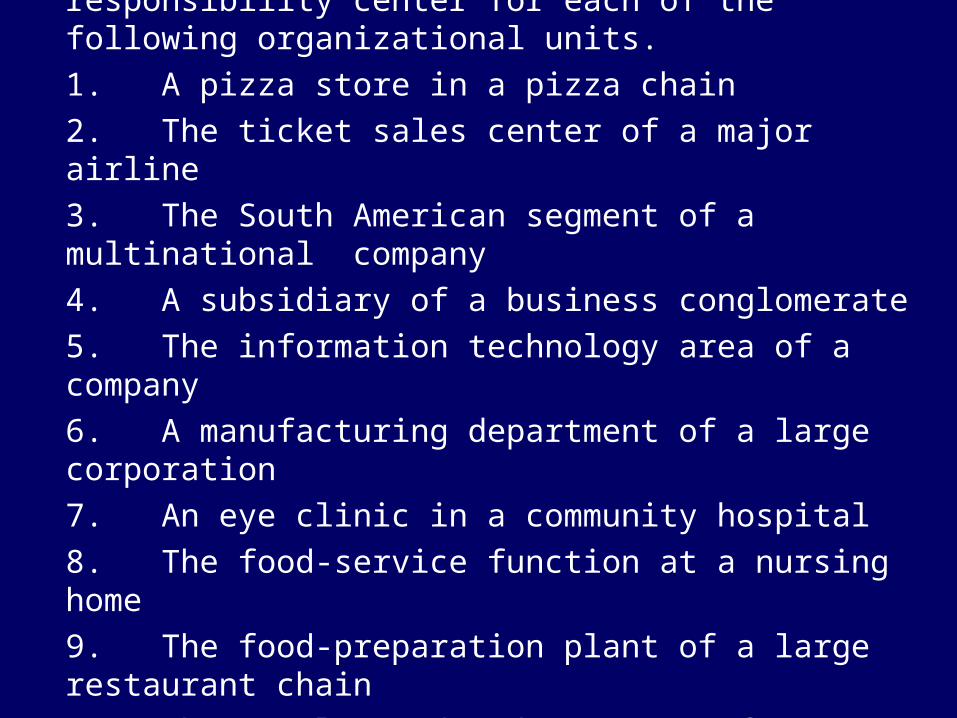
E 5. Identify the most appropriate type of responsibility center for each of the following organizational units.
1. A pizza store in a pizza chain
2. The ticket sales center of a major airline
3. The South American segment of a multinational company
4. A subsidiary of a business conglomerate
5. The information technology area of a company
6. A manufacturing department of a large corporation
7. An eye clinic in a community hospital
8. The food-service function at a nursing home
9. The food-preparation plant of a large restaurant chain
10. The catalog order department of a retailer
E 5.Solution
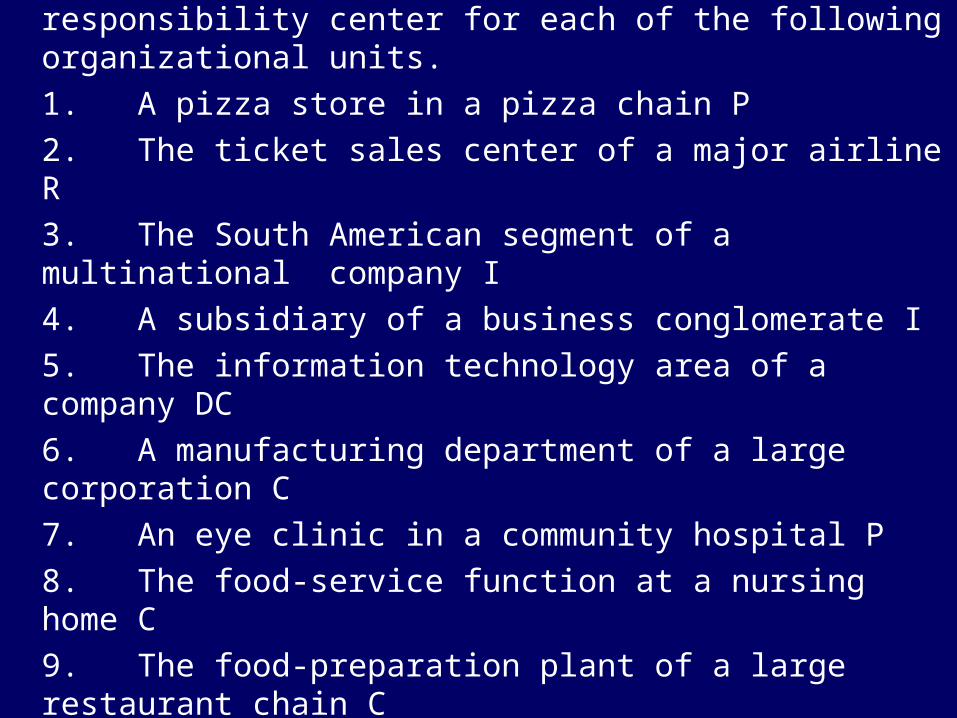
Identify the most appropriate type of responsibility center for each of the following organizational units.
1. A pizza store in a pizza chain P
2. The ticket sales center of a major airline R
3. The South American segment of a multinational company I
4. A subsidiary of a business conglomerate I
5. The information technology area of a company DC
6. A manufacturing department of a large corporation C
7. An eye clinic in a community hospital P
8. The food-service function at a nursing home C
9. The food-preparation plant of a large restaurant chain C
10. The catalog order department of a retailer R
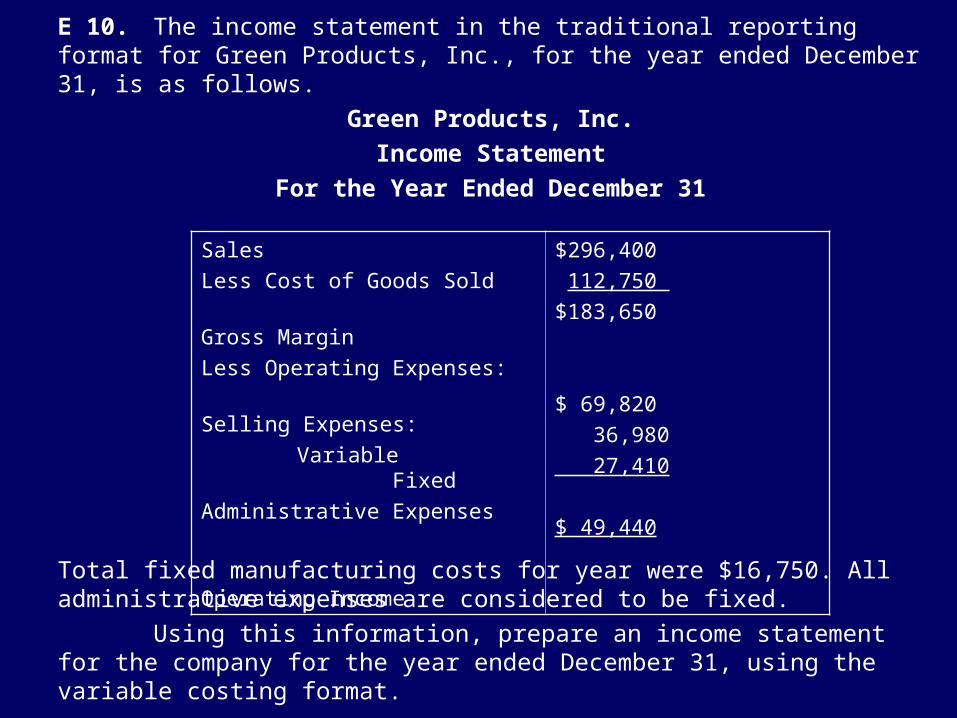
E 10. The income statement in the traditional reporting format for Green Products, Inc., for the year ended December 31, is as follows.
Green Products, Inc.
Income Statement
For the Year Ended December 31
Total fixed manufacturing costs for year were $16,750. All administrative expenses are considered to be fixed.
Using this information, prepare an income statement for the company for the year ended December 31, using the variable costing format.
Sales
Less Cost of Goods Sold
Gross Margin
Less Operating Expenses:
Selling Expenses:
VariableFixed
Administrative Expenses
Operating Income
$296,400
112,750
$183,650
$ 69,820
36,980
27,410
$ 49,440
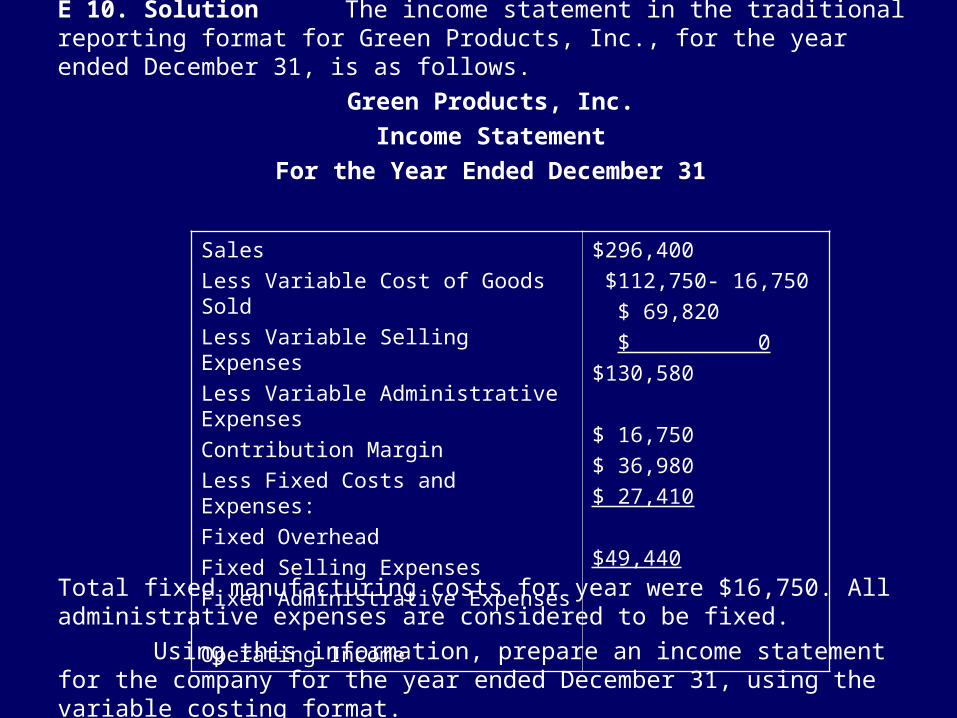
E 10. Solution The income statement in the traditional reporting format for Green Products, Inc., for the year ended December 31, is as follows.
Green Products, Inc.
Income Statement
For the Year Ended December 31
Total fixed manufacturing costs for year were $16,750. All administrative expenses are considered to be fixed.
Using this information, prepare an income statement for the company for the year ended December 31, using the variable costing format.
Sales
Less Variable Cost of Goods Sold
Less Variable Selling Expenses
Less Variable Administrative Expenses
Contribution Margin
Less Fixed Costs and Expenses:
Fixed Overhead
Fixed Selling Expenses
Fixed Administrative Expenses
Operating Income
$296,400
$112,750- 16,750
$ 69,820
$ 0
$130,580
$ 16,750
$ 36,980
$ 27,410
$49,440
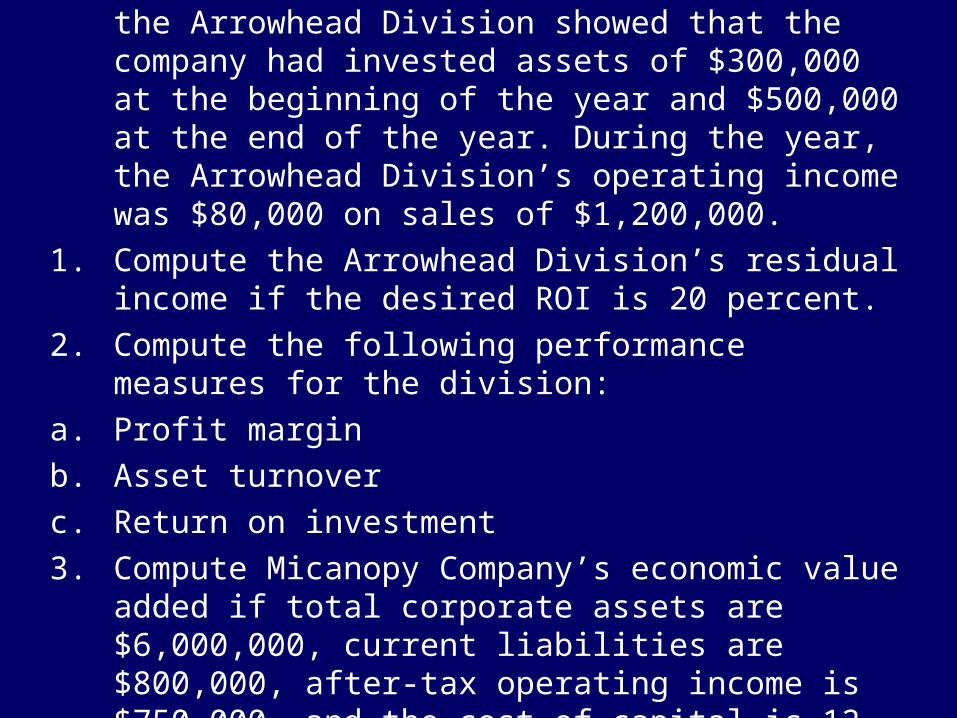
P 8. Micanopy Company makes replicas of Indian artifacts. The balance sheet for the Arrowhead Division showed that the company had invested assets of $300,000 at the beginning of the year and $500,000 at the end of the year. During the year, the Arrowhead Division’s operating income was $80,000 on sales of $1,200,000.
1. Compute the Arrowhead Division’s residual income if the desired ROI is 20 percent.
2. Compute the following performance measures for the division:
a. Profit margin
b. Asset turnover
c. Return on investment
3. Compute Micanopy Company’s economic value added if total corporate assets are $6,000,000, current liabilities are $800,000, after-tax operating income is $750,000, and the cost of capital is 12 percent.
Use only with permission of Susan Crosson
Balanced Scorecard
End-to-end AccountabilityOne type of a Manager’s DashboardKey Performance Objectives, Measures and Targets Linked
Use only with permission of Susan Crosson
The Balanced Scorecard
Developed by Robert S. Kaplan and David P. Norton
A framework that links the perspectives of an organization’s four basic stakeholder groups with the organization’s mission and vision, performance measures, strategic plan, and resources.
Use only with permission of Susan Crosson
Classic Balanced Scorecard Perspectives
Financial
(investors)
Learning and growth (employees)
Internal business processes
CustomersTo succeed, an organization must add value for all groups in both the short and long term……
Use only with permission of Susan Crosson
Other Balanced Scorecard Perspectives
Community GovernmentFinancial (investors)Learning and growth (employees)Internal business processesCustomers
To succeed, an organization must add value for all groups in both the short and long term……
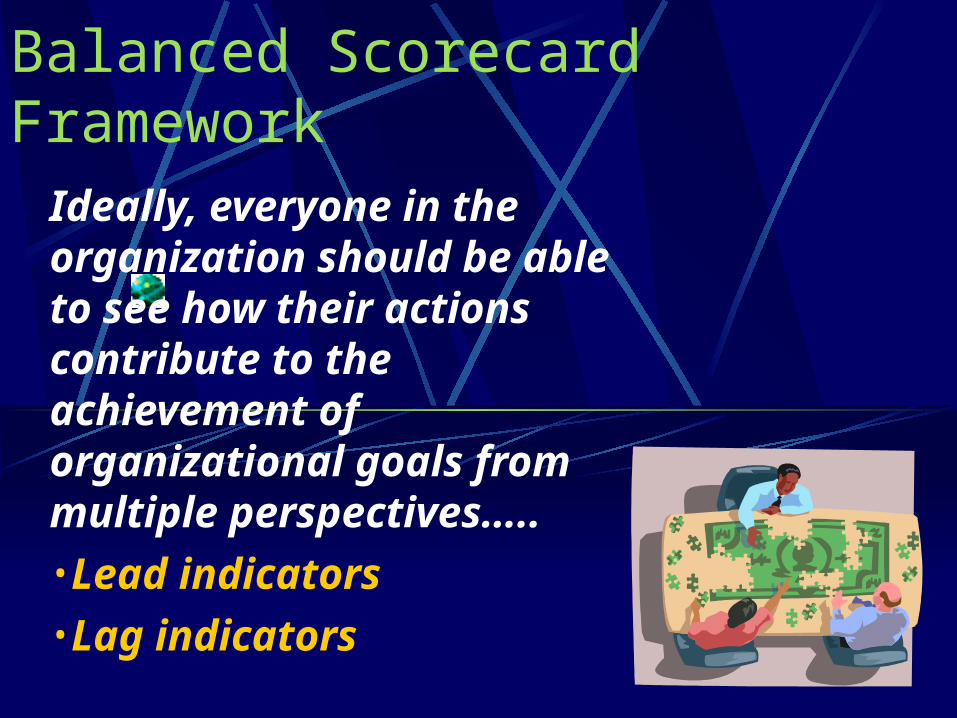
Balanced Scorecard Framework
Ideally, everyone in the organization should be able to see how their actions contribute to the achievement of organizational goals from multiple perspectives…..•Lead indicators•Lag indicators
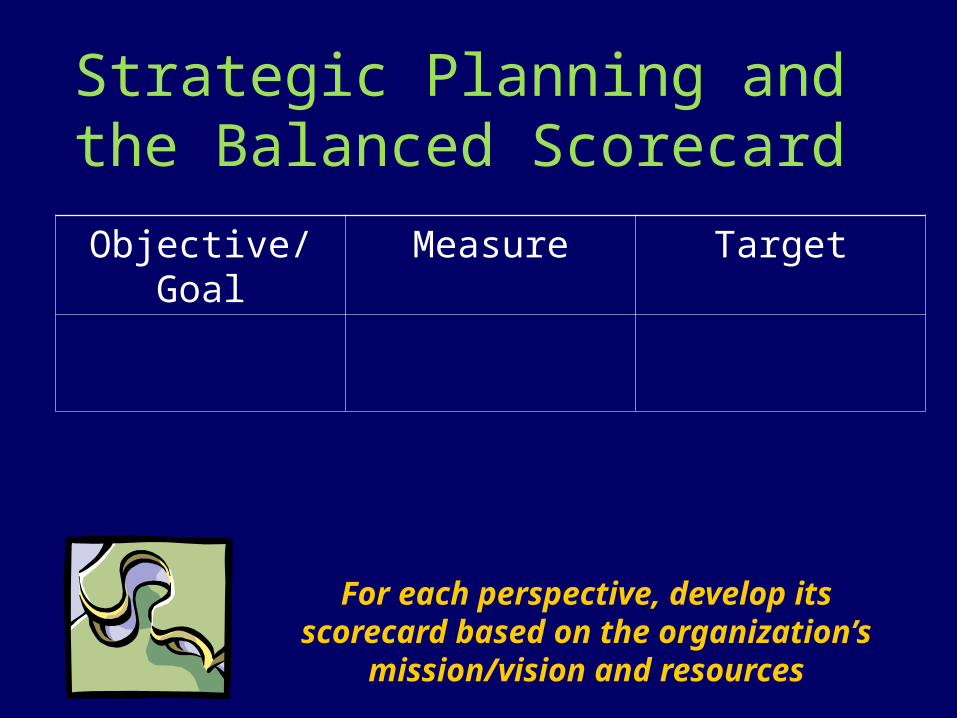
Strategic Planning and the Balanced Scorecard
For each perspective, develop its scorecard based on the organization’s
mission/vision and resources
Objective/Goal Measure Target
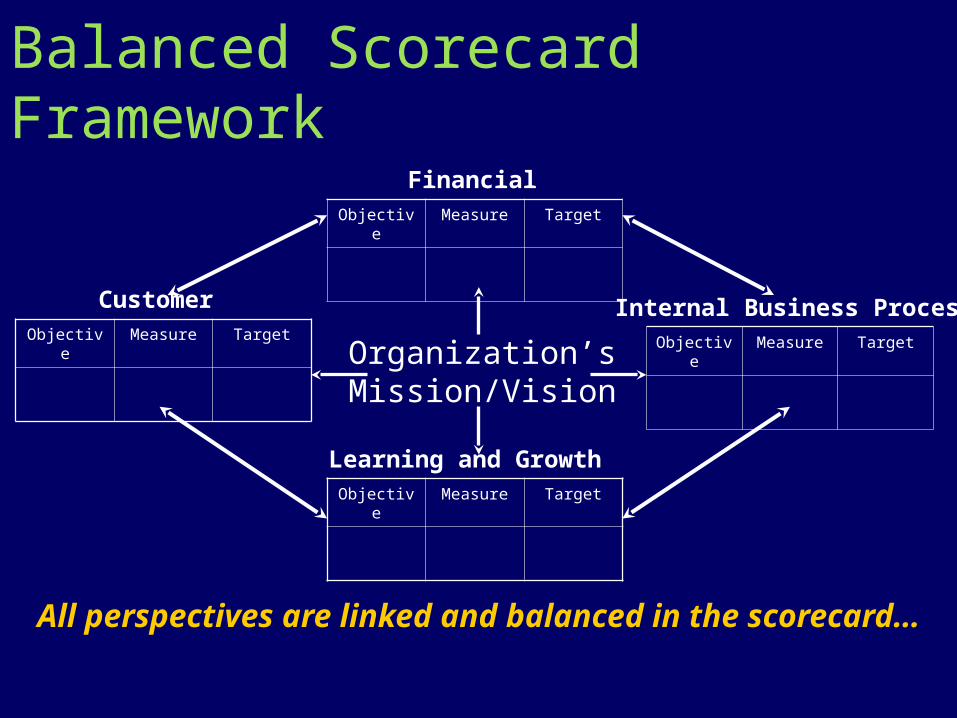
Balanced Scorecard Framework
All perspectives are linked and balanced in the scorecard…
Objective Measure Target
Objective Measure TargetObjective Measure Target
Objective Measure Target
Organization’sMission/Vision
Financial
Customer Internal Business Process
Learning and Growth
Use only with permission of Susan Crosson
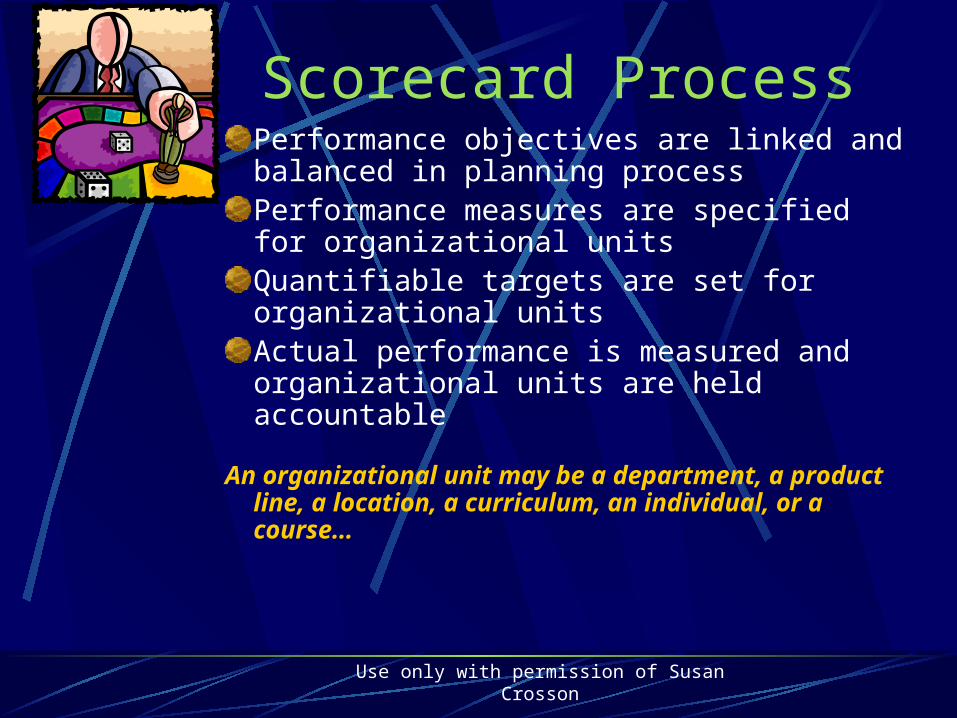
Scorecard ProcessPerformance objectives are linked and balanced in planning processPerformance measures are specified for organizational unitsQuantifiable targets are set for organizational units Actual performance is measured and organizational units are held accountable
An organizational unit may be a department, a product line, a location, a curriculum, an individual, or a course…
Use only with permission of Susan Crosson
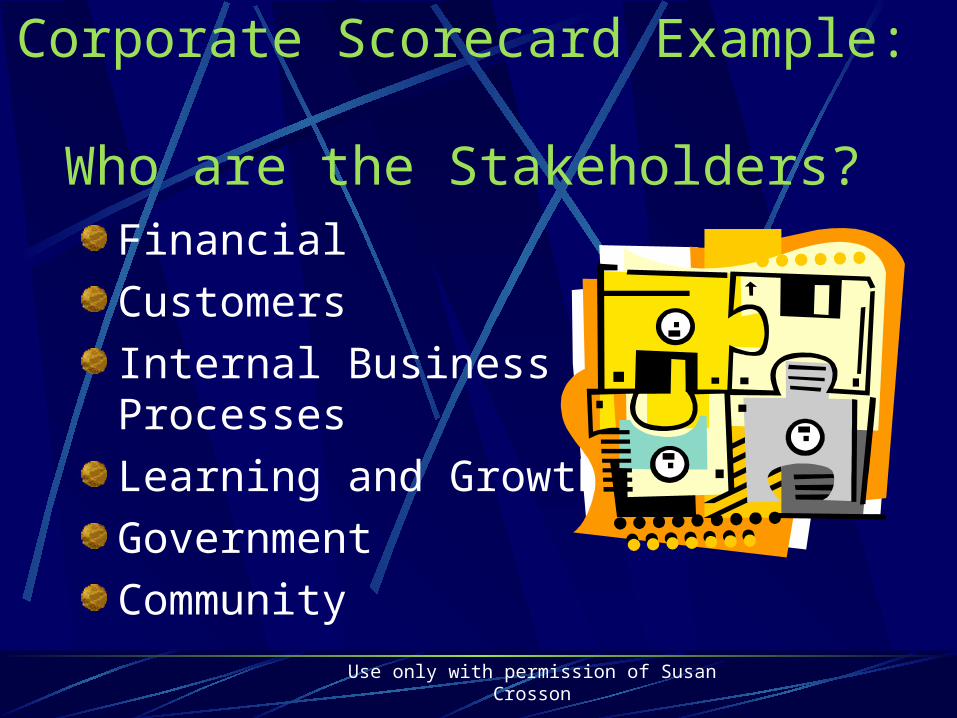
Corporate Scorecard Example: Who are the Stakeholders?
Financial
Customers
Internal Business Processes
Learning and Growth
Government
Community
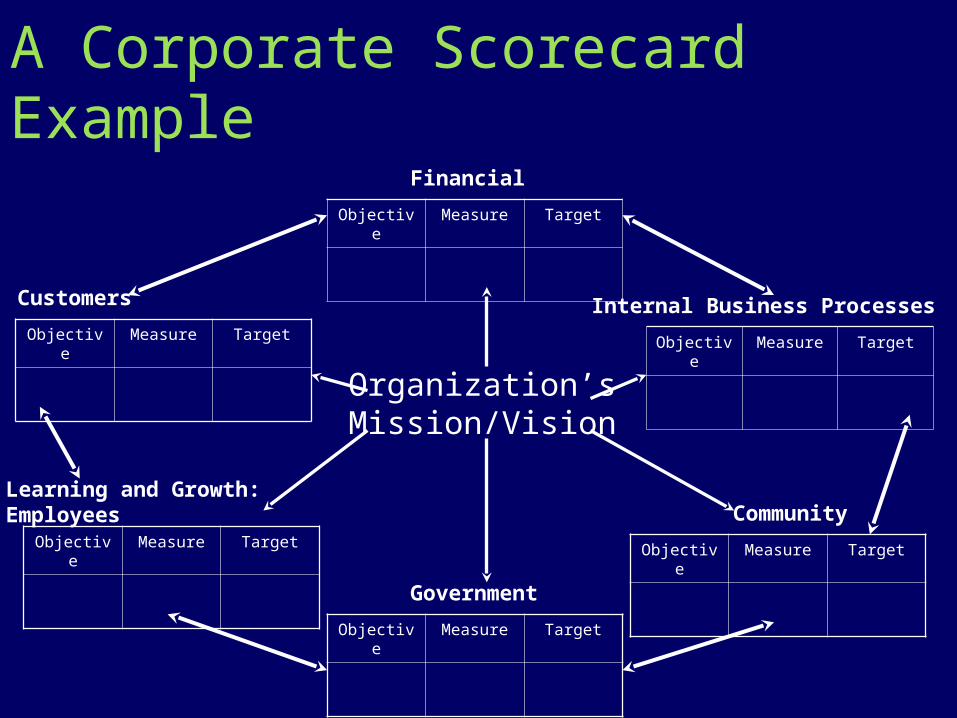
A Corporate Scorecard Example
Objective Measure Target
Objective Measure TargetObjective Measure Target
Objective Measure Target
Organization’sMission/Vision
Financial
Customers Internal Business Processes
Learning and Growth: Employees
Government
Community
Objective Measure Target
Objective Measure Target
Use only with permission of Susan Crosson
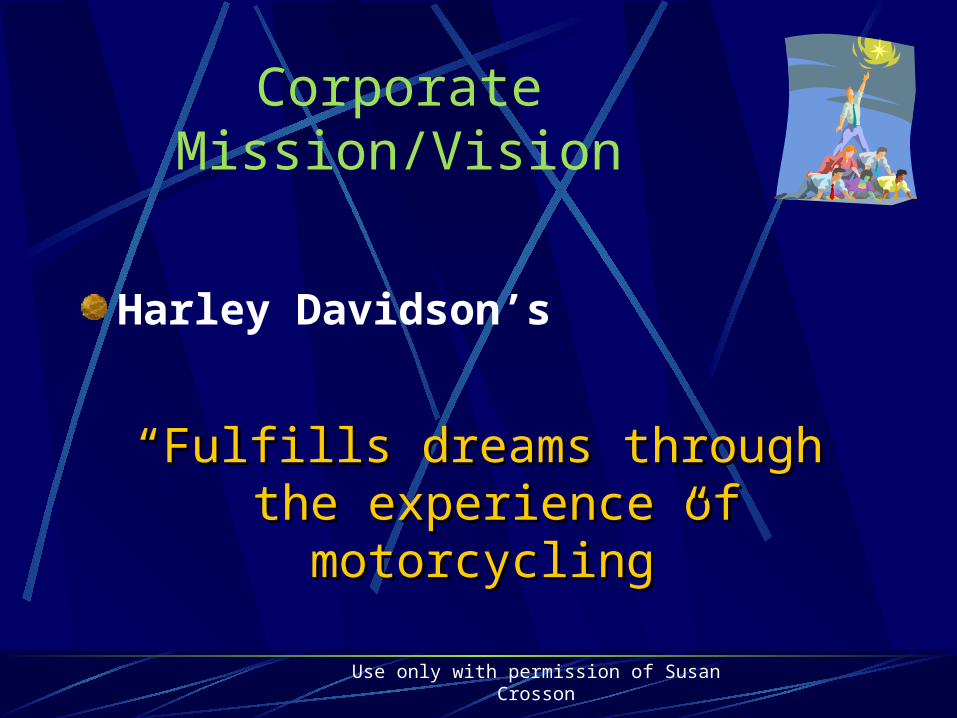
Harley Davidson’s
““Fulfills dreams through the Fulfills dreams through the experience of motorcycling”experience of motorcycling”
Corporate Mission/Vision
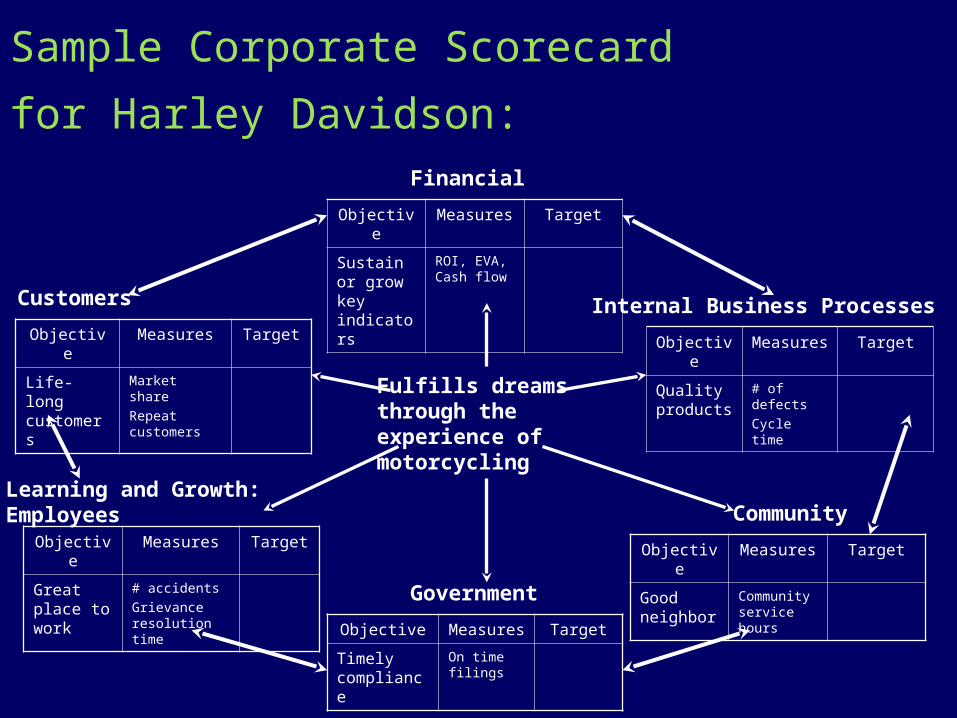
Sample Corporate Scorecard
for Harley Davidson:
Objective Measures Target
Sustain or grow key indicators
ROI, EVA, Cash flow
Objective Measures Target
Quality products
# of defects
Cycle time
Objective Measures Target
Life-long customers
Market share
Repeat customers
Objective Measures Target
Great place to work
# accidents
Grievance resolution time
Fulfills dreams through the experience of motorcycling
Financial
Customers Internal Business Processes
Learning and Growth: Employees
Government
Community
Objective Measures Target
Good neighbor
Community service hours
Objective Measures Target
Timely compliance
On time filings
Use only with permission of Susan Crosson
What Do You Know?Balanced Scorecard
E 15
Scorecard for
Review Problem
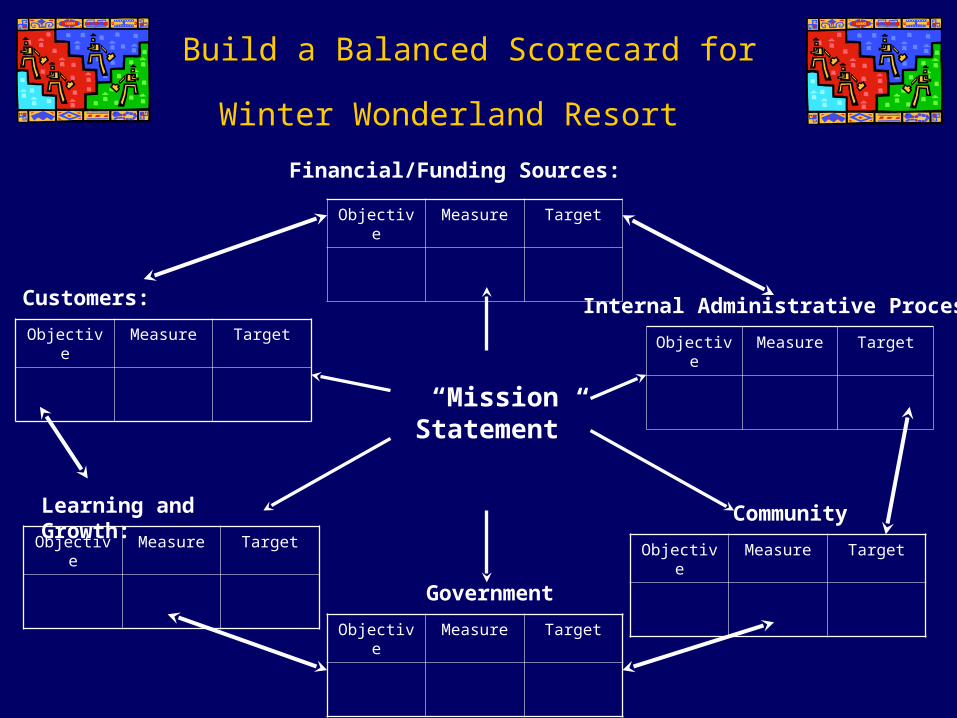
Build a Balanced Scorecard for Winter
Wonderland Resort
Objective Measure Target
Objective Measure TargetObjective Measure Target
Objective Measure Target
Financial/Funding Sources:
Customers: Internal Administrative Processes
Learning and Growth:
Government
Community
Objective Measure Target
Objective Measure Target
“Mission Statement”
Use only with permission of Susan Crosson
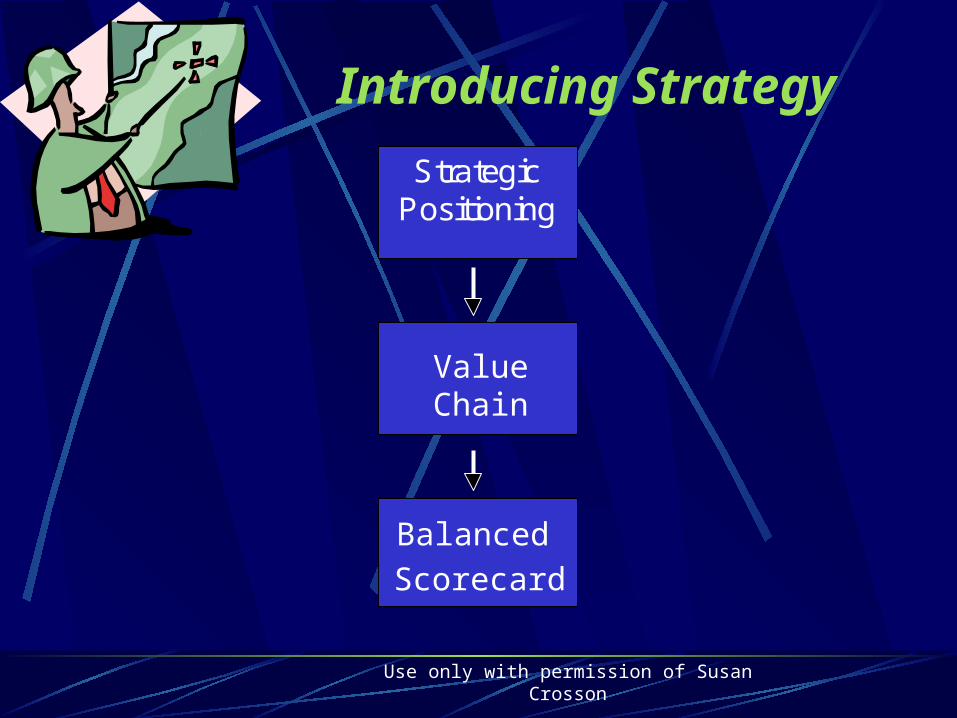
Introducing Strategy
ValueChain
Balanced
Scorecard
StrategicPositioning
Use only with permission of Susan Crosson
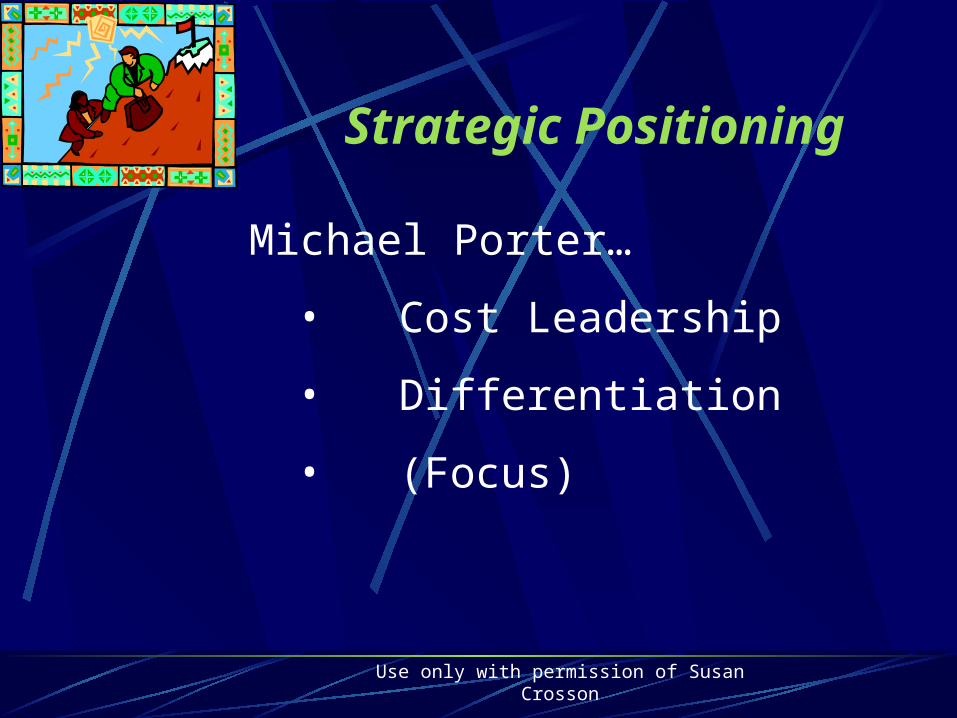
Strategic Positioning
Michael Porter…
• Cost Leadership
• Differentiation
• (Focus)
Use only with permission of Susan Crosson
UpstreamManufacturing/OperationsDownstream
Value Chain AnalysisA Detailed Look at Strategy…
Use only with permission of Susan Crosson
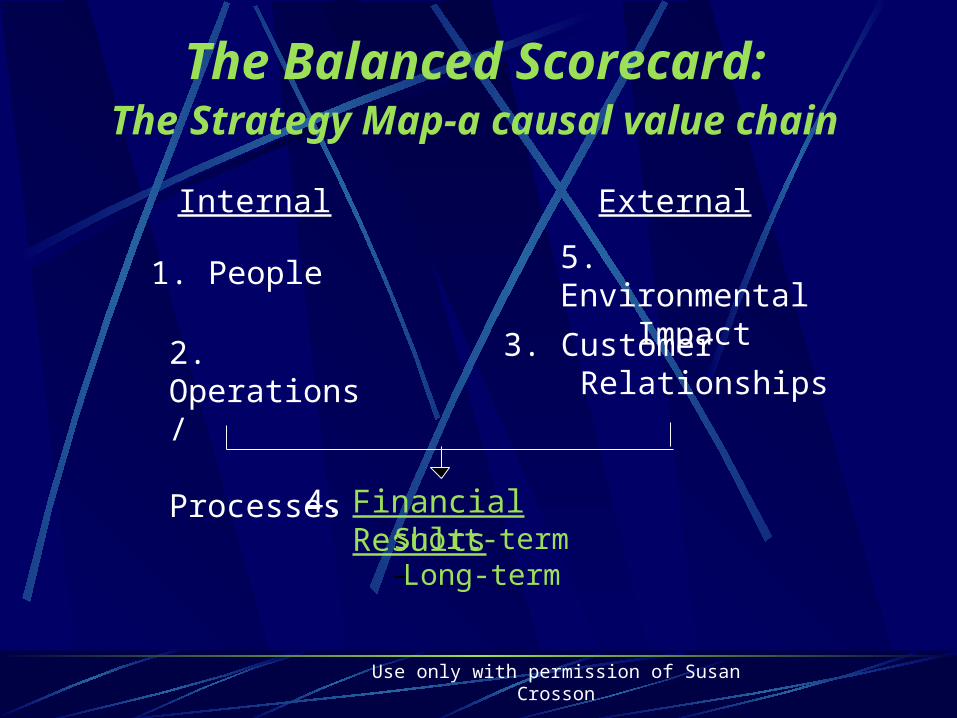
The Balanced Scorecard:The Strategy Map-a causal value
chainInternal External
2. Operations/ Processes
1. People
3. Customer Relationships
5. Environmental Impact
4. Financial Results– Short-term– Long-term
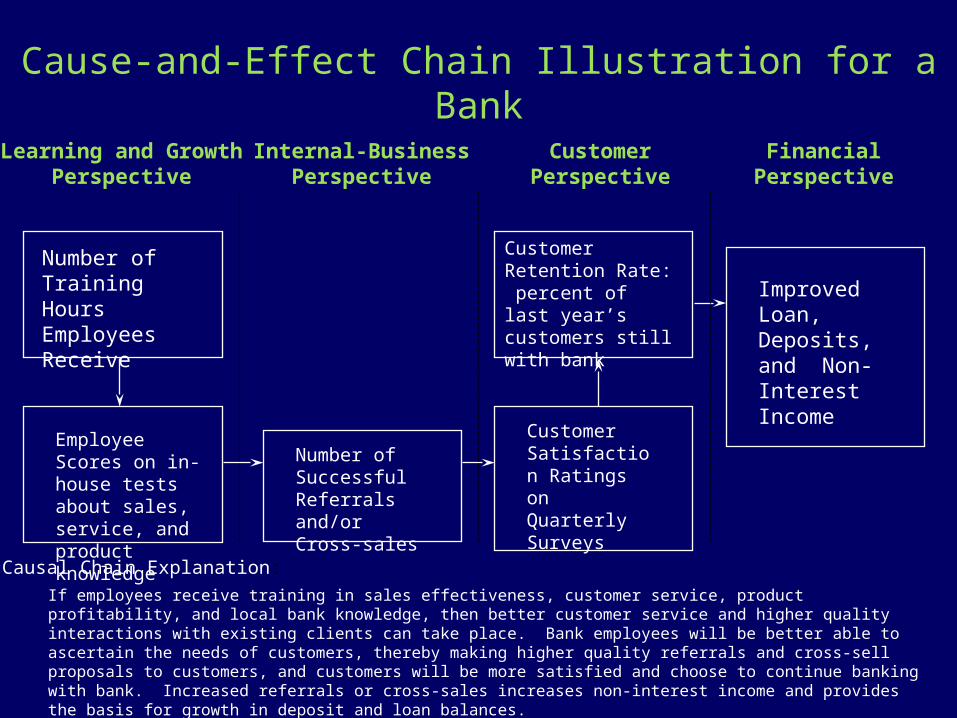
Cause-and-Effect Chain Illustration for a Bank
Learning and GrowthPerspective
Internal-BusinessPerspective
CustomerPerspective
FinancialPerspective
Number of Training Hours Employees Receive
Employee Scores on in-house tests about sales, service, and product knowledge
Number of Successful Referrals and/or Cross-sales
Customer Satisfaction Ratings on Quarterly Surveys
Customer Retention Rate: percent of last year’s customers still with bank
Improved Loan, Deposits, and Non-Interest Income
If employees receive training in sales effectiveness, customer service, product profitability, and local bank knowledge, then better customer service and higher quality interactions with existing clients can take place. Bank employees will be better able to ascertain the needs of customers, thereby making higher quality referrals and cross-sell proposals to customers, and customers will be more satisfied and choose to continue banking with bank. Increased referrals or cross-sales increases non-interest income and provides the basis for growth in deposit and loan balances.
Causal Chain Explanation:
Use only with permission of Susan Crosson
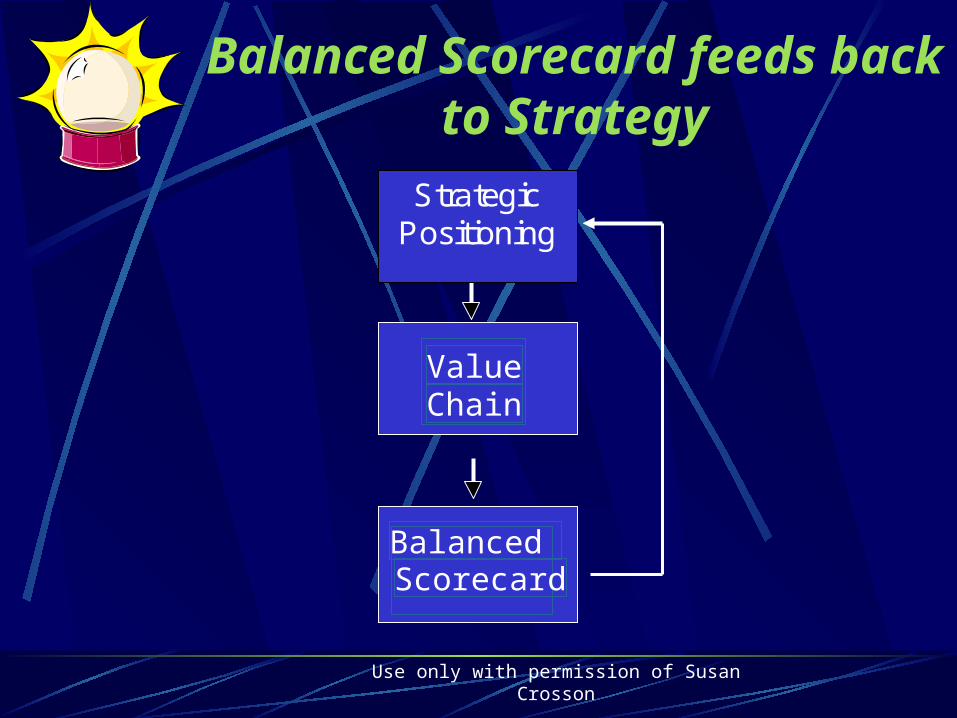
Balanced Scorecard feeds back to Strategy
ValueChain
Balanced Scorecard
StrategicPositioning
Use only with permission of Susan Crosson
Linking executive compensation and performance
Performance-based payProfit sharing Cash bonusStock options, ESOPsRestricted stock
You get what you measure

Use only with permission of Susan Crosson
Homework
P 3