Embed Size (px)
Citation preview
1
CHAPTER 8: PROJECT MANAGEMENT
The aim is to coordinate and plan a single job consisting lots of tasks between which precedence relationships exist
2
Project planning
� Most popular planning tools are utilized in project management
� GANTT chart
� CPM (critical path method)
� PERT (program evaluation and review technique)
2
3
Project planning network
� The project consists of well-defined activities or tasks
� The activities have precedence relationships and must be performed in the proper order
4
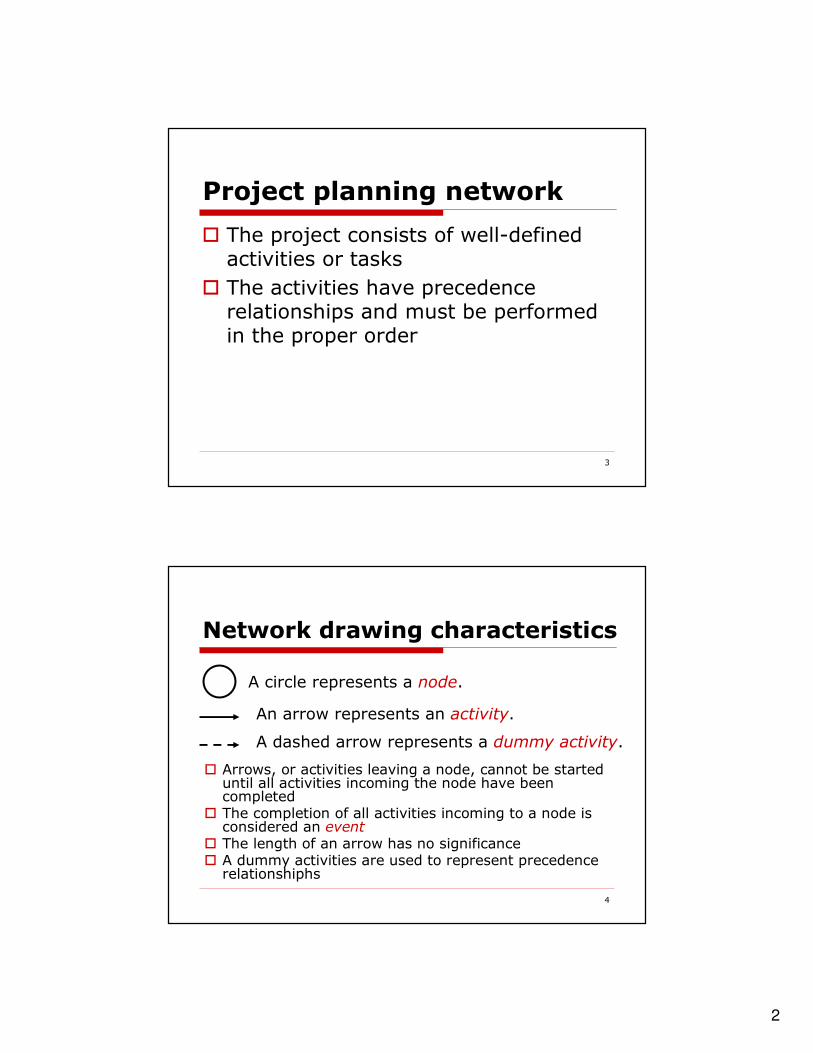
Network drawing characteristics
A circle represents a node.
An arrow represents an activity.
A dashed arrow represents a dummy activity.
� Arrows, or activities leaving a node, cannot be started until all activities incoming the node have been completed
� The completion of all activities incoming to a node is considered an event
� The length of an arrow has no significance� A dummy activities are used to represent precedence
relationshiphs

3
5
Example 9.1 (project of installing a precision rain gauge/wind sensor station)
6
Network drawing of example 9.1
4
7
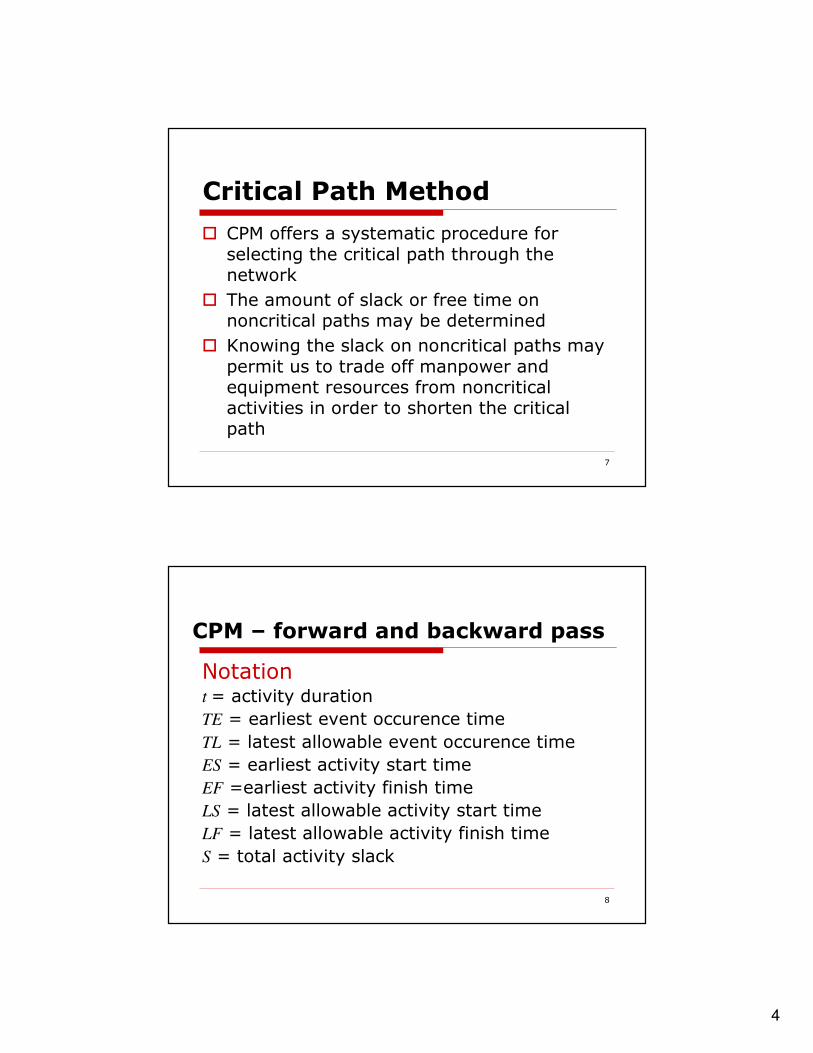
Critical Path Method
� CPM offers a systematic procedure for
selecting the critical path through the network
� The amount of slack or free time on noncritical paths may be determined
� Knowing the slack on noncritical paths may
permit us to trade off manpower and equipment resources from noncritical activities in order to shorten the critical path
8
CPM – forward and backward pass
Notationt = activity duration
TE = earliest event occurence time
TL = latest allowable event occurence time
ES = earliest activity start time
EF =earliest activity finish time
LS = latest allowable activity start time
LF = latest allowable activity finish time
S = total activity slack

5
9
Forward pass
� The forward pass provide the following information:
� The earliest event time (TE)
� The earliest activity start time (ES)
� The earliest activity finish time (EF)
10
Forward pass calculations
� The forward pass calculations start with the first activity (or activities)
� TE0 = 0 (initial event occurence time is 0)
� Each activity begins as soon as its predecessor event (node) occurs, that is TE = ES, thus EF = ES + t = TE +t
� The earliest event (node) occurence time is the largest of the earliest finish times of the incoming acivities, TE = max{EF1,EF2,...,EFn}

6
11
Backward pass
� The backward pass provide the following information:
� The latest allowable event time (TL)
� The latest allowable activity start time (LS)
� The latest allowable activity finish time (LF)
12
Backward pass calculations
� The backward pass calculations start with the last node
� The latest allowable event time of the terminal (last) node is set to the earliest event time , TE = TL
� The latest allowable finish time for an activity is its successor event’s latest allowable occurence time, LF = TL, thus LS = LF – t = TL – t
� The latest allowable time for an event is the smallest of the latest allowable start times of the leaving activities, TL = min{LS1,LS2,...,LSn}
7
13
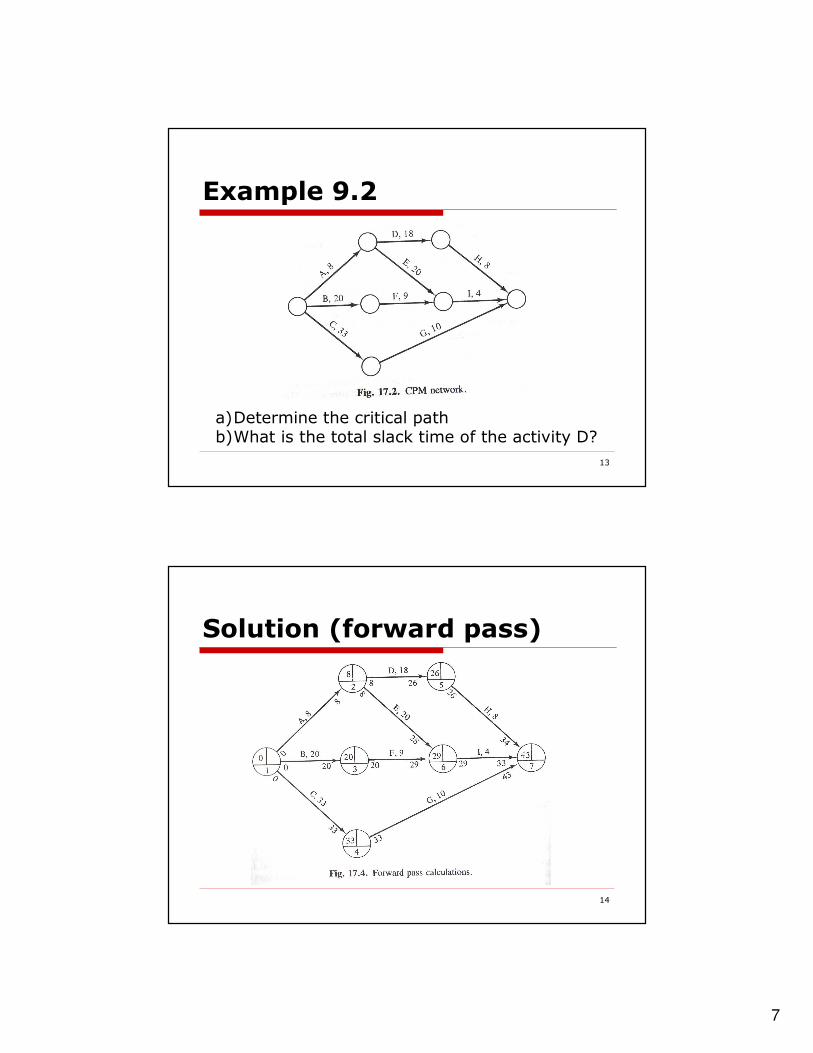
Example 9.2
a)Determine the critical pathb)What is the total slack time of the activity D?
14
Solution (forward pass)

8
15
Solution (backward pass)
Critical path is defined as the sequence of the activities having no slack
time (ES = LS and EF = LF) and TE = TL for each node
Critical path is as follows:
Activities C and GorNodes 1, 4 and 7
16
Solution (slack time)
Total activity slack time = Latest finish – Earliest finish
SD = LF – EF = 35 – 26 = 9 days
Delaying the start of activity D up to 9 days does not change the completion of the project
9
17
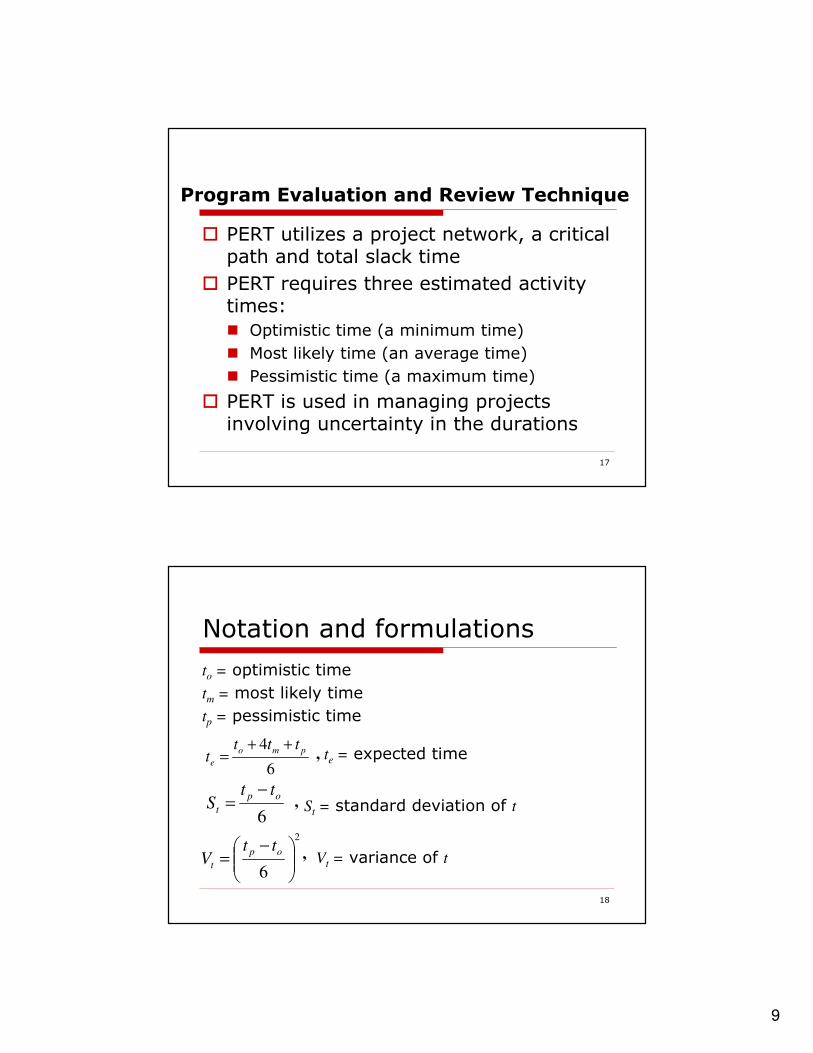
Program Evaluation and Review Technique
� PERT utilizes a project network, a critical path and total slack time
� PERT requires three estimated activity times:
� Optimistic time (a minimum time)
� Most likely time (an average time)
� Pessimistic time (a maximum time)
� PERT is used in managing projects involving uncertainty in the durations
18
Notation and formulations
to = optimistic time
tm = most likely time
tp = pessimistic time
6
4 pmo
e
tttt
++= te = expected time ,
6
op
t
ttS
−= St = standard deviation of t,
2
6
−=
op
t
ttV Vt = variance of t,
10
19
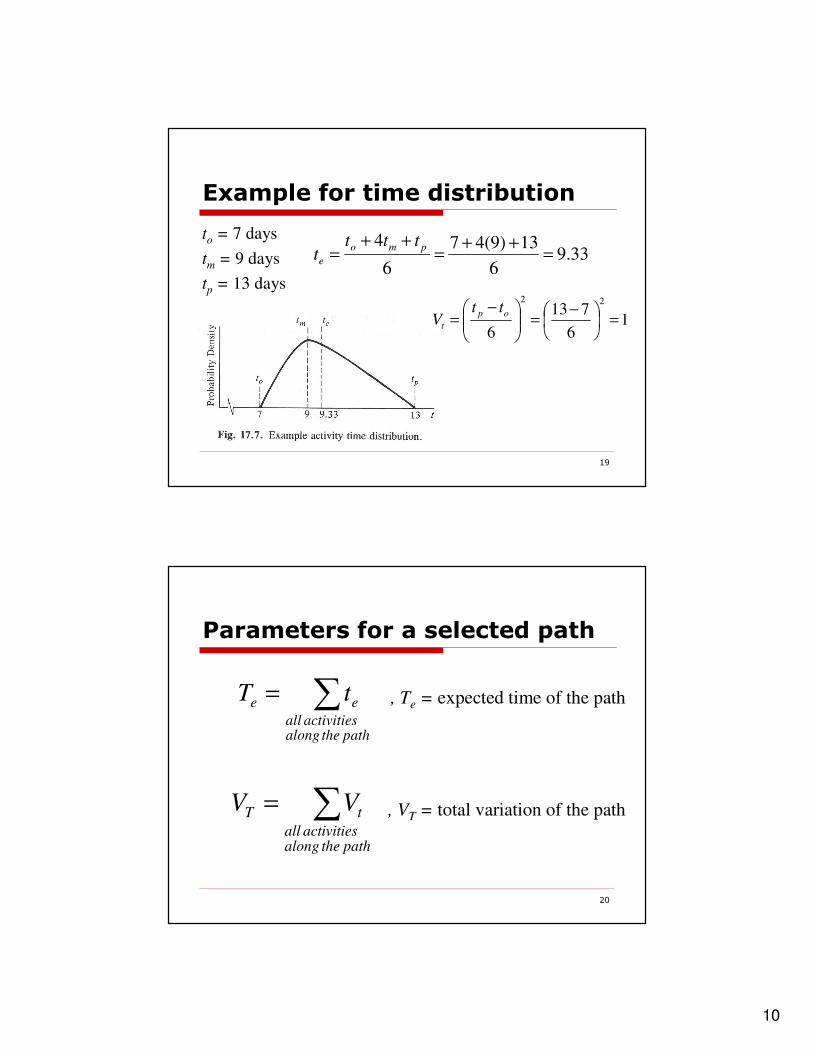
Example for time distribution
to = 7 days
tm = 9 days
tp = 13 days
33.96
13)9(47
6
4=
++=
++=
pmo
e
tttt
16
713
6
22
=
−=
−=
op
t
ttV
20
Parameters for a selected path
∑=
paththealongactivitiesall
ee tT , Te = expected time of the path
∑=
paththealongactivitiesall
tT VV , VT = total variation of the path
11
21
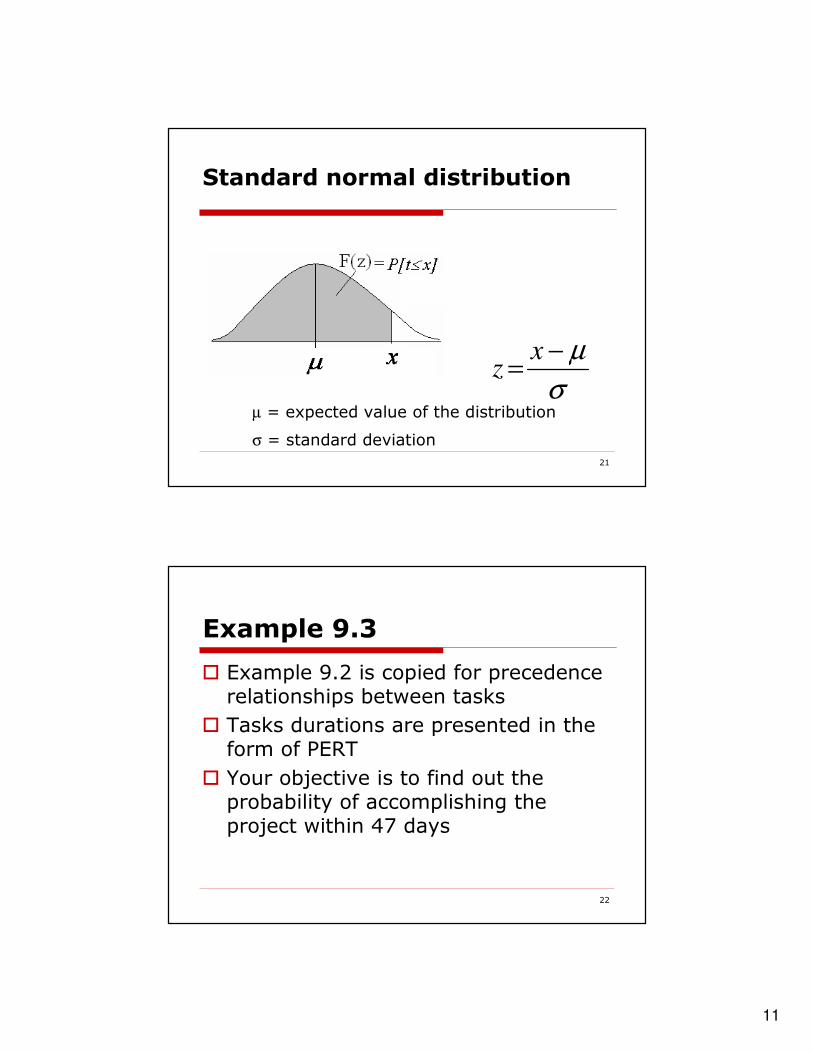
Standard normal distribution
σ
µ−=
xz
µ = expected value of the distribution
σ = standard deviation
22
Example 9.3
� Example 9.2 is copied for precedence relationships between tasks
� Tasks durations are presented in the form of PERT
� Your objective is to find out the probability of accomplishing the project within 47 days
12
23
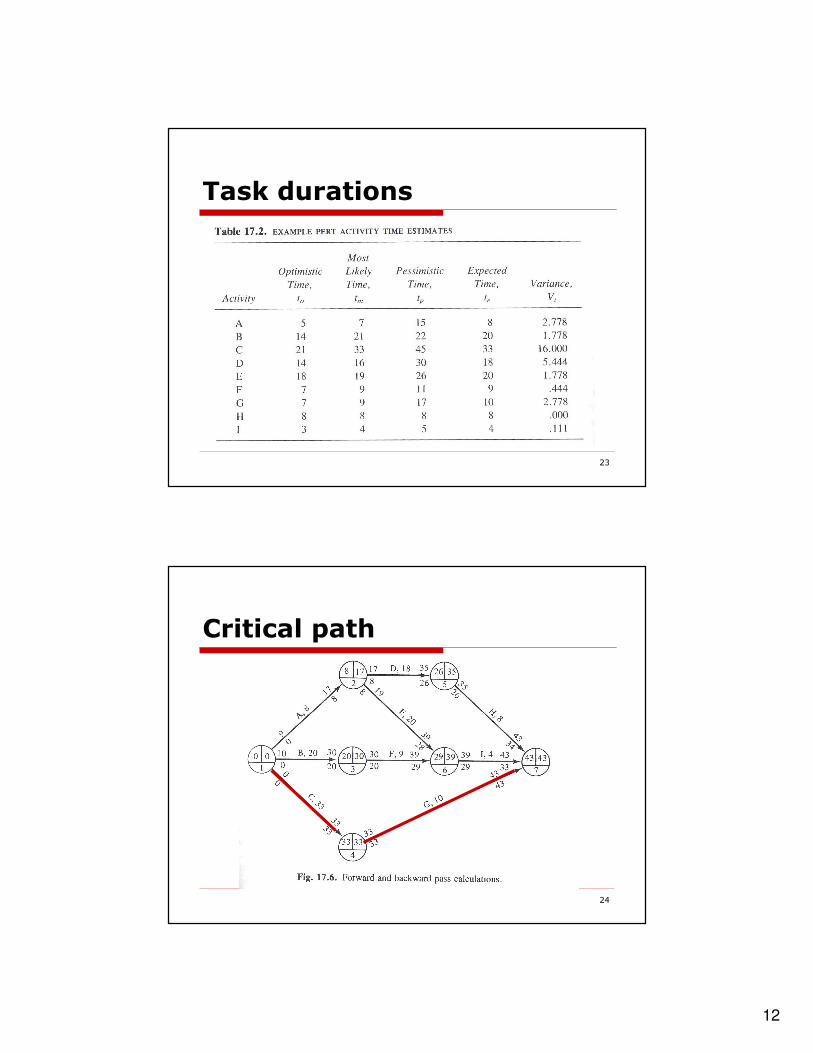
Task durations
24
Critical path

13
25
Parameters of critical path
431033,
=+==∑GC
ee tT
778.18778.2000.16,
=+==∑GC
tT VV
333.4778.18 ==TS
ST = standard deviation along the path
26
Probability of Te
≤≤≤≤ 47
923.0333.4
4347=
−=
−=
−=
T
e
S
Txxz
σ
µ
F(z) = F(0.923) = 0.8212 (from table)


![[XLS]web.iku.edu.trweb.iku.edu.tr/courses/insaat/ce636/LRFD_composite_beam... · Web viewWT155X43 WT155X39.5 WT155X37 WT155X33.5 WT155X30 WT155X26 WT155X22.25 WT155X19.35 WT155X16.35](https://img.pdfslide.net/doc/110x75/5abe21c07f8b9aa3088c8204/xlswebikuedutrwebikuedutrcoursesinsaatce636lrfdcompositebeamweb.jpg)