Embed Size (px)
Citation preview

Chapter 9 – It Is Not Food Versus Population

I. Reverend Thomas Malthus on population (1803)
A. Predicted that population would grow geometrically (exponentially)
B. 2, 4, 8, 16, 32, 64, 128
C. Humans would not be able to control their own population

World population
0
1
2
3
4
5
6
0 100 200 300 400 500 600 700 800 900 1000 1100 1200 1300 1400 1500 1600 1700 1800 1900 2000
Year (A.D.)
Bill
ions
of p
eopl
e

D. Predicted that food supply could only increase arithmetically (linearly) 1, 2, 3, 4, 5, 6, 7, 8, 9, 10
1. Famine would be the ultimate check on world population.
E. Food production has increased even faster than population1. Food production per capita has increased dramatically over the past 35 years
a. 1961: calories per capita per day = 2,235
b. 1995: calories per capita per day = 2,712
II. Population began to increase rapidly around 6000 to 8000 B.C. after agriculture replaced hunting and gathering as the major method of obtaining food
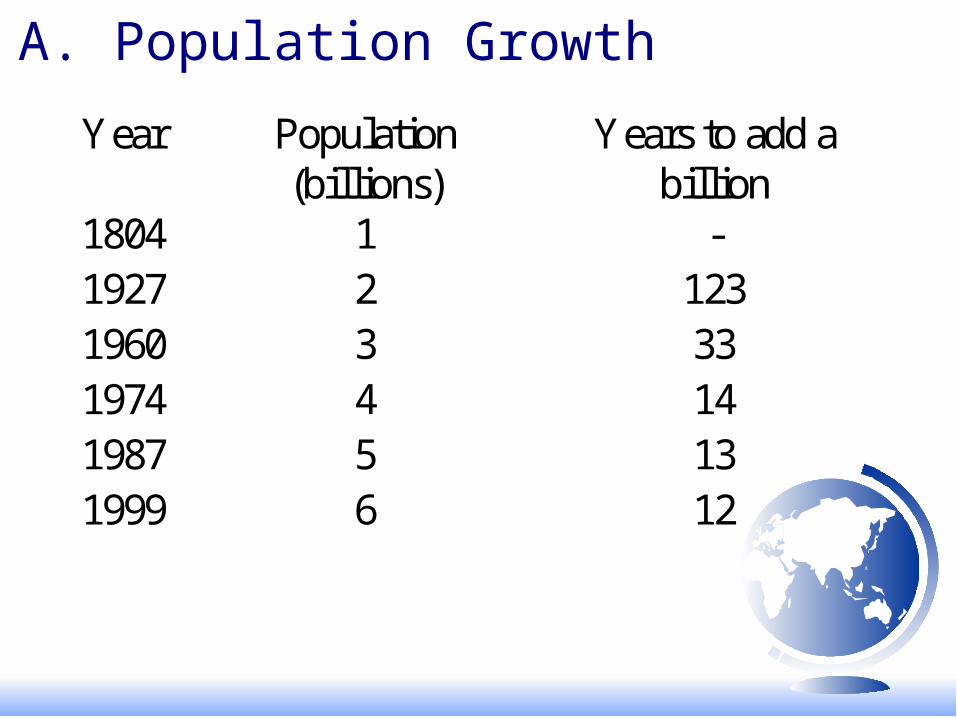
A. Population Growth
Year Population (billions)
Years to add a billion
1804 1 - 1927 2 123 1960 3 33 1974 4 14 1987 5 13 1999 6 12

1. Rate of population growth peaked at 2% per year in 1965 and has declined to 1.3% today (Figure 9.6-p.139)
a. Rapid population growth in the present implies continued population growth in the future even if the current population reduces the number of children it has to replacement levels (2 children per woman)

b. This will happen as the large number of people born today reach child-bearing age
(see population pyramid p.174)

2. Fertility = average number of children born to a woman during her lifetime
Year FertilityDevelopedCountries
FertilityDevelopingCountries
1950 2.8 6.2
Present 1.6 3.3
2050 2.1 2.1
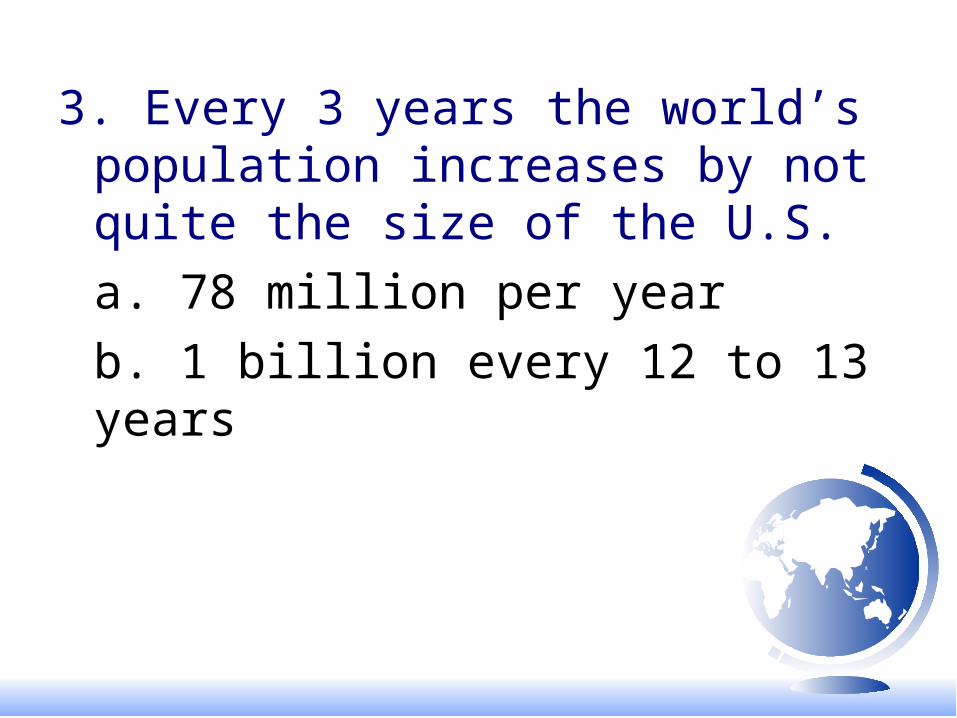
3. Every 3 years the world’s population increases by not quite the size of the U.S.
a. 78 million per year
b. 1 billion every 12 to 13 years

Country Fertility rateU.S. 2Mexico 3.1Brazil 2.5India 3.4China 1.8Niger 7.4Spain, Italy, Russia 1.2

B. Population Projections for the Year 2050
Projection Population (millions)
Percentage Increase from 2000
UN Low 7,409 22.04
UN Medium 8,919 46.92
Census Bureau 9,084 49.44
UN High 10,633 75.16
Table 9.1 page 140

Demographic transition
I. Preindustrial Stage or Slow growth stage
high birth rate high death rate

II. Mortality decline before fertility decline or Rapid growth stage
high birth rate low death rate
III. Fertility Decline birth rate declines low death rate

IV. Modern Stage: low birth rate low death rate
Both around 12 per 1,000

C. Where is population growing?1. 6 of the 10 fastest growing countries are in sub-Saharan Africa
2. China and India are the 2 most populous countries
3. U.S. is fastest growing industrialized country
4. Europe is losing population or growing very slowly

D. Reasons for declining death rate1. Medical improvements
a. Antibiotics
b. Immunization2. Food aid during disasters3. Public health improvements
a. Sanitationb. Control of malaria-bearing mosquitoes

E. AIDS/HIV1. UN estimates for the end of 2002:
a. 40 million people worldwide living with HIV/AIDS
b. 3 million deaths due to HIV/AIDS in 2002c. Cumulative deaths due to HIV/AIDS
in 2000 was 21.8 milliond. 5.3 million people newly infected
with HIV in 2000
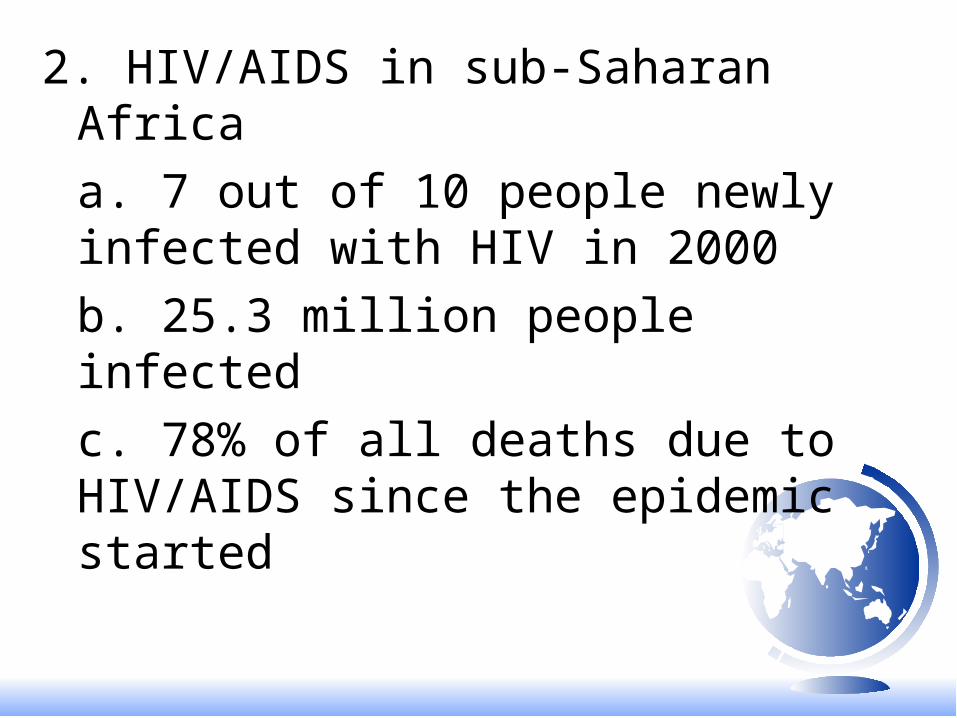
2. HIV/AIDS in sub-Saharan Africa
a. 7 out of 10 people newly infected with HIV in 2000
b. 25.3 million people infected
c. 78% of all deaths due to HIV/AIDS since the epidemic started

d. Infection rates range from 2% of the adult population in western Africa to 20% in southern Africa
e. In 8 countries AIDS will claim the lives of a third of today’s 15 year olds
f. In South Africa and Zimbabwe, where a fifth or a quarter of the adult population is infected, AIDS will claim the lives of around half of all 15-year-olds.
g. In Botswana, where about one in three adults are already HIV-infected – the highest prevalence rate in the world – no fewer than two-thirds of today’s 15-year-old boys will die prematurely of AIDS.
3. AIDS effect on population by 2020 in sub-Saharan Africa could be severe (U.S. Census Bureau estimates)
a. 45 % smaller in Uganda
b. 35% smaller in Rwanda
c. 30% smaller in Malawi

F. Changes in life expectancyYear Life expectancy
developedcountries
Life expectancydevelopingcountries
1950 66 40
present 75 63
2050 81 76

IV. Why do people in LDCs have children?A. Emotional satisfaction
B. Investment
1. Children can work
2. Children can support aging parents
C. High child mortality leads to greater number of children

D. What causes birth rates to decline?
1. Family planning programs
2. As women’s income and education levels increase they decide to have fewer children.
a. Women given the ability to choose, decide to have
fewer children

V. Population density - the number of people in a given area
1. Why does the number of people per square kilometer or square mile matter?
a. Natural resource base may not be able to sustain a large number of people
b. The “demographic trap” (Quote from Brown&Kane p.138) – ecological carrying capacity reached
(high birth rates and high death rates)