Embed Size (px)
Citation preview
300
Chapter 9: Patient-reported Health Instruments used for people with Stroke
There are two types of stroke: ischaemic, where there is either a cerebral thrombosis or embolism obstructing the blood supply; or haemorragic, either intracerebral or subarachnoid. There are several problems or disabilities stroke survivors may face in the first few weeks after having a stroke. Most of these will improve over time as the brain recovers. In severe cases, they may cause long-term disability. Hemiplegia is the most common symptom of a stroke, usually happening in one side of the body. The weakness or paralysis results in unsteady gait and stiffness or spasticity of the muscles and joints. There are many other problems associated with having a stroke including functional aspects such as difficulty in swallowing (dysphagia), speaking and understanding (dysphasia); impaired mobility; and increased need for assistance with activities of daily living. The emotional impact of having a stroke combined with the inability to communicate effectively causes further burden to the patient and carers. Recovery can be slow and full functioning may never return to pre-stroke status.
The following review provides current information available on the patient-reported health questionnaires used to measure health-related quality of life in patients with stroke.
Search terms and results: identification of articles
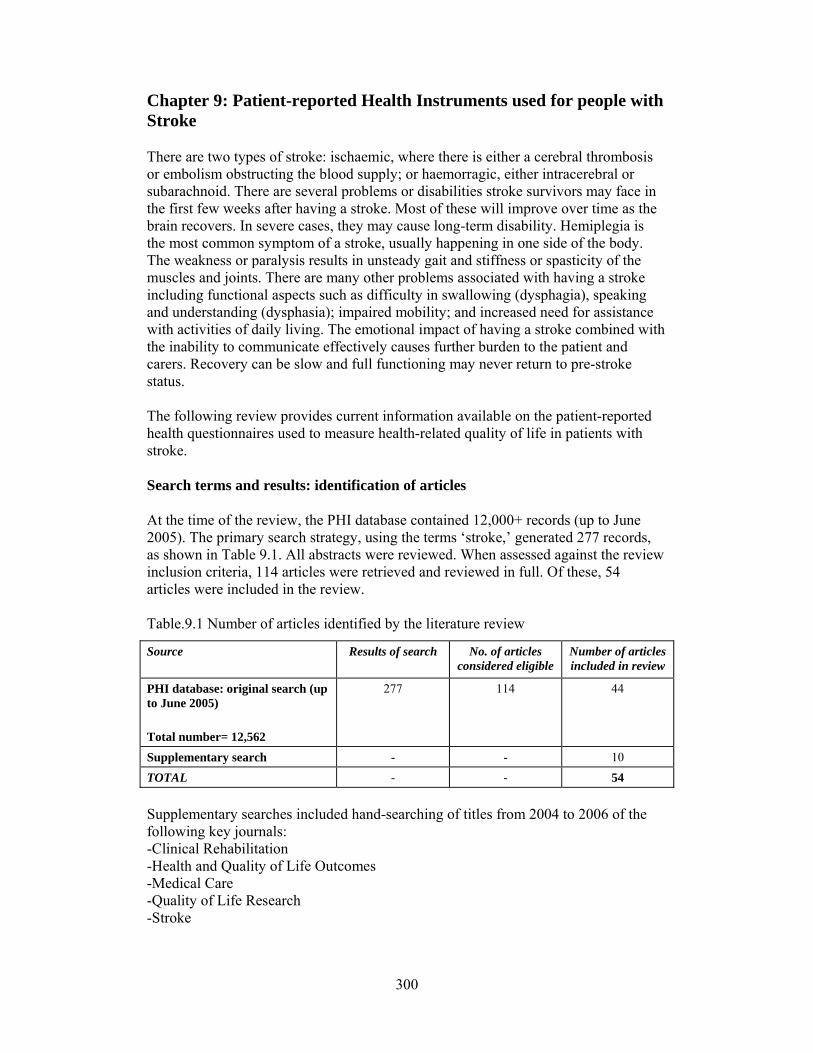
At the time of the review, the PHI database contained 12,000+ records (up to June 2005). The primary search strategy, using the terms ‘stroke,’ generated 277 records, as shown in Table 9.1. All abstracts were reviewed. When assessed against the review inclusion criteria, 114 articles were retrieved and reviewed in full. Of these, 54 articles were included in the review. Table.9.1 Number of articles identified by the literature review
Source
Results of search No. of articles considered eligible
Number of articles included in review
PHI database: original search (up to June 2005) Total number= 12,562
277 114 44
Supplementary search - - 10 TOTAL - - 54 Supplementary searches included hand-searching of titles from 2004 to 2006 of the following key journals: -Clinical Rehabilitation -Health and Quality of Life Outcomes -Medical Care -Quality of Life Research -Stroke
301
Further searches were conducted within the bibliography and using PubMed per instrument up to September 2006. Identification of patient-reported health instruments Six generic and 10 stroke-specific instruments were included in the review. The developmental and evaluative studies relating to the generic instruments reviewed are listed in Tables 9.2 to 9.5. Those relating to stroke-specific instruments are shown in Tables 9.8 to 9.14. RESULTS: GENERIC PATIENT-REPORTED HEALTH INSTRUMENTS Six generic instruments were identified which were evaluated with patients with stroke. Full details of the development, domains and scoring methods are detailed in Chapter 3.
The following instruments measurement properties are reported:
a) SF-36 b) SF-12 c) SF-6D d) EQ-5D e) Health Utilities Index f) Nottingham Health Profile
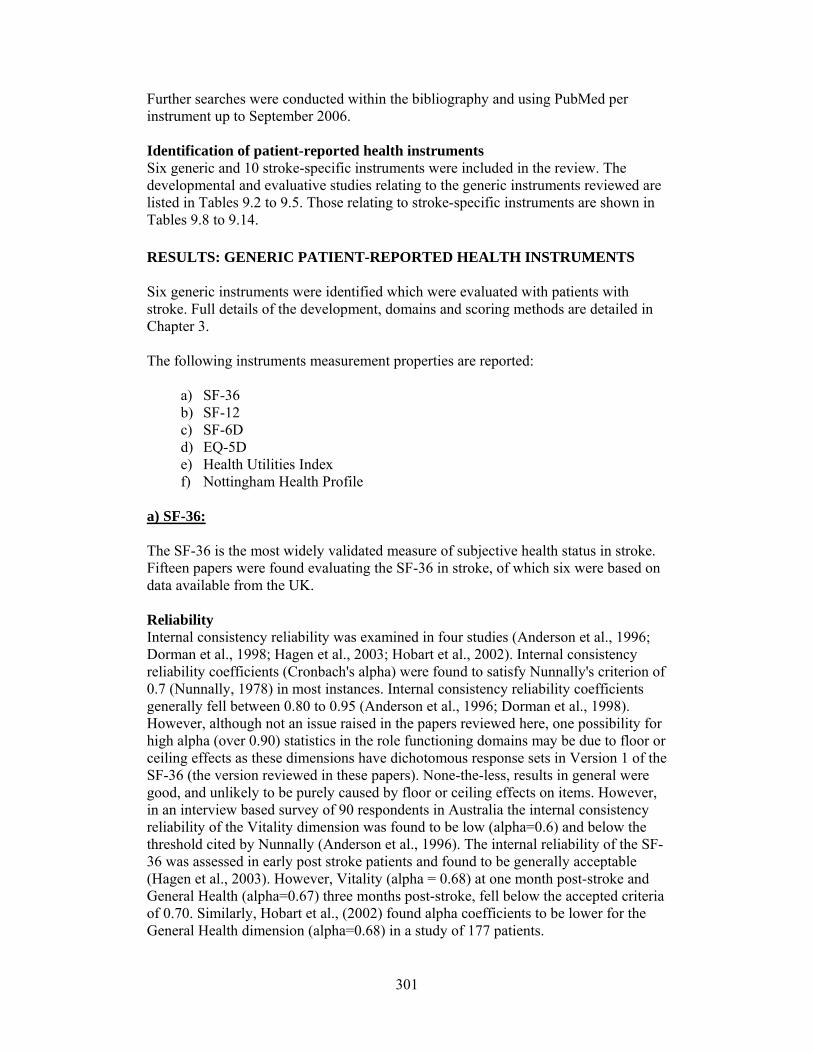
a) SF-36: The SF-36 is the most widely validated measure of subjective health status in stroke. Fifteen papers were found evaluating the SF-36 in stroke, of which six were based on data available from the UK. Reliability Internal consistency reliability was examined in four studies (Anderson et al., 1996; Dorman et al., 1998; Hagen et al., 2003; Hobart et al., 2002). Internal consistency reliability coefficients (Cronbach's alpha) were found to satisfy Nunnally's criterion of 0.7 (Nunnally, 1978) in most instances. Internal consistency reliability coefficients generally fell between 0.80 to 0.95 (Anderson et al., 1996; Dorman et al., 1998). However, although not an issue raised in the papers reviewed here, one possibility for high alpha (over 0.90) statistics in the role functioning domains may be due to floor or ceiling effects as these dimensions have dichotomous response sets in Version 1 of the SF-36 (the version reviewed in these papers). None-the-less, results in general were good, and unlikely to be purely caused by floor or ceiling effects on items. However, in an interview based survey of 90 respondents in Australia the internal consistency reliability of the Vitality dimension was found to be low (alpha=0.6) and below the threshold cited by Nunnally (Anderson et al., 1996). The internal reliability of the SF-36 was assessed in early post stroke patients and found to be generally acceptable (Hagen et al., 2003). However, Vitality (alpha = 0.68) at one month post-stroke and General Health (alpha=0.67) three months post-stroke, fell below the accepted criteria of 0.70. Similarly, Hobart et al., (2002) found alpha coefficients to be lower for the General Health dimension (alpha=0.68) in a study of 177 patients.
302
Reproducibility of the SF-36 was assessed in a study of UK patients randomly selected from the International Stroke Trial (Dorman et al., 1999). SF36 domains were generally found to be acceptable, except for the Mental Health domain (ICC=0.30 when completed by patients; ICC=0.24 when patient assisted by a relative or friend). However, 95% CIs for the mean differences between scores between test and re-test were substantial across dimensions. Reproducibility was higher when patients completed instruments alone than when they were proxy rated. Item-total correlations were reported to be good by Hagen et al., (2003), although the worst were for the item 'I expect my health to get worse' in the General Health scale. This item may well seem irrelevant after a stroke. Validity Construct validity was assessed by Hobart et al., (2002) who reported item-total correlations in excess of 0.4 for all items in their respective dimensions, except for two items in the General Health scale. Dorman et al., (1999) found that the domains of Physical Functioning, Social Functioning, Bodily Pain and General Health as measured by the SF-36 and EuroQol instruments were strongly correlated. However, Mental Health as measured on the SF-36 was poorly correlated with the Psychological Functioning domain of the EuroQol (rho =0.21, p<0.001). The authors suggest that this may be due to the fact that the domains are measuring somewhat different constructs. However, the authors also suggest that the SF-36 Mental Health domain may have poor measurement properties in stroke, and they suggest poor reproducibility (ICC=0.28) as evidence of this. However, as they failed to ask recipients if any aspect of their health had changed since baseline it is difficult to know if these results reflect change or poor measurement properties on the Mental Health dimension of the SF-36. They also suggest that as many questionnaires were completed by proxies, and proxy report is unreliable when assessing mental health, this could be a major cause of the Mental Health domain's apparent measurement problems. Hackett et al., (2004) compared SF-36 scores of stroke patients who had experienced a stroke six years previously with age-sex standardised normative data. They found scores were worse for stroke patients on six of the eight domains, but that Mental Health and Pain scores did not differ from the controls. Anderson et al., (1996) assessed the construct validity by comparing the SF-36 scores to those on the patient completed Barthel Index (a measure of physical disability) and the 28-item General Health Questionnaire (a measure of non-psychotic psychiatric disturbance), controlling for age and sex in multiple regression analyses. Significant associations were found between the Physical Functioning scale on the SF-36, the Barthel Index (Beta=-0.55, p<0.001), and the Role Limitations-Emotional and Social Functioning scales and the GHQ-28 total score (Beta=-0.41, p<0.001). Furthermore, Anderson et al., (1996) did not find evidence of ceiling effects on any of the dimension scores which, they claim, is a common problem on many disability scales. However, they were critical of the measurement properties of the Social Functioning scale. They utilised an instrument called the Adelaide Activities Profile (AAP) (Clark et al., 1995) to assess daily activities, including domestic chores, household maintenance, service to others and social functioning. They found no association
303
between AAP scores and scores on the Social Functioning scale and concluded that the Social Functioning domain did not assess in a way that was meaningful to stroke patients. Hagen et al., (2003) found significant correlations between SF-36 domains and a self completed version of the Barthel Index and the Canadian Neurological Scale (Cote et al., 1986) over three administrations. The Physical Functioning domain was very highly correlated with the Barthel Index and the Canadian Neurological Scale. Duncan et al., (2002) found moderate correlations between physical measures of health status on the Stroke Impact Scale and the Physical Dimension of the SF-36. Patel et al., (2006) found a graded positive relationship between all SF-36 domains and the Barthel Index and Frenchay Activities Index. Scores on the Physical Function domain of the SF-36 were found to be highly related to the modified Rankin Stroke Outcome Scale (a measure of disability assessed by clinicians) in a survey of 459 stroke patients in the USA (Duncan et al., 2000). The developers of the SF-36 suggest a method of calculating two summary scores from the results gained on the eight dimensions. Hobart et al., (2002) tried to replicate this work using higher order factor analytic techniques on their data. They found the hypothesised two factor solution, but as it accounted for only 60% of the variance they argue that a substantial amount of the information is lost by reporting these summary statistics alone. Williams et al., (1999b) found, in a regression analysis that the SF-36 did not predict overall self-reported quality of life, and suggest the instrument may be insufficiently sensitive to quality of life changes after stroke. Responsiveness Responsiveness was assessed in patients at one, three and six months post-stroke (Hagen et al., 2003). The authors suggest that low sensitivity to change was found on three SF-36 scales: Bodily Pain, General Health and Mental Health, and for other subscales sensitivity to change was comparable to the Barthel Index. However, the evidence presented in their paper suggests that the Barthel Index indicated far greater change (SRM=0.51) than that found on any of the dimensions on the SF-36 (indeed, the SRMs only get close to this on two dimensions: Social Functioning=0.39; Role Physical = 0.33). Precision Floor and ceiling effects were reported in a number of studies. Role Physical was found to have substantial floor effects (70%) in the study reported by Hagen et al., (2003). Other 'end' effects reported in that study included 35% ceiling effects for the Pain dimension, 23% scores exhibiting a floor effect for Physical Functioning and 27% floor and 16% ceiling effects for Social Functioning. Hobart et al., (2002) also found serious floor effects (59.1%) for the Role Physical dimension and ceiling effects for Social Functioning (29.9%), Bodily Pain (25.6%) and Role Emotional (63.1%) domains. Somewhat different results were reported by Anderson et al., (1996), who found considerable ceiling effects for the Role Physical, Role Limitations, Social Functioning and Bodily Pain dimensions of the SF-36, and
304
Hamedani et al., (2001) who also found ceiling effects for Physical Functioning, Role Physical, Bodily Pain, Social Functioning and Role Emotional. O'Mahony et al., (1998) report ceiling effects on the Role Emotional, Role Physical, Social Functioning, Mental Health, and Bodily Pain dimensions in a small scale survey of older stroke patients. They also report floor effects on Role Physical, Role Emotional, Mental Health and Physical Functioning domains. Pickard et al., (2005) report ceiling effects on the Role Emotional domain and floor effects on the Physical Functioning, Role Physical and Role Emotional domains. Lai et al., (2004) compared results gained from the SIS Participation Domain and the SIS-16 (measuring Physical Function) with the SF-36 Social Functioning and Physical Functioning Domains. Rasch analyses indicated that both the SIS-16 and SF-36 Physical Functioning domain both showed a good spread of item difficulty, but the SIS-16 incorporates easier items that are capable of measuring lower levels of physical functioning in patients with severe stroke. Similar analyses of the SIS Participation domain and the SF-36 Physical Functioning domain indicated that the SIS measure has widespread item difficulty, whereas the SF-36 domain does not. The Social Functioning domain of the SF-36 contains only two items, measuring the same level of item difficulty, leading to severe ceiling effects and consequently an inability to discriminate among more active patients. Acceptability Anderson et al., (1996) reported that of the 124 patients approached to undertake an interview administration of the SF-36, 13 were unable to communicate sufficiently well to complete the instrument. Dorman et al., (1999) randomly selected UK patients from the International Stroke Trial. An initial survey was undertaken in which patients completed either the EuroQol questionnaire or the SF-36. Respondents to the EuroQol were then mailed a copy of the SF-36 at a three week follow-up (n=272), and respondents to the EuroQol were mailed a copy of the SF-36 at follow-up (n=505). Ninety-one percent sent the EuroQol at follow-up replied, whilst 85% of those sent the SF-36 at follow-up responded. O'Mahony et al., (1998) reported poor completion rates on the SF-36 and consequently difficulties calculating dimension scores in older age group stroke patients. Similarly, O'Mahony et al., (1998) claimed that completion rates for some items were as low as 66%. Hagen et al., (2003) simply reported that some of the patients in their study 'encountered some problems' completing the SF-36. Dorman et al., (1997, 1999) randomised all patients who had been entered by UK centres to the International Stroke Trial between March 1992 and May 1995, who were not known to have died, to either the EuroQol or SF-36 instruments. The acceptability of the EuroQol appeared superior with a 5% difference in returns between the two measures, whilst missing data was found on returned SF-36 forms in 45% cases and 34% on the EuroQol. Feasibility Segal and Schall (1994) evaluated the feasibility of using reports by carers to complete the SF-36 (which they refer to in the paper as the Health Status Questionnaire - HSQ). Proxy agreement with patient evaluations was low, and the authors claim that the instrument is an inadequate outcome measure in stroke. They
305
find high levels of association between patient and carer completion of functional assessment measures (the Functional Independence Measure - FIM and Frenchay Activities Index - FAI), which they suggest indicates their superior measurement properties. This view could be criticised as the FAI and FIM were designed for completion by observers of the patient, whereas the SF-36 was designed to tap subjective experience, which is not always readily observed. b) SF-12 The SF-12 contains a sub-set of the items included in the SF-36, and was initially designed to reduce patient burden and provide the summary Mental Health and Physical Health Component Scores. The instrument was assessed in six papers, none of which were based on data collected in the UK. Reliability Bohannon et al., (2004a) evaluated the internal consistency of the twelve items of the SF-12 using the alpha statistic, and found internal consistency reliability for the measure as a whole to be high at three different times, following stroke, and three months and twelve months after stroke (alpha values = 0.83, 0.88 and 0.89, respectively). Bohannon et al., (2004b), in a separate study, evaluated the test-retest reliability of the SF-36 in a small telephone interview based survey of 31 stroke patients. The SF-12 was administered at two occasions 16.2 +/- 5 days apart. The mean difference between the two administrations was less than 1.5 points on both the Physical Component Scale (PCS) and Mental Component Scale (MCS) scores. The authors claim that ICC's for both summary scores of 0.80 p<0.001, are good, though more realistically this result may be judged as promising or satisfactory. In part, ICC’s may not be higher as the authors did not indicate that they had removed any respondent who reported their health had changed during the period between the two administrations of the instrument. Internal consistency reliability of the SF-12 was found to be high by King et al., (2005), with a reported alpha of 0.76. Similarly, internal consistency reliability is reported by Lim and Fisher (1999), in a study of heart disease and stroke patients, for both ‘the items’ of the PCS and MCS. This appears to suggest that the authors have used different items to calculate the PCS and MCS scores. This is not the method by which SF-12 scores are calculated, as the developers suggest that they are created by differentially weighting the same items: consequently, it is difficult to interpret the results reported by Lim and Fisher (1999). However, their results would tend to suggest that they may have incorrectly calculated the PCS and MCS, or they have calculated alpha coefficients on weighted items. Validity The developers of the SF-12 claim that it can be used to measure two distinct domains, the Physical and Mental Component scores. Consequently, Bohannon et al., (2004) used principal components analysis with varimax rotation to determine if the hypothesised scales existed in the SF-12 for a stroke sample. The analysis resulted in a two factor solution, which, the authors state, 'presumably' reflects the hypothesised dimensions.
306
Lim and Harris (1999) report that trends for PCS and MCS scores were worse for those who were older and women who had longer hospital stays. However, the statistically significant results are possibly due to multiple comparisons on a large dataset. Furthermore, the data are aggregated heart disease and stroke patients. Rubenach et al., (2000) in a small scale telephone survey found that PCS scores were able to discriminate patients classified as dependent from those classified as independent in activities of daily living as indicated on the Barthel Index. They also found poorer PCS and MCS scores observed in patients with high GHQ-28 scores. They suggest this provides evidence that the SF-12 provides a ‘valid indicator of health-related quality of life among patients with stroke’. However the association of GHQ-28 scores with the PCS may be seen as evidence against such a claim. The authors counter such a potential criticism by claiming that the GHQ-28 ‘may reflect questions with a somatic emphasis’. This is indeed true (the GHQ-28 can provide a Somatic sub-scale score), but scores can be calculated from the GHQ-28 to overcome this (i.e. scores for the Severe Depression and Anxiety sub-scales). However, Rubenach et al., (2000) do not undertake such analyses. King et al., (2005) found a relationship between Hospital and Anxiety Scale (HAD) Anxiety scores and the MCS on the SF-12. However, no such relationship was found between MCS and the HAD Depression scale. The authors suggest that the HAD Depression scale is measuring a somewhat different aspect of mental health than the MCS, which is assessing general mental health status. They also report high levels of association between functional status measures (including the self-report Barthel Index and Glasgow Outcome Scale) and the PCS. Pickard et al., (1999) compared SF-12 Physical Mobility Component Scores (PCS-12) to SF-36 Physical Mobility Component Scores (PCS-36) and found them be highly correlated (intra-correlation coefficient 0.95). Similarly, Mental Health Component Scores (MCS-12) were compared to SF-36 Mental Health Component Scores (MCS-36) and found to be highly correlated (ICC = 0.97). Mean scores between the two measures were separated by only a few points (Pickard et al., 1999). However, such small differences can be meaningful (Jenkinson 1998), and could mean the SF-12 is not exactly replicating SF-36 results in this patient group. Responsiveness Bohannon et al., (2004) report results from a longitudinal survey over a period of twelve months, and report that PCS scores drop three months after stroke, and then improve at follow-up twelve months later. MCS scores did not change over the 12 months of the study. The authors claim that these results suggest that the SF-12 is sensitive to changes in health as a result of stroke, but provide no evidence that the changes are either accurate or meaningful. Precision No data available. Acceptability Lim and Harris claim that over 50% of respondents (heart disease and stroke patients) omitted at least one item which, unless a data substitution algorithm is used, would suggest over half of the PCS and MCS scores could not be calculated. Rubenach et
307
al., (2000), however, claim that the SF-12 may be an appropriate instrument to use in postal surveys. In a small scale survey (n=45) by telephone they claimed that ‘85% of patients who were able to be interviewed fully completed the SF-12’. Feasibility No data available. c) SF-6D The SF-6D index score can be calculated from six items of the SF-36. It is only included in this review because any data set containing the SF-36 is amenable to such analyses. It is a preference/utility based measure intended for providing an index intended for use in QALY calculations. Reliability No data available. Validity QALY estimates based on the SF-6D were half as large as those calculated when using the HUI3 or EQ-5D Index (Pickard et al., 2005), which may cast some doubt as to the appropriateness of this instrument in stroke. Responsiveness The SF-6D was found to be more responsive to change than the EuroQol (Pickard et al., 2005). Pickard et al., (2005) also report that change scores were found to be highly correlated with EQ-VAS, EQ-5D Index and HUI3. Precision No data available. Acceptability No data available. Feasibility No data available.
308
a) SF-36; SF12; SF-6D
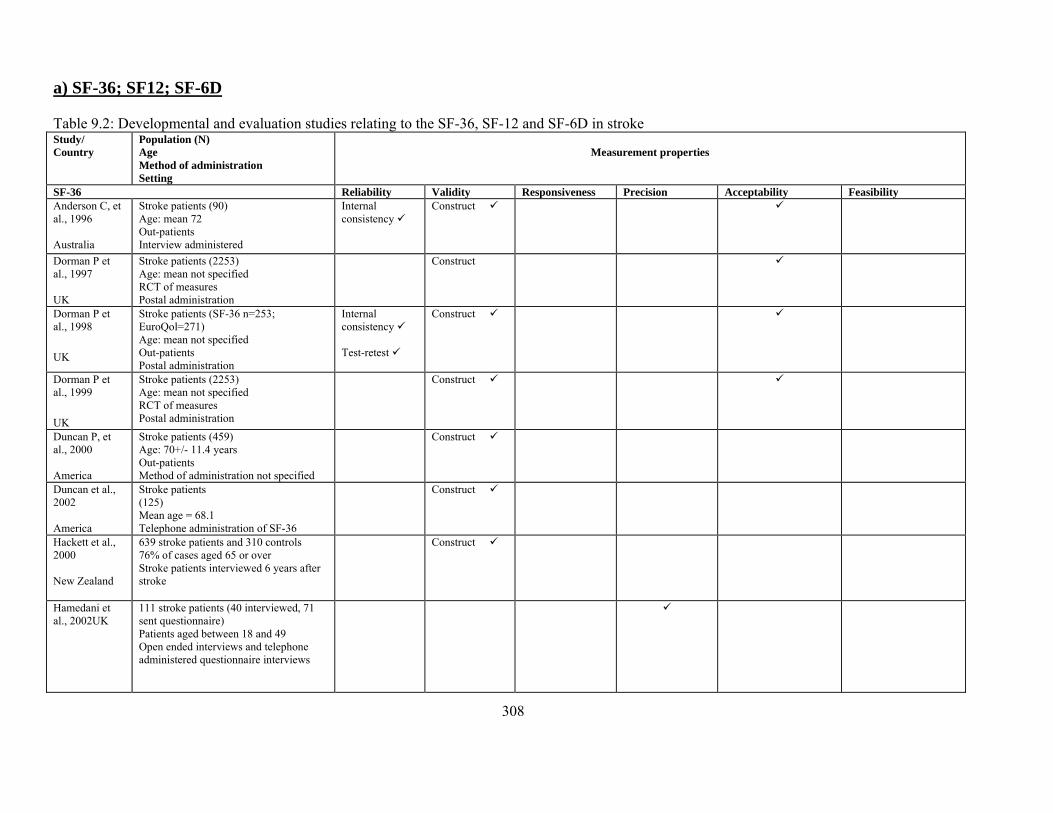
Table 9.2: Developmental and evaluation studies relating to the SF-36, SF-12 and SF-6D in stroke Study/ Country
Population (N) Age Method of administration Setting
Measurement properties
SF-36 Reliability Validity Responsiveness Precision Acceptability Feasibility Anderson C, et al., 1996 Australia
Stroke patients (90) Age: mean 72 Out-patients Interview administered
Internal consistency
Construct
Dorman P et al., 1997 UK
Stroke patients (2253) Age: mean not specified RCT of measures Postal administration
Construct
Dorman P et al., 1998
UK
Stroke patients (SF-36 n=253; EuroQol=271) Age: mean not specified Out-patients Postal administration
Internal consistency Test-retest
Construct
Dorman P et al., 1999
UK
Stroke patients (2253) Age: mean not specified RCT of measures Postal administration
Construct
Duncan P, et al., 2000 America
Stroke patients (459) Age: 70+/- 11.4 years Out-patients Method of administration not specified
Construct
Duncan et al., 2002 America
Stroke patients (125) Mean age = 68.1 Telephone administration of SF-36
Construct
Hackett et al., 2000 New Zealand
639 stroke patients and 310 controls 76% of cases aged 65 or over Stroke patients interviewed 6 years after stroke
Construct
Hamedani et al., 2002UK
111 stroke patients (40 interviewed, 71 sent questionnaire) Patients aged between 18 and 49 Open ended interviews and telephone administered questionnaire interviews
309
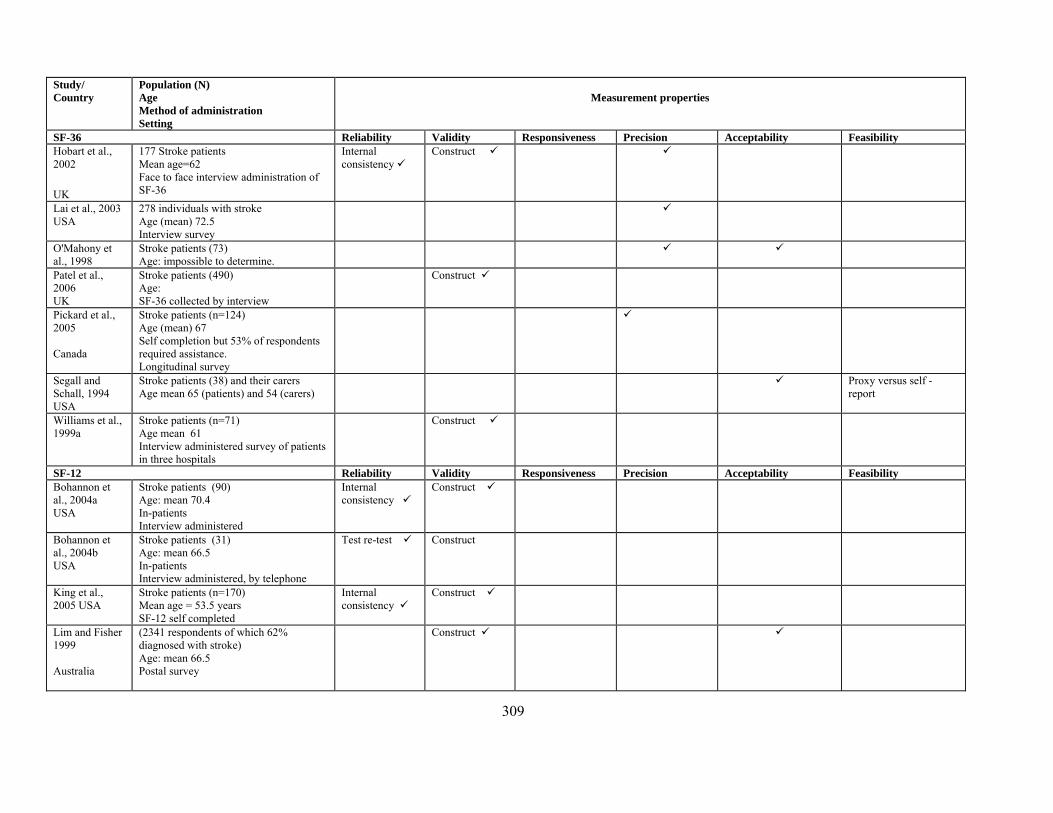
Study/ Country
Population (N) Age Method of administration Setting
Measurement properties
SF-36 Reliability Validity Responsiveness Precision Acceptability Feasibility Hobart et al., 2002
UK
177 Stroke patients Mean age=62 Face to face interview administration of SF-36
Internal consistency
Construct
Lai et al., 2003 USA
278 individuals with stroke Age (mean) 72.5 Interview survey
O'Mahony et al., 1998
Stroke patients (73) Age: impossible to determine.
Patel et al., 2006 UK
Stroke patients (490) Age: SF-36 collected by interview
Construct
Pickard et al., 2005 Canada
Stroke patients (n=124) Age (mean) 67 Self completion but 53% of respondents required assistance. Longitudinal survey
Segall and Schall, 1994 USA
Stroke patients (38) and their carers Age mean 65 (patients) and 54 (carers)
Proxy versus self -report
Williams et al., 1999a
Stroke patients (n=71) Age mean 61 Interview administered survey of patients in three hospitals
Construct
SF-12 Reliability Validity Responsiveness Precision Acceptability Feasibility Bohannon et al., 2004a USA
Stroke patients (90) Age: mean 70.4 In-patients Interview administered
Internal consistency
Construct
Bohannon et al., 2004b USA
Stroke patients (31) Age: mean 66.5 In-patients Interview administered, by telephone
Test re-test Construct
King et al., 2005 USA
Stroke patients (n=170) Mean age = 53.5 years SF-12 self completed
Internal consistency
Construct
Lim and Fisher 1999 Australia
(2341 respondents of which 62% diagnosed with stroke) Age: mean 66.5 Postal survey
Construct
310
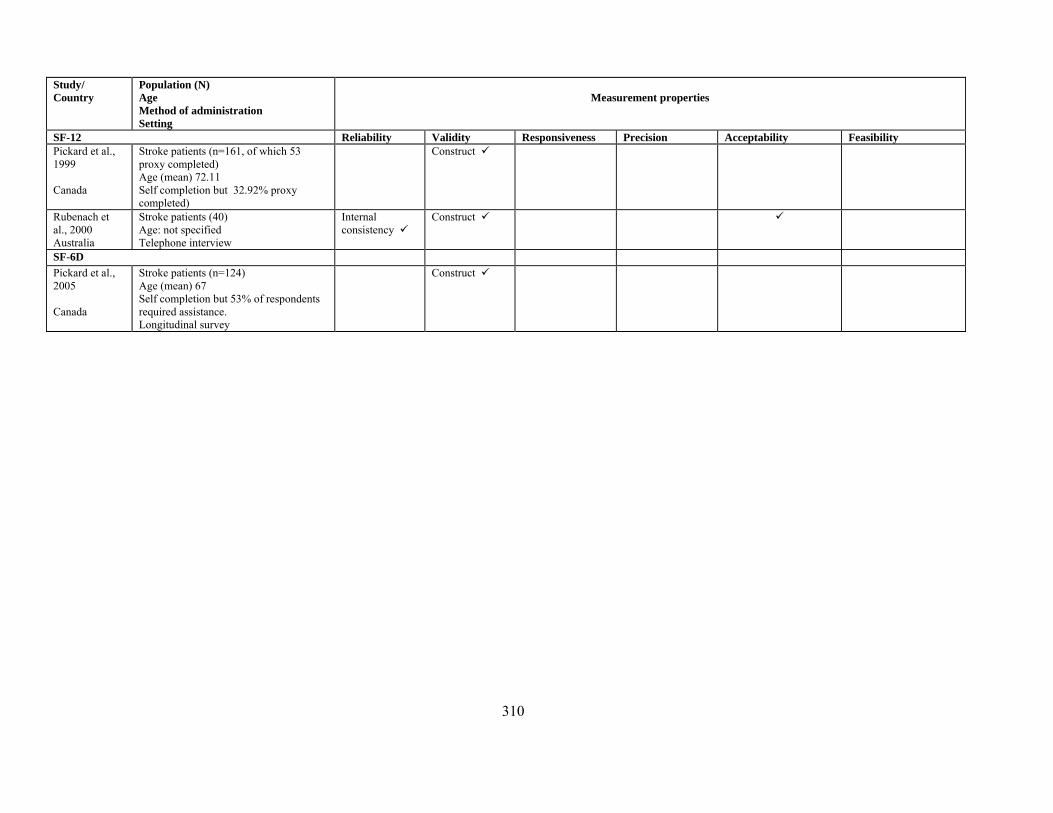
Study/ Country
Population (N) Age Method of administration Setting
Measurement properties
SF-12 Reliability Validity Responsiveness Precision Acceptability Feasibility Pickard et al., 1999 Canada
Stroke patients (n=161, of which 53 proxy completed) Age (mean) 72.11 Self completion but 32.92% proxy completed)
Construct
Rubenach et al., 2000 Australia
Stroke patients (40) Age: not specified Telephone interview
Internal consistency
Construct
SF-6D Pickard et al., 2005 Canada
Stroke patients (n=124) Age (mean) 67 Self completion but 53% of respondents required assistance. Longitudinal survey
Construct
311
d) EuroQol- EQ-5D The EuroQol was evaluated in six papers, two of which were based on data gained from the UK (Dorman et al., 1997, 1999). Results from the UK papers were based upon the same dataset. Reliability Test-retest reliability was found to be good for the EuroQol in a study of UK patients randomly selected from the International Stroke Trial (Dorman et al., 1997, 1999). The authors claim the EuroQol overall score has greater reproducibility than individual items whether weighted by utility weights or not. Unweighted Kappa values for the utility weighted EuroQol were 0.83 for questionnaires completed by the patient alone and 0.81 for those completed by proxy. Validity The construct validity of the EuroQol was assessed by Dorman et al., (1999) who compared results on the measure with those gained from the SF-36. Measures assessing Physical Functioning, Social Functioning, Bodily Pain and Overall Health were highly correlated, but this was not the case for Mental Health which was poorly correlated on the two measures. They suggest this may be due to the instruments tapping different aspects of mental health or possible measurement error on the SF-36. However, no firm conclusion is drawn from this finding. McPherson et al., (2004) compared population based valuation estimates for the EuroQol with those elicited from patients. Valuations provided by stroke patients were significantly different from population-based ratings and correlations between EuroQol Index calculations based on the two weighting schemes were poor. Population based ratings of health are systematically lower than ratings gained from patients with stroke. Additionally, the magnitude of this difference depends on health status in a curvilinear way, increasing as health state severity increases but decreasing in the most severe states. The authors conclude that the valuations used in any given survey could have considerable effects on the results, and this has important implications for interpreting shifts in health status valuations following interventions. Polsky et al., (2001) examined the health status of patients enrolled in a clinical trial for a new drug for treating aneurysmal subarachnoid haemorrhage. These assessments were made using the EuroQol classification and weighting system, and also the visual analogue ‘thermometer’. They developed a model for predicting responses to the thermometer and derived scoring weights for the EuroQol health state classification that met convergent validity criterion of having higher predicted scores for better outcomes and lower scores for worse outcomes. They suggest the scoring rule they developed could be used to impute health valuations in clinical trials when self-rating for health states is not possible. Additionally, they found differences on scores gained from stroke patients than from the general public, with the general public rating higher (i.e. better) levels of function more favourably than stroke patients, yet worse levels of function less favourably than stroke patients.
312
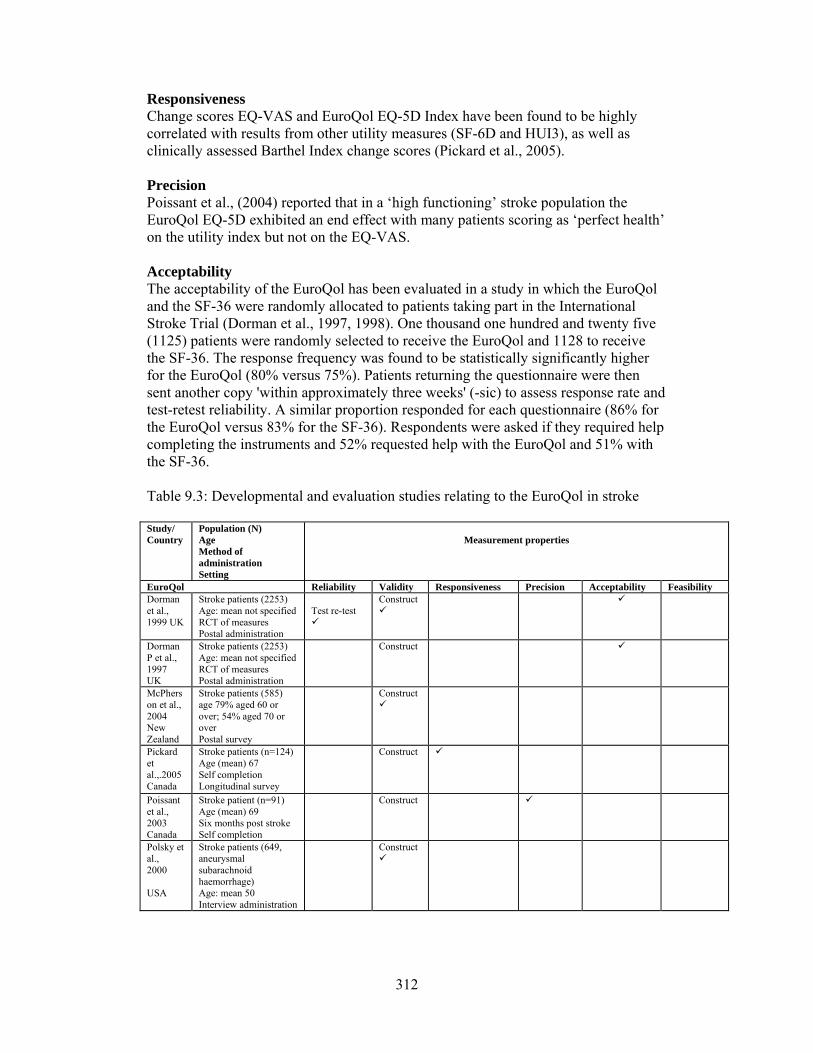
Responsiveness Change scores EQ-VAS and EuroQol EQ-5D Index have been found to be highly correlated with results from other utility measures (SF-6D and HUI3), as well as clinically assessed Barthel Index change scores (Pickard et al., 2005). Precision Poissant et al., (2004) reported that in a ‘high functioning’ stroke population the EuroQol EQ-5D exhibited an end effect with many patients scoring as ‘perfect health’ on the utility index but not on the EQ-VAS. Acceptability The acceptability of the EuroQol has been evaluated in a study in which the EuroQol and the SF-36 were randomly allocated to patients taking part in the International Stroke Trial (Dorman et al., 1997, 1998). One thousand one hundred and twenty five (1125) patients were randomly selected to receive the EuroQol and 1128 to receive the SF-36. The response frequency was found to be statistically significantly higher for the EuroQol (80% versus 75%). Patients returning the questionnaire were then sent another copy 'within approximately three weeks' (-sic) to assess response rate and test-retest reliability. A similar proportion responded for each questionnaire (86% for the EuroQol versus 83% for the SF-36). Respondents were asked if they required help completing the instruments and 52% requested help with the EuroQol and 51% with the SF-36. Table 9.3: Developmental and evaluation studies relating to the EuroQol in stroke Study/ Country
Population (N) Age Method of administration Setting
Measurement properties
EuroQol Reliability Validity Responsiveness Precision Acceptability Feasibility Dorman et al., 1999 UK
Stroke patients (2253) Age: mean not specified RCT of measures Postal administration
Test re-test
Construct
Dorman P et al., 1997 UK
Stroke patients (2253) Age: mean not specified RCT of measures Postal administration
Construct
McPherson et al., 2004 New Zealand
Stroke patients (585) age 79% aged 60 or over; 54% aged 70 or over Postal survey
Construct
Pickard et al.,.2005 Canada
Stroke patients (n=124) Age (mean) 67 Self completion Longitudinal survey
Construct
Poissant et al., 2003 Canada
Stroke patient (n=91) Age (mean) 69 Six months post stroke Self completion
Construct
Polsky et al., 2000 USA
Stroke patients (649, aneurysmal subarachnoid haemorrhage) Age: mean 50 Interview administration
Construct
313
e) Health Utilities Index (HUI) The Health Utility Index is a preference/utility instrument designed for use in economic analyses. The measure has been updated and is currently in its third version (HUI-3). Three papers were found that report on the evaluation of the HUI-3 in the USA and Canada. Reliability Goldstein et al., (2002) found reasonable test-retest results for most dimensions of the HUI-3. However, the Speech dimension on the HUI-3 showed very poor test-retest reliability (ICC=0.28). Goldstein et al., (2002) found no significant differences between mean scores for patient and carer pairs when completing the HUI-3. However, this may be due to the small sample size (n=73 pairs at two time periods) and high degrees of missing data (see below) as correlation coefficients were variable, ranging from a low 0.24 to a high 0.88. The fact that the data was pooled (i.e. patient and carers completed the measures at two time periods) may also artificially raise the level of correlation. Validity The construct validity of the HUI-3 was assessed by Grootendorst et al., (2000) in respondents reporting having had a stroke or arthritis in the Ontario Health Survey. Subjects with stroke (n=173) or arthritis (n=7,751) had substantially lower health related quality of life than those not reporting such conditions (referred to as the 'reference group'). Respondents with stroke reported worse health on the Global utility Index than either arthritis patients or the reference group (n=53,838). Furthermore, stroke patients had lower (i.e. worse) scores on all eight dimension scores on the eight single attribute scores. HUI-3 scores were compared to known groups defined by the Barthel Index. Scores on the HUI measures were found to distinguish between mild and moderate/severe cases as defined by the Barthel Index, but did not distinguish between moderate and severe groups. Responsiveness Change scores for HUI-3 have been found to be highly correlated with results from other utility measures (EQ-5D and SF-6D), as well as clinically assessed Barthel Index change scores (Pickard et al., 2005). Pickard et al., (2005) also report that the HUI-3 was found to be more responsive than the HUI-2 and the VAS on the EuroQol. Precision No data available. Acceptability Goldstein et al., (2002) report that the percentage of missing data on the HUI-3 was ‘surprisingly high’ with at least one item of assessment missing in over 70% of cases. They argue that the high proportion of missing data would limit the usefulness of the HUI-3 in the context of stroke trials.
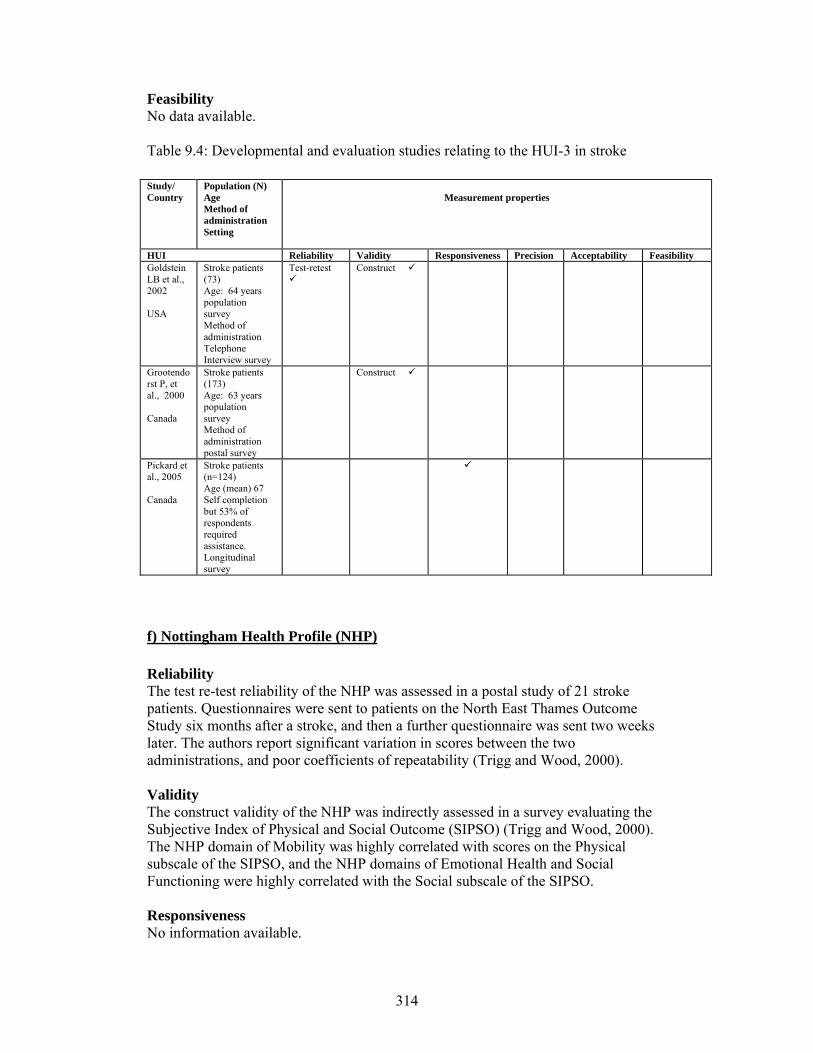
314
Feasibility No data available. Table 9.4: Developmental and evaluation studies relating to the HUI-3 in stroke Study/ Country
Population (N) Age Method of administration Setting
Measurement properties
HUI Reliability Validity Responsiveness Precision Acceptability Feasibility Goldstein LB et al., 2002 USA
Stroke patients (73) Age: 64 years population survey Method of administration Telephone Interview survey
Test-retest
Construct
Grootendorst P, et al., 2000 Canada
Stroke patients (173) Age: 63 years population survey Method of administration postal survey
Construct
Pickard et al., 2005 Canada
Stroke patients (n=124) Age (mean) 67 Self completion but 53% of respondents required assistance. Longitudinal survey
f) Nottingham Health Profile (NHP) Reliability The test re-test reliability of the NHP was assessed in a postal study of 21 stroke patients. Questionnaires were sent to patients on the North East Thames Outcome Study six months after a stroke, and then a further questionnaire was sent two weeks later. The authors report significant variation in scores between the two administrations, and poor coefficients of repeatability (Trigg and Wood, 2000). Validity The construct validity of the NHP was indirectly assessed in a survey evaluating the Subjective Index of Physical and Social Outcome (SIPSO) (Trigg and Wood, 2000). The NHP domain of Mobility was highly correlated with scores on the Physical subscale of the SIPSO, and the NHP domains of Emotional Health and Social Functioning were highly correlated with the Social subscale of the SIPSO. Responsiveness No information available.
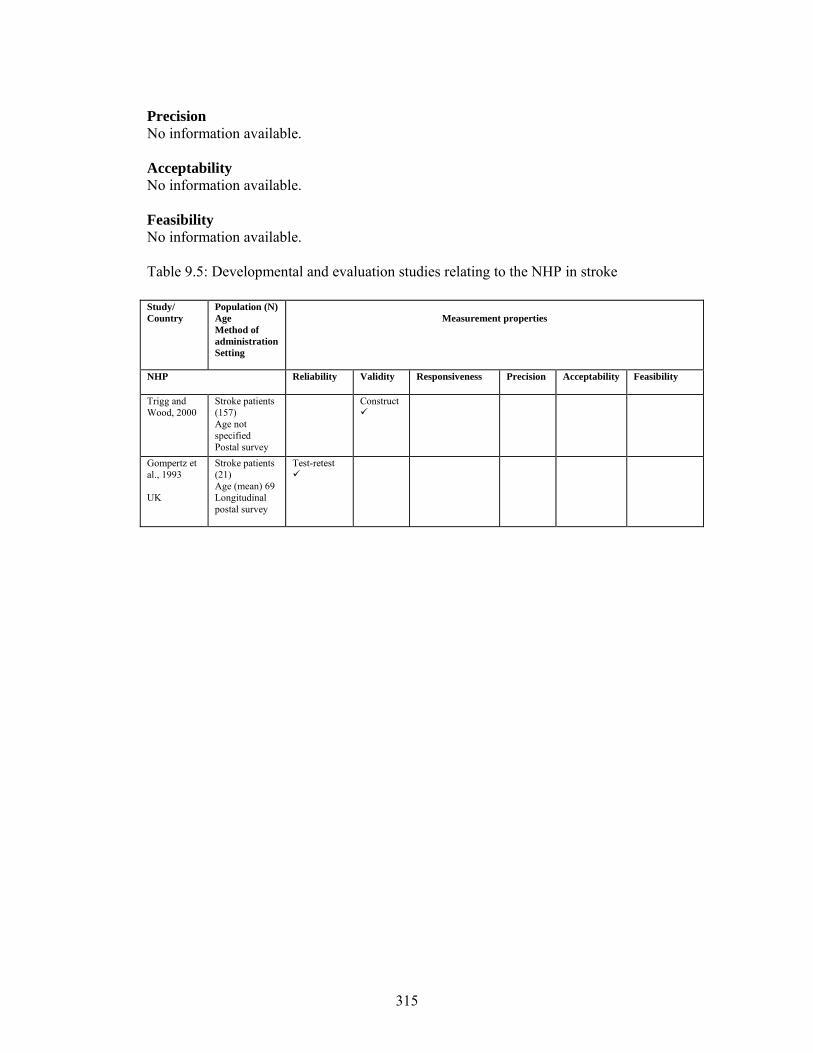
315
Precision No information available. Acceptability No information available. Feasibility No information available. Table 9.5: Developmental and evaluation studies relating to the NHP in stroke Study/ Country
Population (N) Age Method of administration Setting
Measurement properties
NHP Reliability Validity Responsiveness Precision Acceptability Feasibility
Trigg and Wood, 2000
Stroke patients (157) Age not specified Postal survey
Construct
Gompertz et al., 1993 UK
Stroke patients (21) Age (mean) 69 Longitudinal postal survey
Test-retest
316
RESULTS: STROKE-SPECIFIC PATIENT REPORTED HEALTH INSTRUMENTS: Seven Stroke -specific instruments were identified which were evaluated with patients with COPD. Full details of the development, domains and scoring methods are detailed in Tables 9.6 and 9.7.
The following instruments measurement properties are reported:
a) Stroke Impact Scale b) Stroke Specific Quality of Life Scale c) Subjective Index of Physical and Social Outcomes d) The Barthel Index e) Frenchay Activities Index f) Nottingham Extended Activities of Daily Living (ADL) Scale g) London Handicap Scale
a) Stroke Impact Scale Versions 2 and 3 The developers of the Stroke Impact Scale noted that many instruments, such as the SIP and SF-36, exhibited ceiling and floor effects in stroke populations. Consequently, these measures had limited ability to evaluate stroke outcomes over time. Consequently, they decided to develop a stroke specific measure that may overcome such problems (Lai et al., 2003). The instrument content was derived from input from stroke patients, caregivers and health professionals with experience in the field of stroke. It contains 59 items across eight domains (Strength, Hand Function, ADL/IADL, Mobility, Emotion, Memory, Communication and Social Participation). A related measure to the SIS is the SIS-16 which was designed to assess physical functioning and be more sensitive to differences than existing measures of physical function. The SIS-16 contains 16 items from the SIS measuring ADL/IADL, mobility and hand function (Edwards and O’Connell, 2003). The SIS Version 3 contains minor modifications but consists of the same items and domains as the SIS Version 2. Note: Version 1 of the SIS is reported only in unpublished literature. b) Stroke Specific Quality of Life Scale (SS-QOL) At the time of the development of the SS-QOL the authors argued that there was no stroke specific health related quality of life measures available. Consequently, Williams et al., (1999a) set about devising a stroke specific QOL measure developed from interviews with patients. Thirty four survivors of ischemic stroke were interviewed to identify common themes that affect stroke patients’ quality of life. Subjects included in the interviews were identified from stroke clinics one to six months after stroke and with no significant cognitive or language impairment. Patients were asked to identify three areas most affected by their stroke. Twelve commonly affected domains were identified: energy, family roles, language, mobility, mood, personality, self-care, social roles, thinking, upper extremity function, vision, and work/productivity. The final instrument contains 49 items measuring these concepts.
317
c) Subjective Index of Physical and Social Outcomes (SIPSO) The SIPSO is an outcome tool that was designed to measure people's social integration rather than their abilities per se. It contains 10 items giving an overall score as well as Physical and Social Component scores. The definition of social integration used in the work initially incorporated environment, activities as well as social integration. However, during test development the items relating to environment were omitted as they failed to fulfil the criteria necessary for inclusion. The authors claim that the main aim of rehabilitation should be to reintegrate the patient into as normal a lifestyle as possible. Interviews with patients and carers were undertaken covering three aspects of their life: (1) pre-stroke, (2) life since stroke and (3) perceptions of change since stroke. Content analysis was undertaken on this data (Trigg et al., 1999). On the basis of the interviews a questionnaire was developed and tested (Trigg and Wood, 2000). The authors claim that the SIPSO measures the ability of an individual to reintegrate to his or her own satisfaction. An overall score can be calculated together with Physical and Social subscale scores.
d) The Barthel Index The Barthel Index was originally developed for use in clinical practice as a means of assessing the degree of independence in patients with neurological and neuromuscular limitations. Strictly speaking, the instrument is neither stroke specific nor developed for completion by patients. However, it is widely used in the field of rehabilitation and patient completed versions of the instrument have been developed. The original Barthel Index consists of ten items, each of which is rated in terms of the patient’s ability to undertake the task. Patients are classified into one of dependent, performs task with help and independent. In the original index there were ten areas covered (Bowel control, Bladder control, Grooming, Toilet use, Feeding, Transfer (from bed to chair), Mobility, Dressing, Stairs, Bathing). There have been a number of modifications to this original formulation, including a version with fifteen areas covered called the Modified Barthel Index (Granger et al., 1979), and one developed by Wade and Collin (1988) which uses simplified scoring algorithms. e) Frenchay Activities Index The Frenchay Activities Index (FAI) was developed as a means of measuring social activities and lifestyle following stroke, to supplement the more basic functional activities of daily living assessed by measures such as the Barthel Index. The FAI was designed from the outset to be an instrument that would be administered by the clinician to the patient in the clinical interview (Holbrook and Skilbeck, 1983; Wade et al., 1985). f) Nottingham Extended Activities of Daily Living (ADL) Scale The Nottingham Extended ADL Scale was developed and evaluated as a questionnaire for postal use (Nouri and Lincoln, 1987). It assesses the ability to carry out functional tasks, such as using public transport, housework, social life and hobbies. Scores in four areas: mobility, kitchen tasks, domestic activities and leisure activities can be added to give a summary score out of 22. Respondents are asked
318
whether they do the activity rather than if they can do it, in order to assess level of activity rather than capability. g) London Handicap Scale The London Handicap Scale (LHS) was developed in response to the need for measures of morbidity to complement mortality statistics in the evaluation of health care interventions and services (Harwood, et al., 1994). Handicap is the disadvantage experienced by an individual patient because of ill-health. The developers adopt a definition of handicap developed by the World Health Organisation and claim that it can be classified according to disadvantages in each of six dimensions: mobility, physical independence, occupation, social integration, and economic self sufficiency. The LHS contains one item for each of these dimensions. A single index score is gained by summing and weighting responses to these items. The measure was designed for use in rehabilitation, hence its inclusion in this review as a stroke specific measure. However, although it has been primarily used in stroke patients it could be used in other serious illness where patients undergo rehabilitation.
319
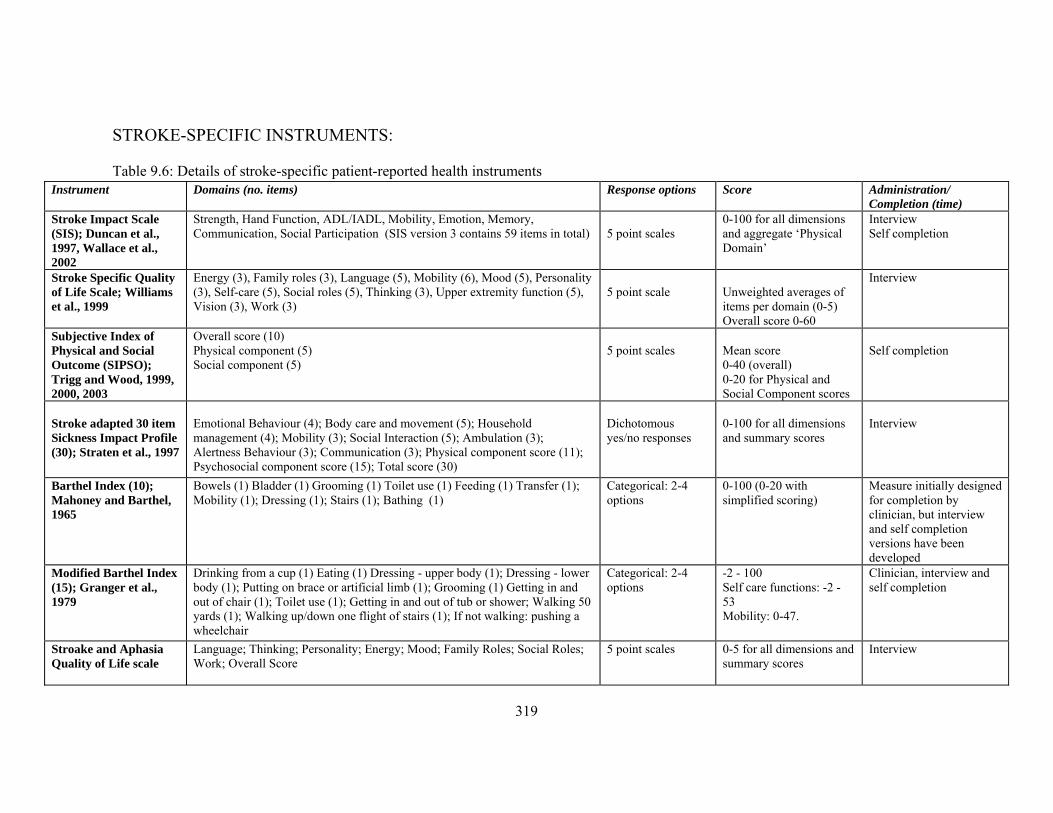
STROKE-SPECIFIC INSTRUMENTS: Table 9.6: Details of stroke-specific patient-reported health instruments
Instrument Domains (no. items) Response options Score Administration/ Completion (time)
Stroke Impact Scale (SIS); Duncan et al., 1997, Wallace et al., 2002
Strength, Hand Function, ADL/IADL, Mobility, Emotion, Memory, Communication, Social Participation (SIS version 3 contains 59 items in total)
5 point scales
0-100 for all dimensions and aggregate ‘Physical Domain’
Interview Self completion
Stroke Specific Quality of Life Scale; Williams et al., 1999
Energy (3), Family roles (3), Language (5), Mobility (6), Mood (5), Personality (3), Self-care (5), Social roles (5), Thinking (3), Upper extremity function (5), Vision (3), Work (3)
5 point scale
Unweighted averages of items per domain (0-5) Overall score 0-60
Interview
Subjective Index of Physical and Social Outcome (SIPSO); Trigg and Wood, 1999, 2000, 2003
Overall score (10) Physical component (5) Social component (5)
5 point scales
Mean score 0-40 (overall) 0-20 for Physical and Social Component scores
Self completion
Stroke adapted 30 item Sickness Impact Profile (30); Straten et al., 1997
Emotional Behaviour (4); Body care and movement (5); Household management (4); Mobility (3); Social Interaction (5); Ambulation (3); Alertness Behaviour (3); Communication (3); Physical component score (11); Psychosocial component score (15); Total score (30)
Dichotomous yes/no responses
0-100 for all dimensions and summary scores
Interview
Barthel Index (10); Mahoney and Barthel, 1965
Bowels (1) Bladder (1) Grooming (1) Toilet use (1) Feeding (1) Transfer (1); Mobility (1); Dressing (1); Stairs (1); Bathing (1)
Categorical: 2-4 options
0-100 (0-20 with simplified scoring)
Measure initially designed for completion by clinician, but interview and self completion versions have been developed
Modified Barthel Index (15); Granger et al., 1979
Drinking from a cup (1) Eating (1) Dressing - upper body (1); Dressing - lower body (1); Putting on brace or artificial limb (1); Grooming (1) Getting in and out of chair (1); Toilet use (1); Getting in and out of tub or shower; Walking 50 yards (1); Walking up/down one flight of stairs (1); If not walking: pushing a wheelchair
Categorical: 2-4 options
-2 - 100 Self care functions: -2 - 53 Mobility: 0-47.
Clinician, interview and self completion
Stroake and Aphasia Quality of Life scale
Language; Thinking; Personality; Energy; Mood; Family Roles; Social Roles; Work; Overall Score
5 point scales 0-5 for all dimensions and summary scores
Interview
320
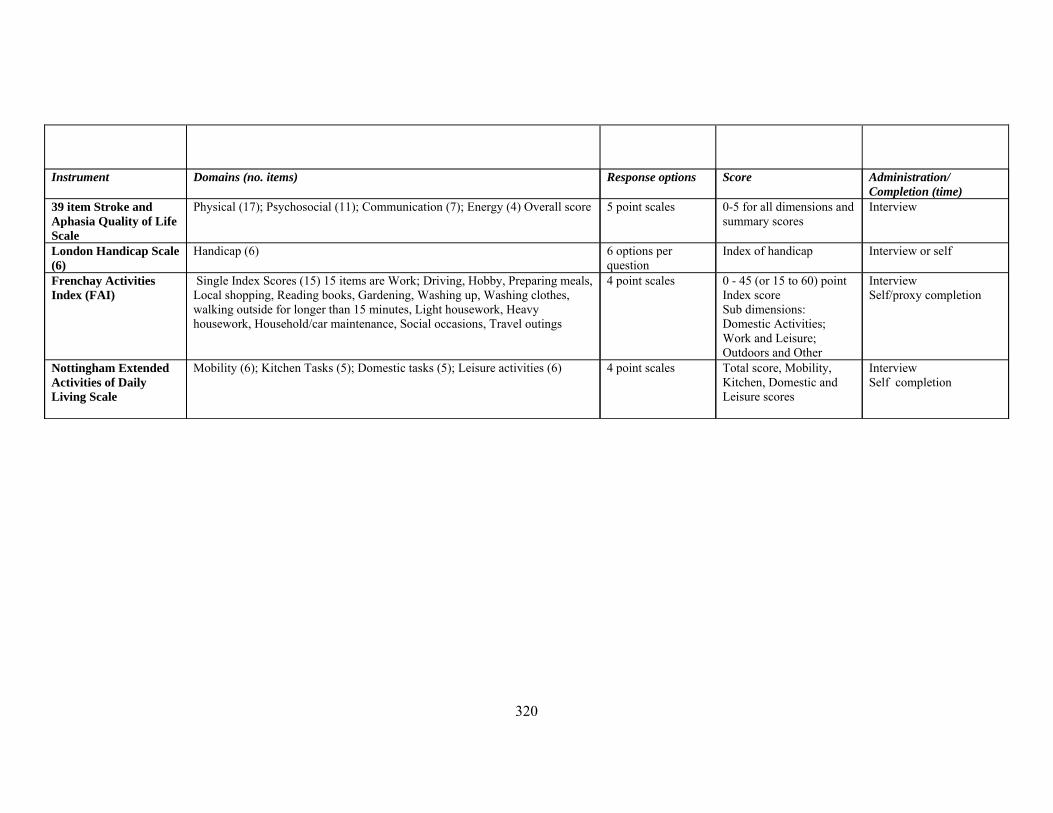
Instrument Domains (no. items) Response options Score Administration/ Completion (time)
39 item Stroke and Aphasia Quality of Life Scale
Physical (17); Psychosocial (11); Communication (7); Energy (4) Overall score 5 point scales 0-5 for all dimensions and summary scores
Interview
London Handicap Scale (6)
Handicap (6) 6 options per question
Index of handicap Interview or self
Frenchay Activities Index (FAI)
Single Index Scores (15) 15 items are Work; Driving, Hobby, Preparing meals, Local shopping, Reading books, Gardening, Washing up, Washing clothes, walking outside for longer than 15 minutes, Light housework, Heavy housework, Household/car maintenance, Social occasions, Travel outings
4 point scales 0 - 45 (or 15 to 60) point Index score Sub dimensions: Domestic Activities; Work and Leisure; Outdoors and Other
Interview Self/proxy completion
Nottingham Extended Activities of Daily Living Scale
Mobility (6); Kitchen Tasks (5); Domestic tasks (5); Leisure activities (6) 4 point scales Total score, Mobility, Kitchen, Domestic and Leisure scores
Interview Self completion
321
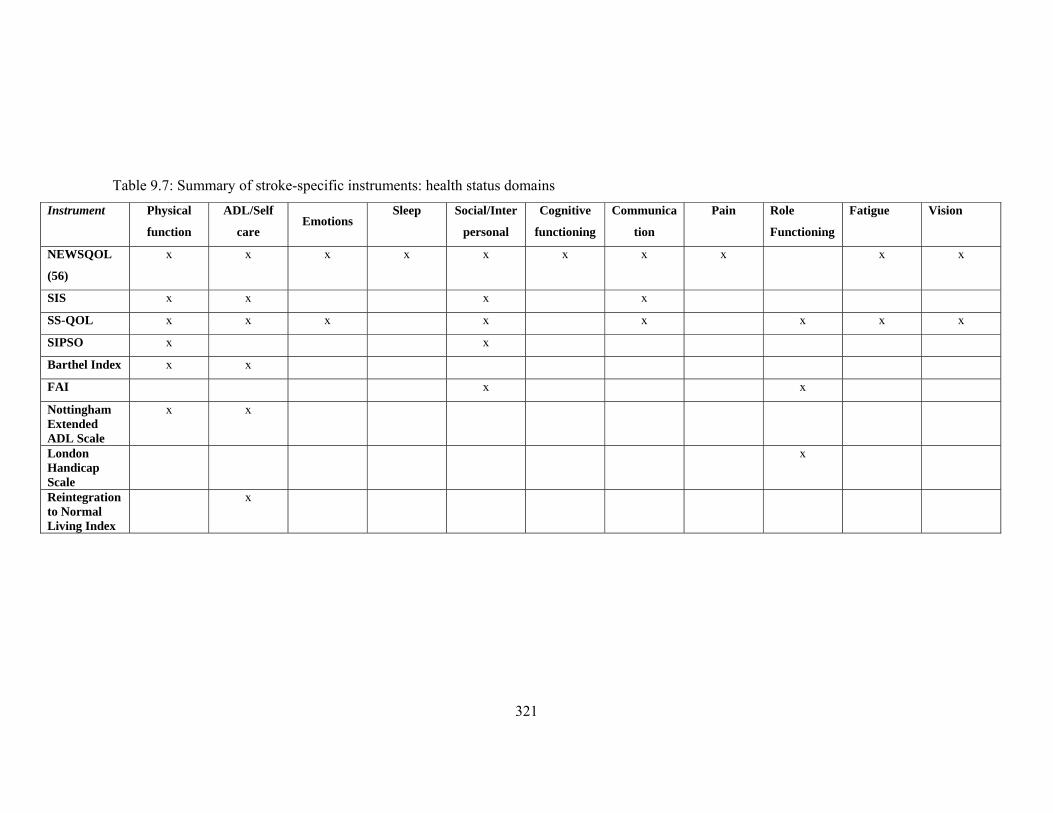
Table 9.7: Summary of stroke-specific instruments: health status domains
Instrument
Physical
function
ADL/Self
care Emotions
Sleep Social/Inter
personal
Cognitive
functioning
Communica
tion
Pain Role
Functioning
Fatigue Vision
NEWSQOL
(56)
x x x x x x x x x x
SIS x x x x
SS-QOL x x x x x x x x
SIPSO x x
Barthel Index x x
FAI x x
Nottingham Extended ADL Scale
x x
London Handicap Scale
x
Reintegration to Normal Living Index
x
322
STROKE-SPECIFIC PATIENT- REPORTED HEALTH INSTRUMENTS: a) Stroke Impact Scale (SIS) The SIS is a relatively recent addition to the battery of measures available to measure stroke outcomes. However, despite this it has been subject to a substantial amount of work evaluating its measurement properties. Seven papers documenting its development and use in the North American context, and one Australian study, were found for this review. To date, no work on the measure has been published in the UK. Reliability Internal consistency reliability of the SIS was assessed in a small scale interview survey of patients with mild and severe stroke (Duncan et al., 1999) and found to be high for all eight domains in both groups. This result was broadly substantiated in a larger interview study, except for the Strength subscale where an alpha of 0.63 was gained (n=216). Internal consistency reliability was also assessed for the SIS when administered by telephone and self completion and found to be high for all eight primary dimensions (alpha >0.75) (Duncan et al., 2005). Similarly, in a postal survey the SIS dimensions and the SIS-16 (a subset of items measuring functional ability) were found to have high internal consistency (Edwards and O’Connell, 2003). Test-retest was undertaken on 25 stroke patients and found to be good (ICC’s range 0.7 to 0.92) except for the Emotion dimension (ICC=0.57) (Duncan et al., 1999). Duncan et al., (2003) evaluated the unidimensionality of dimensions on the SIS. They argued that domains that could not be shown to have unidimensionality would be difficult to interpret. Consequently, they decided to apply the Rasch model to each of the separate dimensions of the SIS. A total of 696 subjects completed the SIS at baseline and/or at follow-up (640 at baseline and 624 three months later). All 1264 SIS questionnaires were entered into the Rasch analysis. Rasch analysis assesses the extent to which items fit a unidimensional model: poor 'fit' statistics suggest items are not tapping a single underlying construct, and is therefore a good test of internal consistency reliability. Rasch analysis can be used to determine whether items fit a unidimensional model, and hence can indicate internal consistency reliability. Very few items were indicated not to 'fit' their proposed domains, one each from the memory, mobility and participation domains. Three items from composite physical domain (created by aggregating the domains of strength, Hand function, ADLs/IADLs and Mobility) had poor in fit statistics. Edwards and O’Connell (2003) reported that item discriminant validity statistics (i.e. the number of correlations of items in own domains that were significantly higher than correlations with other domains) were adequate for most dimensions of the SIS and were excellent for Strength and Hand Function domains.
323
Validity Convergent and discriminant validity of the SIS-16 was supported by correlations with the SIS and a general quality of life measure: the WHOQOL-Bref (WHOQOL Group, 1998). Discriminant validity was assessed in an interview survey by comparison of SIS mean scores across groups defined by Rankin scores. Six of the eight domains showed significantly different results across scales (Duncan et al., 1999). The authors claim that ‘criterion’ validity was also assessed against existing measures and showed moderate to good associations with related dimensions on the SF-36, FIM and Barthel Index (Duncan et al., 1999). In a telephone survey the SIS was found to have superior discrimination between Rankin Scores than either the SF-36V (a modified version of the SF-36) or Functional Independence Measure (Kwon et al., 2004). In a postal survey of stroke patients the SIS Physical Domain scores and the Aggregate Physical Domain scores had fair to moderate correlations with data FIM Motor scores and the Physical Functioning dimension of the SF-36 gained via telephone interview (Duncan et al., 2002). The developers also used Rasch analysis to assess the validity of the SIS (Duncan et al., 2003). One of the assumptions behind Rasch analysis is that items in a scale should form a hierarchy of difficulty. When measures are developed using a conceptual hierarchy then the ordering gained by Rasch analysis can be compared to that assumed when the items were initially chosen. Finally Rasch analysis produces an index that indicates the number of distinct strata of persons discerned within each domain: the larger the more distinct levels of functioning can be distinguished in the measure. A total of 696 subjects completed the SIS at baseline and/or at follow up (640 at baseline and 624 three months later). All 1264 SIS questionnaires were entered into the Rasch analysis. In each domain empirical ordering of items by difficulty was consistent with expectations regarding the theoretical ordering of task difficulty. This supports the construct validity of the SIS. Separation indices were calculated for each domain and results were generally good, although floor or ceiling effects were found on memory, emotion, communication and hand function domains. Responsiveness Data on change over time is reported in Duncan et al., (1999), and the authors claim that the instrument is responsive to ‘ongoing recovery’. The authors suggest that differences of approximately 10-15 points would suggest meaningful change both clinically and subjectively. Precision Lai et al., (2003) compared results gained from the SIS Participation Domain and the SIS-16 (measuring physical function) with the SF-36 Social Functioning and Physical Functioning Domains. Rasch analyses indicated that both the SIS-16 and SF-36 Physical Functioning domain both showed a good spread of item difficulty, but the SIS-16 incorporates easier items that are capable of measuring lower levels of physical functioning in patients with severe stroke. Similar analyses of the SIS Participation domain and the SF-36 Physical Functioning domain indicated that the
324
SIS measures has a wide spread of item difficulty, whereas the SF-36 domain does not. The Social Functioning domain of the SF-36 contains only two items, measuring the same level of item difficulty, leading to severe ceiling effects and consequently an inability to discriminate among more active patients. Floor or ceiling effects have, however, been found on the measure (Duncan et al., 1999, 2003). In one study floor effects were found for minor stroke patients on all dimensions except Hand Function, whilst only on Emotion was there a floor effect for severe stroke patients (Duncan et al., 1999). However, such results could be argued as supporting the construct validity of the instrument. In another study (Duncan et al., 2003) floor effects were found on the domains of Memory, Emotion and Communication. Floor effects suggest that stroke has had no effects in these areas, which is, of course, a possible explanation for the findings. However, ceiling effects were found on the Hand function dimension, and this suggests some potential measurement limitations on this domain for stroke patients, and the possibility that further 'more severe' items could meaningfully be added.
Acceptability Duncan et al., (2005) evaluated results from self completion and telephone interviewer administered versions of the SIS in a randomised controlled trial of the two methods of administration. Response rates for mail and telephone were 45% and 69% respectively. Missing data points were present in the mail version but not in the telephone version. In a mail survey Duncan et al., (2002) reported that non-responders to the SIS had more severe strokes and lower functional status than responders.
Feasibility The cost of administering the questionnaire by telephone was found to be over twice that of self completion (Duncan et al., 2005). However, Kwon et al., (2004) suggest that such a method may be a practical method of measuring outcomes in community dwelling stroke survivors.

325
Table 9.8: Developmental and evaluation studies relating to the Stroke Impact Scale (SIS): Study/ Country
Population (N) Age Method of administration Setting
Measurement properties
Stroke Impact Scale Reliability Validity Responsiveness Precision Acceptability Feasibility Duncan et al., 1999
USA
33 individuals with minor stroke; 58 with major stroke Mean age 69.2 (minor stroke) and 71.9 years (major stroke) Interview administered
Internal consistency
Test re-test
Construct
Duncan et al., 2002 USA
125 individuals with stroke Mean age 68.1 years Postal interview
Construct
Duncan et al., 2003 USA
696 individuals with stroke Age: Mean 68.6 Face to face interview
Internal consistency
Construct
Duncan et al., 2005
USA
190 individuals with stroke Age: Mean 68.6 RCT of either telephone interview or self completion versions
Internal consistency
Test re-test
Construct
Edwards and O’Connell 2003 Australia
74 individuals with stroke Age: Mean 58.4 Postal questionnaire survey
Construct
Kwon et al., 2006 USA
136 individuals with stroke Age: Mean 68.0 Telephone survey
Construct
Lai et al., 2003 USA
278 individuals with stroke Age (mean) 72.5 Interview survey
Construct
Nichols-Larsen et al., 2005 USA
213 individuals with stroke Age (mean) 62.1 Interview survey
Internal consistency
Construct
326
b) Stroke Specific Quality of Life Scale
Three studies were identified which evaluated the SS-QOL, two based on data gained in North America and one based on UK data.
Reliability The developers report high internal reliability in all dimensions of the SS-QOL (alpha >= 0.73) (Williams et al., 1999a). Validity Scores one month after stroke on the domains of Energy, Family Roles, Mobility, Mood, Personality, Self-care and Work domains were significantly linearly associated with the corresponding scores of the BI, BDI and subscales of the SF-36. However, scores on the Language and Thinking domains were not associated with clinician administered NIH Stroke Scale. The authors suggest this may be because the subjects in their study were largely unaffected by Language and Cognitive problems, though why this finding should not be replicated on the NIHSS is not fully explained. In a regression analysis overall self-reported health related quality of life was associated with SS-QOL domain scores, Barthel Index, NIH Stroke Scale and Beck Depression Index scores, but not with SF-36 scores (Williams et al., 1999b). Responsiveness No data available. Precision The developers found no evidence for ceiling and floor effects (Williams et al., (1999a). Acceptability Hilari and Byng (2001) evaluated the SS-QOL for stroke patients with aphasia as part of study of 80 people with long-term aphasia. They held two focus groups and, as a consequence, amended the form to be more easily completed by patients with aphasia. They amended the instrument so that it was interviewer administered, and simplified the wording of many of the items, and changed the response categories after pilot testing the instrument on 12 patients with aphasia. However, results from amending the SS-QOL to a more 'communicatively accessible' version are based on very small samples and are very preliminary. Feasibility No data available.
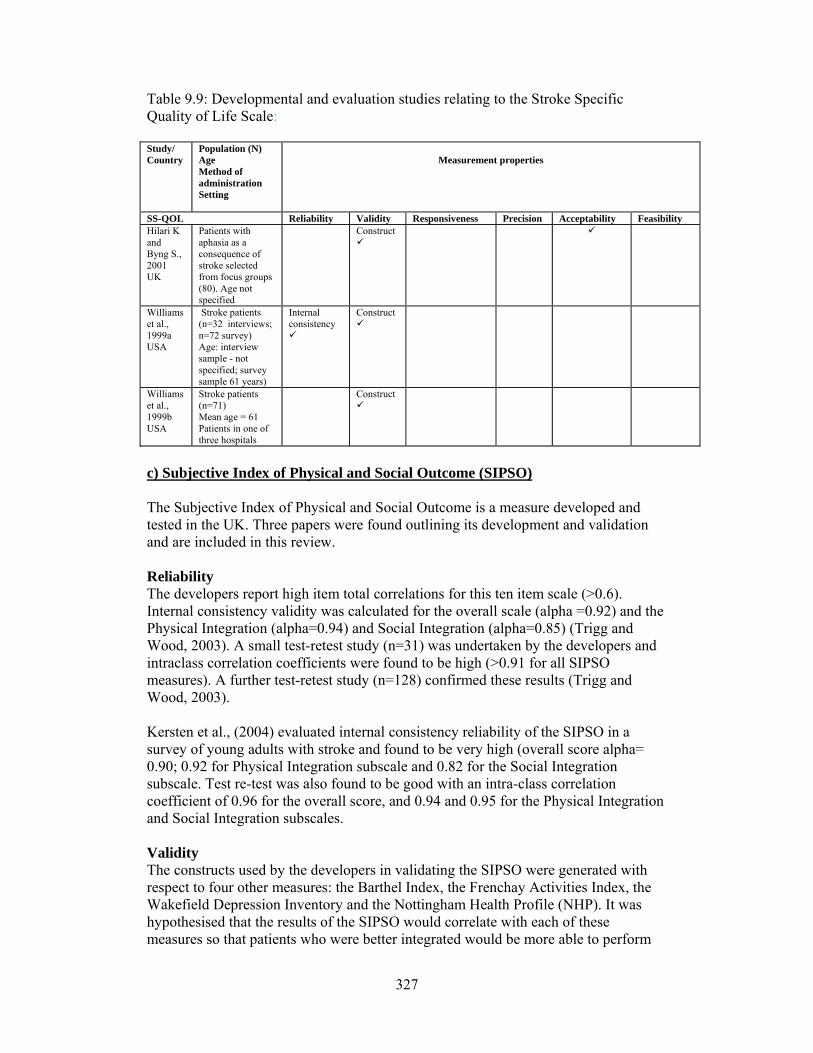
327
Table 9.9: Developmental and evaluation studies relating to the Stroke Specific Quality of Life Scale: Study/ Country
Population (N) Age Method of administration Setting
Measurement properties
SS-QOL Reliability Validity Responsiveness Precision Acceptability Feasibility Hilari K and Byng S., 2001 UK
Patients with aphasia as a consequence of stroke selected from focus groups (80). Age not specified
Construct
Williams et al., 1999a USA
Stroke patients (n=32 interviews; n=72 survey) Age: interview sample - not specified; survey sample 61 years)
Internal consistency
Construct
Williams et al., 1999b USA
Stroke patients (n=71) Mean age = 61 Patients in one of three hospitals
Construct
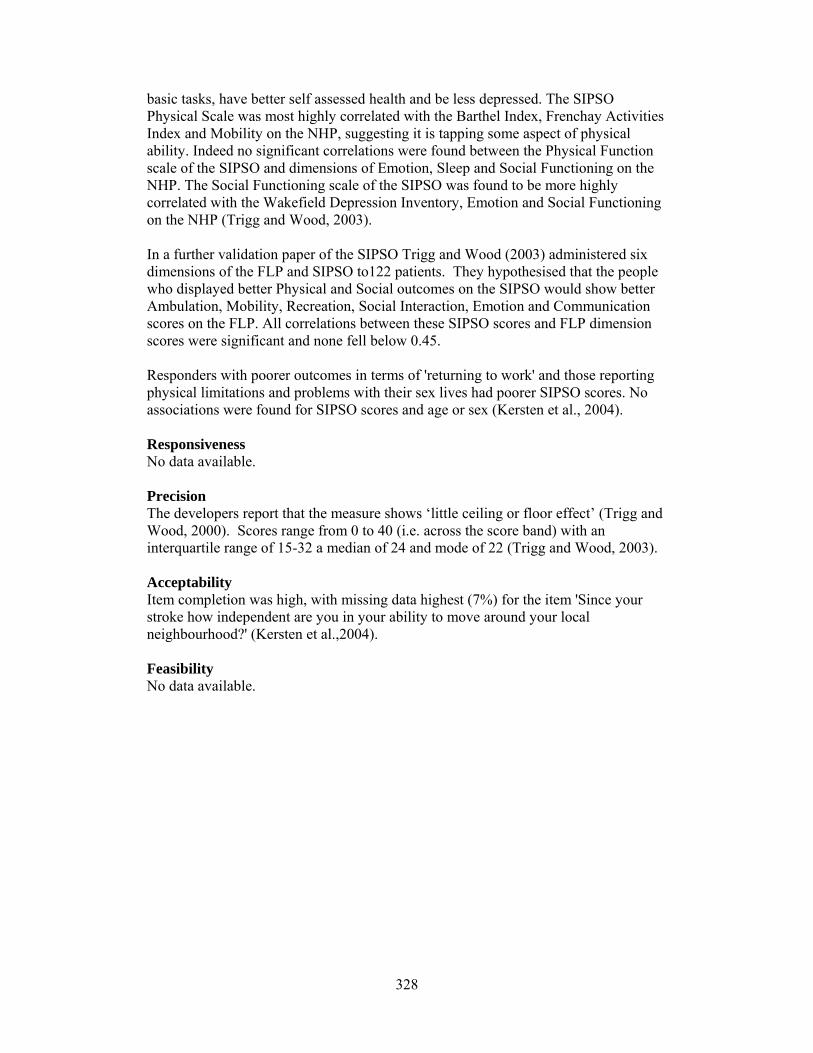
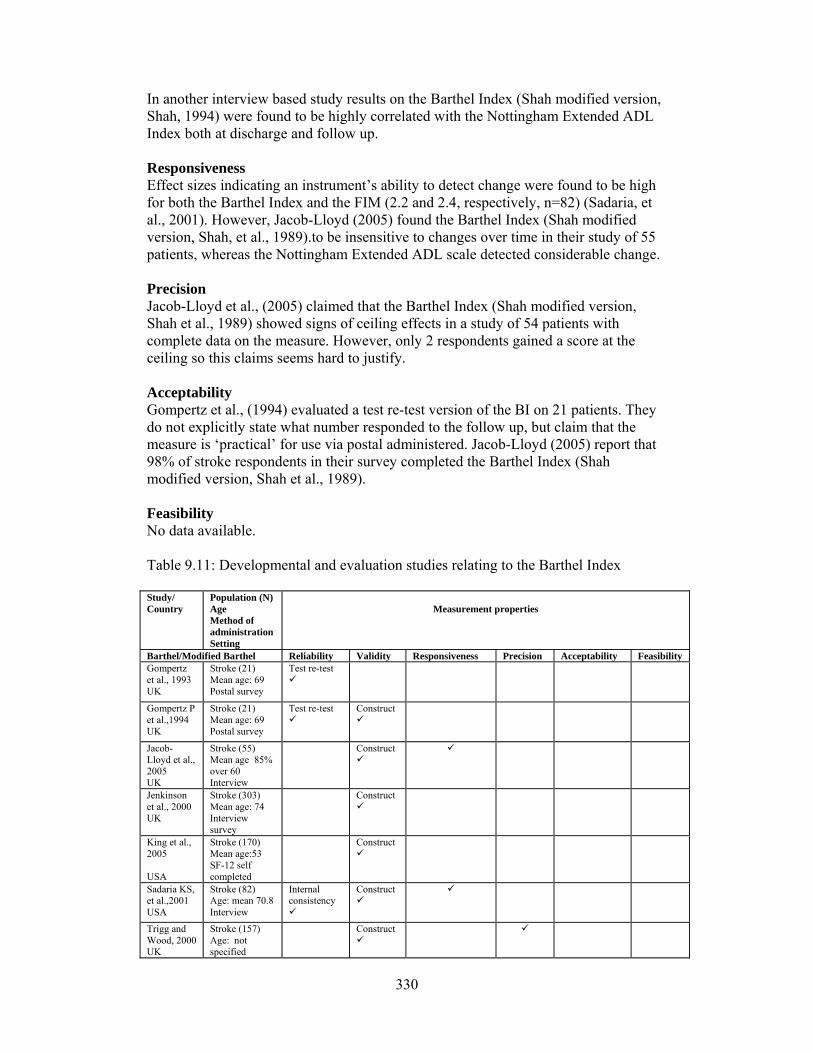
c) Subjective Index of Physical and Social Outcome (SIPSO) The Subjective Index of Physical and Social Outcome is a measure developed and tested in the UK. Three papers were found outlining its development and validation and are included in this review. Reliability The developers report high item total correlations for this ten item scale (>0.6). Internal consistency validity was calculated for the overall scale (alpha =0.92) and the Physical Integration (alpha=0.94) and Social Integration (alpha=0.85) (Trigg and Wood, 2003). A small test-retest study (n=31) was undertaken by the developers and intraclass correlation coefficients were found to be high (>0.91 for all SIPSO measures). A further test-retest study (n=128) confirmed these results (Trigg and Wood, 2003). Kersten et al., (2004) evaluated internal consistency reliability of the SIPSO in a survey of young adults with stroke and found to be very high (overall score alpha= 0.90; 0.92 for Physical Integration subscale and 0.82 for the Social Integration subscale. Test re-test was also found to be good with an intra-class correlation coefficient of 0.96 for the overall score, and 0.94 and 0.95 for the Physical Integration and Social Integration subscales. Validity The constructs used by the developers in validating the SIPSO were generated with respect to four other measures: the Barthel Index, the Frenchay Activities Index, the Wakefield Depression Inventory and the Nottingham Health Profile (NHP). It was hypothesised that the results of the SIPSO would correlate with each of these measures so that patients who were better integrated would be more able to perform
328
basic tasks, have better self assessed health and be less depressed. The SIPSO Physical Scale was most highly correlated with the Barthel Index, Frenchay Activities Index and Mobility on the NHP, suggesting it is tapping some aspect of physical ability. Indeed no significant correlations were found between the Physical Function scale of the SIPSO and dimensions of Emotion, Sleep and Social Functioning on the NHP. The Social Functioning scale of the SIPSO was found to be more highly correlated with the Wakefield Depression Inventory, Emotion and Social Functioning on the NHP (Trigg and Wood, 2003). In a further validation paper of the SIPSO Trigg and Wood (2003) administered six dimensions of the FLP and SIPSO to122 patients. They hypothesised that the people who displayed better Physical and Social outcomes on the SIPSO would show better Ambulation, Mobility, Recreation, Social Interaction, Emotion and Communication scores on the FLP. All correlations between these SIPSO scores and FLP dimension scores were significant and none fell below 0.45. Responders with poorer outcomes in terms of 'returning to work' and those reporting physical limitations and problems with their sex lives had poorer SIPSO scores. No associations were found for SIPSO scores and age or sex (Kersten et al., 2004). Responsiveness No data available. Precision The developers report that the measure shows ‘little ceiling or floor effect’ (Trigg and Wood, 2000). Scores range from 0 to 40 (i.e. across the score band) with an interquartile range of 15-32 a median of 24 and mode of 22 (Trigg and Wood, 2003). Acceptability Item completion was high, with missing data highest (7%) for the item 'Since your stroke how independent are you in your ability to move around your local neighbourhood?' (Kersten et al.,2004). Feasibility No data available.
329
Table 9.10: Developmental and evaluation studies relating to the Subjective Index of Physical and Social Outcome (SIPSO): Study/ Country
Population (N) Age Method of administration Setting
Measurement properties
SIPSO Reliability Validity Responsiveness Precision Acceptability Feasibility Kersten et al., 2004 UK
390 individuals with stroke Age: Mean 57.7 Postal survey
Internal consistency
Test re-test
Construct
Trigg and Wood, 2000 UK
157 patients with stroke Age: not specified Postal survey
Internal consistency
Test re-test
Construct
Trigg and Wood, 2003 UK
268 patients with stroke Age <64 n=84, 65-74 n=80, Age > 75 n=97 Postal survey
Internal consistency
Test re-test
Construct
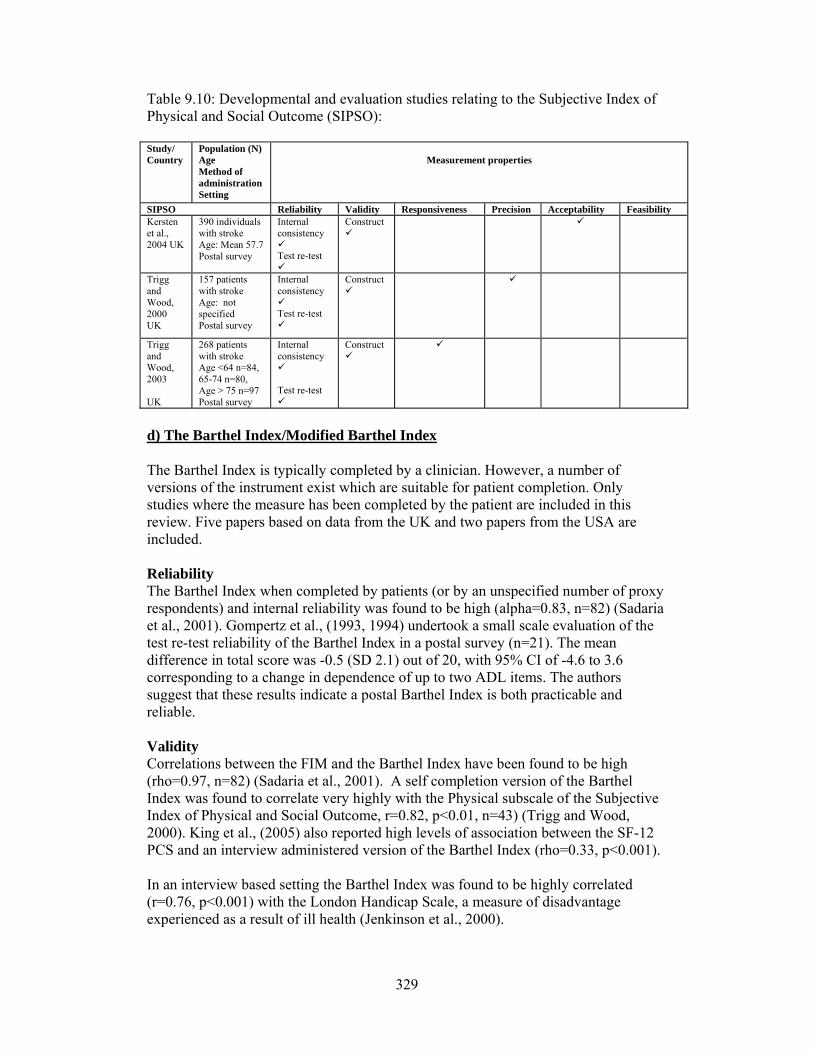
d) The Barthel Index/Modified Barthel Index
The Barthel Index is typically completed by a clinician. However, a number of versions of the instrument exist which are suitable for patient completion. Only studies where the measure has been completed by the patient are included in this review. Five papers based on data from the UK and two papers from the USA are included. Reliability The Barthel Index when completed by patients (or by an unspecified number of proxy respondents) and internal reliability was found to be high (alpha=0.83, n=82) (Sadaria et al., 2001). Gompertz et al., (1993, 1994) undertook a small scale evaluation of the test re-test reliability of the Barthel Index in a postal survey (n=21). The mean difference in total score was -0.5 (SD 2.1) out of 20, with 95% CI of -4.6 to 3.6 corresponding to a change in dependence of up to two ADL items. The authors suggest that these results indicate a postal Barthel Index is both practicable and reliable. Validity Correlations between the FIM and the Barthel Index have been found to be high (rho=0.97, n=82) (Sadaria et al., 2001). A self completion version of the Barthel Index was found to correlate very highly with the Physical subscale of the Subjective Index of Physical and Social Outcome, r=0.82, p<0.01, n=43) (Trigg and Wood, 2000). King et al., (2005) also reported high levels of association between the SF-12 PCS and an interview administered version of the Barthel Index (rho=0.33, p<0.001). In an interview based setting the Barthel Index was found to be highly correlated (r=0.76, p<0.001) with the London Handicap Scale, a measure of disadvantage experienced as a result of ill health (Jenkinson et al., 2000).
330
In another interview based study results on the Barthel Index (Shah modified version, Shah, 1994) were found to be highly correlated with the Nottingham Extended ADL Index both at discharge and follow up. Responsiveness Effect sizes indicating an instrument’s ability to detect change were found to be high for both the Barthel Index and the FIM (2.2 and 2.4, respectively, n=82) (Sadaria, et al., 2001). However, Jacob-Lloyd (2005) found the Barthel Index (Shah modified version, Shah, et al., 1989).to be insensitive to changes over time in their study of 55 patients, whereas the Nottingham Extended ADL scale detected considerable change. Precision Jacob-Lloyd et al., (2005) claimed that the Barthel Index (Shah modified version, Shah et al., 1989) showed signs of ceiling effects in a study of 54 patients with complete data on the measure. However, only 2 respondents gained a score at the ceiling so this claims seems hard to justify. Acceptability Gompertz et al., (1994) evaluated a test re-test version of the BI on 21 patients. They do not explicitly state what number responded to the follow up, but claim that the measure is ‘practical’ for use via postal administered. Jacob-Lloyd (2005) report that 98% of stroke respondents in their survey completed the Barthel Index (Shah modified version, Shah et al., 1989). Feasibility No data available. Table 9.11: Developmental and evaluation studies relating to the Barthel Index Study/ Country
Population (N) Age Method of administration Setting
Measurement properties
Barthel/Modified Barthel Reliability Validity Responsiveness Precision Acceptability Feasibility Gompertz et al., 1993 UK
Stroke (21) Mean age: 69 Postal survey
Test re-test
Gompertz P et al.,1994 UK
Stroke (21) Mean age: 69 Postal survey
Test re-test
Construct
Jacob-Lloyd et al., 2005 UK
Stroke (55) Mean age 85% over 60 Interview
Construct
Jenkinson et al., 2000 UK
Stroke (303) Mean age: 74 Interview survey
Construct
King et al., 2005 USA
Stroke (170) Mean age:53 SF-12 self completed
Construct
Sadaria KS, et al.,2001 USA
Stroke (82) Age: mean 70.8 Interview
Internal consistency
Construct
Trigg and Wood, 2000 UK
Stroke (157) Age: not specified
Construct
331
e) Frenchay Activities Index The Frenchay Activities Index was developed in the UK to assess social functioning, and developed for use in the clinical interview. It was always intended responses to the form should originate from the patient. It is widely used and reported in the literature on stroke, although few papers assess its psychometric and measurement characteristics. Five papers were judged suitable for inclusion in this review. Reliability Inter-rater reliability was assessed by Piercy et al., (2000). Moderate to high levels of agreement were found between the two raters both at the level of individual items. The Index score was very highly correlated between the two administrations (Spearman’s rho=0.93, p<0.001, n=61). Similarly, Segall and Schall (1994) found high levels of agreement between two research assistants scoring a videotaped FAI (4 patients and 4 caregivers acting as proxy) (ICC=0.97). They also found good agreement between carers and patients on the FAI (ICC = 0.85 (CI 0.74 - 0.92) n=38). Intraclass correlations for the three subscales were found to be moderate (for the Work and Leisure Scale, ICC=0.59) to good (for the Domestic Activities and Outdoors/Other domains ICC=0.77). Validity Construct validity was assessed by Wade et al., (1985). They used to factor analytical techniques and found a high degree of communality for each item confirming the idea the items could be summed to a single score. They also found the FAI score to be highly correlated with Barthel Index score. Whether calculated from either patient or proxy reports FAI total scores were found to be highly correlated with the Functional Independence Measure (FIM) (rho=0.80 for patients and 0.75 for proxies) (Segall and Schnall, 1994). FAI total score and domain scores had good agreement between patients and proxy assessment, and Segall and Schall suggest the instrument seems appropriate for use with relatives and friends who are primary caregivers for patients with cognitive impairment. In an interview based setting the Barthel Index was found to be highly correlated (r=0.73, p<0.001) with the London Handicap Scale, a measure of disadvantage experienced as a result of ill health (Jenkinson et al., 2000). Responsiveness No data available. Precision No data available. Acceptability Segal and Schall (1994) report that the FAI can be completed in approximately 5 minutes either by interview or self completion. Feasibility Results on a postal version of the FAI were compared with those gained from interview. Item agreement varied considerably with items relating to social activities
332
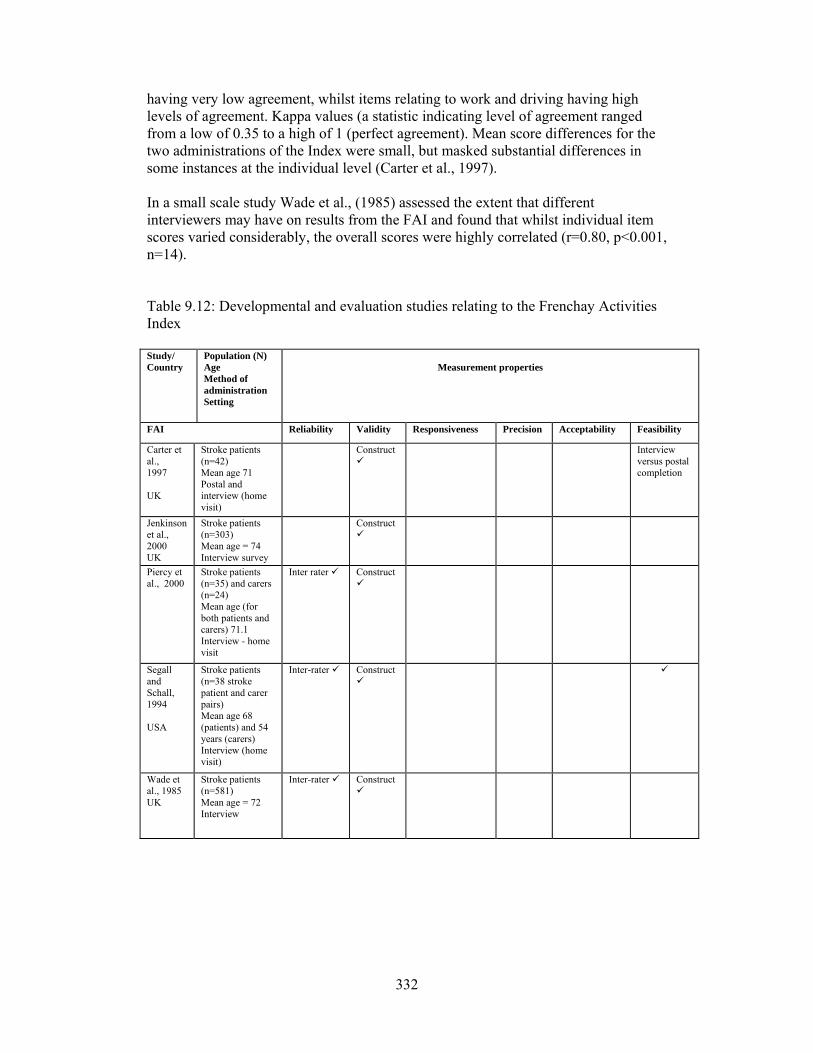
having very low agreement, whilst items relating to work and driving having high levels of agreement. Kappa values (a statistic indicating level of agreement ranged from a low of 0.35 to a high of 1 (perfect agreement). Mean score differences for the two administrations of the Index were small, but masked substantial differences in some instances at the individual level (Carter et al., 1997). In a small scale study Wade et al., (1985) assessed the extent that different interviewers may have on results from the FAI and found that whilst individual item scores varied considerably, the overall scores were highly correlated (r=0.80, p<0.001, n=14). Table 9.12: Developmental and evaluation studies relating to the Frenchay Activities Index Study/ Country
Population (N) Age Method of administration Setting
Measurement properties
FAI Reliability Validity Responsiveness Precision Acceptability Feasibility
Carter et al., 1997 UK
Stroke patients (n=42) Mean age 71 Postal and interview (home visit)
Construct
Interview versus postal completion
Jenkinson et al., 2000 UK
Stroke patients (n=303) Mean age = 74 Interview survey
Construct
Piercy et al., 2000
Stroke patients (n=35) and carers (n=24) Mean age (for both patients and carers) 71.1 Interview - home visit
Inter rater
Construct
Segall and Schall, 1994 USA
Stroke patients (n=38 stroke patient and carer pairs) Mean age 68 (patients) and 54 years (carers) Interview (home visit)
Inter-rater Construct
Wade et al., 1985 UK
Stroke patients (n=581) Mean age = 72 Interview
Inter-rater Construct
333
f) Nottingham Extended ADL Scale The Nottingham Extended ADL scale was developed in the UK as an instrument for postal use. Three papers that reported its use and evaluation are included in this review. Reliability Test re-test reliability of the Nottingham Extended ADL Scale was found to be high in a small scale (n=21) postal evaluation. Stroke patients were sent a questionnaire pack containing the Nottingham Extended ADL Scale six months after having a stroke and then again 2 weeks later. Results were found to be highly correlated, and the measure gained the best repeatability coefficient of all instruments assessed (including the Barthel Index and the Nottingham Health Profile). Item agreement was also found to be good (Gompertz et al., 1993). Validity Gompertz et al., (1994) evaluated the validity of the Extended ADL Scale in a longitudinal study. A total of 361 patients were recruited, but at follow-up only 191 questionnaires were returned at 6 months and 158 twelve months follow-up. High correlations were found between Barthel Score, NHP Physical Mobility, Energy and Pain Scores. However, the authors argue that gender, race and social class, which are independent of mobility, influence scores. Consequently, they suggest that results from the measure may be biased by such confounding variables. Responsiveness Gompertz et al., (1994) found that the Extended ADL Scale detected substantial changes between stroke and follow up at one month (effect size = 1.4), and moderate change between one month and six months (effect size = 0.6). However, the measure did not appear to be sensitive to changes between 6 and 12 months, which may indicate insensitivity on the measure or limited changes in patient health. Jacob-Lloyd et al., (2005) suggest that the Nottingham Extended ADL Scale was more sensitive to change that the Barthel Index in their study of 55 patients from discharge to first follow-up appointment. Indeed the measure suggested substantial change over time, whilst the Barthel hardly registered only very modest change, as assessed with the effect size statistic (ES= 0.63 and 0.17 respectively). Precision Jacob-Lloyd et al., (2005) suggest that the Nottingham Extended ADL Scale ‘showed floor effects at discharge with 50/51 participants scoring below the midpoint and 3 on the minimum score.’ However, these results do not seem to suggest serious floor effects, which are usually interpreted as a high proportion of scores at the very extreme range of the scale. Acceptability Jacob-Lloyd et al., (2005) found that 51 (98%) of stroke respondents completed the Nottingham Extended ADL suggesting the instrument is acceptable to patients. Feasibility No data available.
334
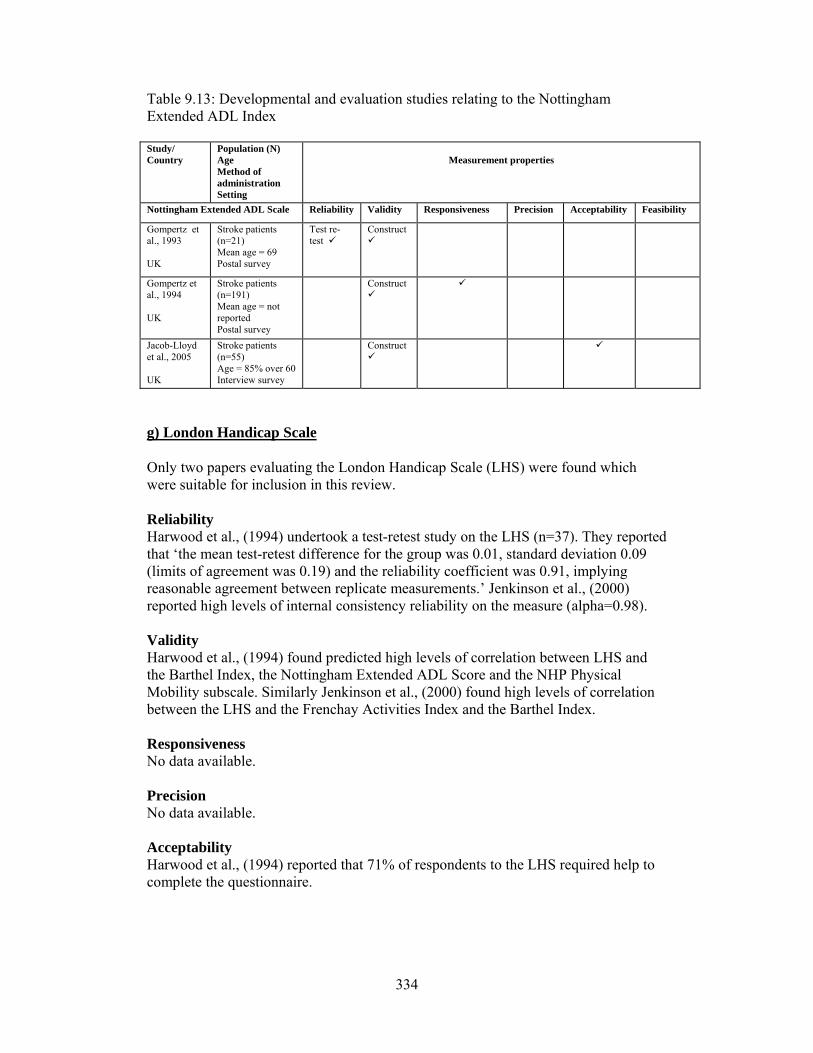
Table 9.13: Developmental and evaluation studies relating to the Nottingham Extended ADL Index Study/ Country
Population (N) Age Method of administration Setting
Measurement properties
Nottingham Extended ADL Scale Reliability Validity Responsiveness Precision Acceptability Feasibility
Gompertz et al., 1993 UK
Stroke patients (n=21) Mean age = 69 Postal survey
Test re-test
Construct
Gompertz et al., 1994 UK
Stroke patients (n=191) Mean age = not reported Postal survey
Construct
Jacob-Lloyd et al., 2005 UK
Stroke patients (n=55) Age = 85% over 60 Interview survey
Construct
g) London Handicap Scale
Only two papers evaluating the London Handicap Scale (LHS) were found which were suitable for inclusion in this review.
Reliability Harwood et al., (1994) undertook a test-retest study on the LHS (n=37). They reported that ‘the mean test-retest difference for the group was 0.01, standard deviation 0.09 (limits of agreement was 0.19) and the reliability coefficient was 0.91, implying reasonable agreement between replicate measurements.’ Jenkinson et al., (2000) reported high levels of internal consistency reliability on the measure (alpha=0.98). Validity Harwood et al., (1994) found predicted high levels of correlation between LHS and the Barthel Index, the Nottingham Extended ADL Score and the NHP Physical Mobility subscale. Similarly Jenkinson et al., (2000) found high levels of correlation between the LHS and the Frenchay Activities Index and the Barthel Index. Responsiveness No data available. Precision No data available. Acceptability Harwood et al., (1994) reported that 71% of respondents to the LHS required help to complete the questionnaire.
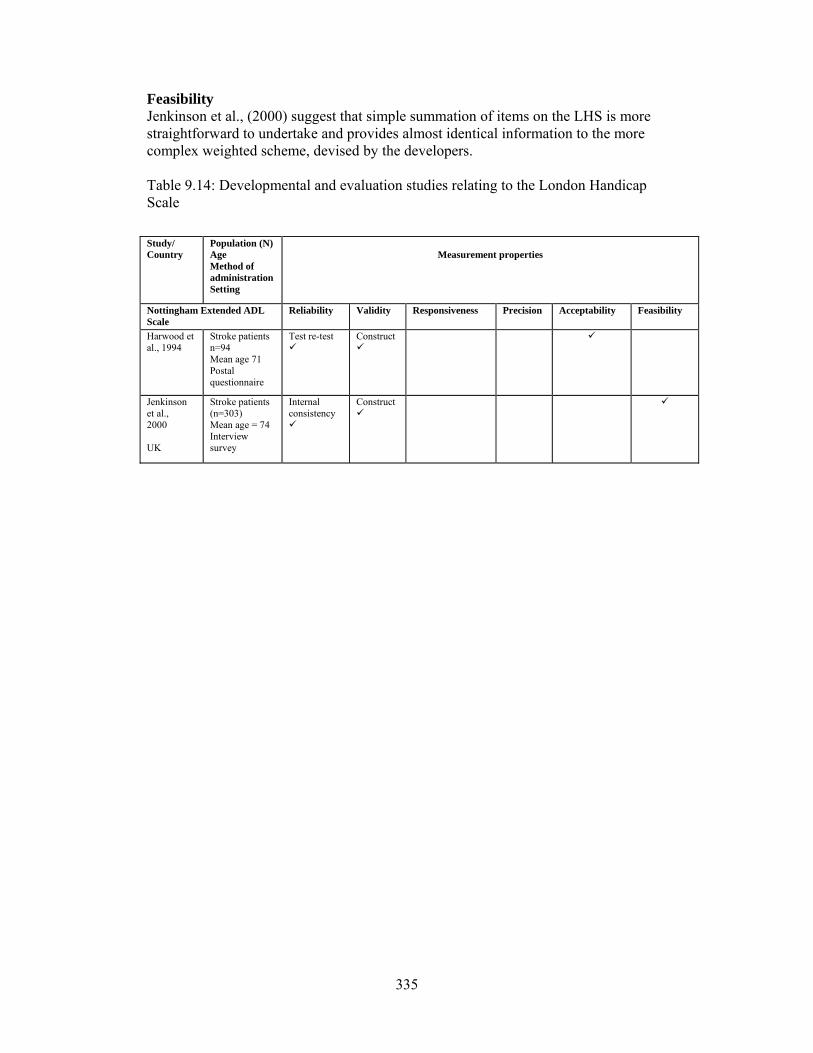
335
Feasibility Jenkinson et al., (2000) suggest that simple summation of items on the LHS is more straightforward to undertake and provides almost identical information to the more complex weighted scheme, devised by the developers. Table 9.14: Developmental and evaluation studies relating to the London Handicap Scale
Study/ Country
Population (N) Age Method of administration Setting
Measurement properties
Nottingham Extended ADL Scale
Reliability Validity Responsiveness Precision Acceptability Feasibility
Harwood et al., 1994
Stroke patients n=94 Mean age 71 Postal questionnaire
Test re-test
Construct
Jenkinson et al., 2000 UK
Stroke patients (n=303) Mean age = 74 Interview survey
Internal consistency
Construct
336
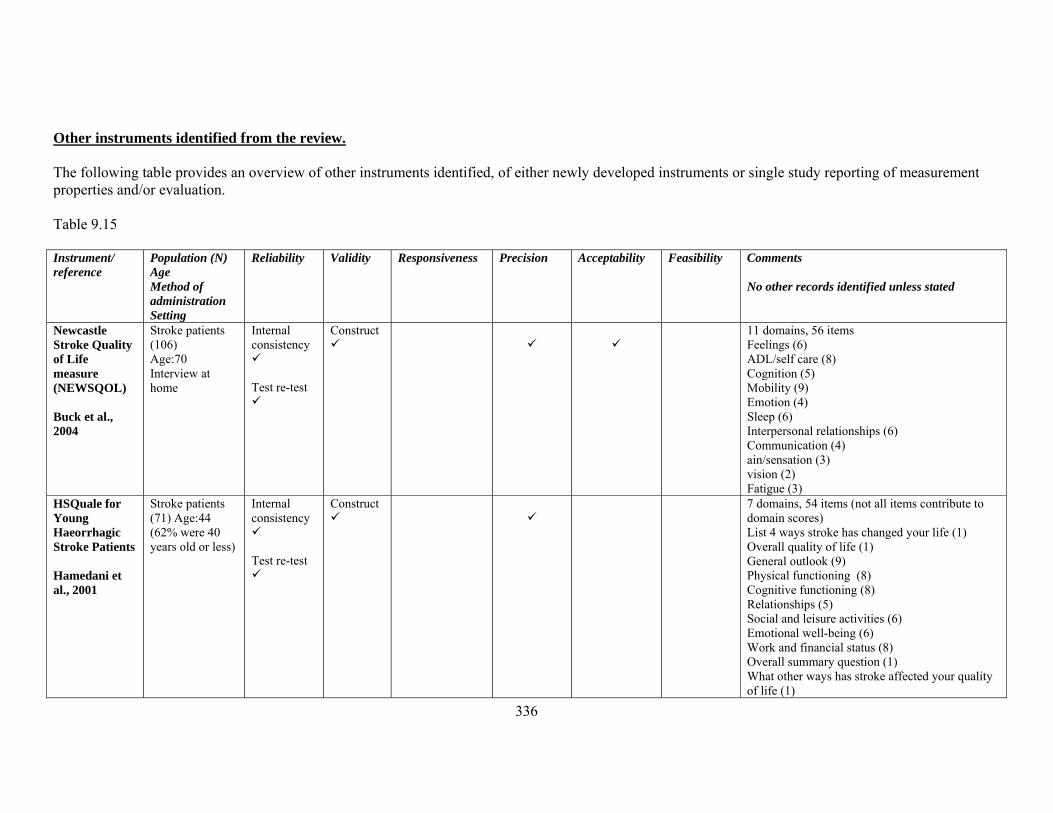
Other instruments identified from the review. The following table provides an overview of other instruments identified, of either newly developed instruments or single study reporting of measurement properties and/or evaluation. Table 9.15 Instrument/ reference
Population (N) Age Method of administration Setting
Reliability Validity Responsiveness Precision Acceptability Feasibility Comments No other records identified unless stated
Newcastle Stroke Quality of Life measure (NEWSQOL) Buck et al., 2004
Stroke patients (106) Age:70 Interview at home
Internal consistency
Test re-test
Construct
11 domains, 56 items Feelings (6) ADL/self care (8) Cognition (5) Mobility (9) Emotion (4) Sleep (6) Interpersonal relationships (6) Communication (4) ain/sensation (3) vision (2) Fatigue (3)
HSQuale for Young Haeorrhagic Stroke Patients Hamedani et al., 2001
Stroke patients (71) Age:44 (62% were 40 years old or less)
Internal consistency
Test re-test
Construct
7 domains, 54 items (not all items contribute to domain scores) List 4 ways stroke has changed your life (1) Overall quality of life (1) General outlook (9) Physical functioning (8) Cognitive functioning (8) Relationships (5) Social and leisure activities (6) Emotional well-being (6) Work and financial status (8) Overall summary question (1) What other ways has stroke affected your quality of life (1)
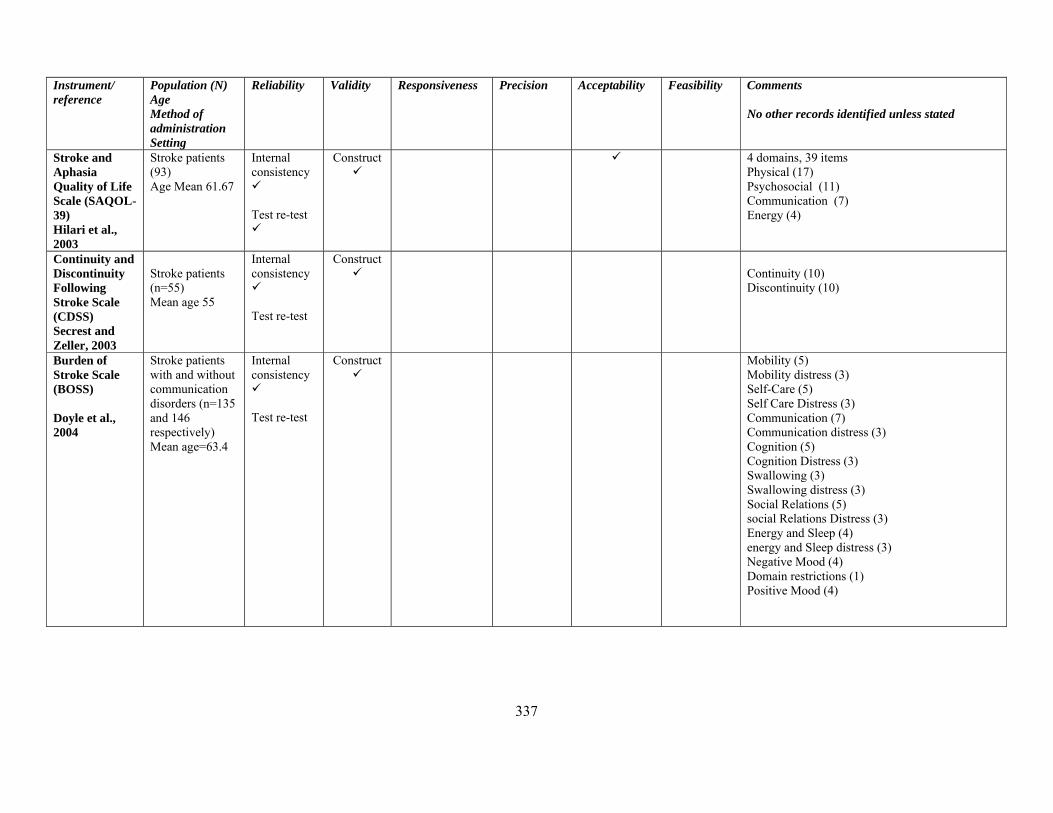
337
Instrument/ reference
Population (N) Age Method of administration Setting
Reliability Validity Responsiveness Precision Acceptability Feasibility Comments No other records identified unless stated
Stroke and Aphasia Quality of Life Scale (SAQOL-39) Hilari et al., 2003
Stroke patients (93) Age Mean 61.67
Internal consistency
Test re-test
Construct
4 domains, 39 items Physical (17) Psychosocial (11) Communication (7) Energy (4)
Continuity and Discontinuity Following Stroke Scale (CDSS) Secrest and Zeller, 2003
Stroke patients (n=55) Mean age 55
Internal consistency
Test re-test
Construct
Continuity (10) Discontinuity (10)
Burden of Stroke Scale (BOSS) Doyle et al., 2004
Stroke patients with and without communication disorders (n=135 and 146 respectively) Mean age=63.4
Internal consistency
Test re-test
Construct
Mobility (5) Mobility distress (3) Self-Care (5) Self Care Distress (3) Communication (7) Communication distress (3) Cognition (5) Cognition Distress (3) Swallowing (3) Swallowing distress (3) Social Relations (5) social Relations Distress (3) Energy and Sleep (4) energy and Sleep distress (3) Negative Mood (4) Domain restrictions (1) Positive Mood (4)
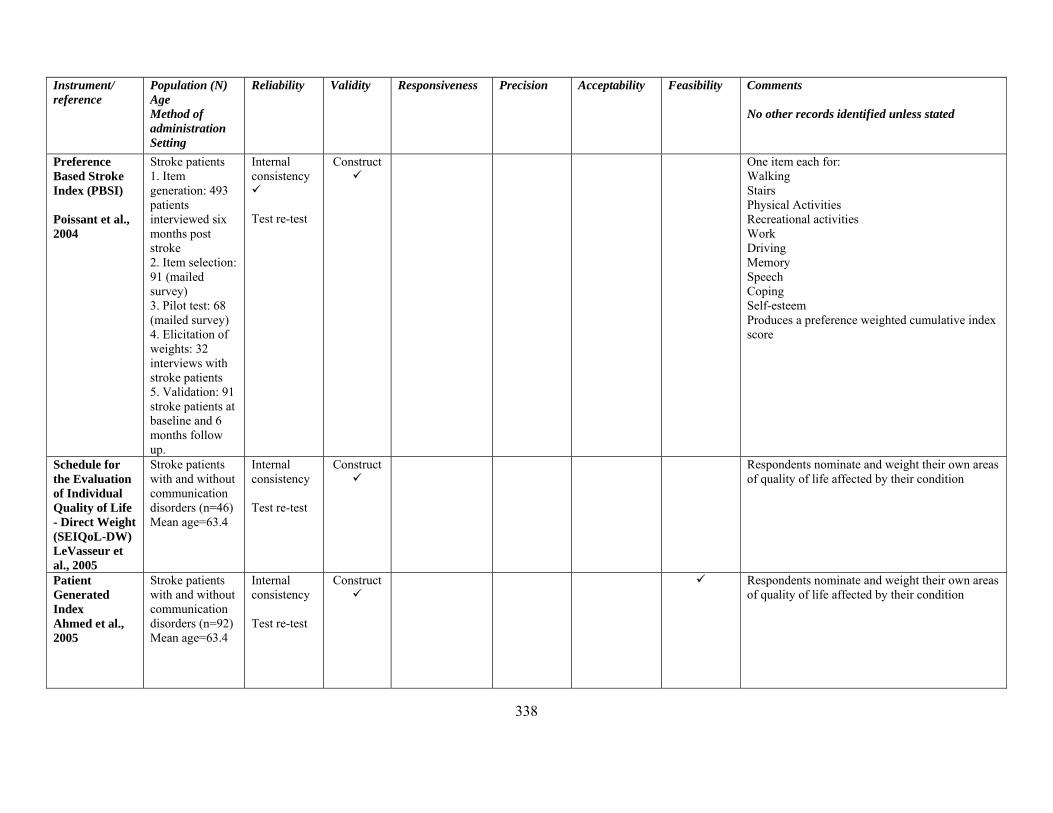
338
Instrument/ reference
Population (N) Age Method of administration Setting
Reliability Validity Responsiveness Precision Acceptability Feasibility Comments No other records identified unless stated
Preference Based Stroke Index (PBSI) Poissant et al., 2004
Stroke patients 1. Item generation: 493 patients interviewed six months post stroke 2. Item selection: 91 (mailed survey) 3. Pilot test: 68 (mailed survey) 4. Elicitation of weights: 32 interviews with stroke patients 5. Validation: 91 stroke patients at baseline and 6 months follow up.
Internal consistency
Test re-test
Construct
One item each for: Walking Stairs Physical Activities Recreational activities Work Driving Memory Speech Coping Self-esteem Produces a preference weighted cumulative index score
Schedule for the Evaluation of Individual Quality of Life - Direct Weight (SEIQoL-DW) LeVasseur et al., 2005
Stroke patients with and without communication disorders (n=46) Mean age=63.4
Internal consistency Test re-test
Construct
Respondents nominate and weight their own areas of quality of life affected by their condition
Patient Generated Index Ahmed et al., 2005
Stroke patients with and without communication disorders (n=92) Mean age=63.4
Internal consistency Test re-test
Construct
Respondents nominate and weight their own areas of quality of life affected by their condition
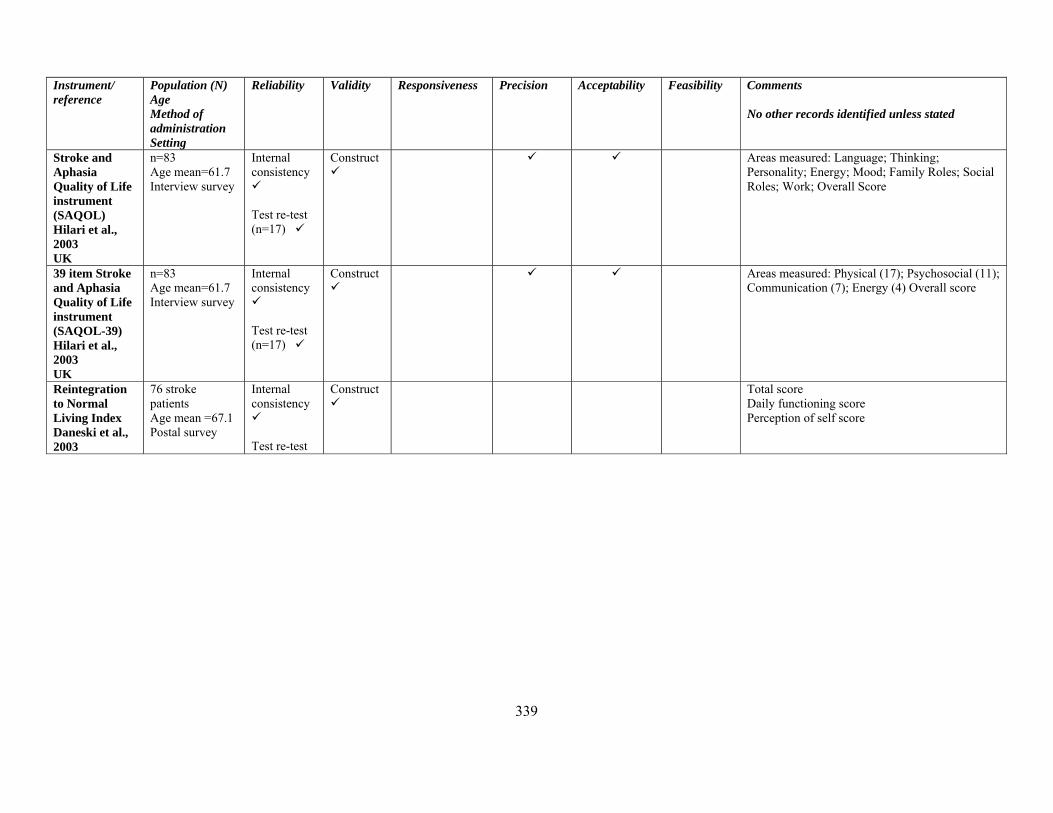
339
Instrument/ reference
Population (N) Age Method of administration Setting
Reliability Validity Responsiveness Precision Acceptability Feasibility Comments No other records identified unless stated
Stroke and Aphasia Quality of Life instrument (SAQOL) Hilari et al., 2003 UK
n=83 Age mean=61.7 Interview survey
Internal consistency
Test re-test (n=17)
Construct
Areas measured: Language; Thinking; Personality; Energy; Mood; Family Roles; Social Roles; Work; Overall Score
39 item Stroke and Aphasia Quality of Life instrument (SAQOL-39) Hilari et al., 2003 UK
n=83 Age mean=61.7 Interview survey
Internal consistency
Test re-test (n=17)
Construct
Areas measured: Physical (17); Psychosocial (11); Communication (7); Energy (4) Overall score
Reintegration to Normal Living Index Daneski et al., 2003
76 stroke patients Age mean =67.1 Postal survey
Internal consistency
Test re-test
Construct
Total score Daily functioning score Perception of self score
340
SUMMARY - GENERIC INSTRUMENTS Six generic instruments (SF-36, SF-12, SF-6D, EuroQol, HUI-3, and NHP) were identified in the review, which had been evaluated with people who have experienced a stroke. For only three of these was there sufficient data to make any informed decisions (SF-36, SF-12, and EuroQol). The most frequently reported instrument evaluated was the SF-36 with evidence provided for all measurement selection criteria. The evidence for its use in stroke is generally, but not universally, good. For the most part studies reported the instrument domains to have good internal consistency reliability or test-retest reliability. However, there were exceptions, with the General Health dimension failing to fulfil the requirements for this attribute. Test-retest results were found to be acceptable on most dimensions but very low in one study for the Mental Health dimension. The validity of the SF-36 has been examined in concurrent evaluations with widely used rehabilitation measures (e.g. the Frenchay Activities Index and Barthel Index) and found to be good. Empirical evidence supports the internal structure and proposed health domains of the SF-36. There is evidence of responsiveness for the SF-36 domains but evidence suggests it may not perform as well as established instruments used in rehabilitation. Floor and ceiling effects were widely reported, and this may limit the use of the instrument in evaluative studies, especially in those where patients have serious ill health. That said, in order to score on the ‘floor’ of the domains on the SF-36 one has to have substantially compromised functioning and/or well-being, and any further ability to assess severity may not truly be necessary. Furthermore, a modified version of the SF-36, the SF-36v2, is now available and may reduce such problems in at least the Role Functioning domains, which have been altered to increase precision. It is perhaps predictable that response rates in those with severe stroke are lower on the SF-36 than in shorter instruments, such as the EuroQol. Evidence for the accuracy of the measure by proxy (e.g. completed by carers, relatives etc) was not good. There was only a limited amount of evidence for the SF-12 in stroke. The two domain measurement model proposed by the developers of the instrument was supported in this patient group. Scores on the two dimensions were generally supported by concurrent evaluations with related measures. Indeed, the SF-12 can be evaluated in relation to a ‘gold standard’ (the SF-36) and scores between the two measures were found to be very highly correlated. However, there were differences, which could be meaningful, in terms of descriptive statistics and this could suggest inaccuracy in measurement and reduce the validity of the instrument in stroke. The EuroQol EQ-5D was found to provide reproducible results, and was acceptable, in terms of completion, to more patients than the SF-36. It gave results comparable to other utility measures as well as the Barthel Index. There was some evidence of floor effects in patients defined as ‘high functioning’ stroke, and hence the instrument is likely to be less sensitive to changes in this group. There is debate as to how the EuroQol should be weighted (with different results gained from stroke patient valuations as to opposed societal valuations). However, as long as the same valuations are used across time and across studies results should be comparable, though whether they should be used in economic analyses remains a matter of debate.
341
Recommendations Overall, the SF-36 is the most rigorously evaluated generic instrument although there is mixed evidence to support its application with patients with severe stroke. There is evidence to support the EuroQol as a brief, reasonably acceptable measure of general health in stroke, although both the amount and quality of evaluative material is limited. SUMMARY – STROKE-SPECIFIC INSTRUMENTS Fifteen disease specific questionnaires were included in this review, including a number of measures designed principally to assess the influence of rehabilitation. Two ‘individualised’ measures of outcome were also found to have been used in stroke, but limited information was available for them (PGI and SEIQoL). Consequently seven measures were found to have sufficient information available on their psychometric properties to warrant evaluation (Stroke Impact Scale (SIS), Stroke Specific Quality of Life Scale (SS-QOL), Subjective Index of Physical and social Outcomes (SIPSO), Barthel Index, Frenchay Activities Index, Nottingham Extended ADL scale, London Handicap Scale). Well established rehabilitation measures fared reasonably in terms of their psychometric properties. The Barthel Index, Frenchay Activities Index and Nottingham Extended ADL Scale were all primarily designed to evaluation rehabilitation outcomes. They are not strictly multi dimensional health outcome/quality of life instruments, but all measure important aspects of health status. The Barthel Index is a measure of independence, and was not initially designed for self completion, but versions of the instrument exist that can be completed by patients. Self completion and interview versions of the instrument have been found to have good reliability and validity, although the sensitivity of the instrument to change is a matter of debate. The Frenchay Activities Index was designed for interview administration, and is a measure of social activities and lifestyle following stroke. The instrument is generally used in interview settings, and there is evidence that the interviewer agreement on items can vary, albeit not dramatically. Available evidence suggests the instrument has good validity, and is amongst the easier measures for stroke patients to complete. The Nottingham Extended ADL Scale has been found to be reliable, and valid in concurrent validation with other instruments. Furthermore it appears sensitive to changes, and appears acceptable to patients. Rehabilitation measures are widely used in the arena of stroke, are well understood by physicians and consequently provide useful and interpretable data. It is hard not to suggest a place for such instruments in evaluation of stroke. One potential criticism of such instruments is that they are typically designed on the basis of clinical judgement and may not reflect issues of importance to patients. Consequently, it seems that such instruments might reasonably be used in conjunction with other quality of life measures. The London Handicap Scale is perhaps a rather domain specific measure, and the available data is too limited to recommend its widespread use. However, on-going validation of the measure is to be encouraged, although, within stroke at least, the instrument does not appear to be widely used.
342
In less than a decade there seems to have been an explosion of research into developing stroke specific measures of quality of life and health status. However, this research has not been well coordinated, and consequently a number of instruments exist but few have been subject to on-going evaluation. Researchers seem intent on developing new measures rather than testing existing instruments. Of ten measures documented in this review, only three had sufficient information to be included in the evaluation of instruments (SIS, SS-QOL, and SIPSO). The most data is available for the SIS, but none of the validation research undertaken on the instrument has originated in the UK. The measure has been found to have reasonably good psychometric properties. Internal consistency reliability of all the domains of the measure has been found to be high. Concurrent validations with other health status and rehabilitation instruments have supported the validity of the measure, although some floor and ceiling effects. Unsurprisingly, response rates to the questionnaire have been found to be adversely effected by severity of stroke. Nonetheless results thus far for the SIS are promising, but it does not seem appropriate to recommend such a measure for inclusion in surveys in the UK without there first being some data available on its measurement properties in a UK stroke sample. Similarly the SS-QOL was developed and validated in the USA. Initial assessment of the instrument has been undertaken in the UK, but there is insufficient information to recommend this instrument fully. The SIPSO has been developed in the UK and initial validation of this instrument is very promising. Internal reliability consistency and construct validity have been shown to be good. Furthermore item completion is good and there is little evidence of floor and ceiling effects. However, the instrument is primarily a measure of people’s social integration rather than abilities per se, and as a consequence its focus may seem rather narrow. Furthermore, further research is needed to fully evaluate the measure across different levels of stroke severity. Recommendations At the present stage of development no single multi-dimensional outcome tool has sufficient information available to recommend it wholeheartedly. Both the SIS and the SIPSO seem highly promising but further data is required for both measures. It seems that, at least for the time being, interview and self completion versions of the Barthel Index, Frenchay Activities Index and Nottingham Extended ADL Scale would appear the most appropriate condition-specific instruments.
343
REFERENCES Ahmed S, Mayo NE, Corbiere M, Wood-Dauphinee S, Hanley J, Cohen R. Change in quality of life of people with stroke over time: True change or response shift? Quality-of-Life-Research:-An-International-Journal-of-Quality-of-Life-Aspects-of-Treatment,-Care-and-Rehabilitation 2005;14:611-27. Anderson CS, Laubscher S, Burns R. Validation of the Short Form 36 (SF-36) Health Survey questionnaire among stroke patients. Stroke 1996; 27:1812-6.
Bohannon RW, Maljanian R, Lee N, Ahlquist M. Measurement properties of the Short Form (SF)-12 applied to patients with stroke. International Journal of Rehabilitation Research 2004; 27:151-4.
Bohannon RW, Maljanian R, Landes M. Test-retest reliability of short form (SF)-12 component scores of patients with stroke. International Journal of Rehabilitation Research 2004; 27:149-50. Buck D, Jacoby A, Massey A, Steen N, Sharma A, Ford GA. Development and validation of NEWSQOLR, the newcastle stroke-specific quality of life measure. Cerebrovascular-Diseases 2004;17:143-52.
Carter J, Mant F, Mant JW, Wade DT, Winner S. Comparison of postal version of the Frenchay Activities Index with interviewer-administered version for use in people with stroke. Clinical Rehabilitation 1997; 11:131-8.
Clark MS, Bond M, The Adelaide Activities Profile: a measure of the life-style activities of elderly people. Ageing Clin Exp Res 1995; 7: 174-184. Cote R, Hachinski V, Shurvell B, Norris J, Wolfson C. the Canadian Neurological Scale: A preliminary study in acute stroke. Stroke 1986; 17: 731-737. Daneski K, Coshall C, Tilling K, Wolfe CDA. Reliability and validity of a postal version of the Reintegration to Normal Living Index, modified for use with stroke patients. Clinical Rehabilitation 2003;17:835-9. Dorman PJ, Waddell F, Slattery J, Dennis M, Sandercock P. Are proxy assessments of health status after stroke with the EuroQol questionnaire feasible, accurate, and unbiased? Stroke 1997; 28:1883-7.
Dorman PJ, Waddell F, Slattery J, Dennis M, Sandercock P. Is the EuroQol a valid measure of health-related quality of life after stroke? Stroke 1997; 28:1876-82.
Dorman PJ, Slattery J, Farrell B, Dennis M, Sandercock P. Qualitative comparison of the reliability of health status assessments with the EuroQol and SF-36 questionnaires after stroke. Stroke 1998; 29:63-8.
Dorman PJ, Dennis M, Sandercock P. How do scores on the EuroQol relate to scores on the SF-36 after stroke? Stroke 1999; 30:2146-51.
344
Doyle PJ, McNeil MR, Mikolic JM, Prieto L, Hula WD, Lustig AP et al. The Burden of Stroke Scale (BOSS) provides valid and reliable score estimates of functioning and well-being in stroke survivors with and without communication disorders. Journal-of-Clinical-Epidemiology 2004;57:997-1007. Duncan PW, Wallace D, Lai SM, Johnson D, Embretson S, Laster LJ. The Stroke Impact Scale version 2.0: evaluation of reliability, validity, and sensitivity to change. Stroke 1999; 30:2131-40.
Duncan PW, Lai SM, Keighley J. Defining post-stroke recovery: Implications for design and interpretation of drug trials. Neuropharmacology 2000; 39:835-41.
Duncan PW, Reker DM, Horner RD, Samsa GP, Hoenig H, LaClair BJ et al., Performance of a mail-administered version of a stroke-specific outcome measure, the Stroke Impact Scale. Clinical Rehabilitation 2002; 16:493-505.
Duncan PW, Bode RK, Min-Lai S, Perera S. Rasch analysis of a new stroke-specific outcome scale: the Stroke Impact Scale. Archives of Physical Medicine and Rehabilitation 2003; 84:950-63.
Duncan P, Reker D, Kwon S, Lai S, Studenski S, Perera S et al.,. Measuring stroke impact with the Stroke Impact Scale: telephone versus mail administration in veterans with Stroke. Medical-Care 2005; 43: 507-15
Edwards B, O’Connell B. Internal consistency and validity of the Stroke Impact Scale 2.0/SIS 2.0 and SIS-16 in an Australian sample. Quality of Life Research 2003; 12:1127-35.
Goldstein LB, Lyden P, Mathias SD, Colman SS, Pasta DJ, Albers G et al. Telephone assessment of functioning and wellbeing following stroke: is it feasible? Journal of Stroke and Cerebrovascular Diseases 2002;11:80-7.
Gompertz P, Pound P, Ebrahim S. The reliability of stroke outcome measures. Clinical Rehabilitation 1993; 7:290-6.
Gompertz P, Pound P, Ebrahim S. A postal version of the Barthel Index. Clinical Rehabilitation 1994; 8:233-9.
Gompertz P, Pound P, Ebrahim S. Validity of the Extended Activities of Daily Living scale. Clinical Rehabilitation 1994; 8:275-80. Granger CV, Albrecht GL, Hamilton BB. (1979) Outcome of comprehensive medical rehabilitation: Measurement by PULSES Profile and the Barthel Index. Archives of Physical Medicine and Rehabilitation 1979; 60: 145-54. Grootendorst P, Feeny DH, Furlong WJ. Health Utilities Index Mark 3: evidence of construct validity for stroke and arthritis in a population health survey. Medical Care 2000; 38:290-9.
345
Hackett ML, Anderson CS, House AO. Interventions for treating depression after stroke. The Cochrane Library/Cochrane Database Systematic Review 2004;CD003437.
Hagen S, Bugge C, Alexander H. Psychometric properties of the SF-36 in the early post-stroke phase. Journal of Advanced Nursing 2003; 44:461-8.
Hamedani AG, Wells CK, Brass LM, Kernan WN, Viscoli CM, Maraire N et al.,.,. A quality of life instrument for young hemorrhagic stroke patients. Stroke 2001; 32:687-95.
Harwood RH, Gompertz P, Ebrahim S. Handicap one year after a stroke: validity of a new scale. Journal of Neurology, Neurosurgery and Psychiatry 1994; 57:825-9.
Harwood RH, Ebrahim S. The validity, reliability and responsiveness of the Nottingham Extended Activities of Daily Living scale in patients undergoing total hip replacement. Disability and Rehabilitation 2002; 24:371-7.
Hilari K, .Byng S. Measuring quality of life in people with aphasia: the Stroke-Specific Quality of Life Scale. International Journal of Language and Communication Disorders 2001; 36:86-91.
Hilari K, Byng S, Lamping DL, Smith SC. Stroke and Aphasia Quality of Life Scale-39/SAQOL-39: evaluation of acceptability, reliability, and validity. Stroke 2003; 34:1944-50.
Hobart JC, Williams LS, Moran K, Thompson AJ. Quality of life measurement after stroke: uses and abuses of the SF-36. Stroke 2002; 33:1348-56.
Holbrook M, Skilbeck CE. An activities index for use with stroke patients. Age and Ageing 1983; 12: 166-70.
Jacob-Lloyd HA, Dunn OM, Brain ND, Lamb SE. Effective measurement of the functional progress of stroke clients. British-Journal-of-Occupational-Therapy 2005;68:253-9.
Jenkinson C. The SF-36 physical and mental health summary measures: an example of how to interpret scores. Journal of Health Services Research and Policy 1998; 3: 92-96.
Jenkinson CP, Mant JW, Carter J, Wade DT, Winner S. The London Handicap Scale: a re-evaluation of its validity using standard scoring and simple summation. Journal of Neurology, Neurosurgery and Psychiatry 2000; 68:365-7. Kersten P, George S, Low J, Ashburn A, McLellan L. The Subjective Index of Physical and Social Outcome: its usefulness in a younger stroke population. International-Journal-of-Rehabilitation-Research 2004; 27:59-63.
King JTJ, Kassam AB, Yonas H, Horowitz MB, Roberts MS. Mental health, anxiety, and depression in patients with cerebral aneurysms. J Neurosurg. 2005;103:636-41.

346
Kwon S, Hartzema AG, Duncan PW, Lai SM. Disability measures in stroke: relationship among the Barthel Index, the Functional Independence Measure, and the Modified Rankin Scale. Stroke 2004; 35:918-23.
LeVasseur SA, Green S, Talman P. The SEIQoL-DW is a valid method for measuring individual quality of life in stroke survivors attending a secondary prevention clinic. Quality-of-Life-Research 2005;14:779-88.
Lai, SM, Perera, S, Duncan, PW, Bode, R. Physical and social functioning after stroke: Comparison of the stroke impact scale and SF-36. Stroke 2003; 34:448-493.
Lai SL, Guo XF, Liang WX. Preliminary study on outcome assessment system of treatment of stroke. Zhongguo Zhong.Xi.Yi Jie.He Za Zhi 2004; 24:197-201.
Lim LLY, .Fisher JD. Use of the 12-item Short-Form (SF-12) Health Survey in an Australian heart and stroke population. Quality of Life Research 1999; 8:1-8.
McPherson K, Myers J, Taylor WJ, McNaughton HK, Weatherall M. Self-valuation and societal valuations of health state differ with disease severity in chronic and disabling conditions Med.Care 2004;42:1143-51. Nouri FM, Lincoln NB. An extended activities of daily living index for stroke patients. Clinical Rehabilitation 1987; 1: 301-305. Nichols-Larsen DS, Clark PC, Zeringue A, Greenspan A, Blanton S. Factors influencing stroke survivors quality of life during subacute recovery Stroke 2005; 36: 1480-1484.
Nunnally, J. Psychometric theory (2nd ed.). New York: McGraw-Hill Book Co.
O'Mahony PG, Rodgers H, Thomson RG, Dobson R, James OFW. Is the SF-36 suitable for assessing health status of older stroke patients? Age and Ageing 1998; 27:19-22.
Patrick D, Peach H. Disablement in the Community. Oxford: Oxford University Press, 1989.
Patel MD, Tilling K, Lawrence E, Rudd AG, Wolfe CD, McKevitt C. Relationships between long-term stroke disability, handicap and health-related quality of life. Age Ageing. 2006 May;35(3):273-9.
Pickard AS. 'Replicability of SF-36 summary scores by the SF-12 in stroke patients' - erratum. Stroke 1999; 30:1737.
Pickard AS, Johnson JA, Penn A, Lau F, Noseworthy T. Replicability of SF-36 summary scores by the SF-12 in stroke patients. Stroke 1999; 30:1213-7.
Pickard AS, Johnson JA, Feeny DH. Responsiveness of generic health-related quality of life measures in stroke. Quality-of-Life-Research 2005;14:207-19.
347
Piercy M, Carter J, Mant JW, Wade DT. Inter-rater reliability of the Frenchay Activities Index in patients with stroke and their carers. Clinical Rehabilitation 2000; 14:433-40.
Poissant, Lise. The development of a Preference-Based Health Index for stroke 1002. Dissertation-Abstracts-International:-Section-B:-The-Sciences-and-Engineering 64(11-B), 5836. 2004.
Polsky D, Willke RJ, Scott K, Schulman KA, Glick HA. A comparison of scoring weights for the EuroQol derived from patients and the general public. Health Economics 2001; 10:27-37.
Rubenach S, Anderson CS, Laubscher S. The Short Form-12 by telephone as a measure of health-related quality of life after stroke. Age and Ageing 2000;29:553-4.
Sadaria KS, Bohannon RW, Lee N, Maljanian R. Ratings of physical function obtained by interview are legitimate for patients hospitalized after stroke. Journal of Stroke and Cerebrovascular Diseases 2001; 10:79-84.
Secrest JS,.Zeller R. Measuring continuity and discontinuity following stroke. Journal of Nursing Scholarship 2003;35:243-7
Segal ME, .Schall RR. Determining functional/health status and its relation to disability in stroke survivors. Stroke 1994; 25:2391-7.
Shah S, Vanclay F, Cooper B (1989) Improving the sensitivity of the Barthel Index for stroke rehabilitation. Journal of Clinical Epidemiology 1989; 42 (8): 703-709
Trigg R, .Wood VA. The Subjective Index of Physical and Social Outcome/SIPSO: a new measure for use with stroke patients. Clinical Rehabilitation 2000; 14:288-99.
Trigg R, Wood V, Hewer R. Social integration after stroke: the first stages in the development of the Subjective Index of Physical and Social Outcome (SIPSO). Clinical Rehabilitation 1999; 13: 341-353.
Trigg R, .Wood VA. The validation of the Subjective Index of Physical and Social Outcome/SIPSO. Clinical Rehabilitation 2003; 17:283-9. Wade DT, Collin C. The Barthel ADL Index: a standard measure of disability? International Disability Studies 1988; 10: 64-7. Wade DT, Legh SJ, Langton HR. Social activities after stroke: measurement and natural history using the Frenchay Activities Index. International Rehabilitation Medicine 1985; 7:176-81.

348
WHOQOL Group. The World Health Organisation Quality of Life Assessment (WHOQOL). Development and general psychometric properties. Soc Sci Med 1998; 46: 1569-85
Williams LS, Weinberger M, Harris LE, Clark DO, Biller J. Development of a stroke-specific quality of life scale. Stroke 1999a; 30:1362-9.
Williams LS, Weinberger M, Harris LE, Biller J. Measuring quality of life in a way that is meaningful to stroke patients. Neurology 1999b; 53:1839-43.


![Inexpensive Geophysical Instruments Supporting Groundwater … · 2013-12-24 · Others have reported developing inexpensive resistiv-ity [6] and seismic instruments [7] for educational](https://img.pdfslide.net/doc/110x75/5eda989451722b1cf87df422/inexpensive-geophysical-instruments-supporting-groundwater-2013-12-24-others-have.jpg)
![Treatment of Sarcoidosis - WASOG...sessment in extra-pulmonary sarcoidosis. For cutaneous sar-coidosis, several instruments have been reported [6]. These include the sarcoidosis activity](https://img.pdfslide.net/doc/110x75/5e6355752530ca396d712283/treatment-of-sarcoidosis-wasog-sessment-in-extra-pulmonary-sarcoidosis-for.jpg)

![Application of the Soft X-Ray TSI Advanced Aerosol ... · compares well with the measurements reported in the literature for instruments of different design. Watson et al., [3] reported](https://img.pdfslide.net/doc/110x75/5e9298dd4cb0014a26449334/application-of-the-soft-x-ray-tsi-advanced-aerosol-compares-well-with-the-measurements.jpg)