Embed Size (px)
Citation preview
Excerpts from this work may be reproduced by instructors for distribution on a not-for-profit basis for testing or instructional purposes only to students enrolled in courses for which the textbook has been adopted. Any other reproduction or translation of this work beyond that permitted by Sections 107 or 108 of the 1976 United States Copyright Act without the permission of the copyright owner is unlawful.
CHAPTER 9
PHASE DIAGRAMS
PROBLEM SOLUTIONS
9.14 Determine the relative amounts (in terms of mass fractions) of the phases for the alloys and
temperatures given in Problem 9.8.
Solution
This problem asks that we determine the phase mass fractions for the alloys and temperatures in Problem
9.8.
(a) From Problem 9.8a, ε and η phases are present for a 90 wt% Zn-10 wt% Cu alloy at 400°C, as
represented in the portion of the Cu-Zn phase diagram shown below (at point A).
Furthermore, the compositions of the phases, as determined from the tie line are
Cε = 87 wt% Zn-13 wt% Cu
Cη = 97 wt% Zn-3 wt% Cu
Inasmuch as the composition of the alloy C0 = 90 wt% Zn, application of the appropriate lever rule expressions (for
compositions in weight percent zinc) leads to
Excerpts from this work may be reproduced by instructors for distribution on a not-for-profit basis for testing or instructional purposes only to students enrolled in courses for which the textbook has been adopted. Any other reproduction or translation of this work beyond that permitted by Sections 107 or 108 of the 1976 United States Copyright Act without the permission of the copyright owner is unlawful.
Wε =
Cη − C0
Cη − Cε=
97 − 90
97 − 87= 0.70
Wη =
C0 − CεCη − Cε
=90 − 8797 − 87
= 0.30
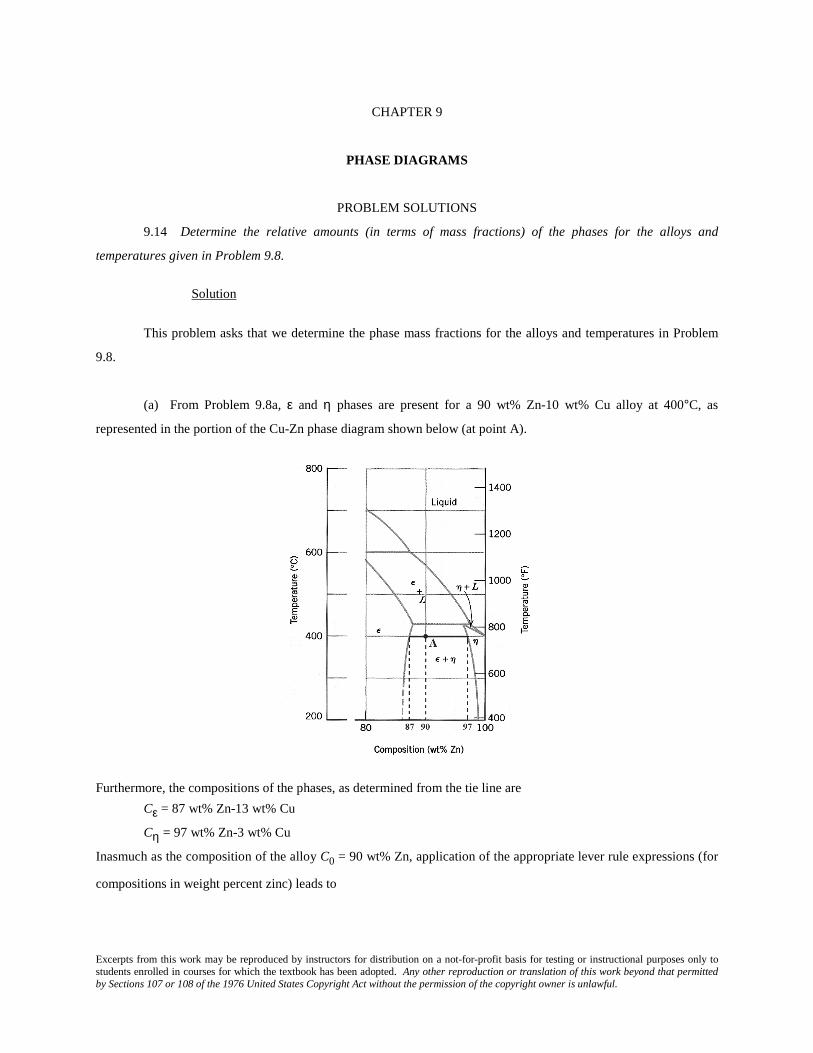
(b) From Problem 9.8b, α and β phases are present for a 75 wt% Sn-25 wt% Pb alloy at 175°C, as
represented in the portion of the Pb-Sn phase diagram shown below (at point B).
Furthermore, the compositions of the phases, as determined from the tie line are
Cα = 16 wt% Sn-84 wt% Pb
Cβ = 97 wt% Sn-3 wt% Pb
Inasmuch as the composition of the alloy C0 = 75 wt% Sn, application of the appropriate lever rule expressions (for
compositions in weight percent tin) leads to
Wα =
Cβ − C0
Cβ − Cα=
97 − 75
97 − 16= 0.27
Wβ =
C0 − CαCβ − Cα
=75 − 1697 − 16
= 0.73
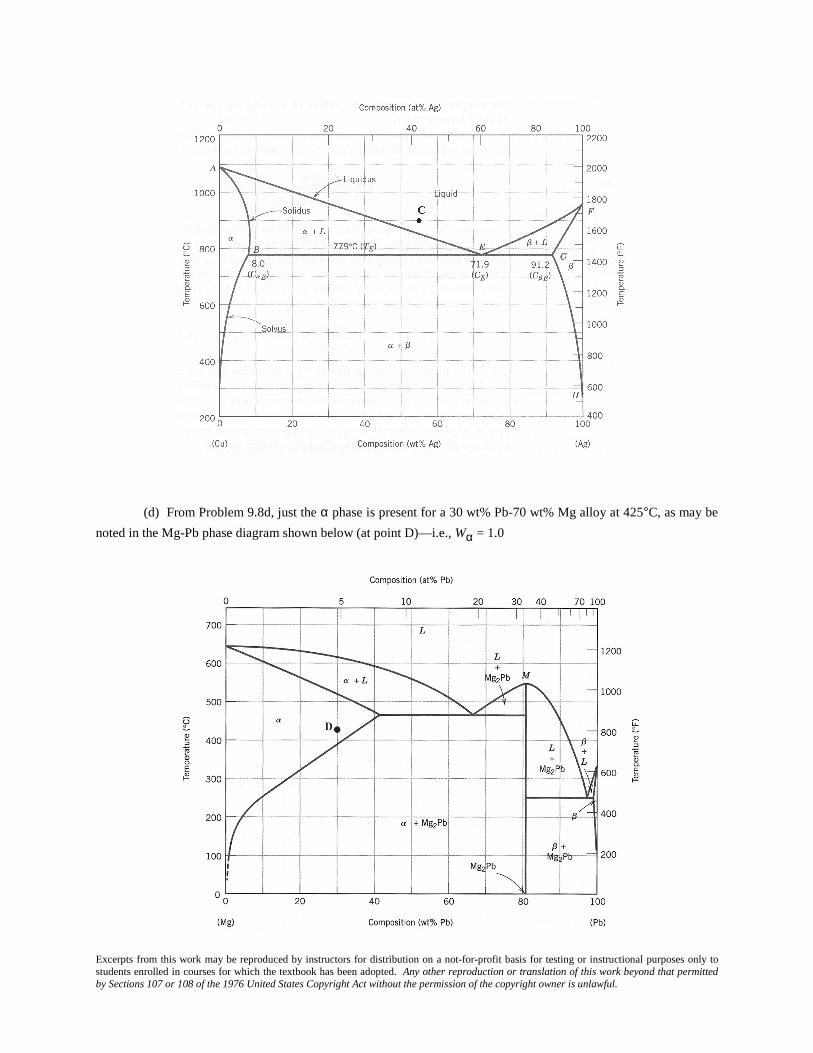
(c) From Problem 9.8c, just the liquid phase is present for a 55 wt% Ag-45 wt% Cu alloy at 900°C, as may
be noted in the Ag-Cu phase diagram shown below (at point C)—i.e., WL = 1.0
Excerpts from this work may be reproduced by instructors for distribution on a not-for-profit basis for testing or instructional purposes only to students enrolled in courses for which the textbook has been adopted. Any other reproduction or translation of this work beyond that permitted by Sections 107 or 108 of the 1976 United States Copyright Act without the permission of the copyright owner is unlawful.
(d) From Problem 9.8d, just the α phase is present for a 30 wt% Pb-70 wt% Mg alloy at 425°C, as may be
noted in the Mg-Pb phase diagram shown below (at point D)—i.e., Wα = 1.0
Excerpts from this work may be reproduced by instructors for distribution on a not-for-profit basis for testing or instructional purposes only to students enrolled in courses for which the textbook has been adopted. Any other reproduction or translation of this work beyond that permitted by Sections 107 or 108 of the 1976 United States Copyright Act without the permission of the copyright owner is unlawful.
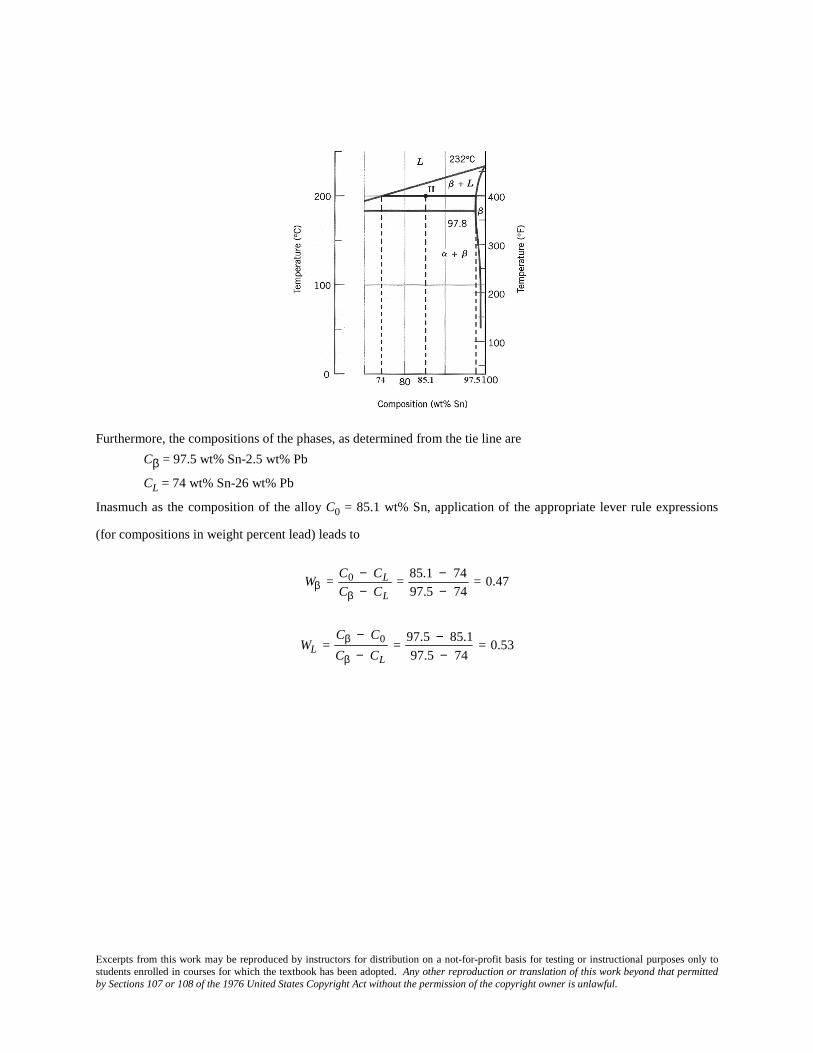
Furthermore, the compositions of the phases, as determined from the tie line are
Cβ = 97.5 wt% Sn-2.5 wt% Pb
CL = 74 wt% Sn-26 wt% Pb
Inasmuch as the composition of the alloy C0 = 85.1 wt% Sn, application of the appropriate lever rule expressions
(for compositions in weight percent lead) leads to
Wβ =
C0 − CL
Cβ − CL=
85.1 − 7497.5 − 74
= 0.47
WL =
Cβ − C0
Cβ − CL=
97.5 − 85.1
97.5 − 74= 0.53
Excerpts from this work may be reproduced by instructors for distribution on a not-for-profit basis for testing or instructional purposes only to students enrolled in courses for which the textbook has been adopted. Any other reproduction or translation of this work beyond that permitted by Sections 107 or 108 of the 1976 United States Copyright Act without the permission of the copyright owner is unlawful.
9.18 A 30 wt% Sn-70 wt% Pb alloy is heated to a temperature within the α + liquid phase region. If the
mass fraction of each phase is 0.5, estimate:
(a) The temperature of the alloy
(b) The compositions of the two phases
Solution
(a) We are given that the mass fractions of α and liquid phases are both 0.5 for a 30 wt% Sn-70 wt% Pb
alloy and asked to estimate the temperature of the alloy. Using the appropriate phase diagram, Figure 9.8, by trial
and error with a ruler, a tie line within the α + L phase region that is divided in half for an alloy of this composition
exists at about 230°C.
(b) We are now asked to determine the compositions of the two phases. This is accomplished by noting the
intersections of this tie line with both the solidus and liquidus lines. From these intersections, Cα = 15 wt% Sn, and
CL = 43 wt% Sn.
9.23 Derive Equations 9.6a and 9.7a, which may be used to convert mass fraction to volume fraction, and
vice versa.
Solution
This portion of the problem asks that we derive Equation 9.6a, which is used to convert from phase weight
fraction to phase volume fraction. Volume fraction of phase α, Vα, is defined by Equation 9.5 as
Vα =vα
vα + vβ (9.S1)
where vα and vβ are the volumes of the respective phases in the alloy. Furthermore, the density of each phase is
equal to the ratio of its mass and volume, or upon rearrangement
vα =
mαρα
(9.S2a)
vβ =mβρβ
(9.S2b)
Substitution of these expressions into Equation 9.S1 leads to
Excerpts from this work may be reproduced by instructors for distribution on a not-for-profit basis for testing or instructional purposes only to students enrolled in courses for which the textbook has been adopted. Any other reproduction or translation of this work beyond that permitted by Sections 107 or 108 of the 1976 United States Copyright Act without the permission of the copyright owner is unlawful.
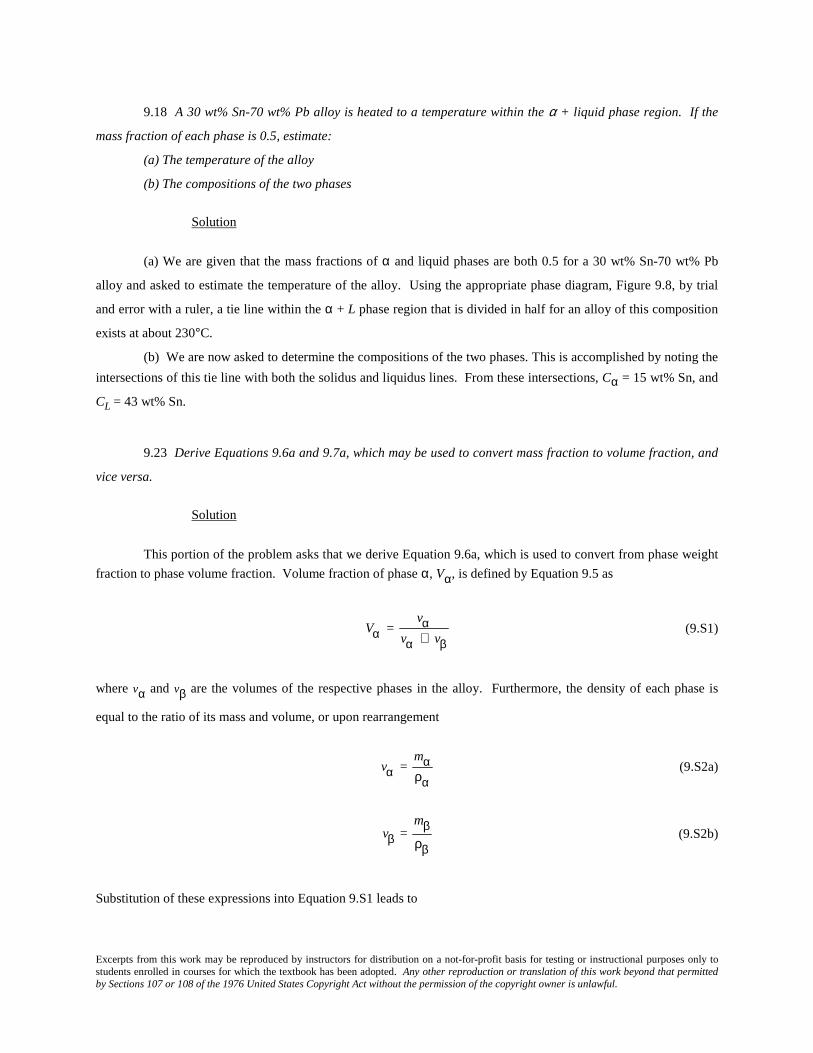
Vα =
mαρα
mαρα
+mβρβ
(9.S3)
in which m's and ρ's denote masses and densities, respectively. Now, the mass fractions of the α and β phases (i.e.,
Wα and Wβ) are defined in terms of the phase masses as
Wα =mα
mα + mβ (9.S4a)
Wβ =mβ
mα + mβ (9.S4b)
Which, upon rearrangement yield
mα = Wα (mα + mβ) (9.S5a)
mβ = Wβ (mα + mβ) (9.S5b)
Incorporation of these relationships into Equation 9.S3 leads to
Vα =
Wα (mα + mβ)ρα
Wα (mα + mβ)ρα
+Wβ (mα + mβ)
ρβ
Vα =
Wαρα
Wαρα
+Wβρβ
(9.S6)
which is the desired equation.
Development of Microstructure in Isomorphous Alloys

Excerpts from this work may be reproduced by instructors for distribution on a not-for-profit basis for testing or instructional purposes only to students enrolled in courses for which the textbook has been adopted. Any other reproduction or translation of this work beyond that permitted by Sections 107 or 108 of the 1976 United States Copyright Act without the permission of the copyright owner is unlawful.
9.25 (a) Briefly describe the phenomenon of coring and why it occurs.
(b) Cite one undesirable consequence of coring.
Solution
(a) Coring is the phenomenon whereby concentration gradients exist across grains in polycrystalline alloys,
with higher concentrations of the component having the lower melting temperature at the grain boundaries. It
occurs, during solidification, as a consequence of cooling rates that are too rapid to allow for the maintenance of the
equilibrium composition of the solid phase.
(b) One undesirable consequence of a cored structure is that, upon heating, the grain boundary regions will
melt first and at a temperature below the equilibrium phase boundary from the phase diagram; this melting results in
a loss in mechanical integrity of the alloy.
Development of Microstructure in Eutectic Alloys
9.28 Briefly explain why, upon solidification, an alloy of eutectic composition forms a microstructure
consisting of alternating layers of the two solid phases.
Solution
Upon solidification, an alloy of eutectic composition forms a microstructure consisting of alternating layers
of the two solid phases because during the solidification atomic diffusion must occur, and with this layered
configuration the diffusion path length for the atoms is a minimum.
Excerpts from this work may be reproduced by instructors for distribution on a not-for-profit basis for testing or instructional purposes only to students enrolled in courses for which the textbook has been adopted. Any other reproduction or translation of this work beyond that permitted by Sections 107 or 108 of the 1976 United States Copyright Act without the permission of the copyright owner is unlawful.
9.29 What is the difference between a phase and a microconstituent?
Solution
A “phase” is a homogeneous portion of the system having uniform physical and chemical characteristics,
whereas a “microconstituent” is an identifiable element of the microstructure (that may consist of more than one
phase).
Excerpts from this work may be reproduced by instructors for distribution on a not-for-profit basis for testing or instructional purposes only to students enrolled in courses for which the textbook has been adopted. Any other reproduction or translation of this work beyond that permitted by Sections 107 or 108 of the 1976 United States Copyright Act without the permission of the copyright owner is unlawful.
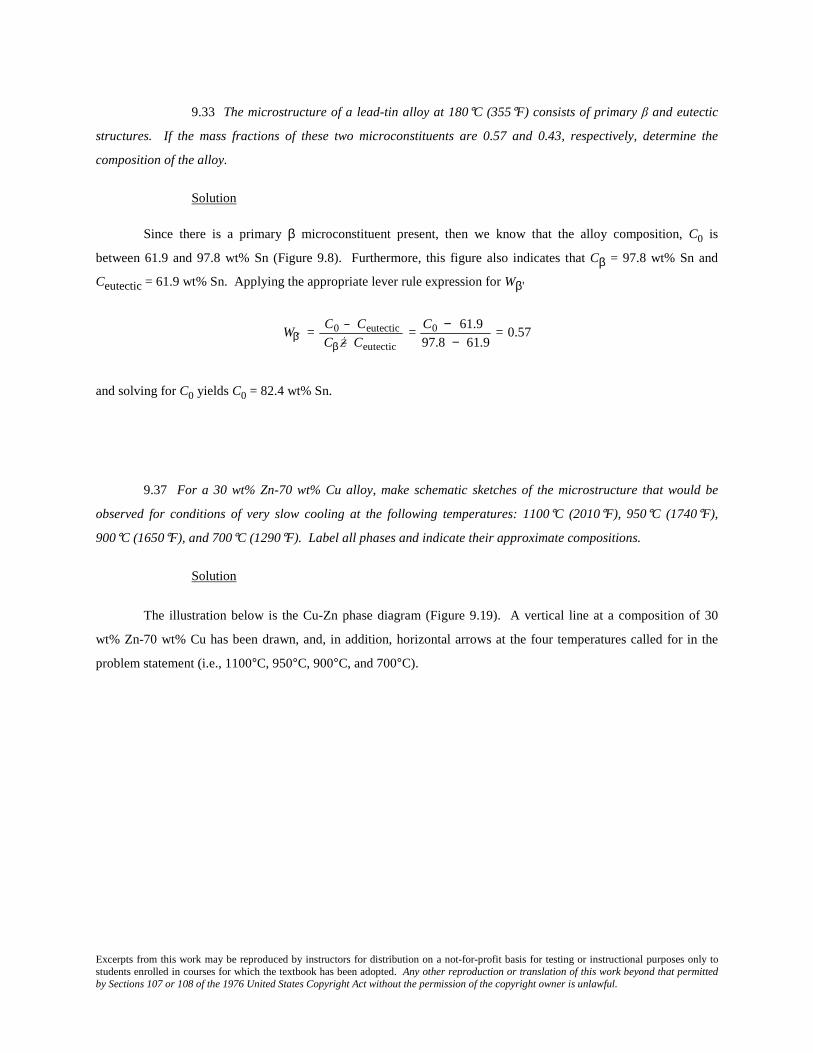
9.33 The microstructure of a lead-tin alloy at 180°C (355°F) consists of primary β and eutectic
structures. If the mass fractions of these two microconstituents are 0.57 and 0.43, respectively, determine the
composition of the alloy.
Solution
Since there is a primary β microconstituent present, then we know that the alloy composition, C0 is
between 61.9 and 97.8 wt% Sn (Figure 9.8). Furthermore, this figure also indicates that Cβ = 97.8 wt% Sn and
Ceutectic = 61.9 wt% Sn. Applying the appropriate lever rule expression for Wβ'
Wβ' =
C0 − Ceutectic
Cβ Ź− Ceutectic=
C0 − 61.997.8 − 61.9
= 0.57
and solving for C0 yields C0 = 82.4 wt% Sn.
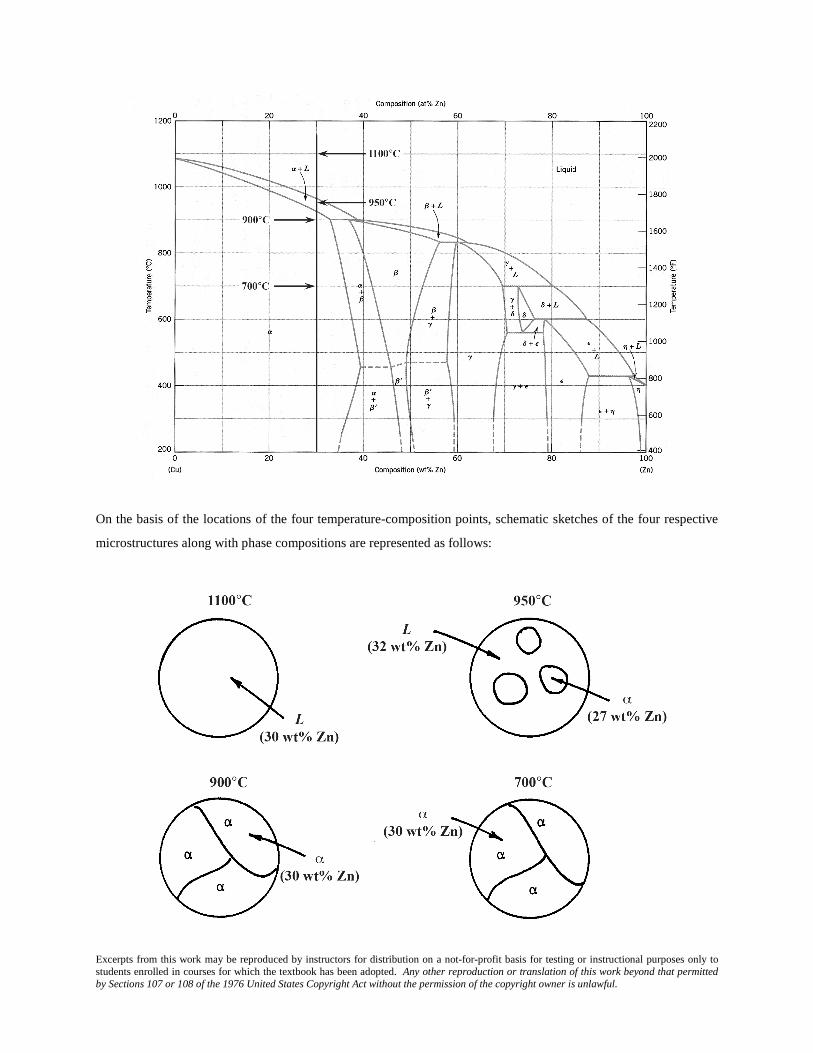
9.37 For a 30 wt% Zn-70 wt% Cu alloy, make schematic sketches of the microstructure that would be
observed for conditions of very slow cooling at the following temperatures: 1100°C (2010°F), 950°C (1740°F),
900°C (1650°F), and 700°C (1290°F). Label all phases and indicate their approximate compositions.
Solution
The illustration below is the Cu-Zn phase diagram (Figure 9.19). A vertical line at a composition of 30
wt% Zn-70 wt% Cu has been drawn, and, in addition, horizontal arrows at the four temperatures called for in the
problem statement (i.e., 1100°C, 950°C, 900°C, and 700°C).
Excerpts from this work may be reproduced by instructors for distribution on a not-for-profit basis for testing or instructional purposes only to students enrolled in courses for which the textbook has been adopted. Any other reproduction or translation of this work beyond that permitted by Sections 107 or 108 of the 1976 United States Copyright Act without the permission of the copyright owner is unlawful.
On the basis of the locations of the four temperature-composition points, schematic sketches of the four respective
microstructures along with phase compositions are represented as follows:
Excerpts from this work may be reproduced by instructors for distribution on a not-for-profit basis for testing or instructional purposes only to students enrolled in courses for which the textbook has been adopted. Any other reproduction or translation of this work beyond that permitted by Sections 107 or 108 of the 1976 United States Copyright Act without the permission of the copyright owner is unlawful.
Congruent Phase Transformations
Eutectoid and Peritectic Reactions
9.41 What is the principal difference between congruent and incongruent phase transformations?
Solution
The principal difference between congruent and incongruent phase transformations is that for congruent no
compositional changes occur with any of the phases that are involved in the transformation. For incongruent there
will be compositional alterations of the phases.
The Iron-Iron Carbide (Fe-Fe3C) Phase Diagram
Development of Microstructure in Iron-Carbon Alloys


![Hobas GRP pipe systems PN 1 - Amiblu · 2020. 6. 10. · Jacking Pipe PN 1 de [mm] SN SN SN SN SN SN SN SN SN SN SN SN Coupling Type 32000 40000 50000 64000 80000 100000 128000 160000](https://img.pdfslide.net/doc/110x75/61236c822e9bd427c4013216/hobas-grp-pipe-systems-pn-1-amiblu-2020-6-10-jacking-pipe-pn-1-de-mm-sn.jpg)