Embed Size (px)
Citation preview

421
Chapter 26
BIOINFORMATICS Overview and Research Opportunities
J. David Schaffer1, Nevenka Dimitrova1, Michael Zhang2 1Philips Research, Briarcliff Manor, NY, USA; 2Cold Spring Harbor Laboratory, Cold SpringHarbor, NY, USA
Abstract: We present a survey of bioinformatics, first focusing on preclinical research applications where much progress has been made in the last two decades or so. Then we examine clinical applications where there is much excitement about the potential, such as, clinical genotyping, early diagnosis, prognostic disease models, personalized medicine and wellness monitoring. The selection of topics largely reflects our optimism that this potential will begin to be realized in the near future.
Keywords: Sequence analysis, molecular medicine, systems biology, clinical genotyping, early diagnosis, prognostic disease models, personalized medicine, health wellness monitoring
1. INTRODUCTION
One of the key enabling technologies participating in the genomic medicine revolution has been bioinformatics, or the development of powerful algorithms enabling us to cope with the flood of new molecular information from living systems. It has been argued that the development of the fast sequence matching algorithm BLAST (Basic Local Alignment Search Tool) by Altschul et al.23 in 1990 was a principle contributor to the rapid advance in molecular biology. Today it is probably the single most used bioinformatic algorithm in the world. Yet, to date, the exciting impacts have been primarily on the basic science, i.e. preclinical. Still there is great optimism that clinical impacts of molecular medicine are to be expected soon, and bioinformatics advances will continue to play a pivotal role. The
© 2006 Springer. Printed in the Netherlands. S. Gerhard and W. Thomas (Eds.), Advances in Healthcare Technology, 421-438.

422 Chapter 26 spectrum of bioinformatics research and applications is extremely broad, so we decided to focus on a few topics with potential for clinical impact.
2. SELECTED PRECLINICAL BIOINFORMATICS TOPICS
2.1 Data collection and dissemination
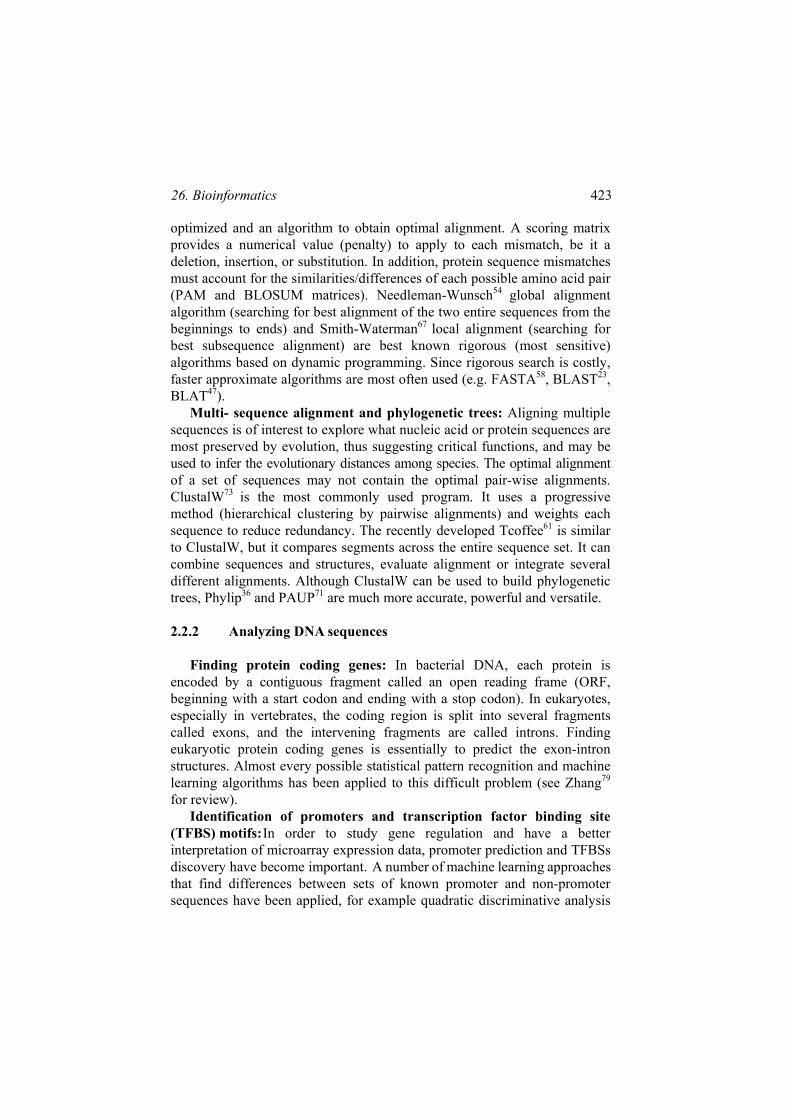
Bioinformatics is driven by the outpouring of massive genomics data. The best place to find updated online resources is the two special issues published annually by Nucleic Acid Research: the January issue is on databases and the July issue is on Web servers of online analysis tools. The Bioinformatics Links Directory1,38 is a good entry point with curated links to most such molecular resources, tools and databases. The exponential growth of the sequenced DNAs in the GenBank (Figure 26-1) NCBI2 repository nucleotide database is the best testimony of ongoing genomic revolution. Together with EBI3 and DDBJ4, they are the 3 major information databases in the world, they exchange their sequence data on a daily base to ensure that the basic sequence information stored in their ‘primary databases’ are equivalent. PDB5 is the biggest repository for 3D bio-macromolecule structure data.
In addition to basic sequence information there are web resources for the ever-changing gene nomenclature, HUGO Gene Symbol Database6, GO10 and GeneCards11, metabolic network information, KEGG7, and for promoters and transcription factors, EPD8 and TRANSFAC9 respectively.
2.2 Sequence analyses
There are many algorithms in sequence analyses. They may be grouped by DNA, RNA and protein or single, double, multiple sequence analyses. Here we only give some typical and yet important examples in each category.
2.2.1 Comparing sequences
Pairwise comparison and similarity searches: Starting with a mole-cular sequence, one of the first questions everyone would ask is ‘is it similar or related to a known sequence?’ The basic tool is similarity comparison / alignment; it has three components: a similarity (or distance) measure which gives a score to a pair of aligned sequences, an objective function to be
26. Bioinformatics 423 optimized and an algorithm to obtain optimal alignment. A scoring matrix provides a numerical value (penalty) to apply to each mismatch, be it a deletion, insertion, or substitution. In addition, protein sequence mismatches must account for the similarities/differences of each possible amino acid pair (PAM and BLOSUM matrices). Needleman-Wunsch54 global alignment algorithm (searching for best alignment of the two entire sequences from the beginnings to ends) and Smith-Waterman67 local alignment (searching for best subsequence alignment) are best known rigorous (most sensitive) algorithms based on dynamic programming. Since rigorous search is costly, faster approximate algorithms are most often used (e.g. FASTA58, BLAST23, BLAT47).
Multi- sequence alignment and phylogenetic trees: Aligning multiple sequences is of interest to explore what nucleic acid or protein sequences are most preserved by evolution, thus suggesting critical functions, and may be used to infer the evolutionary distances among species. The optimal alignment of a set of sequences may not contain the optimal pair-wise alignments. ClustalW73 is the most commonly used program. It uses a progressive method (hierarchical clustering by pairwise alignments) and weights each sequence to reduce redundancy. The recently developed Tcoffee61 is similar to ClustalW, but it compares segments across the entire sequence set. It can combine sequences and structures, evaluate alignment or integrate several different alignments. Although ClustalW can be used to build phylogenetic trees, Phylip36 and PAUP71 are much more accurate, powerful and versatile.
2.2.2 Analyzing DNA sequences
Finding protein coding genes: In bacterial DNA, each protein is encoded by a contiguous fragment called an open reading frame (ORF, beginning with a start codon and ending with a stop codon). In eukaryotes, especially in vertebrates, the coding region is split into several fragments called exons, and the intervening fragments are called introns. Finding eukaryotic protein coding genes is essentially to predict the exon-intron structures. Almost every possible statistical pattern recognition and machine learning algorithms has been applied to this difficult problem (see Zhang79 for review).
Identification of promoters and transcription factor binding site (TFBS) motifs: In order to study gene regulation and have a better interpretation of microarray expression data, promoter prediction and TFBSs
that find differences between sets of known promoter and non-promoter sequences have been applied, for example quadratic discriminative analysis
discovery have become important. A number of machine learning approaches
424 Chapter 26 (FirstEF31) artificial neural networks (DPF25, relevance vector machine) and Monte Carlo sampling (Eponine34). Because of a lack of protein coding signatures, current promoter predictions are much less reliable than protein coding region predictions, except for CpG island genes (see Bajic et al. 200426 for recent review).
Once regulatory regions, such as promoters, are obtained, finding TFBS motifs within these regions may proceed either by enumeration or by alignment to find the enriched motifs (see Tompa et al.74 for a recent assessment).
Figure 26-1. Growth of GenBank.
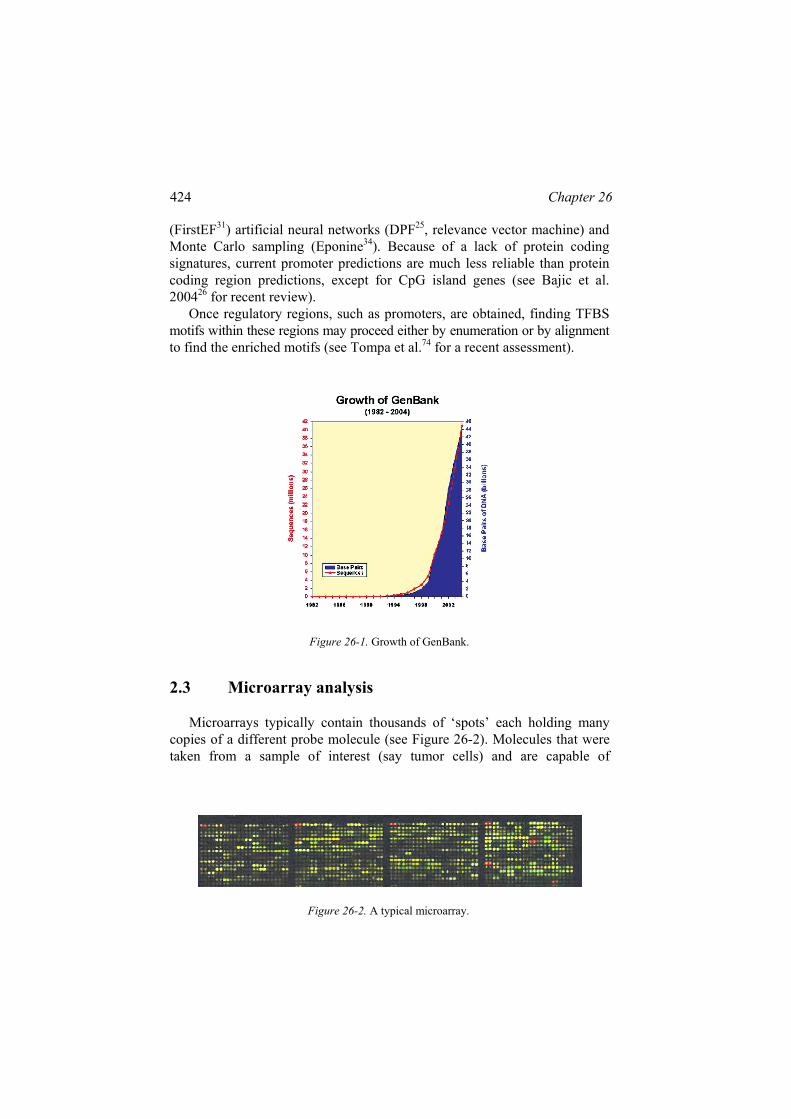
Figure 26-2. A typical microarray.
2.3 Microarray analysis
Microarrays typically contain thousands of ‘spots’ each holding many copies of a different probe molecule (see Figure 26-2). Molecules that were taken from a sample of interest (say tumor cells) and are capable of

26. Bioinformatics 425 hybridizing to the probe molecules (cDNA or RNA) are marked with a fluorescent marker and ‘washed over’ the microarray. Hence, their relative abundance in the sample can be inferred from the luminescence of the spot. Since abundance is relative, a control sample with a contrasting fluorophore is invariably used. By choosing the set of probes, one can assemble a microarray to measure a variety of genetic patterns. The uses of microarrays have expanded from gene-expression profiling (which genes are over/under-expressed in the sample relative to the control) and now include comparing whole genomes (e.g. normal vs. tumor), identifying alternate RNA transcripts, locating genes that have been methylated (turned off by having had methyl groups attached), detecting protein modifications and interactions, and many forms of genotyping. New types of microarrays are still appearing.
2.3.1 Expression microarray analysis
Expression microarrays are used to measure mRNA abundance for large number of genes. The low-level computational tasks27, such as experimental design and pre-processing (image analysis and normalization), are aimed to reduce uncontrollable sample variations, which may depend on specific types of microarrays. Many data analysis packages can be found from the open source Bioconductor software repository40.
Normalization: Normalization, critical step for data preprocessing, removes unwanted variances from data by exploiting and enforcing known or assumed invariance of the data49. Common approaches include: 1) rescaling by median of all or ‘housekeeping’ genes or by spike RNA controls, 2) explicit one parameter (log-) or two parameter (asinh-) transformation, 3) local regression smoothing (LOESS), and 4) quantile normalization.
Exploratory analysis: Since the number of genes (measurements) generally far exceeds the number of observations (cases), substantial variable reduction
(e.g. low-varying genes filtering) is usually done before any machine learning or statistical algorithms are applied. Exploratory analysis aims to find patterns in the data, common methods include Clustering (genes, cases, or both), Principle Component Analysis (PCA) and Multi-Dimensional Scaling (MDS). Bayesian Networks (BN) have also been used to describe interactions between genes39.
Identifying differentially expressed genes (DEGs): The most common task of microarray studies is to identify genes that are differentially regulated across different classes of samples; examples are: finding the genes affected by a treatment, or finding marker genes that discriminate cancer from normal tissues. Statistical tests include t-test and permutation test for two groups and
426 Chapter 26 ANOVA/F-test for multi-groups. To correct for multiple testing, often q-value70 for specifying the smallest False Positive Rate (FPR) is used instead of the conventional p-values. There are also several emerging nonparametric approaches, such as the Empirical Bayes (EB), the Significance Analysis of Microarray (SAM) method and the Mixture Model Method (MMM), seem even more powerful (see e.g. Pan57 for performance comparison). This is an active research area, a plethora of well-established and new methods are being applied, and a consensus best practice has yet to emerge.
2.3.2 Genomic microarray analysis
Most of the human genome does not express protein (≈98%), so the gene expression microarrays of the previous section, necessarily examine a small fraction of it; hence, the interest in approaches capable of providing a genome-wide view. The major application of genomic microarrays is for localization of DNA binding proteins or for detecting DNA copy number changes, although genomic tiling arrays have also been used to detect novel RNA transcripts28.
Identification of protein binding sites in chromatin DNA: ChIP-chip is the most popular method for localization of chromatin DNA binding proteins in vivo43,63. Combining microarray data (either expression or local-ization data) with promoter analysis for TFBS motif identification is becoming a powerful extension to methods described in section 2.1.2. If positive and negative gene sets extracted from microarray data are available, then motif-discovery turns into a classification problem: identify motifs that best discriminate the two gene sets. If continuous scores are available, then the problem turns into a regression problem: identify motifs that best correlate with these scores. Such analyses are very useful in Gene Regulatory Network (GRN) and Cis Regulatory Modules (CRM) studies68,44.
Identification of amplification and deletions in the human genome: One of the important applications of genomic arrays in cancer is to detect amplifications (potential oncogene loci) and deletions (potential tumor-suppressor gene loci). ArrayCGH62 (comparative genomic hybridization) and ROMA51 (representational oligonucleotide microarray analysis) are two emerging technologies capable of yielding a genome-wide picture of the number of copies of the DNA. The bioinformatics needs include schemes for reducing noise and ways to visualize the enormous amounts of information and focus in on what’s of biological significance.
Other types of arrays, such as Alternative Splicing arrays, Protein binding microarray, Protein microarray, Tussie/cell array and microRNA array, etc. are also used. The translation of microarray-based results to clinical applications challenges the technology at all levels. These include robust probe design,

26. Bioinformatics 427 uniform sample preparation and increased reproducibility of array measurements as well as advanced data analysis tools (see e.g. Segal et al.65
for new computational challenges). The recent advances in genomic sciences and array technologies are accelerating the translation of microarrays to clinical applications and will offer enormous potential for improved health care in cancer and a other human diseases.
2.4 Systems biology
Biologists have elucidated the complete gene sequences of several model organisms and provided general understanding of the molecular machinery involved in gene expression. The next logical step is to understand how all the components interact with each other in order to model complex biological systems. It is envisioned that only with this ‘systems view’ will we improve the accuracy of our diagnostic and therapeutic endeavors.
The field of systems biology emerged at the turn of this century and aims to merge our piecemeal knowledge into comprehensive models of the whole dynamic of these systems. The challenge is daunting; considering the potential of serum proteomics, Weston and Hood77 warn:
“In addition to the immense repertoire of proteins present, the dynamic range of these proteins is on the order of 109, with serum albumin being most abundant (30-50 mg/mL) and low-level proteins such as interleukin-6 present at 0-5 pg/mL)... Identifying proteins at each end of this spectrum in a single experiment is not feasible with current technologies.” “Further complicating the study of the human plasma proteome are temporal and spatial dynamics. The turnover of some proteins is several fold faster than others, and the protein content of the arteries may differ substantially from that of the veins, or the capillary proteome may be specific to its location, etc.” The goal of gene and protein networks research is to quantitatively
understand how different genes and their regulating proteins are grouped together in genetic circuits, and how stochastic fluctuations influence gene expression in these complex systems. For example, Thattai and van Oudenaarden72 focus on the importance of noise in the expression of genes by using both experimental and theoretical approaches. They investigated the bistability that arises from a positive feedback loop in the lactose utilization network of E. Coli. In its simplest form, the network may be modeled as a single positive feedback loop: Lactose uptake induces the synthesis of lactose permease, which in turn promotes the further uptake of lactose. Because of this bistability, the response of a single cell to an external inducer

428 Chapter 26 depends on whether the cell had been induced recently, a phenomenon known as hysteresis. The question is how the gene network architecture helps cells remember their history for more than 100 cell generations.
The field is still new, but the reader may find tutorials and pointers to emerging modeling efforts at the web sites of three major systems biology organizations: Europe12, USA13 and Japan14. In addition, several projects are now ongoing to build models of at least part of the living cell: The Silicon Cell15, The Virtual Cell16, and E-Cell17, and to provide open source tools for this effort18.
3. SELECTED CLINICAL BIOINFORMATICS TOPICS
3.1 Clinical genotyping
A dream of long-standing has been the possibility that predisposition to disease and therapy response may be predictable from a person’s genome. The well-known link between mutations in the BRCA1/2 genes and breast cancer predisposition48, and the more recent link between a mutation in the EGFR gene and response to the drug Iressa56 are just two examples of the results that have encouraged the enthusiasm. The approach proposed is the ‘association study
‘
in which the genomes are sequenced from a group of people known to be in a phenotypic group (e.g. prone to disease, responsive to therapy) and those not in this group. The strength of association between a proposed genetic pattern and the phenotypic trait is measured by a simple chi squared type statistic. Operational questions that need to be addressed to advance this paradigm include: how are gene sequences measured, how are candidate genetic patterns selected for testing, what statistical safeguards are needed to minimize false positives and negatives, and how to get the biological validation.
Sequencing an entire genome is both expensive66 and largely unnecessary. This is because 99.9% of the human genome is common to us all. Hence, interest has focused on Single Nucleotide Polymorphisms (SNPs), or differences of one nucleotide at one locus. Accumulating knowledge of SNPs in the human genome is available from the NCBI (dbSNP19) that currently contains over ten million reference SNPs, about half validated. The level of interest may also be gaged by observing that a recent study45 lists 30 companies with SNP-technology offerings. Hence, there appear to be too

26. Bioinformatics 429 many potential genetic variants to make genome-wide association studies practical. Schemes for reducing the numbers of candidates include focusing only on SNPs in protein coding regions and on ‘non-synonymous’ SNPs (i.e. SNPs that alter the amino acid). Such approaches depend on the common-variant/common-disease (CVCD) hypothesis. Additional help for this paradigm may come as knowledge of which non-synonymous SNPs are most likely to produce deleterious protein alterations and algorithms that exploit this knowledge are being developed. This is referred to as the ‘direct’ approach30 and is expected to yield results for single-gene disorders.
An ‘indirect’ approach involves defining haplotypes. These are sets of SNPs at different loci located in close proximity on the same chromosome; they tend to be inherited as a unit. That is, they exhibit ‘linkage disequilibrium’ (LD). Hence, the haplotype and not the individual SNPs is proposed as the effective unit of genotype characterization, greatly reducing the combinatorics. Identifying haplotypes poses experimental and bioin- formatic challenges. Some propose family studies, as a way to identify haplotypes related to diseases and their LD, wherein parents and offspring in families with disease prevalence are carefully studied. In contrast, population studies involve collecting genotypes from a suitable sample from, say different ethnic groups, and applying pattern discovery algorithms to locate suitable haplotypes. The HapMap project20 is an international collaborative project to collect data on about 270 individuals in five populations groups and information on about 600,000 SNPs and make it publicly available. Unsupervised learning algorithms for inferring haplotypes include: The Clark algorithm29 that begins with one or more homozygous individuals (or heterozygous at at most one locus – a problem for some datasets) and builds its initial haplotype set. It then adds the heterozygous individuals and extends the set as needed only to cover them (a parsimony criterion). Some genotypes may be left unassigned to haplotypes in some datasets. Expectation Minimization (EM) algorithms (e.g. Escoffier et al.35) make an initial guess at haplotype frequencies and iteratively converge (with reasonable probability) so all genotypes are assigned. EM algorithms can be computationally challenged by large datasets. Bayesian approaches have been reported to perform better than the previous two classes69, but all these approaches may fail to exploit some genetic alterations.
Two additional bioinformatics challenges involving haplotypes are the search for haplotype blocks (larger SNP regions that still may satisfy LD criteria80) and the location of minimal sets of SNPs that may serve to identify the different genotypes (called tagSNPs). Good haplotype blocks would further reduce the combinatorics of genotype candidates that need to be considered and tagSNPs would reduce the amount of DNA that is needed to

430 Chapter 26 genotype new individuals. For a discussion of algorithms for tagSNP identification and the issues related to them (see Crawford and Nickerson30).
Clearly, genotype-disease association discovery faces many challenges, substantial population samples and careful matching of controls may be needed as the haplotypes discovered in stratified samples often exhibit substantial differences – genotypes that are meaningful and practical will take work to identify. DNA sequencing measurements are still costly. There appears to be significant opportunities for improved algorithms; for example, complex diseases may resist current approaches calling for more sophisticated pattern discovery methods. Algorithms for the ‘static pattern discovery’ paradigm discussed in the following section probably apply; genetic algorithms have barely been applied in this domain so far24.
Figure 26-3. A SELDI (surface enhanced laser desorption ionization) chip being inserted into a mass spectrograph.
With the advent of new measurement devices for nucleic acids (e.g. microarrays) and proteins (e.g. mass spectroscopy Figure 26-3), many attempts are being made to discover new diagnostic tests capable of detecting disease much earlier than previously possible59,76. The usual protocol involves collecting an array of measurements on a number of patients known to be in one of two (or sometimes more) clinical conditions, say known to be positive or negative for cancer. The bioinformatics challenge is to discover the ‘fingerprint’ of the disease, the pattern of biomarkers that can be used for diagnosis. Let us call this the static pattern
3.2 Early diagnoses

26. Bioinformatics 431 recognition task because the data consist of a single snapshot taken at one instant of time. The methods for DEGs (see section 2.1.3) clearly apply here.
In spite of the promise, this paradigm is fraught with problems and critics have not been shy about pointing them out. Measurement repeatability, normalization of data, the curse of the small clinical samples (not containing enough of the population variability), too many measurements (overfitting risk), poor cross validation (overoptimistic predictions)53,32. We take the optimistic position that such difficulties are to be expected with a newly emerging technology and focus on some of the efforts aimed at overcoming each specific challenge.
Probably the most severe challenge is to increase the accuracy of the measurements themselves. While this effort is primarily concerned with the physics and biology of the devices, and recipes for sample preparation (e.g. Saul et al.64), there is also a role here for bioinformatics in data normalization. For cDNA microarrays, methods to deal with spatial biases have been recently proposed78. For mass spectroscopy, normalization usually at least includes total ion current normalization to correct for differences in overall spectrum intensity. More controversial is within-spectrum normalization60 wherein the selected measurements are linearly scaled to [0,1] in order to preserve only the relative protein abundances. Another issue with MS data is the choice to do peak identification (requiring specifying a noise cutoff) or binning (merging adjacent intensities to reflect machine precision).
A major bioinformatics issue in this emerging field is how to cope with these datasets that are measurement-rich, but case-poor. One traditional approach to this is to reduce the number of measurements (see section 2.1.3) either by filtering out those that fail to meet some specified criteria of ‘signal’ (e.g. using a signal to noise cutoff, and/or a cutoff of likelihood that the measurement means are different between the two groups), or by using principle components analysis (PCA). One difficulty with PCA is that results may be difficult to interpret biologically. An alternative approach is sometimes called a ‘wrapper’ approach in which the space of possible measurement subsets is searched using some form of gradient descent or evolutionary search algorithm, wherein the worth of any proposed subset is evaluated by inducing a classifier and testing its classification accuracy. A risk with the former is the possibility of missing patterns that include measurements that are not strongly discriminating by themselves. The risk with the wrapper approaches is the possibility of discovering patterns that overexploit chance variance in the small samples (overfitting). One method strongly recommended to avoid overfitting is cross-validation. Unfortunately, the scope for cross-validation is severely hampered by the small sample sizes. Michaels et al.53 have shown how sensitive are the discovered patterns
432 Chapter 26 to the specific set of learning cases used. Another issue involves whether or not to use correlated measurements in a classifier. Arguments based upon Vapnik’s approach to structured risk minimization75 dictate the use of the smallest measurement sets that do the job. Another informatics approach to this is an ‘ensemble’ approach33 wherein multiple classifiers are derived and the final decision comes from some form of voting scheme (e.g. weighted sum) among them. Another key decision required in a wrapper approach is the choice of classifier. The arguments from risk minimization for using the simplest effective classifier entail assumptions about the homogeneity of the disease classes that in some cases are clearly unsupportable.
In the end, what is an investigator to do? We conjecture that none of the early studies, that have done so much to show the potential and stir excitement, will be shown to have located the best diagnostics. We believe the way forward will be found by a community-wide effort that involves incremental improvements in the measurement devices, careful bioinformatics that lead to new hypotheses about disease mechanisms, and larger studies that include more of the inherent disease variability (and the natural inter-personal variance) and that exploit better screening to reduce the variability that can be controlled.
3.3 Prognostic disease models
The use of modeling in medicine has a long history. Prognostic models have been developed from early ‘illness scores’ initially devised by experts to try to predict disease outcomes. Later these models used regression methods that required increasing amounts of data. These models may be considered ‘static.’ Dynamic models have been used in epidemiology for a long time and in the modeling of physiological systems52 like the cardiovascular42. But there is a new opportunity just emerging in this era of molecular medicine: the building of systems biology models (see section 2.1.4) that capture the dynamics of disease at the molecular/cellular level and applying them to medical diagnosis and/or prognosis. In distinction from the ‘static pattern recognition’ problem mentioned above (see section 2.2.2), this approach is a ‘dynamic pattern recognition’ task. As such, it requires a series of vectors of measurements taken across the time course of disease.
Without loosing sight of the challenges already mentioned (see section 2.1.4), Weston and Hood77 also opine that networks have key nodal points where therapy/intervention can effectively be focused. While there are not concrete clinical applications yet, the promise is clear.
26. Bioinformatics 433 3.4 Personalized medicine
The aim of personalized medicine is to find the right therapy for individual patients based on their genotype, environment and lifestyle. A tantalizing example is the Iressa story56. It works miraculously for about 10% of the patients with advanced non-small cell lung cancer, those with a mutation of the epidermal growth factor receptor EGFR gene. This dream obviously depends on the maturation of much that has been covered above. In a broad sense, it includes development of genomics-based personalized medicines, predisposition testing (see section 2.2.1), preventive medicine, combination of diagnostics (see section 2.2.2) with therapeutics, and monitoring of therapy. But an additional bioinformatics challenge, not mentioned above will be Clinical Decision Support Systems (CDSS) able to distill the voluminous and complex data into actionable clinical recommendations, whether it is preventive, diagnostic, or therapeutic41. CDSS involves linking two types of information: patient-specific and knowledge-based37. Personal information related to the patient history is documented in patient records. Some personal medical documents, which are already in use to various extents in different countries, include the personal emergency card, the mother-child record, and the vaccination certificate. A promising source of personal medical information is the data stored in the electronic patient record combined with the genomic information from genotyping and from particular molecular diagnostic tests. Molecular imaging enables visualization of cellular and molecular processes that may be used to infer information about the genomic and proteomic profiles. As a result, the bioinformatic analysis of genomic and proteomic profiles may be valuable to assist the interpretation of images using molecular probes. Molecular diagnostics and molecular imaging can provide the two aspects of the disease: molecular diagnostics can provide the information of the exact mutation of a particular gene and classify the exact type of cancer, while molecular imaging can target the very same type of cells with that particular mutation in order to provide diagnostic information and disease staging.
3.5 Health and wellness monitoring
Current methods in bioinformatics have been used for immediate impact in diseases that are at the top of the killer list: heart disease and cancer. However, these technologies may also enable non-invasive and inexpensive first indicators that a regular person is becoming a patient. Nutritional genomics studies the genome-wide influences of nutrition, with a far-reaching potential in the prevention of nutrition-related disease. Nutrition is not like pharmacology or toxicology, where the drug acts upon a single
434 Chapter 26 receptor/target and dose related pathological effects are induced with related strong effects on transcriptomic changes. Our daily food consumption consists of complex mixtures of many possibly bioactive chemical compounds, chronically administered in varying composition, and with a multitude of biological reactions based on our genotype.
The role of bioinformatics in nutrigenomics is multifold: to create nutrigenomic databases, to setup special ontologies in using available resources, setup and track laboratory samples being tested and their results, pattern recognition, classification, and data mining, and simulation of complex interactions between genomes, nutrition, and health disparities21.
A key objective is the development of tools to identify selective and sensitive multi-parameter (pathway supported) biomarkers of prevention (transcriptomic and metabolic profiles or fingerprints) based on the perturbation of homeostasis22.
Nutrigenomics research will have a profound impact on our understanding of the relationship between the genotype and the environment. The nutritional supplement and functional food industries will continue robust growth in response to advances in nutritional genomics research and its applications 46,55.
4. CONCLUSIONS
Today we are in the midst of the genomic medicine revolution. This revolution has been sparked by a plethora of new technologies for measuring, analyzing, understanding and manipulating events at the level of biomolecules both in vitro and in vivo. In this chapter we highlighted bioinformatics methods that are at the heart of genomic medicine.
Among the envisioned benefits of this new era are personalized medicine that enables tailoring of therapy to the patient’s own unique disease taking genomic information into account. This starts with a scenario where genotyping is available at birth; the phenotype is matched with the genotype in order to propose best diet and lifestyle for optimum health. In addition, personalized medicine will introduce new diagnostics capable of detecting disease as soon as the molecular events begin and long before symptoms are manifest, and therapies capable of correcting the basic biological malfunctions that are the disease by for instance replacing mutated genes or inserting palliative molecules that can compensate for disrupted cell signaling pathways.

26. Bioinformatics 435 REFERENCES
1. http://bioinformatics.ubc.ca/resources/links_directory/. 2. http://www.ncbi.nlm.nih.gov/. 3. http://www.ebi.ac.uk/. 4. http://www.ddbj.nig.ac.jp/. 5. http://www.rcsb.org/pdb/. 6. http://www.gene.ucl.ac.uk/nomenclature/. 7. http://www.genome.ad.jp/kegg/. 8. http://www.epd.isb-sib.ch/. 9. http://www.gene-regulation.de/. 10. http://www.geneontology.org/. 11. http://bioinfo1.weizmann.ac.il/genecards/index.shtml. 12. http://www.systembiology.net/. 13. http://www.systemsbiology.org/. 14. http://www.systems-biology.org/. 15. http://www.siliconcell.net/. 16. http://www.nrcam.uchc.edu/. 17. http://www.e-cell.org/. 18. https://biospice.org/index.php. 19. http://www.ncbi.nlm.nih.gov/SNP/. 20. http://www.hapmap.org/. 21. http://nutrigenomics.ucdavis.edu/bioinformatics.htm. 22. http://www.nugo.org/wp7. 23. S.F. Altschul, W. Gish, W. Miller, E.W. Myers, D.J. Lipman, Basic local alignment
search tool, J Mol Biol 215(3), 403-10 (1990). 24. O. Braaten, O.K. Rodningen, I. Nordal, T.P. Leren, The genetic algorithm applied to
haplotype data at the LDL receptor locus, Comput Methods Programs Biomed 6(1), 1-9 (2000).
25. V.B. Bajic, S.H. Seah, A. Chong, G. Zhang, J.L. Koh, V. Brusic, Dragon Promoter Finder: recognition of vertebrate RNA polymerase II promoters, Bioinformatics 18(1), 198-199 (2002).
26. V.B. Bajic, S.L. Tan, Y. Suzuki, S. Sugano, Promoter prediction analysis on the whole human genome. Nat Biotechnol 22(11), 1467-1473 (2004).
27. B.M. Bolstad, F. Collin, K.M. Simpson, R.A. Irizarry, T.P. Speed, Experimental design and low-level analysis of microarray data, Int Rev Neurobiol 60, 25-58 (2004).
28. J. Cheng, P. Kapranov, J. Drenkow, S. Dike, S. Brubaker, S. Patel, J. Long, D. Stern, H. Tammana, G. Helt, V. Sementchenko, A. Piccolboni, S. Bekiranov, D.K. Bailey, M. Ganesh, S. Ghosh, I. Bell, D.S. Gerhard, T.R. Gingeras, Transcriptional maps of 10 human chromosomes at 5-nucleotide resolution, Science 308(5725), 1149-1154 (2005).
29. A.G. Clark, Inference of haplotypes from PCR-amplified samples of diploid populations, Molecular Biology Evol 7, 111-122 (1990).
30. D.C. Crawford, D.A. Nickerson, Definition and Clinical Importance of Haplotypes, Annual Rviews in Medicine 56, 303-320 (2005).
31. R.V. Davuluri, MQ Zhang, Computational identification of promoters and first exons in the human genome, Nat Genet 29(4), 412-417 (2001).
32. E. Diamandis, Proteomic patterns in biological fluids: do they represent the future of cancer diagnostics? Clin Chem 49, 1272-1275 (2003).
33. T.G. Dietterich, Ensemble Methods in machine learning, Lecture Notes in Computer Science 1857, 1-15 (Springer, New York, 2000).
436 Chapter 26 34. T.A. Down, T.J. Hubbard, Computational detection and location of transcription start
sites in mammalian genomic DNA, Genome Res 12(3), 458-461 (2002). 35. L. Excoffier, G. Laval, D. Balding, Gametic phase estimation over large genomicregions
using an adaptive window approach, Human Genomics 1, 7-19 (2003). 36. J. Felsenstein, Evolutionary trees from DNA sequences: a maximum likelihood approach,
J Mol Evol 17(6), 368-376 (1981). 37. W. Fierz, Challenge of personalized health care: to what extent is medicine already
individualized and what are the future trends? Med Sci Monit 10(5), RA111-1123 (2004). 38. J.A. Fox, S.L. Butland, S. McMillan, G. Campbell, B.F. Ouellette, The Bioinformatics
Links Directory: a compilation of molecular biology web servers, Nucleic Acids Res 1(33)(Web Server issue), W3-24 (2005).
39. N. Friedman, M. Linial, I. Nachman, D. Pe er, Using Bayesian networks to analyze expression data, J Comput Biol 7(3-4), 601-620 (2000).
40. R.C. Gentleman, V.J. Carey, D.M. Bates, B. Bolstad, M. Dettling, S. Dudoit, B. Ellis, L. Gautier, Y. Ge, J. Gentry, K. Hornik, T. Hothorn, W. Huber, S. Iacus, R. Irizarry, F. Leisch, C. Li, M. Maechler, A.J. Rossini, G. Sawitzki, C. Smith, G. Smyth, L. Tierney, J.Y. Yang, J. Zhang, Bioconductor: open software development for computational biology and bioinformatics, Genome Biol 5(10), R80 (2004).
41. A.G. Guttmacher, F.S. Collins, Genomic Medicine – A Primer, New England Journal of Medicine 19, 1512-1520 (2002).
Thesis, MIT (2004). 43. C.E. Horak, M. Snyder, ChIP-chip: a genomic approach for identifying transcription
factor binding sites, Methods Enzymol 350, 469-483 (2002).
Acad Sci USA 102(14), 4954-4959 (2005). 45. K.K. Jain, Personalized Medicine: Scientific & Commercial Aspects (Jain Pharma
Biotech, Basel, 2005). 46. Nutritional Genomics: Discovering the Path to Personalized Nutrition, edited by J.
Kaput, R.L. Rodriguez, ISBN: 0-471-68319-1 (Wiley, 2000). 47. W.J. Kent, BLAT–the BLAST-like alignment tool, Genome Res 12(4), 656-664 (2002). 48. M.C. King, J.H. Marks, J.B. Mandell, Breast and ovarian cancer risks due to inherited
mutations in BRCA1 and BRCA2, Science 302(5645), 643-646 (2003). 49. D.P. Kreil, R.R. Russell, There is no silver bullet–a guide to low-level data transforms
and normalisation methods for microarray data, Brief Bioinform 6(1), 86-97 (2005). 50. C.E. Lawrence, S.F. Altschul, M.S. Boguski, J.S. Liu, A.F. Neuwald, J.C. Wootton.,
Detecting subtle sequence signals: a Gibbs sampling strategy for multiple alignment. Science 262(5131), 208-214 (1993).
51. R. Lucito, J. Healy, J. Alexander, A. Reiner, D. Esposito, M. Chi, L. Rodgers, A. Brady, J. Sebat, J. Troge, J.A. West, S. Rostan, K.C. Nguyen, S. Powers, K.Q. Ye, A. Olshen, E. Venkatraman, L. Norton, M. Wigler, Representational oligonucleotide microarray analysis: a high-resolution method to detect genome copy number variation, Genome Res 13(10), 2291-2305 (2003).
52. V.Z. Marmarelis, Nonlinear Dynamic Modeling of Physiological Systems (Wiley IEEE Press Series, 2004).
53. S. Michiels, S. Koscielny, C. Hill, Prediction of cancer outcome with microarrays: a multiple random validation strategy, The Lancet 365, 488-492 (2005).
54. S.B. Needleman, C.D. Wunsch, A general method applicable to the search for similarities in the amino acid sequence of two proteins, J Mol Biol 48(3), 443-453 (1970).
,
42. T. Heldt, Computational Models of Cardiovascular response to Orthostatic Stress, PhD.
44. S. Istrail, E.H. Davidson, Logic functions of the genomic cis-regulatory code, Proc Natl

26. Bioinformatics 437 55. J.M. Ordovas, L. Parnell, Nutrigenetics and Nutrigenomics, ISBN: 0-471-68421-X
(Josey Bass Publishers, 2005). 56. J.G. Paez, P.A. Janne, J.C. Lee, S. Tracy, H. Greulich, S. Gabriel, P. Herman, F.J. Kaye,
N. Lindeman, T.J. Boggon, K. Naoki, H. Sasaki, Y. Fujii, M.J. Eck, W.R. Sellers, B.E. Johnson, M. Meyerson, EGFR Mutations in Lung Cancer: Correlation with Clinical Response to Gefitinib Therapy, Science 304(5676), 1497-1500 (2004).
57. W. Pan, On the use of permutation in and the performance of a class of nonparametric methods to detect differential gene expression, Bioinformatics 19(11), 1333-1340 (2003).
58. W.R. Pearson, D.J. Lipman, Improved tools for biological sequence comparison, Proc Natl Acad Sci USA 85(8), 2444-2448 (1988).
59. E.F. Petricoin, A.M. Ardekani, B.A. Hitt, P.J. Levine, V.A. Fusaro, S.M. Steinberg, G.B. Mills, C. Simone, D.A. Fishman, E.C. Kohn, L.A. Liotta, Use of proteomic patterns in serum to identify ovarian cancer, The Lancet 359, 572-577 (2002).
60. E.F. Petricoin, L. Liotta, SELDI-TOF-based serum proteomic pattern diagnostics for early detection of cancer, Current Opinion in Biotechnology 15, 24-30 (2004).
61. O. Poirot, E. O’Toole, C. Notredame, Tcoffee@igs: A web server for computing, evaluating and combining multiple sequence alignments, Nucleic Acids Res 31(13), 3503-3506 (2003).
62. D. Pinkel, R. Segraves, D. Sudar, S. Clark, I. Poole, D. Kowbel, C. Collins, W.L. Kuo, C. Chen, Y. Zhai, S.H. Dairkee, B.M. Ljung, J.W. Gray, D.G. Albertson, High resolution analysis of DNA copy number variation using comparative genomic hybridization to microarrays, Nat Genet 20(2), 207-211 (1998).
63. B. Ren, B.D. Dynlacht, Use of chromatin immunoprecipitation assays in genome-wide location analysis of mammalian transcription factors, Methods Enzymol 376, 304-315 (2004).
64. R. Saul, P. Russo, S. Seminara, N. Shea, L. Harvey, G. Whiteley, Development of an Automated, Mass Spec-based Clinical Diagnostic System for the Detection of Ovarian Cancer, ALAM, San Jose (2005).
65. E. Segal, N. Friedman, N. Kaminski, A. Regev, D. Koller, From signatures to models: understanding cancer using microarrays, Nat Genet 37(Suppl.), S38-S45 (June 2005).
66. J. Shendure, R.D. Mitra, C. Varma, G.M. Church, Advanced Sequencing Technologies: Methods and Goals, Nature Genetics 5, 335-344 (2004).
67. T.F. Smith, M.S. Waterman, Identification of common molecular subsequences, J Mol Biol 147(1), 195-197 (1981).
68. B. van Steensel, Mapping of genetic and epigenetic regulatory networks using microarrays, Nat Genet 37(Suppl.), S18-S24 (2005).
69. M. Stephens, N.J. Smith, P. Donnelly, A new statistical method for haplotype reconstruction from population data, Am J Human Genetics 68, 978–989 (2001).
70. J.D. Storey, R. Tibshirani, Statistical significance for genomewide studies, Proc Natl Acad Sci USA 100(16), 9440-9445 (2003).
71. D.L. Swofford, PAUP*. Phylogenetic Analysis Using Parsimony (*and Other Methods) (Sinauer Associates, Sunderland, MA, Version 4.0b10a, 1998).
72. M. Thattai, A. van Oudenaarden, Attenuation of noise in ultrasensitive signaling cascades, Biophysical Journal 82, 2943 (2002).
73. J.D. Thompson, D.G. Higgins, T.J. Gibson, CLUSTAL W: improving the sensitivity of progressive multiple sequence alignment through sequence weighting, position-specific gap penalties and weight matrix choice, Nucleic Acids Res 22(22), 4673-4680 (1994).
74. M. Tompa, N. Li, T.L. Bailey, G.M. Church, B. De Moor, E. Eskin, A.V. Favorov, M.C. Frith, Y. Fu, W.J. Kent, V.J. Makeev, A.A. Mironov, W.S. Noble, G. Pavesi, G. Pesole, M. Regnier, N. Simonis, S. Sinha, G. Thijs, J. van Helden, M. Vandenbogaert, Z. Weng,

438 Chapter 26
C. Workman, C. Ye, Z. Zhu, Assessing computational tools for the discovery of transcription factor binding sites, Nat Biotechnol 23(1), 137-144 (2005).
75. V.N. Vapnik, The nature of statistical learning theory (Springer, New York, 1995).
outcome of breast cancer, Nature 415, 530-536 (2002). 77. A.D. Weston, L. Hood, Systems biology, proteomics, and the future of health care:
toward predictive, preventative, and personalized medicine, J Proteome Res 3(2), 179-196 (2004).
78. Y.H. Yang, S. Dudoit, P. Luu, D.M. Lin, V. Peng, J. Ngai, T.P. Speed, Normalization for cDNA microarray data: A robust composite method addressing single and multiple slide systematic variation, Nucleic Acid Research 30(4), e15 (2002).
79. M.Q. Zhang, Computational prediction of eukaryotic protein-coding genes, Nat Rev Genet 3(9), 698-709 (2002).
80. X. Zhu, S. Zhang, D. Kan, R. Cooper, Haplotype Block definition and its application, Pacific Symposium on Biocomputing 9, 152-163 (2004).
.
76. L.J. van’t Veer, H. Dai, M.J. van de Vijver, Y.D. He, A.A.M. Hart, M. Mao, H.L. C.
Peterse, K. van der Kooy, M.J. Marton, A.T. Witteveen, G.J. Schreiber, R.M. Kerkhoven, Roberts, P S. Linsley, R. Bernards, S.H Friend, Gene expression profiling predicts clinical