Embed Size (px)
Citation preview

Chapter 1 | Bread for the World Institute12
iStock photo
Chapter 1 | Bread for the World Institute12

CHAPTER 1
Main MessagesHunger and poverty rates around the world have fallen significantly in
recent decades, a result of intensive effort and effective policies in many developing countries, focused development assistance that complements these efforts, expanded international trade and globalization, political sta-bility and democratization, and the diffusion of technology. Ending global hunger and extreme poverty is now within reach.
In the United States, progress against hunger and poverty has been hobbled by stagnant wages and vanishing middle-income jobs. Govern-ment programs have been indispensable in preventing hunger and poverty rates from rising further.
The United States has benefited overall from globalization, but dis-placed workers and their communities have paid a high price. Govern-ment policies have done too little to help them adjust to changes in the U.S. economy.
The Sustainable Development Goals (SDGs), adopted by the United States in 2015, are a framework for working together to reach interrelated, universal human goals, including ending global hunger and malnutrition, by 2030.
www.bread.org/institute | 2018 Hunger Report 13
You Can’t Feed a Family on These Wages
www.bread.org/institute | 2018 Hunger Report 13

Mounting ChallengesThe world has dramatically reduced hunger and
poverty in recent decades. Fifty years ago, one in three people faced chronic hunger. By 2017, the rate had been reduced to one in nine.1 The primary reason for this progress has been steady economic growth in devel-oping countries, resulting mainly from expanded inter-national trade and government and donor investments in health, education, agriculture, and infrastructure.
The United States has also reduced hunger and pov-erty in the last 50 years, but unlike the progress in devel-oping countries, this is due mainly to the expansion of government programs that help low-income families. While the incomes of the country’s wealthiest families have soared in recent decades, the earned incomes of nearly everyone else have stagnated or declined.
We frequently hear elected officials say, “The best anti-poverty program is a job.” A job can serve as the best anti-poverty program, but to do so, it must pay enough to cover essential living costs. Earned income is a more empowering and sustainable way to reduce hunger than help from government programs. Ending hunger for good in the United States requires improved earnings for those who work in low-wage jobs.
Low-wage jobs do not ensure that workers and their families are not living with hunger. In 2015, 44 percent of people who received SNAP benefits—the Supple-mental Nutrition Assistance Program, formerly known as food stamps—were in a household where at least one person was working.2
Despite their critical role in reducing hunger and other hardships, federal anti-poverty programs are constantly under political attack. One possible reason for this is misperceptions about participants (for example, many more are children or elders than policymakers or the public may realize) or about ben-efits (for example, members of Congress who live for a week spending only the average SNAP benefit on food have reported being unable to afford a balanced diet). Another reason is resentment, especially among those who are strapped economically but don’t qualify for assistance. Improved job opportunities for all will help strengthen support for anti-poverty programs as well as the U.S. economy as a whole.
The focus of this report is on families who struggle with hunger. In 2016, about 41 million Americans were food insecure—that is, they did not always have enough money for food.3 A much larger group of people struggle financially and may soon face hunger if someone in the family gets sick or loses their job. Families regularly move in and out of hunger and pov-erty—for example, one month a parent will get overtime hours and the family will be lifted above the poverty line, and the next month her hours will be cut and they will be in poverty again.
It is particularly important for children to be food secure since even brief periods of hunger can cause serious health problems and interfere with their devel-opment and educational progress. Food insecurity has long-term consequences for children’s health and their future earnings. Poor nutrition before age 2 is the most dangerous because the damage is largely irreversible.
This chapter discusses the causes of wage stagnation. Most importantly, elected officials have chosen not to take action on various policies that would improve job opportunities. The chapter concludes with a sec-tion on the jobs challenge in developing countries. We see economic progress in this country and worldwide as mutually reinforcing and agree that U.S. aid and leadership is important to the hopes of many hungry and poor people around the world—also, that the U.S. government should do more to assist workers and com-munities who are adversely affected by trade.
Wage StagnationFor most workers, the economy short-circuited
decades ago. From the end of World War II through the early 1970s, the gains from economy-wide productivity growth were largely shared by all wage earners. Produc-tivity means simply how much workers are producing per hour of work. Increases in productivity create eco-nomic growth, and therefore raising productivity is key to improving living standards.
Since the early 1970s, wage growth has become dis-connected from productivity growth and the gains from productivity growth began to be funneled almost exclu-sively to the highest earners. Between 1979 and 2013, productivity grew eight times faster than the pay of a median earner4 (median earnings are a dividing line,
Chapter 1 | Bread for the World Institute14

CHAPTER 1
with half of all workers earning more than the median and half earning less). For a median-earning household, by 2013 their income would have been $30,000 higher if wage growth were still linked to productivity growth.5
This is a long-term national trend. Figure 1.1 com-pares the period 1946 to 1980, when productivity gains were largely shared among all paid workers, with the period 1980 to 2014, when they were not. The left side of the graph shows how fast incomes were growing on average. The bottom of the graph, from left to right, ranges from the lowest earners to the highest earners.
The line marked 1946 to 1980 slopes downward. The incomes of the lowest earners grew an average of more
than 3 percent annually, while the highest earners’ incomes increased just over 1 percent annually. During this period, income inequality was decreasing. Hunger and poverty also declined during this period.
The line showing 1980 to 2014 slopes upward, indi-cating that income inequality has been increasing. The incomes of the highest earners have been growing much faster, on average, than those of the lowest. Most startling of all is the extremely rapid growth in income for those on the right edge of the graph, starting with the top 1 percent and especially above the top 0.1 percent.6 The income of those in the very top .001 per-cent—whose average income in 2014 was $88.7 million—
Figure 1.1 Inequality in One Chart: Who Benefits from Economic Growth? 1946-1980 vs. 1980-2014
1946-1980
Inequality in One ChartWho Benefits from Economic Growth?
1946-1980 vs. 1980-2014
Top 0.001%
INCOME PERCENTILE
5 100
(lowest income) (highest income)
Economic Growth
1980-2014Economic Growth
2014 Average income: $88.7 million
Top 1.0%2014 Average income: $1 million
Top 0.1%2014 Average income: $4.4 million
Top 0.01%2014 Average income: $20.3 million
10 15 20 25 30 35 40 45 50 55 60 65 70 75 80 85 9590
2014 Average income: $24,900 2014 Average income: $67,900
2014Averageincome:
$253,000
Rea
l ave
rag
e an
nual
gro
wth
Source: Adapted from Thomas Piketty, Emmanuel Saez, and Gabriel Zucman (July 6, 2017), Distributional National Accounts: Methods and Estimates for the United States. See Figure S.40 and Table S.7.
www.bread.org/institute | 2018 Hunger Report 15

has been rising at an average rate of more than 6 percent a year for 35 years. Meanwhile, the incomes of almost everyone else increased at an average of less than 2 percent over the same 35 years.
The graph uses “post-tax” income, so it includes any income from federal programs for low-income households, such as SNAP and the Earned Income Tax Credit (EITC). These additions to the incomes of low-income families are not enough to make up for the staggering rise in income inequality—but it is worth noting that cutting safety net programs has caused declining total income for low-income people.
Many people have noticed that their wages aren’t keeping up with living costs, although few identify the divergence of wage growth from productivity growth as the cause. People are also very much aware that the minimum wage is not enough to make ends meet, even if they don’t know that it used to be both closer to a living wage and closer to the median wage. The federal minimum wage is currently $7.25 an hour. If wage growth had continued to be linked to productivity growth, the minimum wage would instead be more than $19 an hour.7
Wage stagnation is often attributed to a skills deficit—workers are earning less because they lack the skills necessary to keep up with technological changes in the workplace. According to this narrative, workers in low-wage jobs, as a group, have fewer years of educa-tion than middle- and upper-income workers, so they are paid less. The fatal flaw in this argument is that most workers, regardless of their education, have faced years of wage stagnation. As we saw in figure 1.1, wage stag-nation began around 1980. For most workers, the real value of their wages, when adjusted for inflation, has been stagnant for decades.
Although workers with only a high school educa-tion were the first to be affected by wage stagnation, it soon began to affect those with bachelor’s degrees and higher as well. Education is a vital ingredient for advancement, particularly for children born to poor families, but more education by itself will not solve the
problem of wage stagnation. The fact is that today’s low-wage workers are much better educated than those of a generation ago. In 1979, only 56.7 percent had a high school degree; by 2014, 77.5 percent had completed high school. In 1979, only 24.6 percent had some college or a college degree; by 2014, 45 percent had some college.8 The share of the workforce with community college
degrees has increased, but in 2014, community college graduates earned 7.5 percent less in real dollars than they had in 2004.9
While there is no single explanation for wage stag-nation, government policies that enabled and continue to enable greater concentrations of income and wealth have played a dominant role. For example, income tax rates for the highest earners fell from 70 percent in 1980 to 50 percent in 1986 to a post-war low of 28 percent in 1988. After 1988, taxes in the highest bracket began to increase again, reaching 39.6 percent by the end of the 1990s. Since then, they have fluctuated between 35 per-cent and the 39.6 percent that is the rate at this writing, in late 2017.10 The big tax bill of 2017 will reduce the top rate to 37 percent in 2018.
This report discusses an array of policies that would improve job prospects for low-income workers. But it’s notable that those policies have not been enacted. Some of these policies are opposed by business inter-ests. Others would cost money. Yet others would benefit particular low-income groups that don’t have much political clout. But, inaction on policies that would clearly improve job opportunities is an important cause of wage stagnation.
Inequality, particularly the significant and growing inequality in the United States today, easily becomes self-reinforcing. Those with more resources have both an interest in maintaining the policies that enable greater concentration of wealth and income and the ability to donate more to political campaigns. These fac-tors converge into a situation where, regardless of what individual campaign donors or legislators may intend, people with more money simply have more influence with lawmakers.
“Although workers with only a high school education were the first to be affected by wage stagnation, it soon began to affect those with bachelor’s degrees and higher as well.”
Chapter 1 | Bread for the World Institute16

CHAPTER 1
According to Lawrence Mishel and Josh Bivens of the Economic Policy Institute, rising inequality explains more than two-thirds of the divergence between produc-tivity and wages that has occurred since 1973.11 Later in this chapter, we discuss some other causes.
However, wage stagnation and growing inequality need not be our country’s future as they have marked our recent past. The fact that government policies played a significant role in shaping the situation means that changes in those policies can lead to wage growth and a halt to growing inequality.
Reaching a Living WageIn Los Angeles County, the largest county in the
nation, economists project that nearly two-thirds of the
jobs created from now through 2020 will require no more than a high school degree. Fewer than 10 percent will require a bachelor’s degree or higher.12 This is the case in many other parts of the country as well.
It is often claimed that most new jobs require highly advanced skills, but this is simply not the case. The Bureau of Labor Statistics at the U.S. Department of Labor forecasts that for the next decade, most of the jobs created in the United States will be in the lowest-paid sectors of the economy. In fact, the fastest-growing occupations are among the lowest-paid of all. Five of the 10 fastest growing job fields do not pay enough to lift a family of four over the poverty line.13 These jobs are nursing assistants, home health workers, retail salesper-sons, and cooks and servers in fast food settings.
Barbie: Proud to Be Working, but Hungrier than Before
At a 2014 congressional hearing before the Budget Committee, Barbie Izquierdo, a single parent of two young children in Philadelphia, PA, explained the predicament that working low-wage jobs presents to parents like her. “I was proud to be working, to have a place to go each day and bring a paycheck home to support my family. Getting a job, I hoped, meant more stability with an increased income.”1 But the job did not lead to more stability. Instead, her earnings pushed her and her children above the income eligibility limit for SNAP—leaving her with less money for food. “So, my kids and I were hungrier than ever,” she told the committee.
Box 1.1
Barbie Izquierdo, who has experienced hunger while raising her two children, has testified on Capitol Hill and was featured in the 2013 documentary about hunger in America A Place at the Table. Am
anda
Luc
idon
for B
read
for t
he W
orld
www.bread.org/institute | 2018 Hunger Report 17
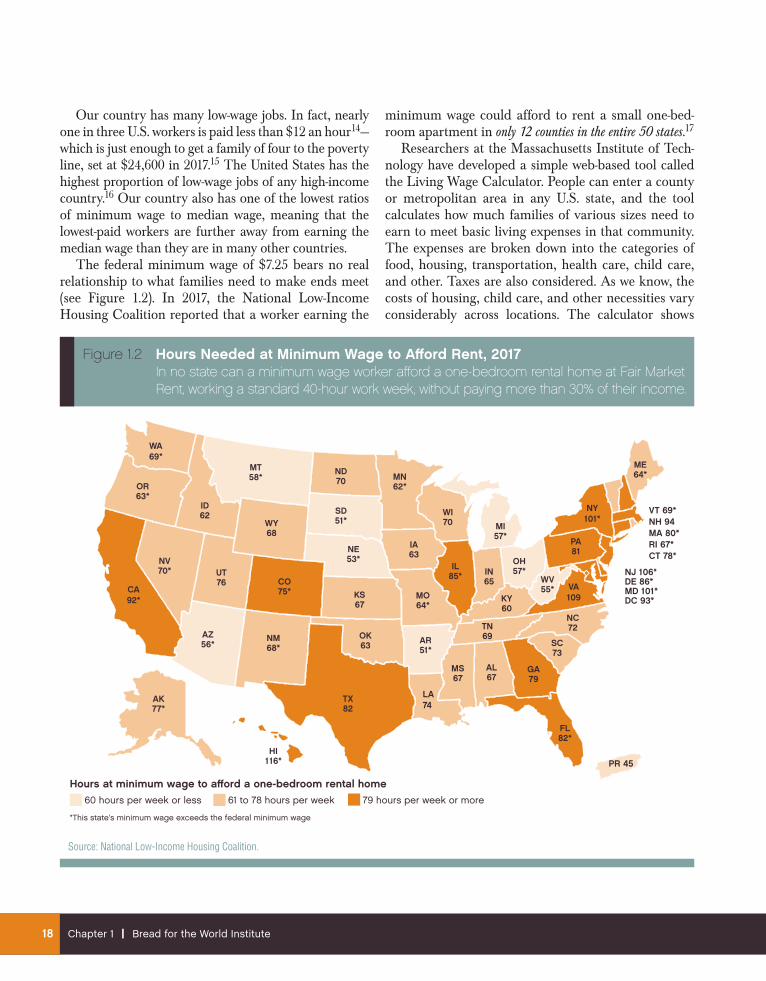
Our country has many low-wage jobs. In fact, nearly one in three U.S. workers is paid less than $12 an hour14—which is just enough to get a family of four to the poverty line, set at $24,600 in 2017.15 The United States has the highest proportion of low-wage jobs of any high-income country.16 Our country also has one of the lowest ratios of minimum wage to median wage, meaning that the lowest-paid workers are further away from earning the median wage than they are in many other countries.
The federal minimum wage of $7.25 bears no real relationship to what families need to make ends meet (see Figure 1.2). In 2017, the National Low-Income Housing Coalition reported that a worker earning the
minimum wage could afford to rent a small one-bed-room apartment in only 12 counties in the entire 50 states.17
Researchers at the Massachusetts Institute of Tech-nology have developed a simple web-based tool called the Living Wage Calculator. People can enter a county or metropolitan area in any U.S. state, and the tool calculates how much families of various sizes need to earn to meet basic living expenses in that community. The expenses are broken down into the categories of food, housing, transportation, health care, child care, and other. Taxes are also considered. As we know, the costs of housing, child care, and other necessities vary considerably across locations. The calculator shows
Figure 1.2 Hours Needed at Minimum Wage to Afford Rent, 2017 In no state can a minimum wage worker afford a one-bedroom rental home at Fair Market Rent, working a standard 40-hour work week, without paying more than 30% of their income.
*This state’s minimum wage exceeds the federal minimum wage
61 to 78 hours per week 79 hours per week or more60 hours per week or less
Hours at minimum wage to afford a one-bedroom rental home
ME64*
NH 94MA 80*RI 67*
NY101*
PA81
NJ 106*DE 86*MD 101*DC 93*
PR 45
VA109
WV55*
OH57*IN
65
MI57*
IL85*
WI70
MN62*
IA63
MO64*
AR51*
LA74
TX82
OK63
KS67
NE53*
ND70
SD51*
MT58*
ID62
WA69*
OR63*
CA92*
AK77*
HI116*
WY68
CO75*
UT76
NV70*
AZ56*
NM68*
NC72TN
69
KY60
SC73
GA79
AL67
MS67
FL82*
CT 78*
VT 69*
Source: National Low-Income Housing Coalition.
Chapter 1 | Bread for the World Institute18

CHAPTER 1
that, on average, a family of two adults and two chil-dren needs each adult to be working full-time for at least $15.84 an hour to make ends meet.18
Because they adjust for family size and regional differences, and they base their analysis on the actual prices of goods and services, living wage calculators present a more accurate picture of what it costs to sup-port a family. Their results show clearly that the fed-eral minimum wage is inadequate. Most states have set their own minimum wages higher than the federal minimum.19 While this is certainly a step forward, at this point all state minimum wages fall short of a living wage. We discuss the minimum wage in more detail in Chapter 4.
The Roots of Wage Stagnation In addition to the influence of government policies,
as discussed earlier, another significant cause of wage stagnation is the steep decline in labor union member-ship. Workers’ bargaining power to negotiate higher wages is dependent on robust union membership—the source of “strength in numbers.” Union membership peaked in 1954 at 34.8 percent of all wage and salary workers.20 By 2016, only 10.7 percent of the workforce belonged to a union (see Figure 1.3).21 The numbers are even lower in the industries that employ the largest share of workers in low-wage jobs: just 4.3 percent of retail workers and 3.9 percent of food preparation workers and servers are union members.22
Figure 1.3 Union Membership and Share of Income Going to the Top 10%, 1917-2015
Share of income going to the top 10 percentUnion membership
20001925 1950 19750
20
40
60%
Note: Data on union density follows the composite series found in Historical Statistics of the United States; updated to 2015 from unionstats.com. Income inequality (share of income to top 10%) data are from Thomas Piketty and Emmanuel Saez, “Income Inequality in the United States, 1913–1998,” Quarterly Journal of Economics vol. 118, no. 1 (2003) and updated data from the Top Income Database, updated June 2016.
Source: Josh Bivens et al. (August 2017), “How today’s union’s help working people: Giving workers the power to improve their jobs and unrig the economy,” Economic Policy Institute.
www.bread.org/institute | 2018 Hunger Report 19

JuJu: Advocate for Paid Family and Medical LeaveJuJu Harris was in the Peace Corps and stationed in Paraguay when a boll weevil infestation destroyed
the country’s entire cotton crop. Her work involved helping farmers choose and plant other crops, mostly fruits and vegetables. She noticed that these new foods clearly improved the health of women and chil-dren in the villages—an observation that would serve her well after her return home.
Harris got married once she returned to the United States and became pregnant soon thereafter. As the mother of an infant, she suffered from postpartum depression, as do about one in seven new mothers.1 She was also eligible for WIC, the federal nutrition program for low-income women, infants, and children. As it turns out, these two facts were connected: research has shown that low-income women, those who are eligible for WIC, are 65 percent more likely to experience PPD than others.2
Harris now works as a birth and postpartum doula in Washington, D.C. One of a doula’s main responsibilities is to provide support to expectant and new mothers, and Harris’s specialty is nutrition education. She works with low-income women, teaching them how to plan meals and shop for foods on a budget and explaining what to eat to keep themselves and their babies healthy.
The best nutrition for infants is exclusive breastfeeding (meaning no water, formula, or other foods) for the first six months. However, this is difficult or impossible for most workers in the United States, particularly workers in low-wage jobs, since they are less likely to have even a few days of paid sick leave.
The Family and Medical Leave Act (FMLA), enacted in 1993, provides new mothers (and fathers) with up to 12 weeks of unpaid leave each year. But not everyone qualifies for this unpaid leave: a parent must work for an employer with at least 50 employees located within a 75-mile radius of the workplace, and she or he must have worked for the employer for at least a year and for at least 1,250 hours (24 hours a week) during that week.3 The Trump administration’s 2018 budget request includes a proposal to extend six weeks of paid leave for new parents. This would be financed through the unemployment insurance (UI) system and shift most of the costs onto states whose UI programs are already underfunded.
Even if workers are eligible under the current FMLA, few can afford to take unpaid leave—if they do, their families may well go hungry, be evicted, or be unable to buy essential medications. Harris knows a retail worker who had no choice but to return to work one week after giving birth. “As soon as she came back to work she was expected to do the same work, standing on her feet all day,” Harris recalled. “You have to perform up to par, if not better, to prove you are a worthy employee.”
Box 1.2
JuJu Harris is a birth and post-partum doula focusing on restorative nourishment. She is also author of the cookbook Healthy and Homemade: Eating Well on a Budget.
Eric
Bon
d fo
r Bre
ad fo
r the
Wor
ld
Chapter 1 | Bread for the World Institute20
CHAPTER 1
When a union is strong, the threat of a strike forces a company to negotiate wage increases with workers. Companies without unions must very often then do the same to prevent their workers from union-izing or leaving for jobs in union shops. In the late 1940s, the United Auto Workers, the most powerful union in the country, negotiated a contract with the management of General Motors that linked increases in workers’ wages to increases in productivity and the cost of living.23 The strength and influence of the UAW on the broader U.S. economy during this period contributed to institutional-izing the linking of wage growth to productivity growth.
Wage stagnation is, in part, an effect of unions’ loss of influence. In the past, unions had greater bargaining power in negotiating higher wages, and union leaders were in frequent contact with members of Congress about the need to raise the minimum wage. This was a primary motivation for Congress to raise the minimum wage, because the statute that established a federal min-imum wage, the Fair Labor Standards Act (FLSA) did not specify how often it should be raised. More recently, calls to increase the minimum wage have carried less impact and have fallen victim to the increasing partisan polarization in Congress. Congress has not raised the minimum wage since 2009—the longest period without a raise since the FLSA was enacted in 1938.
In addition to its impact on minimum-wage workers, this ideological tug of war affects large numbers of workers paid more than the minimum wage. A study of the impact of increasing the minimum wage from $4.25 an hour in 1996 to $5.15 an hour in 1997 found that one of the nation’s largest retail companies (anonymous for purposes of the research) increased the wages of between 30 percent and 40 percent of its entire hourly workforce—even though only 5 percent to 10 percent were earning minimum wage. It is logical that increases in the minimum wage also mean increases for workers earning more. This works the other way as well. Since the minimum wage has remained the same for nearly a decade now, employers have little incentive to raise the wages of higher-paid workers either.
The fact that companies have the option of moving their operations overseas is another factor in wage stagnation. Workers who worry about losing their jobs will agree to lower wages and/or less frequent increases than they otherwise would.
Between 2000 and 2010, the U.S. economy lost nearly 6 million manu-facturing jobs—more than a third of all such jobs.24 Manufacturing jobs
have traditionally enabled people without a college degree to earn a decent living, and the loss of these jobs has depressed wages in other sectors. The average wage of production and nonsupervisory employees in manufacturing is more than $20 an hour,25 compared to retail sales at an average of $13 an hour26 and food service at $10 an hour.27 When manufacturing workers without a college degree lose their jobs, they increase the supply of workers competing in the lower-wage service sector, reducing incentives for employers to pay higher wages.
Manufacturing jobs have also been lost due to auto-mation, although this is not as significant as other fac-tors.28 See Box 1.3. Productivity growth has slowed to a crawl since the end of the Great Recession. In a rapidly automating economy, one would expect the opposite. There is also very little evidence that automation is a cause of wage stagnation. More often, automation has accompanied wage growth. For example, automation increased rapidly during the long period of shared wage growth between the late 1940s and the early 1970s.29
A fourth cause of wage stagnation—the last we will discuss, since our focus is on the most important causes—is a recent history of inconsistent support for full employment in federal policy. The Federal Reserve, the nation’s central bank, has a dual mandate of con-trolling inflation and achieving maximum employment. Except during recessions, the Fed has treated fighting inflation as a higher priority. But full employment when the economy is not in recession is crucial to countering wage stagnation. The last period of broad-based wage growth was in the late 1990s when unemployment was very low. The economy was producing enough jobs for all who wanted them. In such a “tight” labor market,
Eric
Bon
d fo
r Bre
ad fo
r the
Wor
ld
“There are two main strategies to end wage stagnation: tight labor markets and timely, adequate increases in the minimum wage.”
www.bread.org/institute | 2018 Hunger Report 21
workers have more bargaining power for higher wages, and employers have reason to pay more to retain their most experienced and productive workers.
The elected officials responsible for the country’s fiscal policy have not made tight labor markets a pri-ority either. We will have more to say about fiscal and monetary policy in Chapter 2. The key point here is that there are two main strategies to end wage stagna-tion: tight labor markets and timely, adequate increases in the minimum wage.
Public Services That Work for Working Families
As we’ve seen, the federal minimum wage is simply not enough to support a single worker, never mind one with a family. Minimum-wage workers and others with jobs that pay less than a living wage need government nutrition programs and other types of support just to put food on the table and meet their other basic needs.
As we mentioned at the very beginning of this report, unlike the global progress against hunger and
poverty of the last 50 years, virtually all the progress the United States has made is due to programs funded by the federal government, often called safety-net pro-grams. After adjusting for inflation, the U.S. poverty rate based on income from work alone (sometimes called “market income”) is essentially the same today as it was 50 years ago. The 2015 market-income poverty rate was 26.3 percent, but support from government programs reduced the official poverty rate to 14.3 per-cent; the safety net came close to cutting the poverty rate in half (see Figure 1.4). In contrast, 50 years ago when there was far less federal assistance available to families in poverty, government programs reduced the poverty rate by less than 2 percent.30
Two programs that substantially reduce hunger and poverty among working families are the EITC and SNAP. Families must have earned income from work to be eligible for the EITC since it works by reducing the amount of income tax they owe. In 2015, the EITC lifted 6.5 million people out of poverty, including 3.3 million children. When the benefits of the EITC are combined with those of the Child Tax Credit, a total of
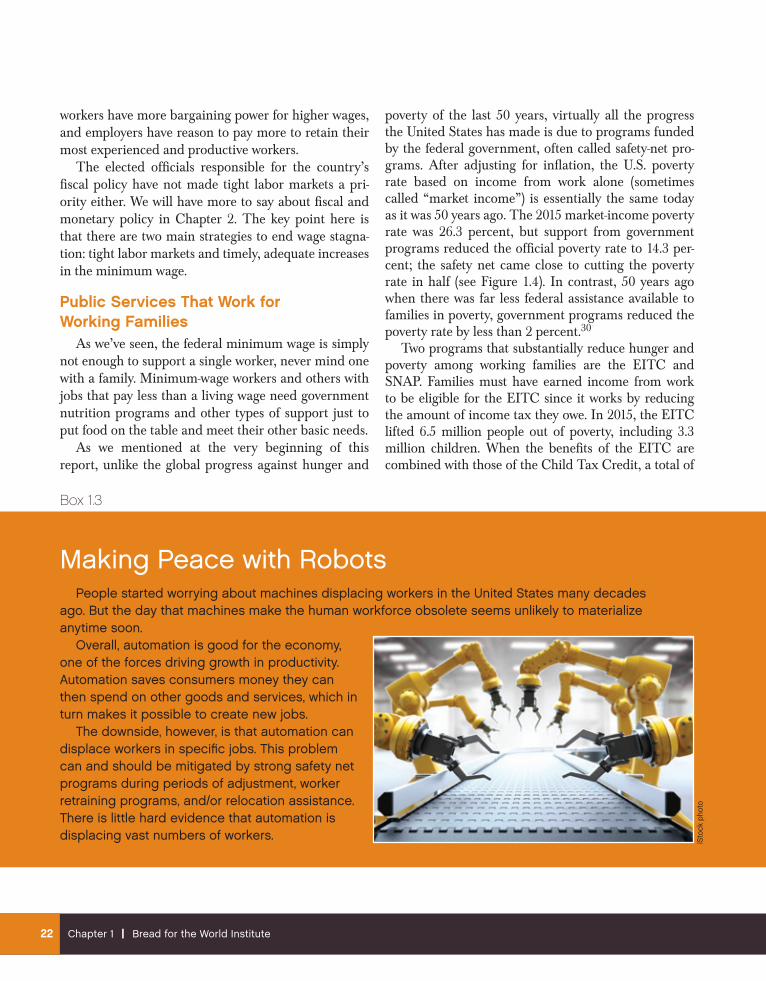
Making Peace with RobotsPeople started worrying about machines displacing workers in the United States many decades
ago. But the day that machines make the human workforce obsolete seems unlikely to materialize anytime soon.
Overall, automation is good for the economy, one of the forces driving growth in productivity. Automation saves consumers money they can then spend on other goods and services, which in turn makes it possible to create new jobs.
The downside, however, is that automation can displace workers in specific jobs. This problem can and should be mitigated by strong safety net programs during periods of adjustment, worker retraining programs, and/or relocation assistance. There is little hard evidence that automation is displacing vast numbers of workers.
Box 1.3
iSto
ck p
hoto
Chapter 1 | Bread for the World Institute22

CHAPTER 1
9.8 million people were lifted out of poverty and another 22 million were less poor than they would otherwise have been.31 Research shows that most families use the EITC to pay off debts or make purchases they have postponed for lack of funds.
SNAP benefits in 2014 (the most recent year data is available) kept 8.4 million people out of poverty, including 3.8 million children.32 Since the end of the Great Reces-sion, SNAP participation has aver-aged more than 40 million people per year. Because people need to eat every day of the year, what mat-ters most is a steady flow of grocery money, which SNAP provides with monthly benefits. But it is quite diffi-cult to make the benefits—an average of $4.50 per person per day—stretch for the entire month. People are most likely to go hungry toward the end of the month. Although studies show that SNAP participants do their best to buy healthy foods, most people have difficulty maintaining a nutritious diet on such a low budget. Higher-income people who have taken the “food stamp challenge”—attempting to live on the average benefit for a week or more—also attest to the difficulty.
In addition to SNAP, child nutrition programs, such as the national school lunch and breakfast programs and after-school programs, help ensure that children get enough to eat. The Special Supplemental Nutrition Program for Women, Infants, and Children, better known as WIC, serves pregnant women and children younger than school age.
Other government programs assist in reducing pov-erty among low-income families, but are underfunded and unable to serve the majority of eligible families. For example, only one in four eligible low-income families receives rental housing assistance33—even though, as mentioned earlier, renting a one-bedroom apartment is beyond the financial reach of a minimum-wage worker virtually everywhere in the country.
Childcare subsidies to help low-wage workers raise their children while also working are even more under-funded—only one in six eligible families receives any help.34 Nationwide, the average cost of infant care is more than $9,900 a year. If a parent has two children, one an infant and the other a 4-year-old, her daycare costs average more than $17,800 per year.35 Families living in poverty simply cannot afford these costs; without childcare subsidies, they must turn to cheaper, less reliable arrangements. Even those with subsidies are likely to have difficulty finding a childcare center if they work nonstandard schedules, since less than 10 percent of center-based providers offer care during eve-nings, overnight, or weekends.36
Thus, lack of child care is one of the biggest obsta-cles women face to being able to work enough hours to put food on the table for their families. Women are the breadwinners or co-breadwinners in two-thirds of American families.37 The lack of child care comes at a cost, both to families and to the United States as a
iSto
ck p
hoto
Figure 1.4 Safety Net Cut Poverty Rate Nearly in Half in 2015
26.3% 26.8%
Under 18
16.1%
All ages
14.3%
Counting NO government assistance (before taxes)
Counting ALL government assistance (after taxes)
Note: Figures use the federal government’s Supplemental Poverty Measure (SPM).
Source: Center on Budget and Policy Priorities.
www.bread.org/institute | 2018 Hunger Report 23

Kristyn and Eric: Living the Challenge Kristyn Davis doesn’t remember ever being hungry as a kid. She thinks she grew up middle class. Her
parents worked in a factory, and her mother held down a second job as a server in a restaurant. Davis, 28, works as a server at a restaurant in Vermilion, a lakeside community in northern Ohio, not
far from where she grew up. She enjoys the work and thinks she is good at it, but it remains a challenge for her. Alcohol is flowing at the bar and she knows that some of the cooks and other servers are using. They invite her to come out with them after work, and she politely says no. She doesn’t share her past with anyone at the restaurant or talk about her struggles with addiction and the sober-living facility, Genesis by the Lake, where she’s a resident with her 5-year old son, Eric.
She tried to get a job at another restaurant, and the manager asked what made her different from other people interviewing for the position. She said, “I’ve never met any of those girls, but I can tell you that I don’t drink so I’m never going to tell you I’m hungover if you schedule me for the breakfast shift.” When she explained that she was in recovery, he ended the interview abruptly.
It wasn’t until Davis became addicted to opioids that she came to know about hunger. Her addiction started with a prescription for oxyco-done after treatment for an ovarian cyst. From there she moved on to heroin and living on the street, going days without food. And she had already had her son Eric. Her family took care of him—and essentially protected him from her. When she got straight, she said, the withdrawal felt like she was dying, but the thought of Eric kept her going through the worst of it, and Eric is what keeps her going to this day.
All the residents at Genesis by the Lake are single mothers, and all have a history with opioids. Ohio has been affected more than most states by the nationwide opioid epidemic. In 2017, the number of deaths from opioids continued to soar. The state has even had to resort to using mobile meat lockers for the bodies of some of those who die of overdoses.
Medicaid covers the largest share of the cost of Kristyn and Eric’s stay at the facility. She says that she doesn’t know what they would do without the program. While Congress was debating health care reform during much of 2017, she tried to put Medicaid’s uncertain future out of her mind. Kristyn knows that she and Eric must leave Genesis by the Lake at some point. She knows the job at the restaurant doesn’t pay enough for her to afford her own place. She dreads being homeless again or exposing Eric to that. They are barely getting enough to eat now with their SNAP card, she says.
Box 1.4
Medicaid and SNAP have made it possible for Kristyn Davis and her son Eric to get healthy and stay nourished while she receives treatment for opioid dependence.
Aaro
n Du
arte
for B
read
for t
he W
orld
Chapter 1 | Bread for the World Institute24

CHAPTER 1
whole. U.S. women participate in the labor force at lower rates than women in other high-income coun-tries. If U.S. families had the same level of childcare assistance as families in countries such as Germany and Canada, researchers estimate that more than 5 million additional women would join the labor force. This would mean an additional $500 billion a year in economic output—more than enough to fund universal child care.38
Parents are a vital part of the U.S. labor force and could contribute even more if they had access to affordable, high-quality child care. Lack of child care affects female workers disproportionately, put-ting them and their children at greater risk of hunger and poverty. Taking action on child care, including enacting legislation that supports both working par-ents and the next generation, should be a top priority for U.S. policymakers.
Fading American Dreams In the 1960s, the average CEO was paid 20 times as
much as a typical employee. By the end of the 1970s, this had risen to 58 times as much. In 1995, the ratio was 120-to-1, and by 2015 it had reached 276-to-1.39 In
no other industrialized country have the disparities in earnings between CEOs and employees grown so immensely. CEOs in the United States on average earn more than twice as much as their peers in Germany, more than three times their peers in France and the United Kingdom, and more than five times their peers in Japan.40 These large disparities imply that CEOs in the United States are not only vastly more produc-tive than their employees, but also more productive than their peers in Western Europe and Japan. But productivity is not the point. CEOs at U.S. companies can count on pay raises regardless of how poorly their companies perform.41
The rapid growth of income inequality is often summed up by comparisons like this: From 1979 to 2015, the wages of the top 1 percent grew 156.7 percent, while the wages of the bottom 90 percent grew only 20.7 percent.42 Since the 1970s, as mentioned earlier, the top 1 percent of income earners have received an increasing share of the income gains from growth in productivity. But the richest among them, the top 0.1 percent, have gained the most. These people, personified by CEOs and other corporate executives, saw their average incomes rise by a breathtaking 322 percent between 1980 and 2015.43
Aaro
n Du
arte
for B
read
for t
he W
orld Child care is one of the fastest growing occupations in the United States—a field dominated by women—and one of the lowest paid.
iSto
ck p
hoto
www.bread.org/institute | 2018 Hunger Report 25

The enormous and growing income gap that opened between the top earners and everyone else did not happen without an enabling policy environment. Hefty campaign contributions and relentless corporate lob-bying went a long way toward persuading Congress to enact numerous tax breaks and loopholes in the tax code that exempted many corporations from paying much of the statutory 35 percent corporate income tax rate. Eighteen Fortune 500 companies paid no federal income taxes at all between 2008 and 2015.44
These tax savings are not typically shared with employees. Nor are they invested in research and devel-opment or capital improvements. “Instead,” writes Justin Miller of The American Prospect, “lucrative bonuses incentivize CEOs to funnel those savings into stock buybacks that further enrich shareholders, creating an insular feedback loop that is one of the core driving forces in this ever-increasing CEO-worker pay gap.”45
David Leonhardt of the New York Times describes the American Dream very succinctly: “Earning more money and enjoying higher living standards than
[our] parents had.”46 For most of the 20th century, the great majority of U.S. families could count on reaching higher living standards than their parents’ generation. But that is no longer the case. Using tax records to compare the generational earnings of American fami-lies through the 20th century, researchers found that more than 90 percent of the babies born in 1940 had higher incomes by the age of 30 than their parents did at that age. But the share of babies born in 1980 whose incomes 30 years later exceeded their parents’ incomes had declined to 50 percent. The researchers modeled the impact of income inequality on this outcome. Using the same levels of GDP growth, but without the rise in inequality, the share of babies born in 1980 who earned more than their parents by age 30 would have been 80 percent. The researchers who reported these findings titled their paper The Fading American Dream.47
Americans are aware they are falling behind, even if they don’t realize how tax laws have contributed to the problem. Most people appear to have no idea how much CEOs are now paid relative to the average
Figure 1.5 Life Expectancy at Age 50 for Males and Females Born in 1930 and 1960, by Income Quintile
26.6 26.1
Q1
27.2 28.3
Q2
28.1
33.4
Q3
29.8
37.8
Q4
31.7
38.8
Q5
32.328.3
Q1
31.4 29.7
Q2
32.4 32.4
Q3
33.4 33.1
Q4
36.2
41.9
Q5
1930 Cohort 1960 Cohort
MALES FEMALES
Note: Cohort life expectancy estimates calculated using observed sample mortality where possible and projected mortality for younger sample individuals (i.e., older than age 78 for the 1930 birth cohort and for the entire 1960 birth cohort).
Source: Katelin P. Isaacs and Shamila Choudhury (May 12, 2017), The Growing Gap in Life Expectancy by Income: Recent Evidence and Implication for the Social Security Retirement Age, Congressional Research Service.
Chapter 1 | Bread for the World Institute26
CHAPTER 1
employee, or how government policies enable these rapidly increasing income disparities.48 What they know is their own lived experience.
Particularly for workers in low-wage jobs—but for everyone else as well—growing income inequality has real consequences. It’s not just theoretically unfair. For example, income inequality affects many health outcomes, including the most important: staying alive. Recent reports show that life expectancy has fallen among low-income adults in their prime working years. In 1980, 50-year-old men in the highest income quintile had an average additional lifespan of 5.1 years over 50-year-old men in the lowest quintile. By 2010, 50-year-old men in the highest quintile were living 12.7 years longer than men in the lowest quintile. The sta-tistics are similar among women (see Figure 1.5). The lifespans of the white working class, male and female, have fallen furthest during the 30-year period covered by this research.49
The fading of the American Dream translates into a loss of confidence in national institutions. A 2016 Gallup poll reported that over the previous decade, confidence in the nation’s major institutions had fallen to historic lows.50 Confidence in banks fell the fur-
thest, 22 percent, at least twice as much as the loss of trust people reported for other institutions. This is not surprising since a financial crisis triggered the Great Recession, which began in 2007. The nation’s largest banks were bailed out by taxpayers, and their execu-tives continued to receive lavish bonuses as if nothing had gone wrong. Meanwhile, the average household faced another decade of stagnating wages, and mil-lions of people lost homes and savings.
As mentioned earlier, the concentration of income at the top has influenced policies that affect the entire country. Over the past generation, the financial sector has more than doubled relative to the rest of the economy, and a disproportionate number of the top 1 percent of income earners work in this sector. There is a very strong case that the financial sector has used its political and financial power to ensure that economic policies favor its priorities.
For example, before the surge in income inequality, regulations protected the public from reckless financial speculation. But the financial sector successfully lob-bied for the deregulation of mortgage markets in the late 1990s. That is why banks were allowed to issue the
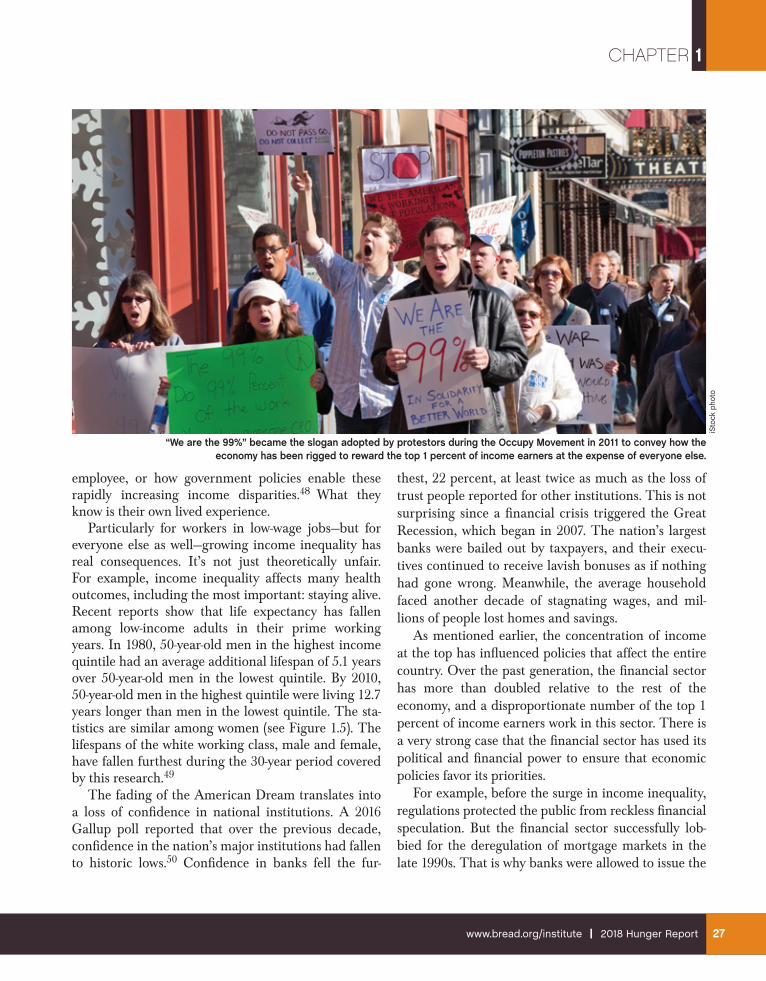
“We are the 99%” became the slogan adopted by protestors during the Occupy Movement in 2011 to convey how the economy has been rigged to reward the top 1 percent of income earners at the expense of everyone else.
iSto
ck p
hoto
www.bread.org/institute | 2018 Hunger Report 27

subprime mortgages that were such an important cause of the 2008 financial crisis—and the Great Recession.
“If you look at so many of the outcomes in our political process, no one can say that they reflect the interests of most Americans,” explains Joseph Sti-glitz, a Nobel laureate economist. “Most Americans don’t think speculators should be taxed at a fraction of people that work for a living; or that banks should be allowed to engage in predatory lending or abusive credit card practices.”51
After the subprime mortgage crisis, Congress passed the Dodd-Frank Wall Street Reform and Consumer Protection Act, which includes regulations designed to curb many of the banking practices that caused the subprime mortgage crisis and contributed to the Great Recession. The administration has urged Congress to repeal Dodd-Frank and favors closing down the Consumer Financial Protection Bureau created under the law. Even without repeal, changes in governance, policy, and/or personnel could weaken Dodd-Frank’s protection of the economy and consumers.
The wealthiest Americans still exert a strong influ-ence on policymakers, and laws and regulations con-tinue to favor their interests at the expense of what is best for everyone else. For example, at this writing, business interests are vehemently opposing the idea of requiring employers to provide paid sick leave. Their argument may be gaining momentum, even though the facts are not on their side—for example, researchers estimate the cost to the United States of lack of paid sick leave at $160 billion a year in lost productivity.52 Yet 19 states already prohibit local governments from requiring employers to provide paid sick leave.53 The HR Policy Association, a coalition of more than 380 companies that includes some of the wealthiest, wants to expand such laws nationwide. It is lobbying Con-gress for a law that would protect them from local sick leave requirements.54
A Global ChallengeOver the past half-century, nations around the
world from the richest to the poorest have become much more integrated into a global economic system. While this system is far from perfect, it has for the most part benefited countries of all income levels. The tremendous reductions in hunger and poverty in developing countries are directly related to the opening of their economies to international trade. Trade has tripled as a share of the U.S. economy, and in recent years, this growth has been largely from trade with developing countries. In 1985, 29 percent of U.S. exports went to developing countries.55 Today, they make up half the market for U.S. exports,56 and this will only increase as poverty and hunger rates fall further and new consumers look to buy from coun-tries such as the United States.
But the impact of globalization has been uneven and complicated. Global inequality has increased (see Figure 1.6). In the United States, local communities that lose large numbers of manufacturing jobs need help in adjusting—for example, by attracting other employers, supporting small businesses, and/or retraining workers. In Springfield, Ohio, manufacturers laid off many workers, leading to a drop of 27 percent in the city’s median income between 1999 and 2014.57 There is a chain reaction—first local shops and restaurants lose sales, which further erodes the tax base that pays for city services such as schools, health care, and police.
The decline in manufacturing employment has contributed to a rapid increase in concentrated pov-erty around the country. In 1970, only about 15 per-cent of American families lived in either very poor or very affluent neighborhoods, but by 2010, the share of people in both types of neighborhood had more than doubled.58
All too often, the support that displaced workers and their communities need has not materialized. Recog-
Chapter 1 | Bread for the World Institute28

CHAPTER 1
nizing that trade is an overall gain for the national economy, the gov-ernments of all high-income coun-tries are involved to some extent in assisting workers displaced by trade in restarting their careers. Denmark allocates more than 2 percent of its GDP to this purpose, but the United States spends less than 0.2 percent.59 In fact, among the 35 developed countries that make up the OECD, only Chile and Mexico spend a smaller share of GDP on displaced worker initia-tives than does the United States.
Increased competition from low-wage countries has also had some negative effect on U.S. wages, generally. The benefits of trade to the U.S. economy are greater than these costs, so our country could afford to invest much more in the health, education, and economic security of its workers. That would improve their well-being and their earning capacity. An expanded effort to improve the well-being of all Americans is probably crucial to the renewal of public support for open trade and international devel-opment assistance.60
We began this chapter with a mention of the Sustain-able Development Goals (SDGs). In 2015, all the nations of the world agreed on development goals. These include ending hunger and poverty, improving health and educa-tion, and achieving environmental sustainability. These goals are interrelated. Hunger and malnutrition exac-erbate risks to national security, while climate change exacerbates hunger and malnutrition. Jobs and dignified working conditions for workers in all countries are at the heart of long-term peace and security.
The global goals apply to all countries. The U.S. govern-ment is developing its system for reporting on U.S. progress. And in an interdependent world, each country’s economic and social progress depends, in part, on progress in other countries. Low-wage workers in the United States and their counterparts in developing countries stand to gain much more in a world where all countries are making efforts to achieve the SDGs.
The United States is the world’s most powerful country, so U.S. cooperation on global issues is especially important. U.S. leadership is crucial on issues such as trade and interna-tional development assistance. Current U.S. voter attitudes suggest that support for U.S. global leadership will require success in achieving shared and sustainable development within our own borders.
Figure 1.6 Share of Global Wealth, 2010-2015
Other 99%
Richest 1%
2010 2011 2012 2013 2014 2015
56555453525150494847464544
% s
hare
of g
lob
al w
ealth
Source: World Economic Forum
www.bread.org/institute | 2018 Hunger Report 29
The Earned Income Tax Credit (EITC) is a tax refund for low- and moderate-income workers that helps them support their families. Ronald Reagan was an enthusiastic supporter of the EITC. In fact, it has enjoyed consistent bipartisan support for decades, and members of Congress from both sides of the aisle continue to propose ways of strengthening it.
When combined with the Child Tax Credit (CTC), the EITC does more to reduce poverty than any other government program except Social Security. For example, a single parent raising three children and earning $14,500 a year (the income of a full-time, year-round minimum wage worker) would be eligible for an EITC refund of $6,318 and a CTC refund of $1,725 in 2017.1
The EITC has evolved considerably since it was first made available in 1975, but the basic concept is the same: the credit encourages work, offsets federal payroll and income taxes, and supplements low wages. It grows with earnings until it reaches a maximum level, then gradually phases out at higher income levels. It is refundable,
meaning that the recipient will receive the balance as a refund if it exceeds a low-wage worker’s income tax liability.
Under Reagan, the EITC was phased in more quickly and phased out more slowly (i.e., at a higher income level). The Reagan era also saw the maximum refund amount raised and the benefit indexed to inflation.2 The EITC was further expanded in the early 1990s, and since then has continued to evolve to serve working families more effectively. Almost half of all taxpayers with children under the age of 18 have claimed the EITC at least once.3
In the 2015 tax year, more than 26 million tax filers, representing every state, received EITC refunds. The benefits lifted about 6.5 million people, half of whom were children, over the poverty line. The EITC also reduced
the depth of poverty for another 21.2 million people, including 7.7 million children.4 Households led by single mothers make up a large share of those who receive the
EITC. There are far more single-parent households led by mothers than by fathers, and as mentioned earlier, women are paid less than their male counterparts at every level of educational attainment.5 By increasing their earnings from employment, the EITC also raises the value of their Social Security retirement benefits.
Research shows that the EITC provides enough incentive to draw people who were not previously working into the labor force.6 The 1990s EITC expansion did more to draw single mothers into the workforce than either the strong economy or the 1996 welfare reform law that replaced Aid to Families with Dependent Children with the more stringent Temporary Assistance for Needy Families (TANF) program.7
More single mothers would work if they had access to affordable, high-quality child care. There is a nonrefundable Child and Dependent Care Tax Credit that can help offset the cost of child care, but most low-income workers are ineligible because they owe little or no income tax. Refundable credits, such as the EITC and the low-income component of the CTC, are more valuable to low-income households because filers whose credit amount exceeds their income tax liability can receive the difference in the form of a cash refund.8
????
???
The Earned Income Tax Credit: Giving Workers the Credit They Deserve
“The EITC encourages work, offsets federal payroll and income taxes, and supplements low wages.”
Chapter 1 | Bread for the World Institute30
CHAPTER 1
Research has docu-mented many positive effects of the EITC. Expectant mothers who receive an EITC refund are less likely to give birth to premature or low-birthweight babies. Children in house-holds that receive the credit do better in school, are more likely to attend college, and earn more when they enter the job market.9 The additional resources avail-able to families help power local economies. In eight high-poverty counties in California’s San Joaquin Valley, EITC payments generated $700 million in business sales and 4,600 jobs in 2007.10 The average congressional district received $196 million in payments for the 2014 tax year from the EITC and CTC combined.11 The credit also helps employers by lowering the cost of labor, allowing them to hire more workers.
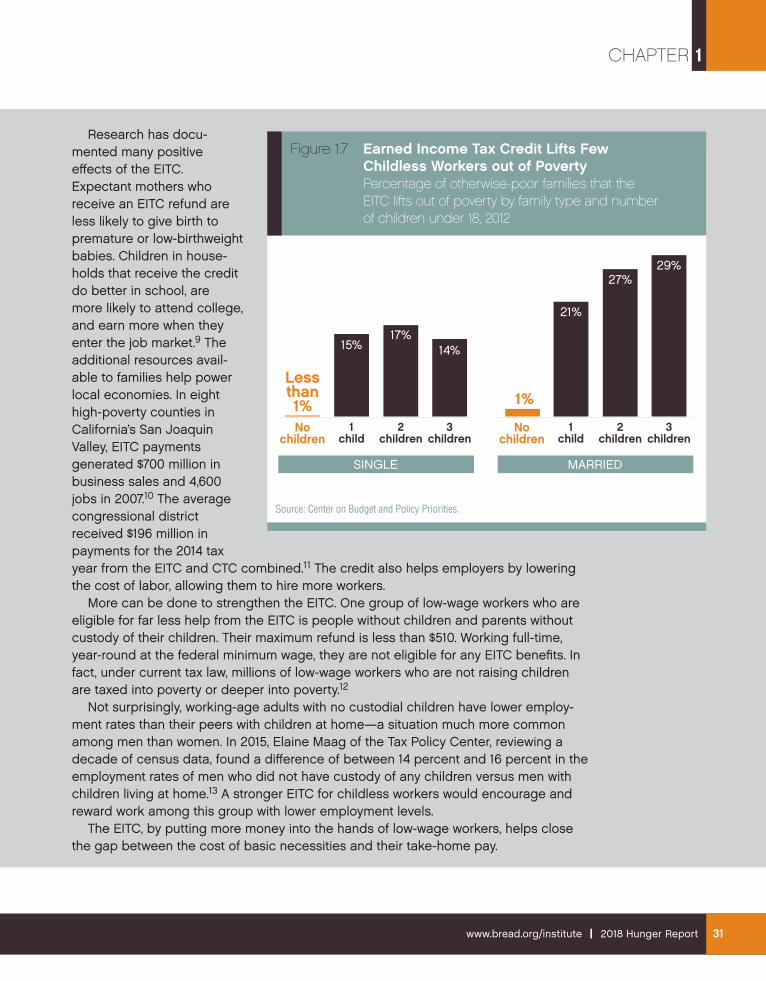
More can be done to strengthen the EITC. One group of low-wage workers who are eligible for far less help from the EITC is people without children and parents without custody of their children. Their maximum refund is less than $510. Working full-time, year-round at the federal minimum wage, they are not eligible for any EITC benefits. In fact, under current tax law, millions of low-wage workers who are not raising children are taxed into poverty or deeper into poverty.12
Not surprisingly, working-age adults with no custodial children have lower employ-ment rates than their peers with children at home—a situation much more common among men than women. In 2015, Elaine Maag of the Tax Policy Center, reviewing a decade of census data, found a difference of between 14 percent and 16 percent in the employment rates of men who did not have custody of any children versus men with children living at home.13 A stronger EITC for childless workers would encourage and reward work among this group with lower employment levels.
The EITC, by putting more money into the hands of low-wage workers, helps close the gap between the cost of basic necessities and their take-home pay.
Figure 1.7 Earned Income Tax Credit Lifts Few Childless Workers out of Poverty Percentage of otherwise-poor families that the EITC lifts out of poverty by family type and number of children under 18, 2012
Less than 1%No
children1
child2
children3
children
SINGLE
1%
Nochildren
1child
2children
3children
MARRIED
15%17%
14%
21%
27%29%
Source: Center on Budget and Policy Priorities.
www.bread.org/institute | 2018 Hunger Report 31