Embed Size (px)
Citation preview
Chapter Extension
17Geographic Information
Systems
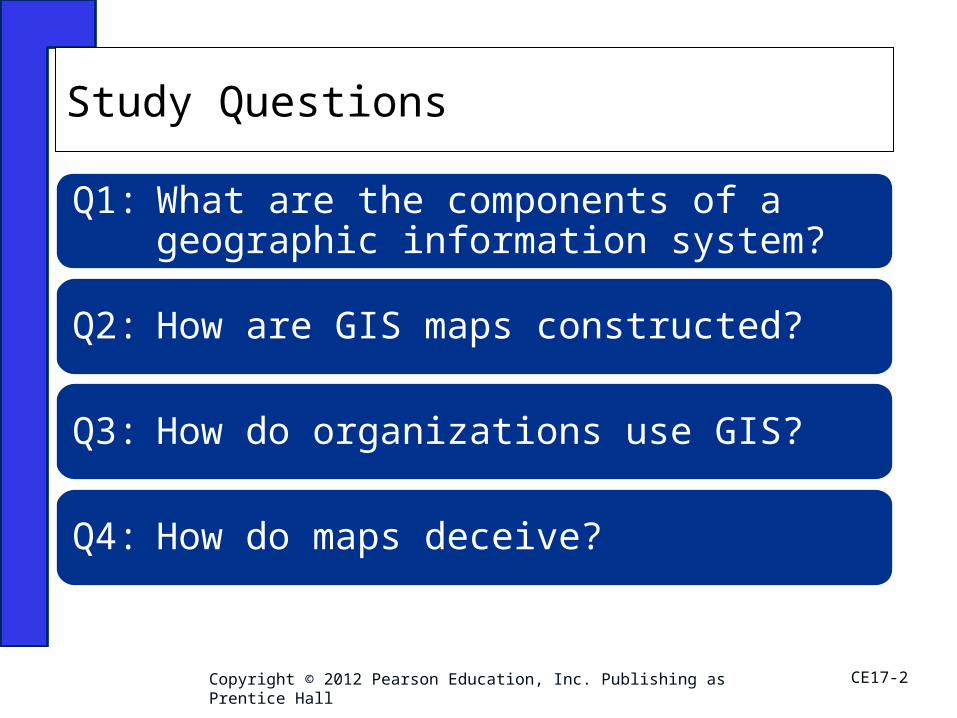
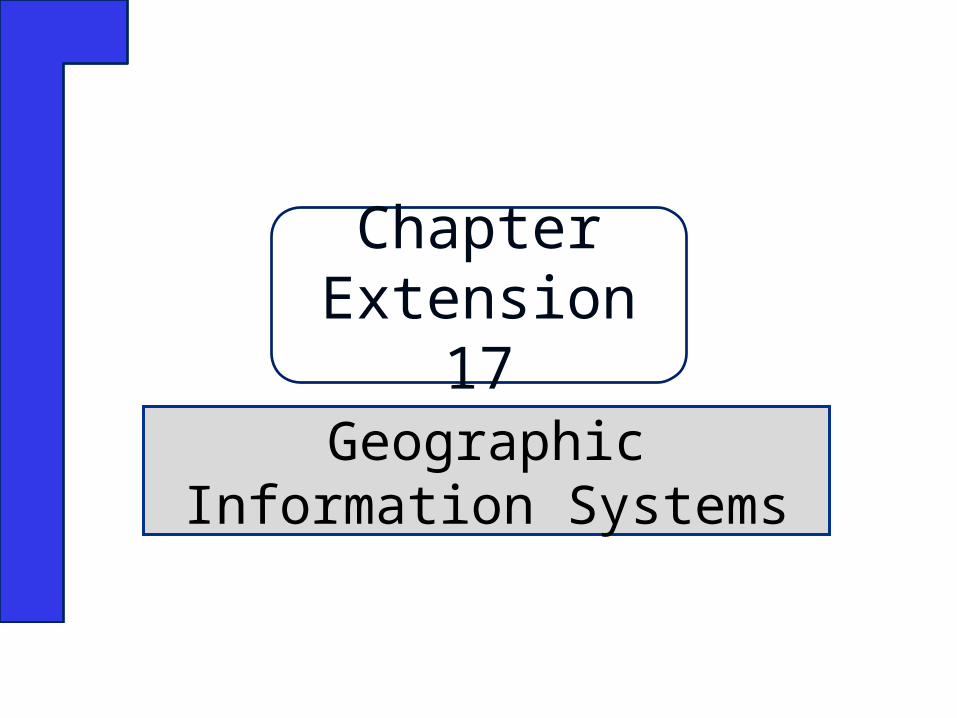
Q1: What are the components of a geographic information system?
Q2: How are GIS maps constructed?
Q3: How do organizations use GIS?
Q4: How do maps deceive?
Study Questions
CE17-2Copyright © 2012 Pearson Education, Inc. Publishing as Prentice Hall
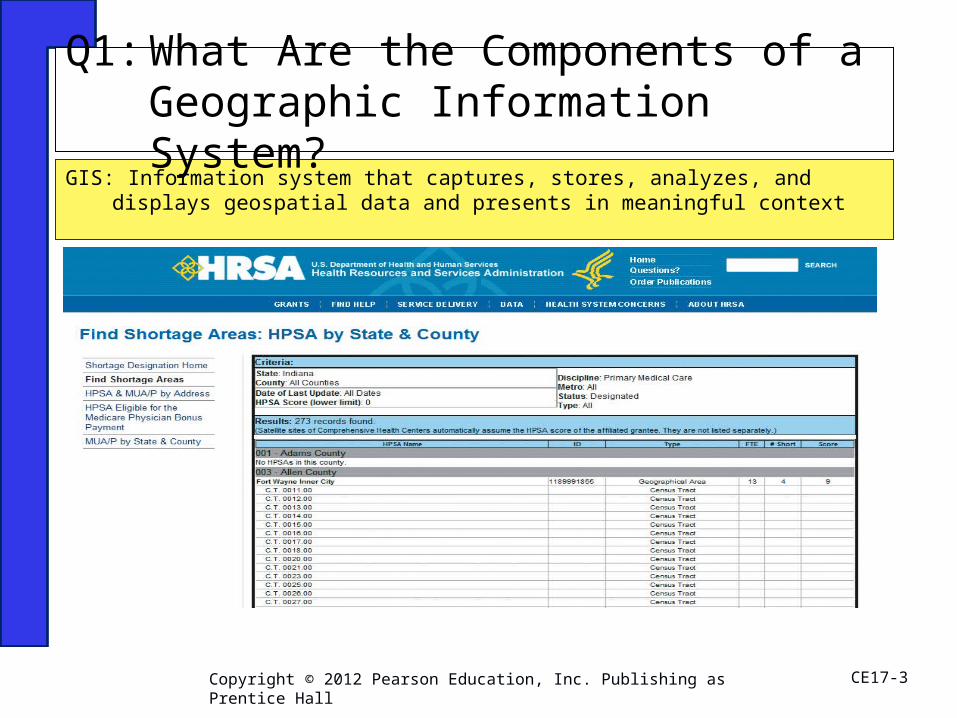
GIS: Information system that captures, stores, analyzes, and displays geospatial data and presents in meaningful context
Q1: What Are the Components of a Geographic Information System?
CE17-3Copyright © 2012 Pearson Education, Inc. Publishing as Prentice Hall
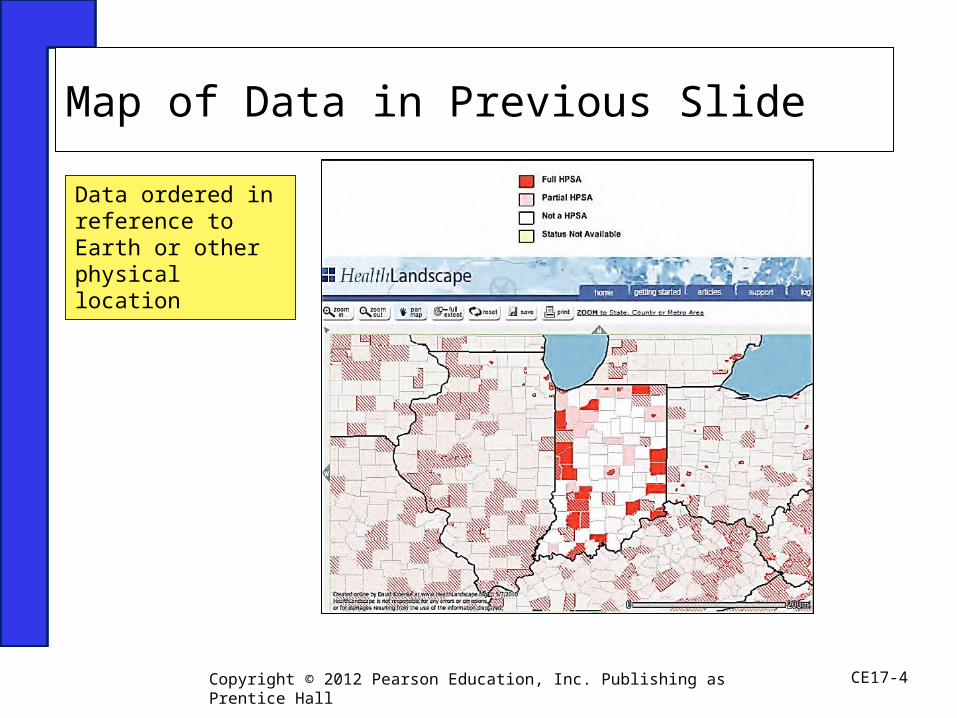
Data ordered in reference to Earth or other physical location
Map of Data in Previous Slide
CE17-4Copyright © 2012 Pearson Education, Inc. Publishing as Prentice Hall
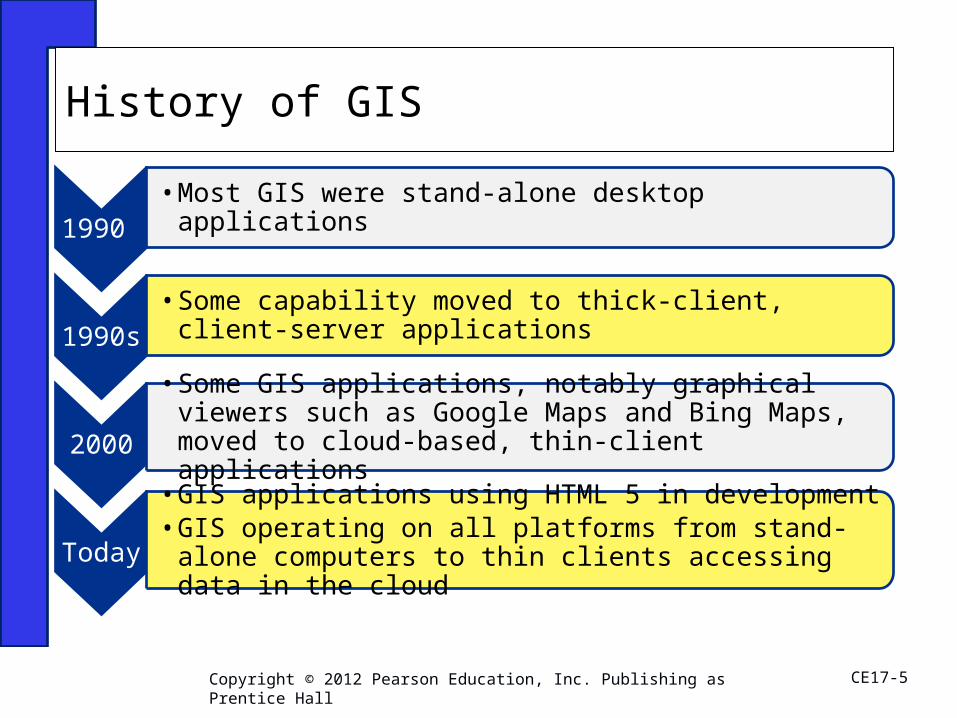
1990 •Most GIS were stand-alone desktop applications
1990s•Some capability moved to thick-client, client-server
applications
2000
•Some GIS applications, notably graphical viewers such as Google Maps and Bing Maps, moved to cloud-based, thin-client applications
Today
•GIS applications using HTML 5 in development •GIS operating on all platforms from stand-alone
computers to thin clients accessing data in the cloud
History of GIS
CE17-5Copyright © 2012 Pearson Education, Inc. Publishing as Prentice Hall
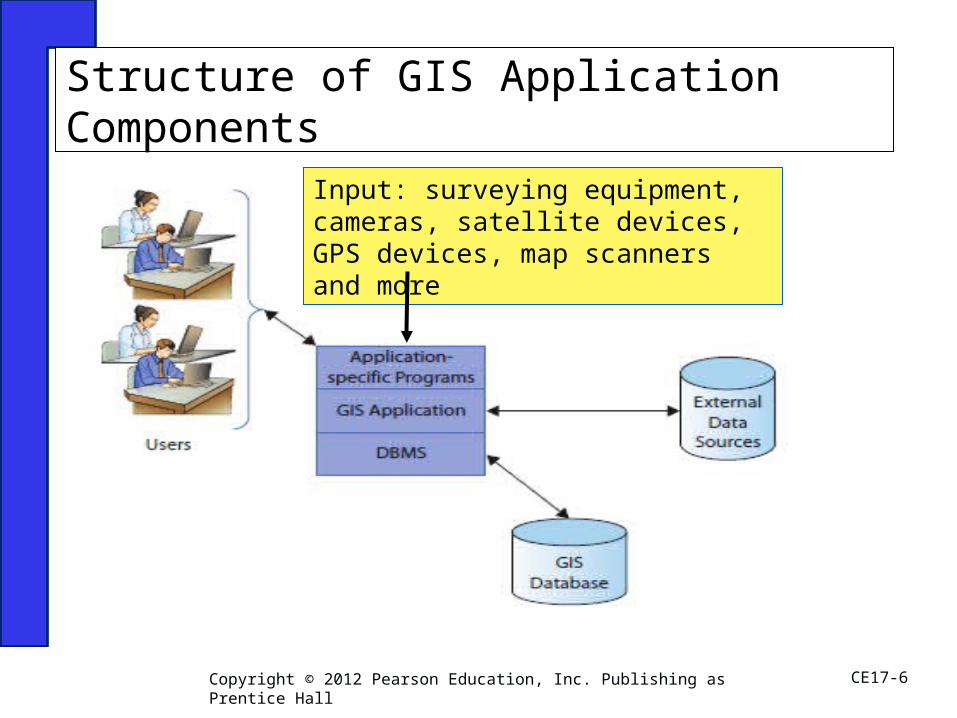
Structure of GIS Application Components
CE17-6Copyright © 2012 Pearson Education, Inc. Publishing as Prentice Hall
Input: surveying equipment, cameras, satellite devices, GPS devices, map scanners and more
ArcGIS, Autodesk, MapInfo, Bentley GIS. Open-source GIS include GRASS and uDig and others.
GIS applications get geospatial data from service like Google Earth or Bing Maps, add organizational-specific data from own database, and displays that data in browsers for users.
Software: GIS Applications
CE17-7Copyright © 2012 Pearson Education, Inc. Publishing as Prentice Hall
Tools for input, manipulation, and structuring GIS outputs can be complicated and difficult to use. Need geospatial analyst for particular tasks
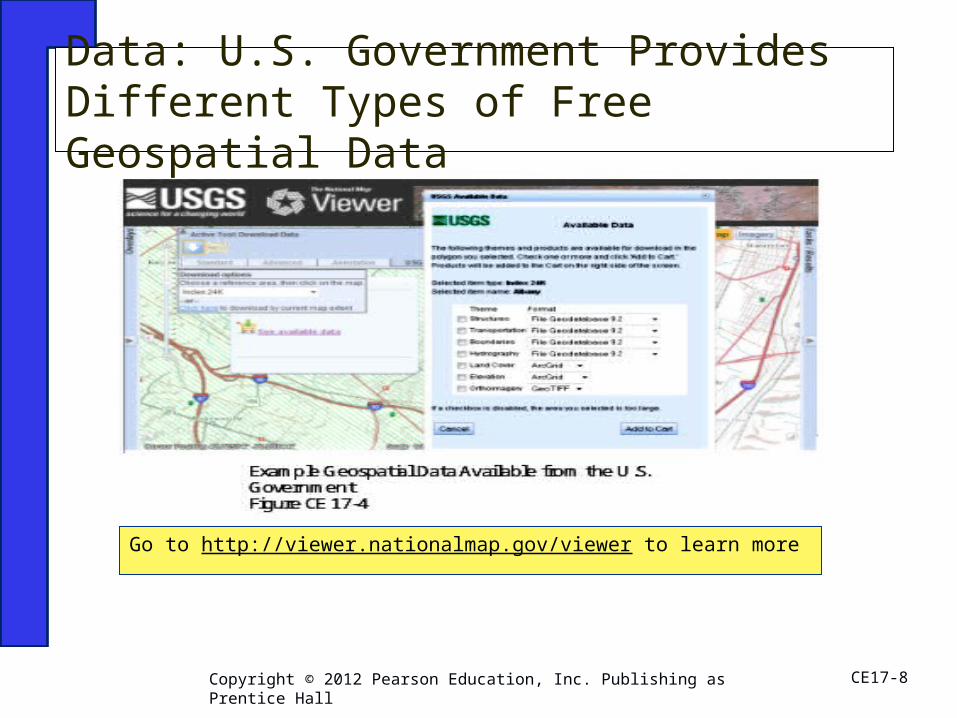
Go to http://viewer.nationalmap.gov/viewer to learn more
Data: U.S. Government Provides Different Types of Free Geospatial Data
CE17-8Copyright © 2012 Pearson Education, Inc. Publishing as Prentice Hall
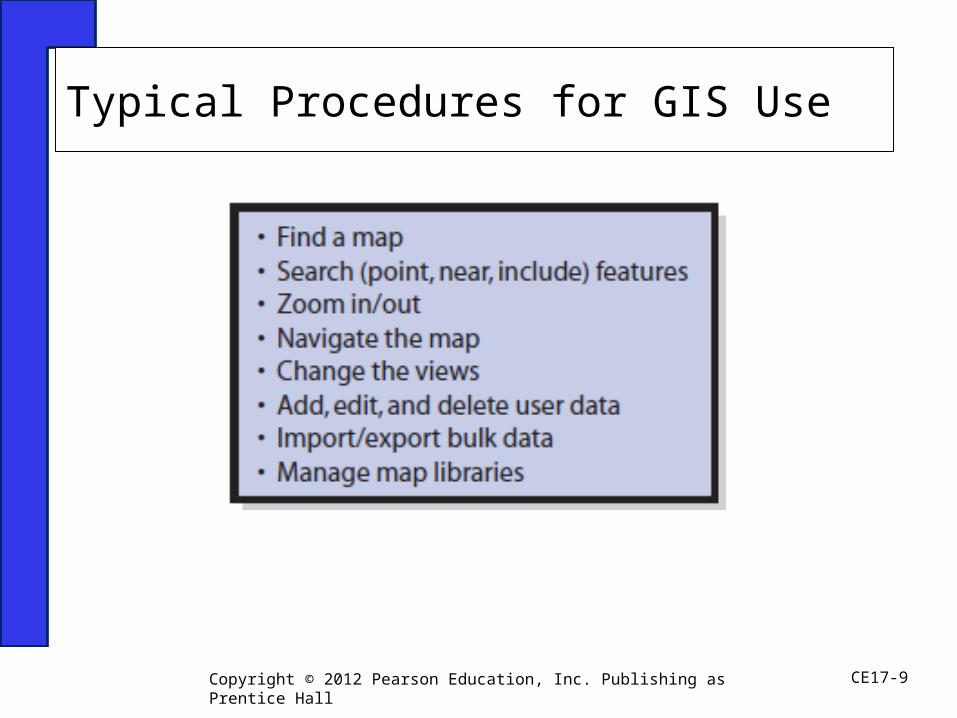
Typical Procedures for GIS Use
CE17-9Copyright © 2012 Pearson Education, Inc. Publishing as Prentice Hall
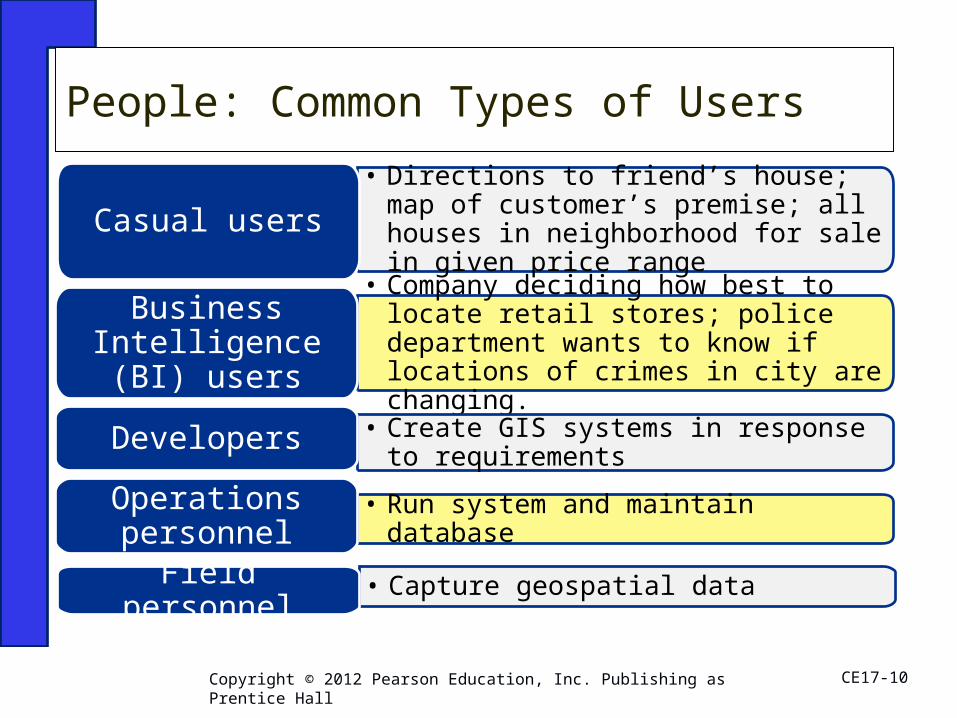
• Directions to friend’s house; map of customer’s premise; all houses in neighborhood for sale in given price range
Casual users
• Company deciding how best to locate retail stores; police department wants to know if locations of crimes in city are changing.
Business Intelligence (BI)
users
• Create GIS systems in response to requirements
Developers
• Run system and maintain databaseOperations personnel
• Capture geospatial data Field personnel
People: Common Types of Users
CE17-10Copyright © 2012 Pearson Education, Inc. Publishing as Prentice Hall
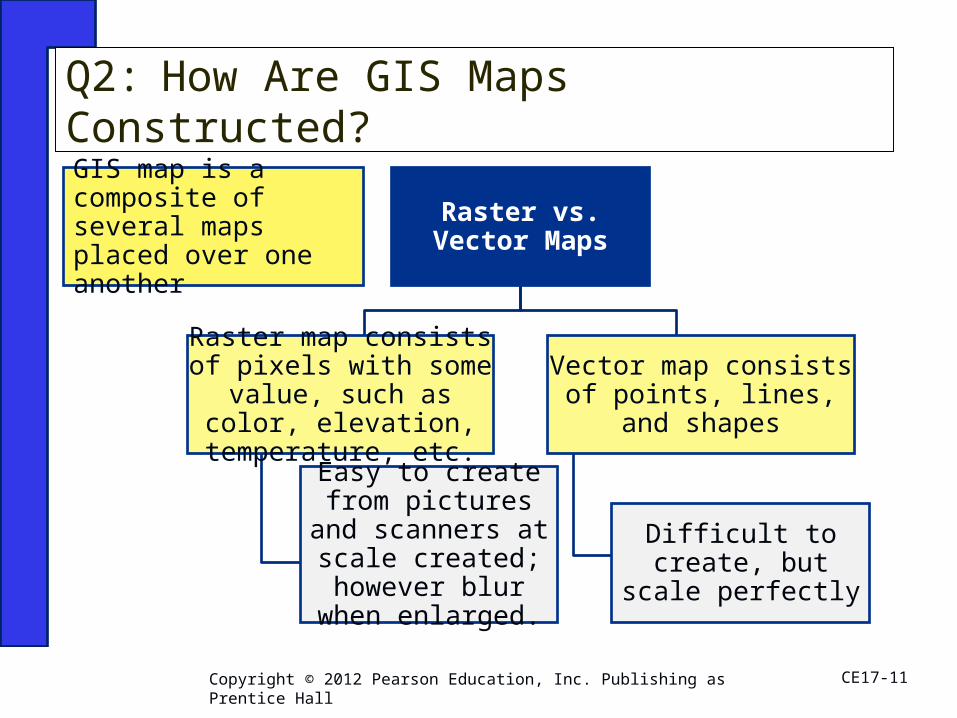
GIS map is a composite of several maps placed over one another
Raster vs. Vector Maps
Raster map consists of pixels with some
value, such as color, elevation,
temperature, etc.Easy to create
from pictures and scanners at scale created; however
blur when enlarged.
Vector map consists of points, lines, and
shapes
Difficult to create, but scale perfectly
Q2: How Are GIS Maps Constructed?
CE17-11Copyright © 2012 Pearson Education, Inc. Publishing as Prentice Hall
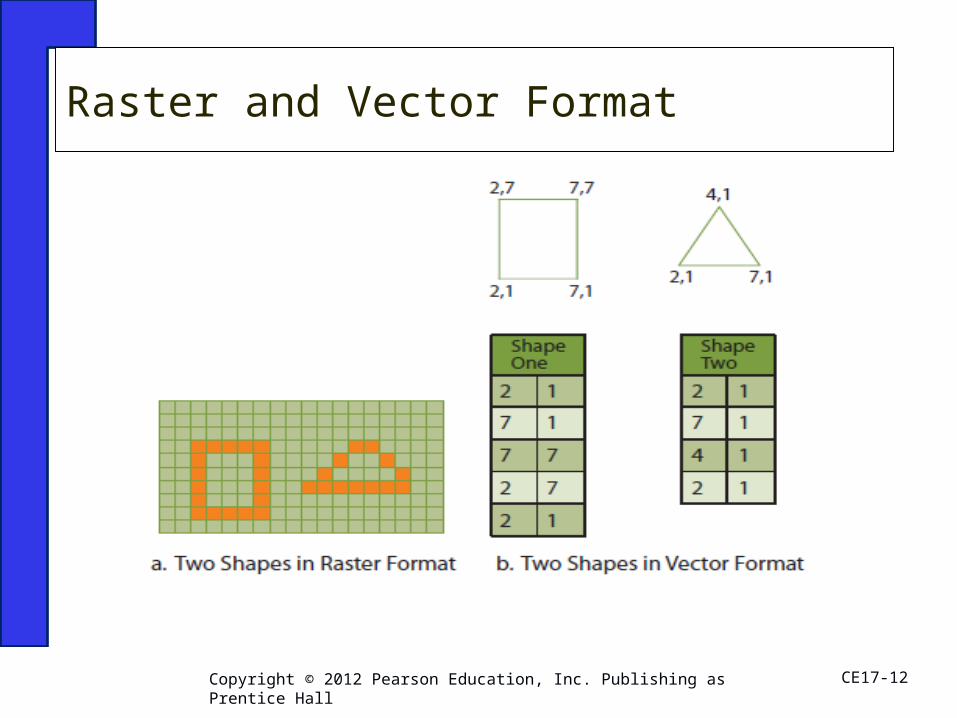
Raster and Vector Format
CE17-12Copyright © 2012 Pearson Education, Inc. Publishing as Prentice Hall
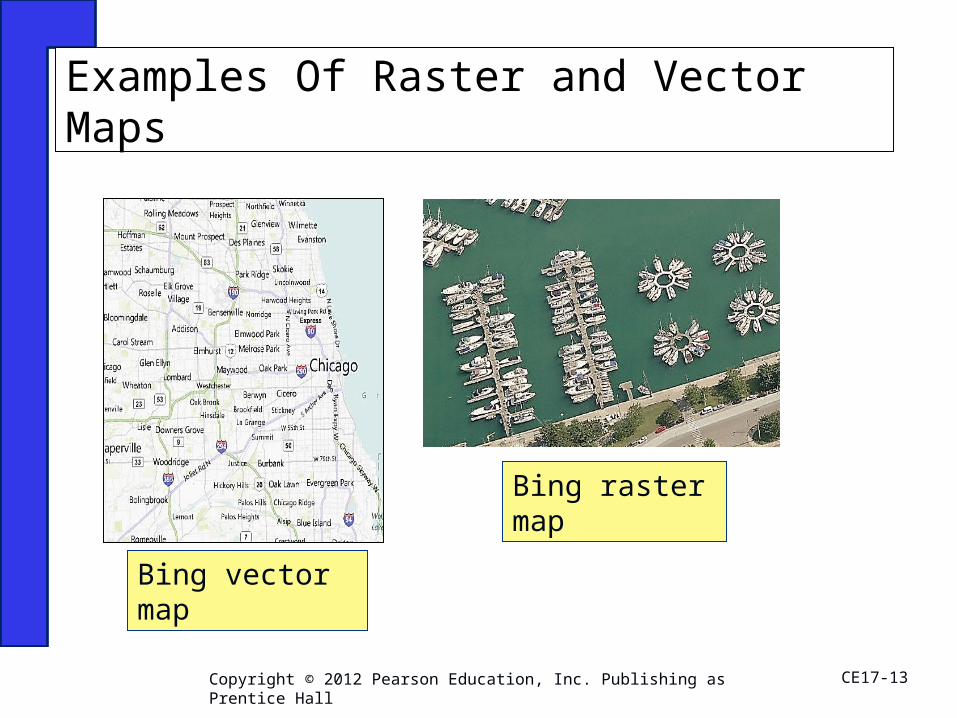
Examples Of Raster and Vector Maps
CE17-13Copyright © 2012 Pearson Education, Inc. Publishing as Prentice Hall
Bing vector map
Bing raster map
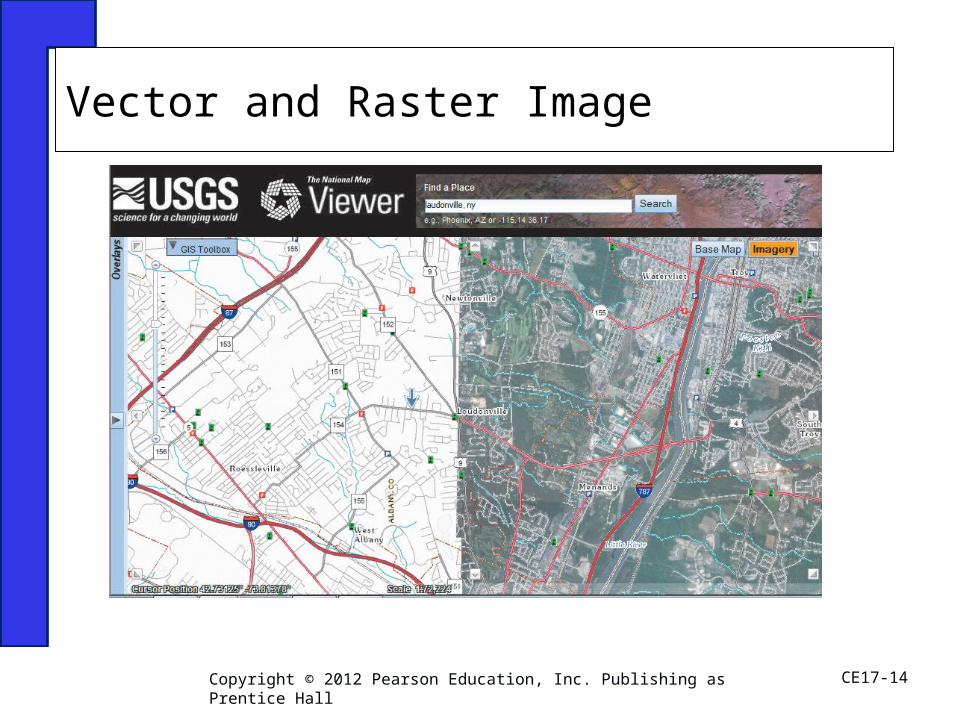
Vector and Raster Image
CE17-14Copyright © 2012 Pearson Education, Inc. Publishing as Prentice Hall
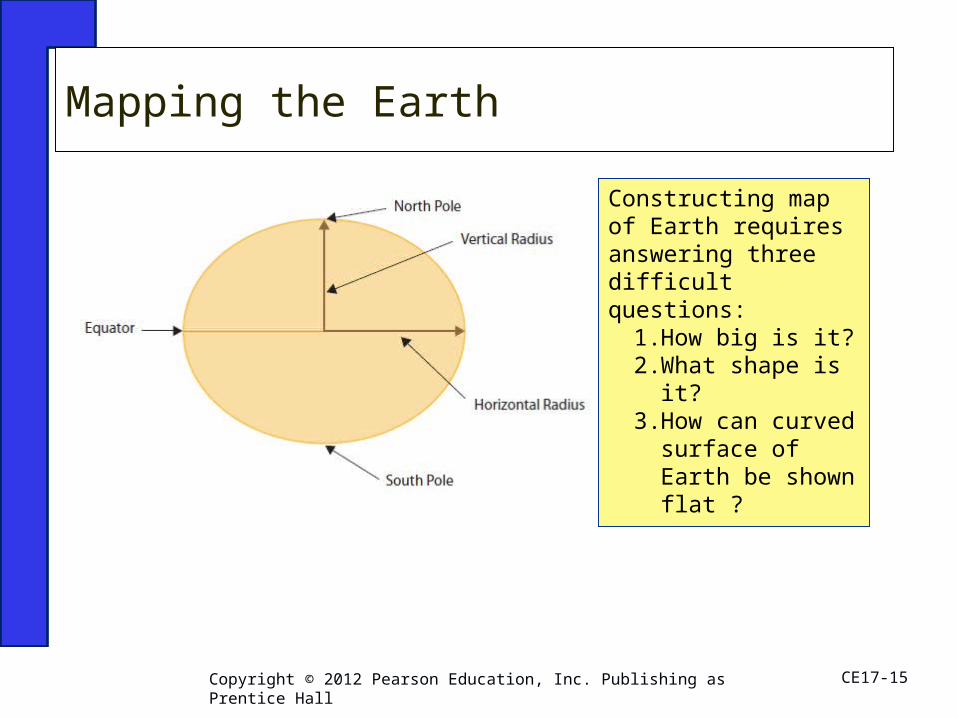
Constructing map of Earth requires answering three difficult questions:
1. How big is it?2. What shape is
it?3. How can
curved surface of Earth be shown flat ?
Mapping the Earth
CE17-15Copyright © 2012 Pearson Education, Inc. Publishing as Prentice Hall
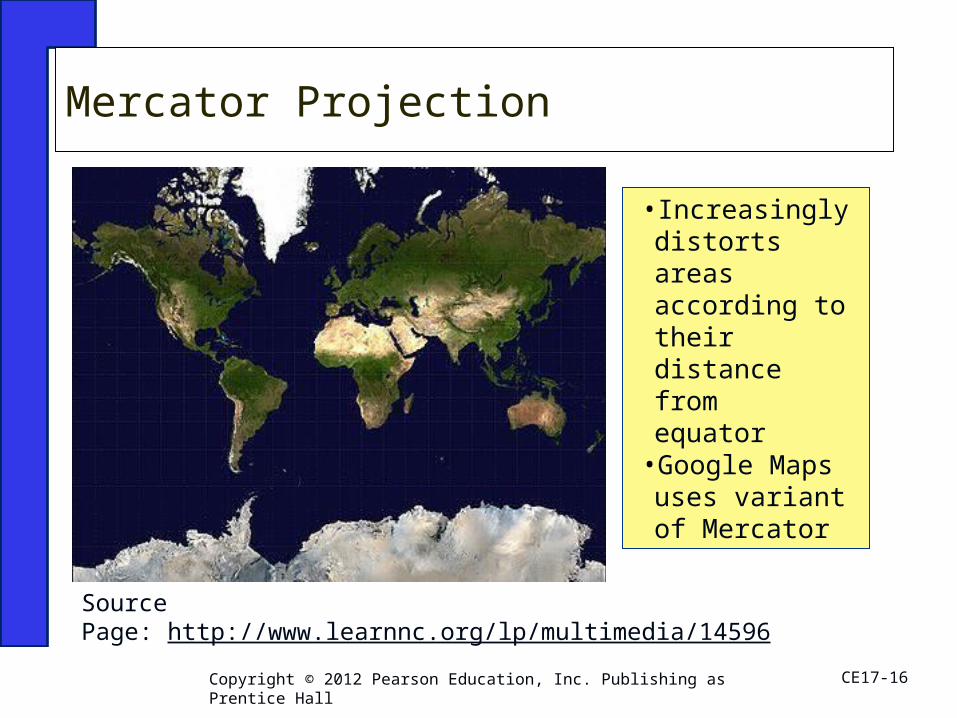
Mercator Projection
CE17-16Copyright © 2012 Pearson Education, Inc. Publishing as Prentice Hall
Source Page: http://www.learnnc.org/lp/multimedia/14596
• Increasingly distorts areas according to their distance from equator
•Google Maps uses variant of Mercator
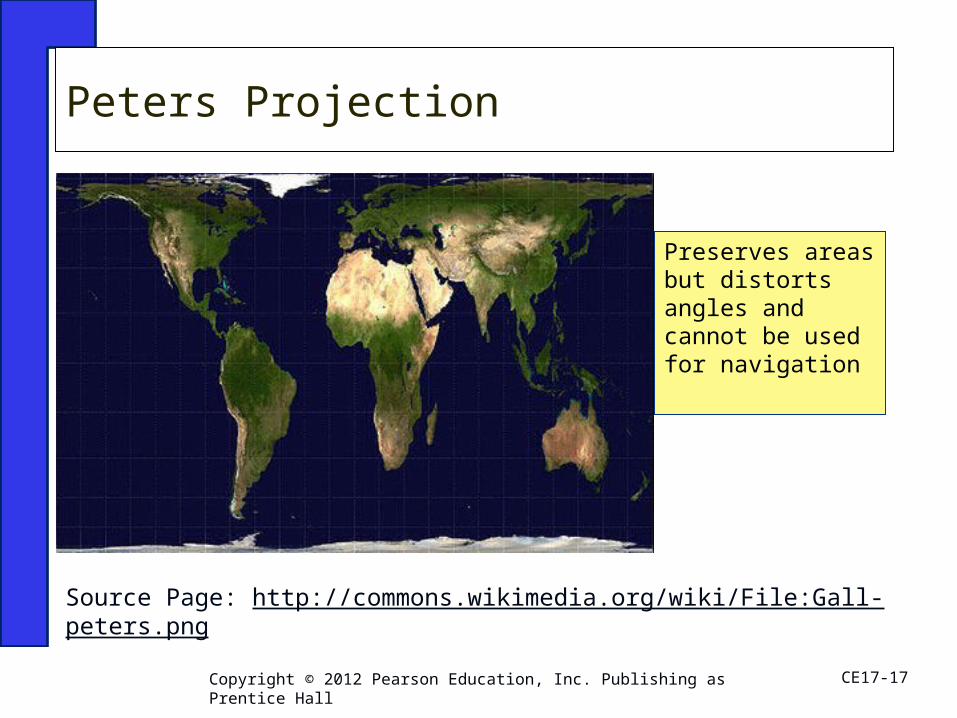
Peters Projection
CE17-17Copyright © 2012 Pearson Education, Inc. Publishing as Prentice Hall
Source Page: http://commons.wikimedia.org/wiki/File:Gall-peters.png
Preserves areas but distorts angles and cannot be used for navigation
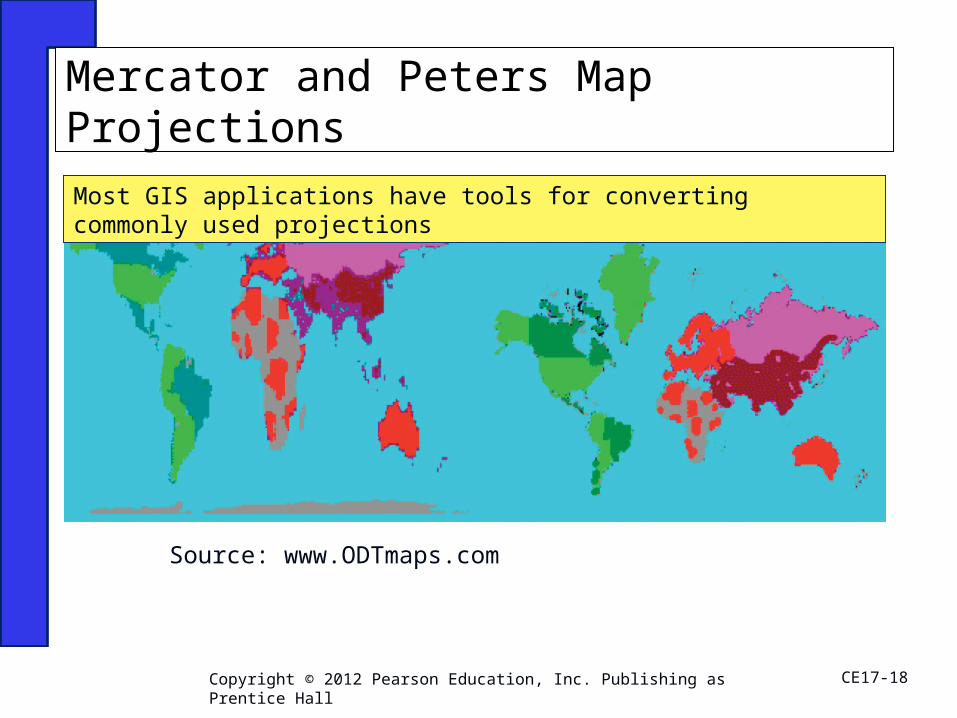
Mercator and Peters Map Projections
CE17-18Copyright © 2012 Pearson Education, Inc. Publishing as Prentice Hall
Source: www.ODTmaps.com
Most GIS applications have tools for converting commonly used projections
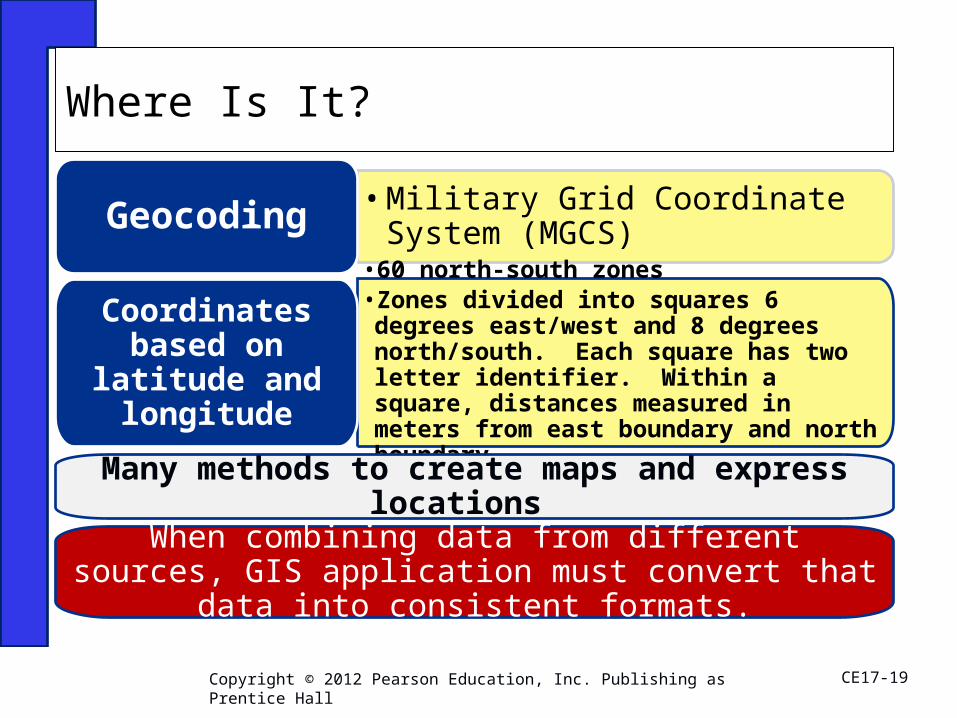
•Military Grid Coordinate System (MGCS) Geocoding
•60 north-south zones•Zones divided into squares 6 degrees east/west and 8 degrees north/south. Each square has two letter identifier. Within a square, distances measured in meters from east boundary and north boundary.
Coordinates based on
latitude and longitude
Many methods to create maps and express locations
When combining data from different sources, GIS application must convert that data into consistent
formats.
Where Is It?
CE17-19Copyright © 2012 Pearson Education, Inc. Publishing as Prentice Hall
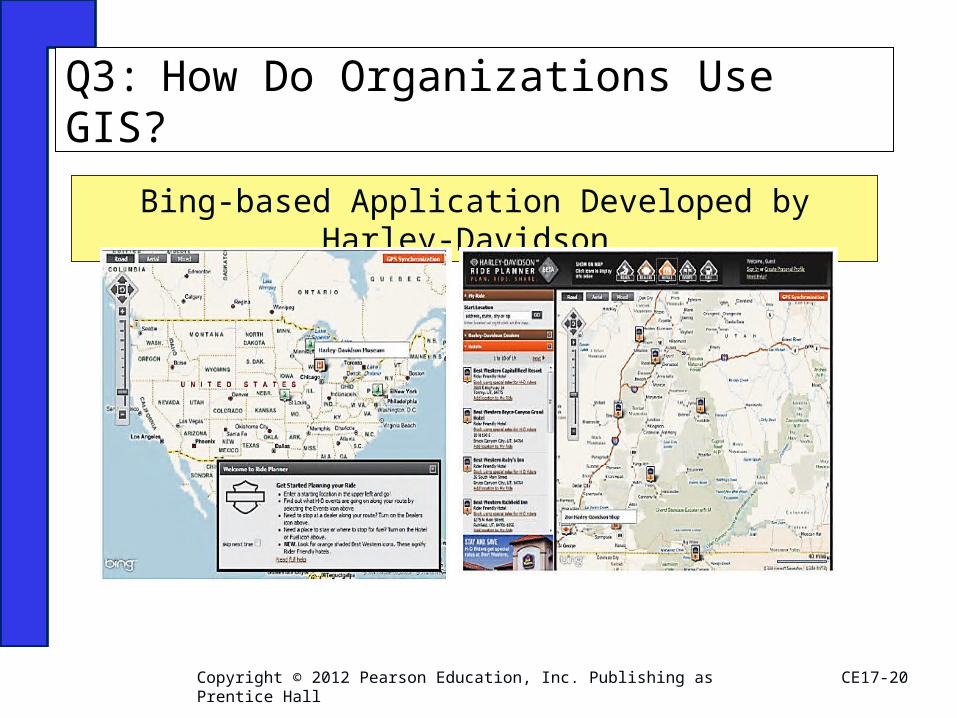
Q3: How Do Organizations Use GIS?
CE17-20Copyright © 2012 Pearson Education, Inc. Publishing as Prentice Hall
Bing-based Application Developed by Harley-Davidson
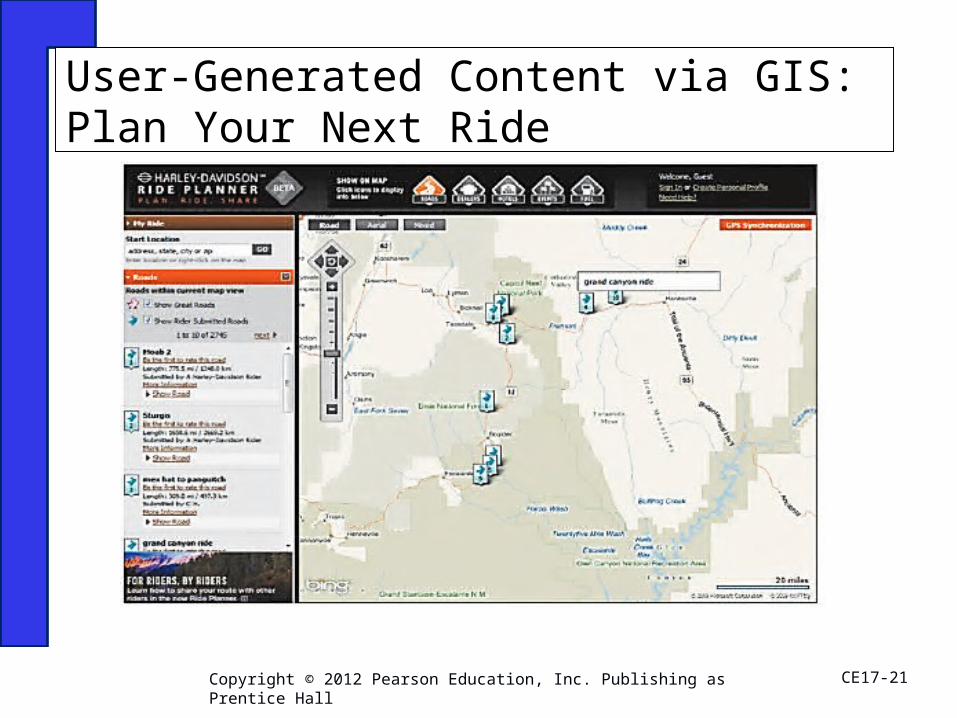
User-Generated Content via GIS: Plan Your Next Ride
CE17-21Copyright © 2012 Pearson Education, Inc. Publishing as Prentice Hall
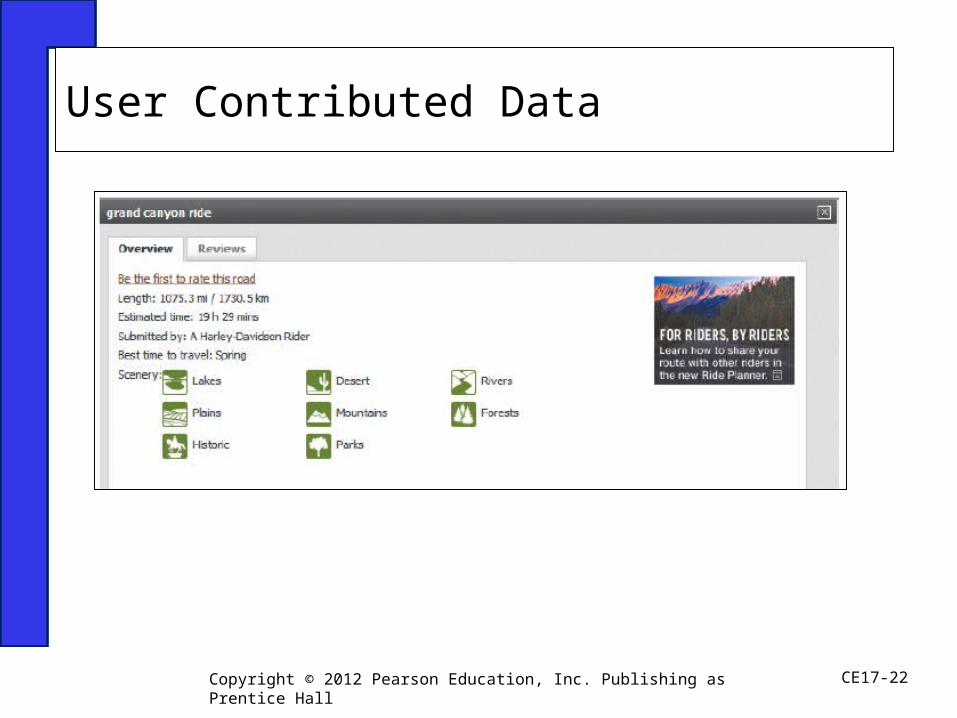
User Contributed Data
CE17-22Copyright © 2012 Pearson Education, Inc. Publishing as Prentice Hall
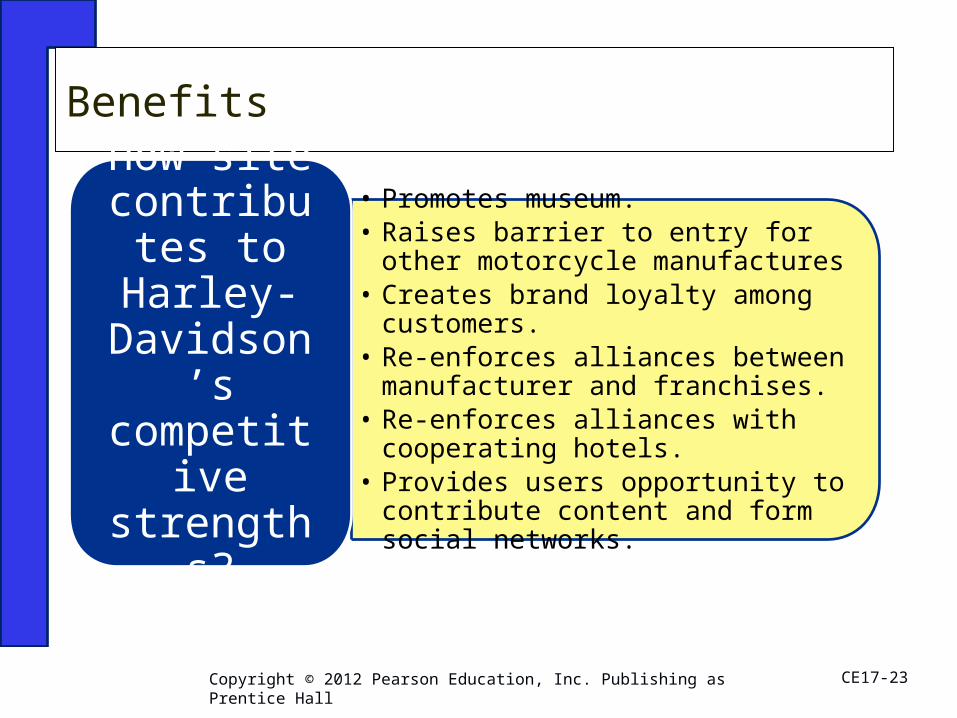
Benefits
CE17-23Copyright © 2012 Pearson Education, Inc. Publishing as Prentice Hall
• Promotes museum. • Raises barrier to entry for other
motorcycle manufactures• Creates brand loyalty among
customers. • Re-enforces alliances between
manufacturer and franchises. • Re-enforces alliances with
cooperating hotels. • Provides users opportunity to
contribute content and form social networks.
How site contribute
s to Harley-
Davidson’s
competitive
strengths?
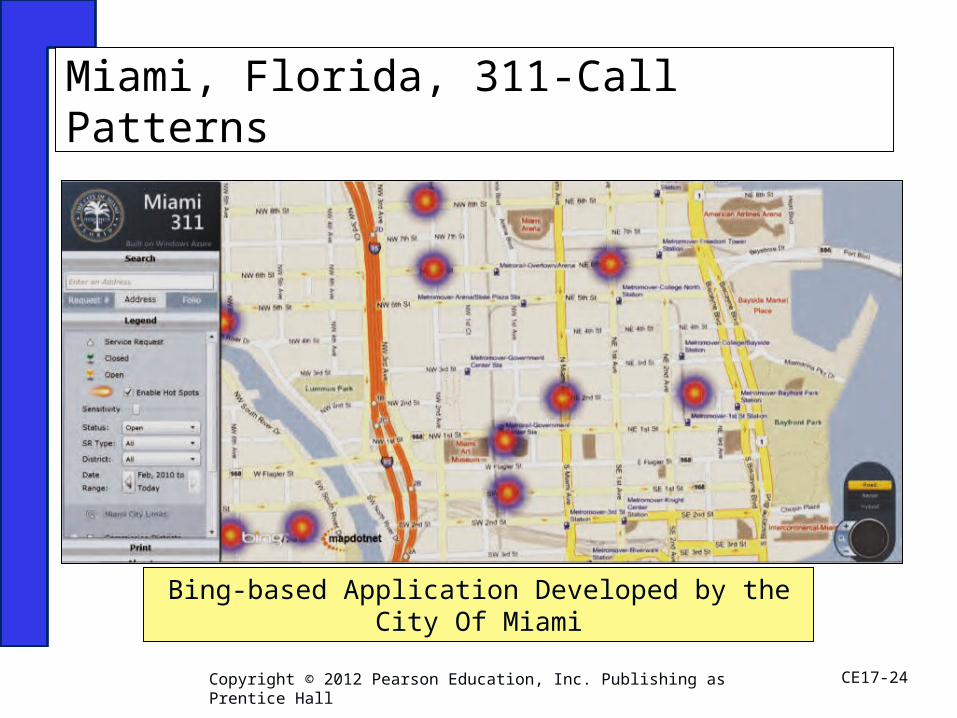
Miami, Florida, 311-Call Patterns
CE17-24Copyright © 2012 Pearson Education, Inc. Publishing as Prentice Hall
Bing-based Application Developed by the City Of Miami
Geofence: A geographic boundary set up within a GIS. One application is to notify personnel when trucks or other containers are nearing their destination.
Protect company personnel when they move into a non-safe zone.
Blue CRM is a risk management firm that provides just this capability. http://www.bluecrm.co.uk
Using GIS for Asset Tracking
CE17-25Copyright © 2012 Pearson Education, Inc. Publishing as Prentice Hall
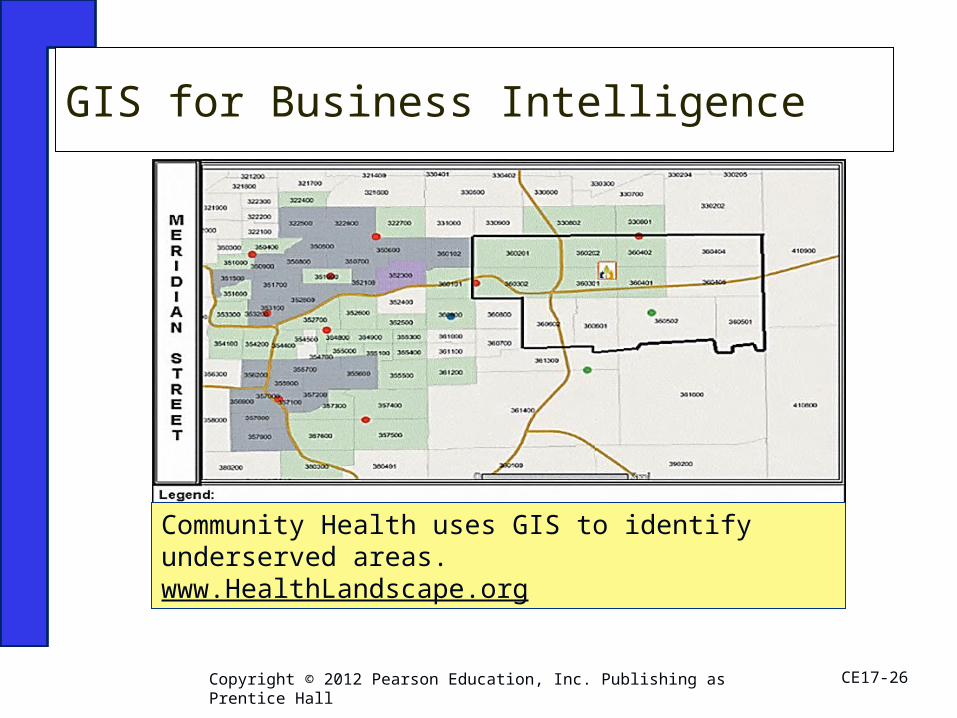
GIS for Business Intelligence
CE17-26Copyright © 2012 Pearson Education, Inc. Publishing as Prentice Hall
Community Health uses GIS to identify underserved areas.www.HealthLandscape.org
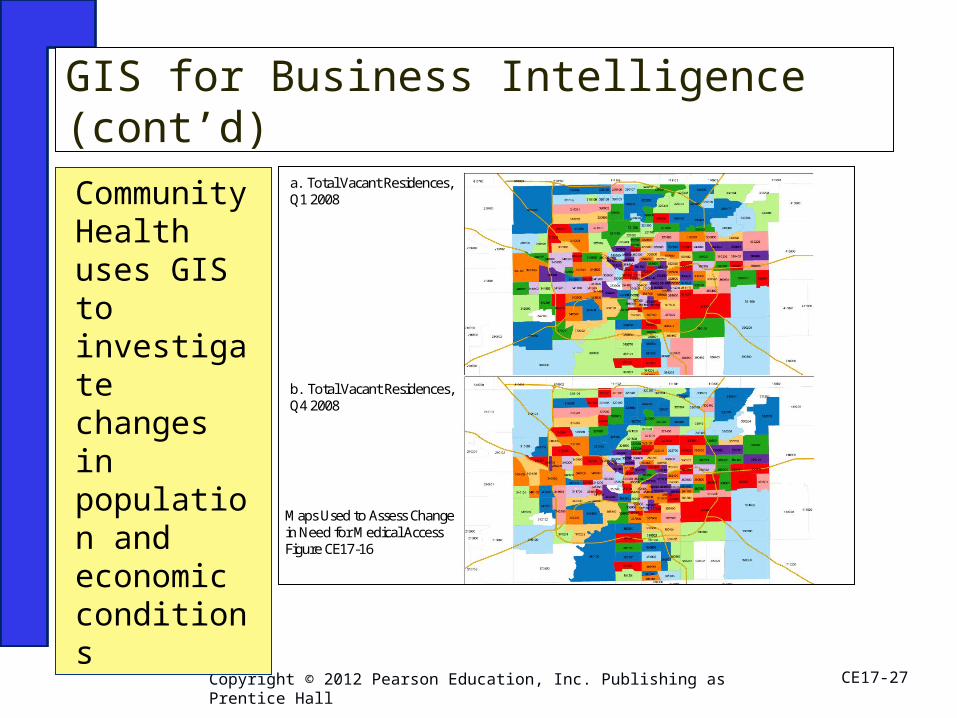
a. Total Vacant Residences,Q1 2008
b. Total Vacant Residences,Q4 2008
Maps Used to Assess Change in Need for Medical AccessFigure CE17-16
GIS for Business Intelligence (cont’d)
CE17-27Copyright © 2012 Pearson Education, Inc. Publishing as Prentice Hall
Community Health uses GIS to investigate changes in population and economic conditions
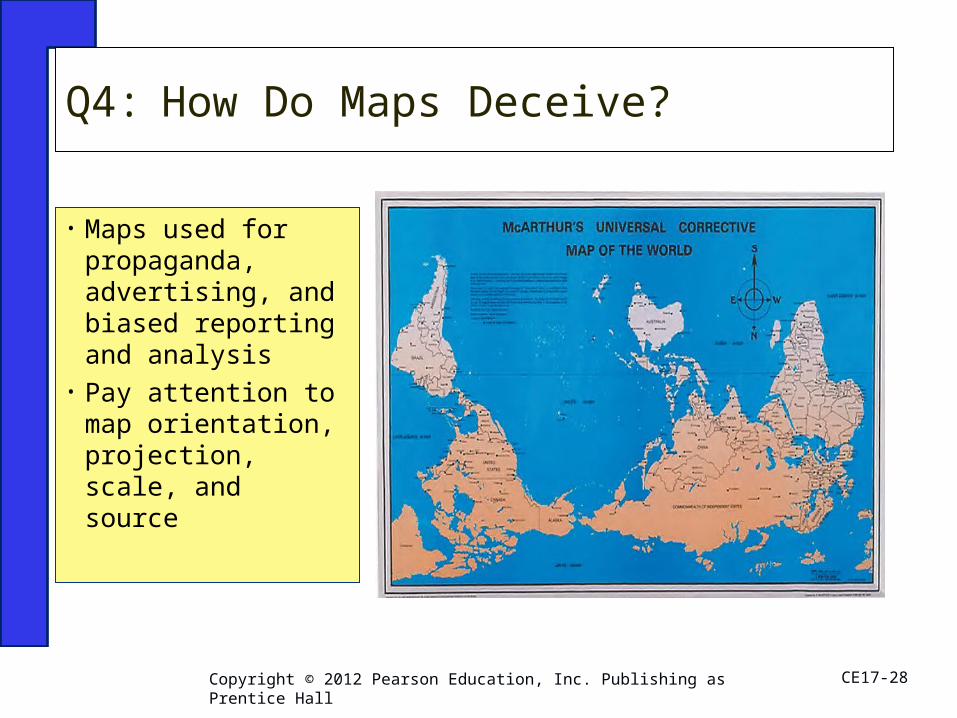
• Maps used for propaganda, advertising, and biased reporting and analysis
• Pay attention to map orientation, projection, scale, and source
Q4: How Do Maps Deceive?
CE17-28Copyright © 2012 Pearson Education, Inc. Publishing as Prentice Hall
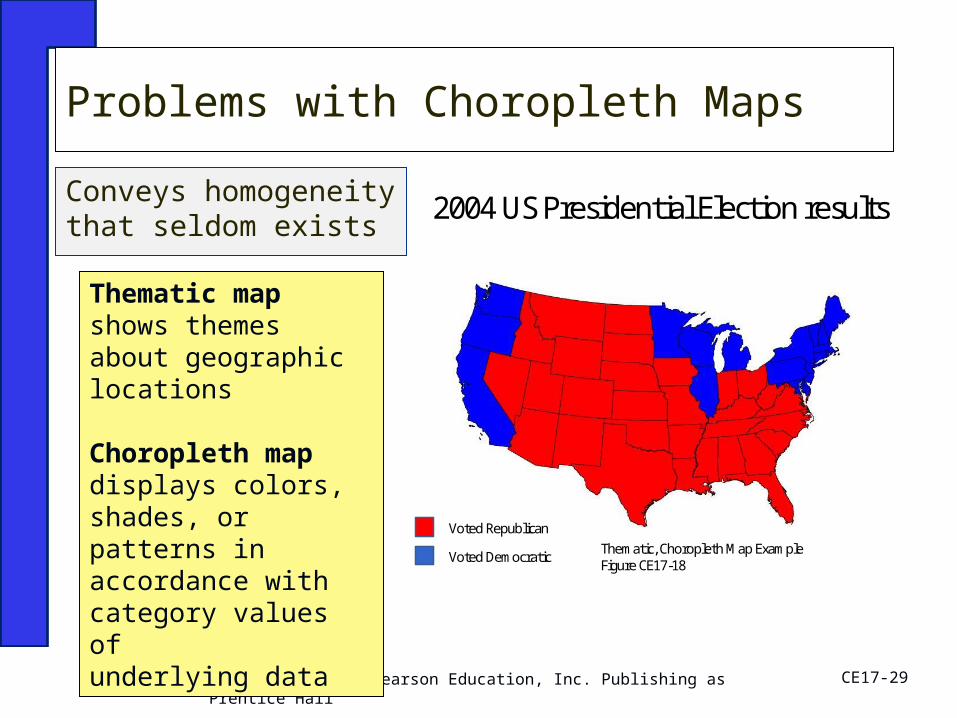
2004 US Presidential Election results
Voted Republican
Voted Democratic Thematic, Choropleth Map ExampleFigure CE17-18
Conveys homogeneity that seldom exists
Problems with Choropleth Maps
CE17-29Copyright © 2012 Pearson Education, Inc. Publishing as Prentice Hall
Thematic map shows themes about geographic locations
Choropleth map displays colors, shades, or patterns in accordance with category values ofunderlying data
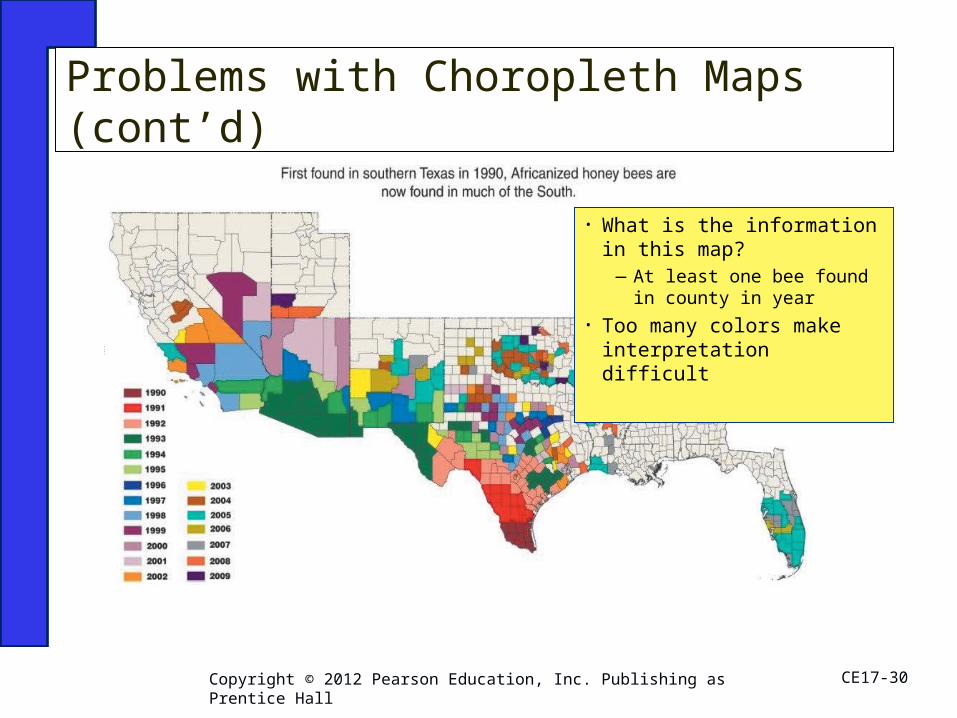
• What is the information in this map?
―At least one bee found in county in year
• Too many colors make interpretation difficult
Problems with Choropleth Maps (cont’d)
CE17-30Copyright © 2012 Pearson Education, Inc. Publishing as Prentice Hall
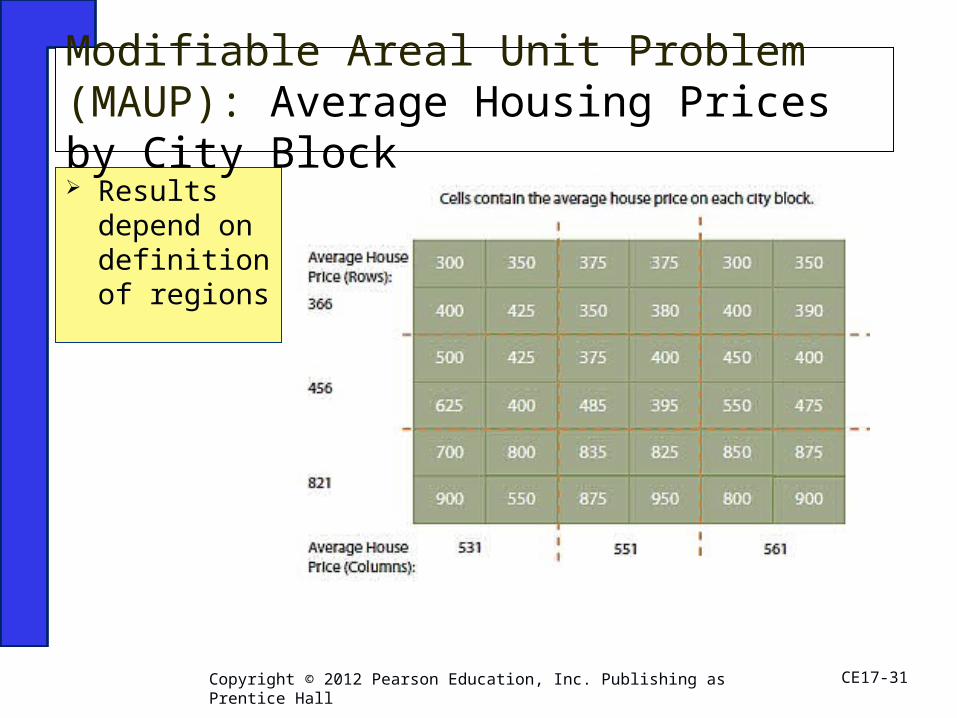
Results depend on definition of regions
Modifiable Areal Unit Problem (MAUP): Average Housing Prices by City Block
CE17-31Copyright © 2012 Pearson Education, Inc. Publishing as Prentice Hall
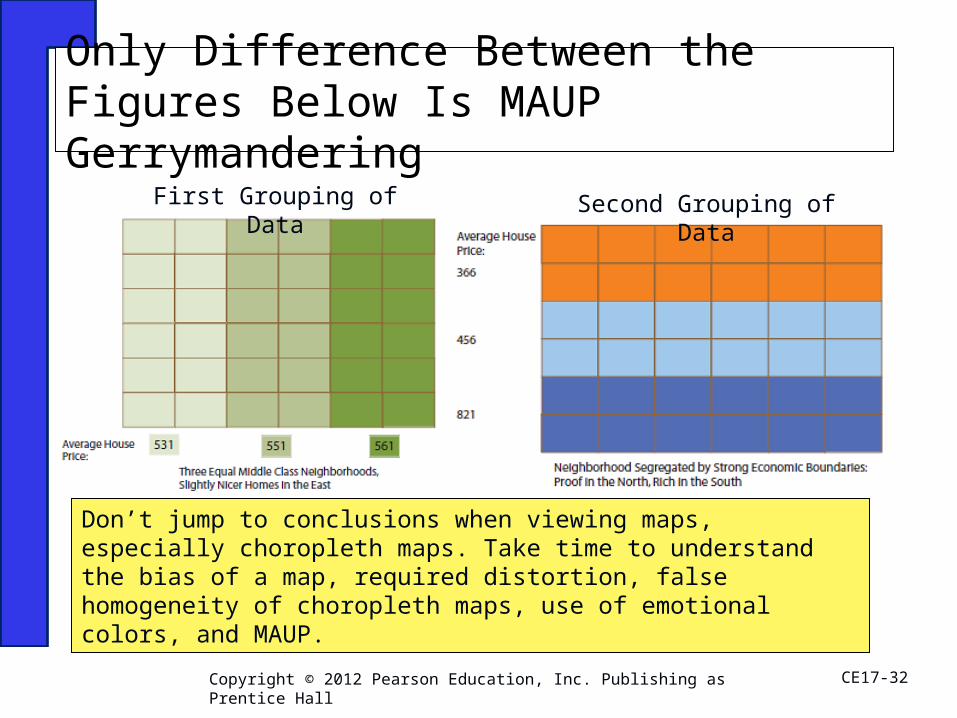
Only Difference Between the Figures Below Is MAUP Gerrymandering
CE17-32Copyright © 2012 Pearson Education, Inc. Publishing as Prentice Hall
Don’t jump to conclusions when viewing maps, especially choropleth maps. Take time to understand the bias of a map, required distortion, false homogeneity of choropleth maps, use of emotional colors, and MAUP.
First Grouping of Data Second Grouping of Data
Active Review
CE17-33Copyright © 2012 Pearson Education, Inc. Publishing as Prentice Hall
Q1: What are the components of a geographic information system?
Q2: How are GIS maps constructed?
Q3: How do organizations use GIS?
Q4: How do maps deceive?

All rights reserved. No part of this publication may be reproduced, stored in a retrieval system, or transmitted, in any form or by any means, electronic,
mechanical, photocopying, recording, or otherwise, without the prior written permission of the publisher. Printed in the United States of America.
Copyright © 2012 Pearson Education, Inc. Publishing as Prentice Hall