Embed Size (px)
Citation preview

1
Chapter for Human Genetics - Principles and Approaches - 4th Edition Editors: Friedrich Vogel, Arno Motulsky, Stylianos Antonarakis, and Michael Speicher Chapter Title: Comparative Genomics Author: Ross C. Hardison Affiliations: Center for Comparative Genomics and Bioinformatics Huck Institutes of Life Sciences Department of Biochemistry and Molecular Biology The Pennsylvania State University Mailing Address: 304 Wartik Laboratory University Park, PA 16802 Phone: 814-863-0113 FAX: 914-863-7024 E-mail: [email protected] {I do not know the chapter number, so I will substitute Q for that number throughout. That should allow a fairly reliable global replacement when the chapter number is known.}

2
Outline for Comparative Genomics Q. Comparative Genomics Q.1. Goals and basic approaches of comparative genomics Q.1.1. How biological sequences change over time Q.1.2. Purifying selection Q.1.3. Models of neural DNA Q.1.4. Adaptive evolution Q.2. Alignments of biological sequences and their interpretation Q.2.1. Global and local alignments Q.2.2. Aligning protein sequences Q.2.3. Aligning large genome sequences Q.3. Assessment of conserved function from alignments Q.3.1. Phylogenetic depth of alignments Q.3.2. Portion of the human genome under constraint Q.3.3. Identifying specific sequences under constraint Q.4. Evolution within protein-coding genes Q.4.1. Comparative genomics in gene-finding Q.4.2. Sets of related genes Q.4.3. Rates of sequence change in different parts of genes Q.4.4. Evolution and function in protein-coding exons Q.4.5. Fast-changing genes that code for proteins Q.4.6. Recent adaptive selection in humans Q.4.7. Human disease-related genes Q.5. Evolution in regions that do not code for proteins or mRNA Q.5.1. Ultraconserved elements Q.5.2. Evolution within noncoding genes Q.5.3. Evolution and function in gene regulatory sequences Q.5.4. Prediction and tests of gene regulatory sequences Q.6. Resources for comparative genomics Q.6.1. Genome browsers and data marts Q.6.2. Genome analysis work-spaces Concluding remarks References

3
Q.1. Goals and basic approaches of comparative genomics Comparative genomics uses evolutionary theory to glean insights into the function of genomic DNA sequences. By comparing DNA and protein sequences between species or among populations within a species, we can estimate the rates at which various sequences have evolved, and infer chromosomal rearrangements, duplications and deletions. This evolutionary reconstruction can then be used to predict functional properties of the DNA. Sequences that are needed for common functions in the species being compared are expected to change little over evolutionary time, whereas sequences that provide an adaptive advantage when altered are expected to have greater divergence between species. Furthermore, sequence comparisons can be used to aid in predicting what role is played by a particular functional region, e.g., coding for a protein or regulating the level of expression of a gene. Q.1.1. How biological sequences change over time All DNA sequences are subject to change, and these changes provide the fuel for evolution. Replication is highly accurate but not perfect, and despite the correction of many replication errors by repair processes during S-phase, a small fraction are retained as altered sequences. Mutagens in the environment can damage DNA, and some of these induced mutations escape repair. In addition, DNA bases can change spontaneously, for example, oxidative deamination of cytosine to produce uracil. The sequences changes that escape correction and repair will accumulate at a rate we will call the mutation rate. The average mutation rate has been estimated to be about 2 changes in 108 sites per generation (Nachman and Crowell 2000; Kondrashov 2002). Thus for a human dipolid genome of 6x10⁹bp, about 120 new mutations arise in each generation. As will be discussed later in more detail, the mutation rate varies among loci and depends on the context, with transitions at CpG dinucleotides occuring about ten times more frequently than other mutations. Mutations can be substitutions of one nucleotide for another, deletions of strings of nucleotides, insertions of nucleotides, or rearrangements of chromosomes, including duplications of DNA segments. Substitutions are about 10 times as frequent as the length-changing alterations, with transitions greatly favored over transversions. Mutations occur in individuals, and it is instructive to consider how an alteration in a single individual can eventually lead to a sequence difference between two species, which we call a fixed difference. Of course, only mutations arising in the germ line can be passed along to progeny and have some possibility of fixation. Initially, the allele carrying a mutation has a low frequency in the population, i.e. 1/(2Ne) for a diploid organism, where Ne is the effective population size. All the mating individuals in a population contribute to the pool of new alleles. Mutant alleles that are disadvantageous will be cleared out of the population quickly, whereas those that confer a selective advantage rapidly will go to fixation (occurrence in most members of a population). However, most of the new mutations will have no effect on the individual; we call these mutations with no functional consequence polymorphisms or neutral changes. The frequency of these polymorphisms will increase or decrease depending on the results of matings and survival of progeny. The vast majority will be transitory in the population, with most headed for loss. However, in the stocastic fluctuations in allele frequencies, some will eventually increase to a high frequency. Thus some of the neutral changes lead to fixed differences. In fact, Kimura (1968) and others have argued that such neutral changes are the major contributors to the overall evolution of the genome.

4
In order for a sequence change to have an effect on an organism, the change has to occur in a region that is needed for function. Examples of such regions are an exon encoding part of a protein or a promoter or other sequence involved in gene regulation. The rapid removal of disadvantageous alleles is negative or purifying selection. The rapid fixation of advantageous alleles is positive selection or adaptive evolution. Evidence of selection leads to the inference of biological funtion. Thus the aim of comparative genomics to identify functional sequences can be stated as a goal of finding DNA sequences that show significant signs of positive or negative selection.
Fig. Q.1. Three modes of evolution, two of which are associated with function. In addition to mutations of single bases, strings of nucleotides can be inserted or deleted as a result of replication errors or recombination. Often, the direction of the event is not known because it is inferred from a gap in an alignment of only two sequences. In these cases the event is called an indel. Adding a third sequence to the alignment as an outgroup allows one to conclude with some confidence whether the event is an insertion or a deletion. Indels are less frequent than nucleotide substitution, and their frequency declines sharply with the size of the insertion or deletion. However, a single insertion or deletion can involve tens of thousands of nucleotides. Thus they account for the majority of the nucleotides that differ between closely related species. Rearrangements of chromosomes, such as intrachromosomal inversions or interchromosomal translocations, also lead to large-scale changes both in contemporary populations and over evolutionary time. Some chromosomal rearrangements are associated with human disease (see Chapter ___). In comparisons over evolutionary time, e.g. between mammalian orders, the history of chromosomal rearrangements can be reconstructed with some accuracy.

5
Q.1.2. Purifying selection DNA sequences that encode the same function in contemporary species and in the last common ancestral species have been subject to purifying selection. The DNA sequence worked in the ancestor, and any changes to this successful invention are more likely to break it than to improve it. Mutations in the sequence tend to work less well than the original one, and those mutations are cleared from the population. Hence the selective pressure to maintain a function purifies DNA sequence from accumulating many changes, and the selection is referred to as purifying. This type of selective pressure tends to decrease the number of changes observed, and thus it is also called negative selection. The sequence under purifying selection is constrained by its function to remain similar to the ancestor. Saying that a sequence is subject to constraint is the equivalent of saying that it is subject to purifying selection. Examples of sequences under constraint include most protein-coding regions and many DNA sequences that regulate the level of expression of a gene. In this chapter, we distinguish between conserved and constrained elements. A feature (e.g., a segment of DNA, a protein, an anatomical structure) that is found in contemporary species and that is inferred as being derived from a similar feature in the last common ancestor is conserved. In particular, a DNA sequence that reliably aligns between two species is considered to be conserved. That does not mean necessarily that it is functional. Evidence of constraint, i.e. alignment with a level of similarity greater than expected for neutral DNA, is taken as an indicator of function. The hallmark of purifying selection is a rate of change that is slower than that of neutral DNA. The next section (Q.2.) will delve more deeply into how rates of evolution are determined, but for now assume that we can align related sequences with reasonable accuracy and can use that alignment to measure how frequently mismatches occur. Then the problem of finding sequences under purifying selection becomes one of determining the substitution rate in a segment that is a candidate for being functional and comparing it to the rate in neutral DNA. DNA segments whose inferred rate of evolutionary change is significantly lower than neutral will show a peak of similarity for comparisons at a sufficient phylogenetic distance (e.g. human versus mouse in Fig. Q.2). In order to distinguish neutral from constrained DNA, sequences of divergent species must be compared. The choice of species to compare will depend on the questions being examined, but in each case, enough sequence change must have occurred to distinguish signal from noise. In practical terms, human comparisons with chimpanzee are too close (too similar) to effectively find constrained sequences, but mutliple alignments among many primates does have considerable power (Boffelli et al. 2003). Many studies have used comparisons between mammalian orders, such as human with mouse, to see the constrained sequences (Fig. Q.2.).

6
Fig. Q.2. Ideal cases for interpretation of sequence similarity. Q.1.3. Models of neutral DNA Although the concept of DNA that has no function is very useful and has led to much insight in molecular evolutionary genetics, it is difficult to establish that any DNA is truly neutral. Several models for neutral DNA are in common use. One of the earliest is the set of nucleotides in protein-coding regions that can be altered without changing the encoded amino acid (Kimura 1977). The nucleotides are called synonymous or silent sites. They are neutral with respect to coding capacity, but alterations in particular synonymous sites can affect translation efficiency, splicing or other processes. These appear to be a minority of synonymous sites, and as a group the synonymous sites are the most frequently used neutral model. Another useful model for neutral DNA are pseudogenes. These are copies of functional genes, but the copies no longer code for protein because of some a disabling mutation, such as a frameshift mutation or a substitution that generates a translation termination codon. For the period of time since the inactivating mutation, the pseudogene has likely been under little or no selective pressure. The rate of divergence of pseudogenes after divergence is clearly higher than that of the homologous functional genes, and they have been used successfully as neutral models in many studies of particular gene families (e.g., Li et al. 1981). One limitations in using pseudogenes as a neutral model is the uncertainty of determining when the inactivating mutation(s) occurred. Also, they are rather sparse for genome-wide studies. For comparisons in mammalian genomes, ancestral repeats have proven to be effective, albeit imperfect, models for neutral DNA (Waterston et al. 2002; Hardison et al. 2003). The interspersed DNA repeats in the genomes of humans and other mammals are derived from transposable elements, mostly from those that move via and RNA intermediate, called retrotransposons. Members of an interspersed repeat family generated by recent transposition

7
(on an evolutionary time-scale) are quite similar to each other because they have not have sufficient time to diverge. These are limited to a restricted clade, such as the Alu repeats that are prevalent in primate genomes. Considerably more difference is observed among members of repeat families that are derived from transposons active in an ancestral species because of the longer divergence time. The members of these older repeat families are present in all the descendant species. Examples include LINE2 and MIR repeats, which are present in the genomes of all eutherian mammals examined. Interestingly, all the members of these ancestral repeat families are quite divergent from each other, indicating that they have not been actively transposing since the separation of the descendant species. Thus most ancestral repeats appear to be relics of ancient transposable elements, and are not active even for transposition. The vast bulk of these ancestral repeats have no apparent function. They are found frequently in eutherian mammals, and thus provide a neutral model with many sites. When interpreting any measurement or study involving a comparison with a neutral model, it is important to keep in mind that the deduced absence of function is limited by contemporary knowledge. Experimental tests and molecular evolutionary studies have shown that some individual synonymous sites and ancestral repeats are not neutral. They do not constitute the bulk of the sites in these neutral models, and of course the known functional sites can be removed from the neutral set. However, future studies could reveal additional function, which will affect interpretations based on these neutral models.
Fig. Q.3. Substitutions, insertions of transposable elements and deletions in the evolution of genomes. (A.) Illustration of functional regions such as protein-coding exons (blue boxes), cis-regulatory modules (CRMs, red ovals), such as enhancers and promoters, and ancestral repeats (brown pointed boxes). After divergence of rodents and primates, sequences diverge by substitutions (gold stars), insertion of lineage-specific transposable elments (purple and green pointed boxes, and deletions. (B.) Alignments of the contemporary species allow some of the evolutionary history to be reconstructed, including deletions inferred from the non-aligning portions.

8
Q.1.4. Adaptive evolution The functions of some DNA segments and proteins have changed along the evolutionary lineages to contemporary species. Any sequence changes that help the DNA or protein adapt to that new function are favorable. The selective pressure favoring these changes is called positive selection, since it tends to increase the frequency of changes. This leads to adaptive evolution, i.e. a change in a DNA or protein sequence that favors survival and procreation of an organism. The positive selection for new functionality is also referred to as Darwinian selection. The hallmark of adaptive evolution is a rate of sequence change that is faster than that of neutral DNA. Sequences subject ot adaptive evolution may change so much that they will not align reliably at greater phylogenetic distances (Fig. Q.1.). Also, the selective pressure leading to adaptive changes may apply only recently or in limited clades, such as among humans or among humans and great apes. Thus sequence comparisons to find adaptive changes are usually done for closely related, recently diverged sequences (Fig. Q.2.). The signal for positive selection may be captured as a significant decrease in similarity or an increase in the probability that a sequence has not evolved neutrally (Fig.Q.2.). Q.2. Alignments of biological sequences and their interpretation Biological sequence comparisons are most commonly done with protein sequences (strings of amino acids) or DNA sequences (strings of nucleotides). The comparisons begin with an alignment, which is a mapping of one sequence onto another with insertions of gaps (often indicated by a dash) to optimize a similarity score. The score can be determined in a variety of ways, but in all cases matching symbols (for amino acids or nucleotides as appropriate) are favored whereas mismatches are not favored and gaps are penalized. The gap penalty frequently takes the form of a gap-open penalty plus an additional, smaller penalty for each position included in the gap. The latter are referred to as affine gap penalties. Q.2.1. Global and local alignments A global alignment maps each symbol in one sequence onto a corresponding symbol in another sequence. The result is an alignment of the two (or more) sequences from their beginnings to their ends, with any length differences accomodated by gaps that are introduced. This is an appropriate strategy for sequences are are related to each other over their entirety. That is the case for many proteins and many mRNAs. The earliest computer program for aligning two biological sequences, written by Needleman and Wunsch (1970), generates global alignments. Popular contemporary programs for aligning proteins, such as ClustalW (Thompson et al. 1994), also compute global alignments. Global aligners for DNA sequences include VISTA (Mayor et al. 2000), MAVID (Bray and Pachter 2003) and LAGAN (Brudno et al. 2003). A frequent task in comparative genomics is to find matches between two or more sequences that are not related over their entire lengths. For instance, two protein sequences may be related only in one or a few domains, but different in other parts. The protein-coding portions of genes are frequently divided into short exons that are separated by introns. Exons tend to be under constraint whereas much of the intronic DNA may be neutral, and thus at a sufficient phylogenetic distance, introns can be so divergent that they no longer align whereas exons will match well. The most common use of comparative genomics to search a large database of all

9
compiled DNA or protein sequences with a query sequence of interest. In this case, the goal is to find a match that may comprise only one part in billions of the database. When a match between a only a portion of two or more sequences is desired, then a local alignment should be generated. One of the earliest computer programs for finding local alignments is from Smith and Waterman (1981). The blast family of programs (Basic Local Alignment Search Tool, Altschul et al. 1997) are used for database searches. One variant, called blastZ, has been adapted to compute local alignments of long genomic DNA sequences (Schwartz et al. 2003b). Q.2.2. Aligning protein sequences Proteins are composed of twenty amino acids, so for any position in one sequence the possibilities for alignment with a position in a comparison sequence is one match, nineteen mismatches or a gap. However, the likelihood for each of the nineteen mismatches is not the same. Replacment of an amino acid by a chemically similar amino acid occurs much more frequently than does replacement with a distinctly different amino acid. These different frequencies of amino acid substitutions can be captured as a scoring matrix, in which matches are given the highest similarity score and mismatches that occur frequently in protein sequences are given positive scores, decreasing with declining frequencies of the substitution. These scoring matrices are determined by the frequency that mismatches are observed in well-aligned sequences. Several effective matrices have been generated, beginning with the pioneering work of Dayhoff et al. (1978) and continuing on to the BLOSSUM matrices of Henikoff (1992).
Another important use of protein alignments is to organize relationships among the large number of sequenced proteins. Large compilations of aligned protein sequences are being generated and maintained to find clusters of genes and proteins that share a common ancestor and to find blocks of aligned sequences that may be distinctive for different domains of proteins. Indeed, when genes and their encoded proteins are predicted or identified in genome sequences, the primary basis for making inferences about their function is sequence similarity to known proteins.
Sequence similarity between proteins can be found with considerably greater sensitivity than can be found using DNA sequence. The reason is that the twenty amino acids found in proteins constitute a much more complex group of characters, or alphabet, than the four nucleotides found in DNA. Thus alignments between distantly related proteins may only match at a very small percentage of positions, but these are still statistically significant and they can be biologically meaningful. Q.2.3. Aligning large genome sequences The smaller alphabet for DNA sequences, consisting of only four nucleotides (A, C, G, T), means that the threshold for statistical significance is considerably higher than that used for protein sequences. For random sequences of equal nucleotide composition, any position in one sequence should have a 25% chance of matching any position in the other. However, sufficiently long runs of matching sequences are much less likely, and reliable alignment can be generated between related sequences. Just like for alignments of protein sequences, some substitutions are more likely to occur than others. For example, transitions are much more frequent than transversions. These preferences can be incorporated into the alignment process by using scoring matrices that were deduced from the empirical frequencies of matches and substitutions in reliable alignments.
10
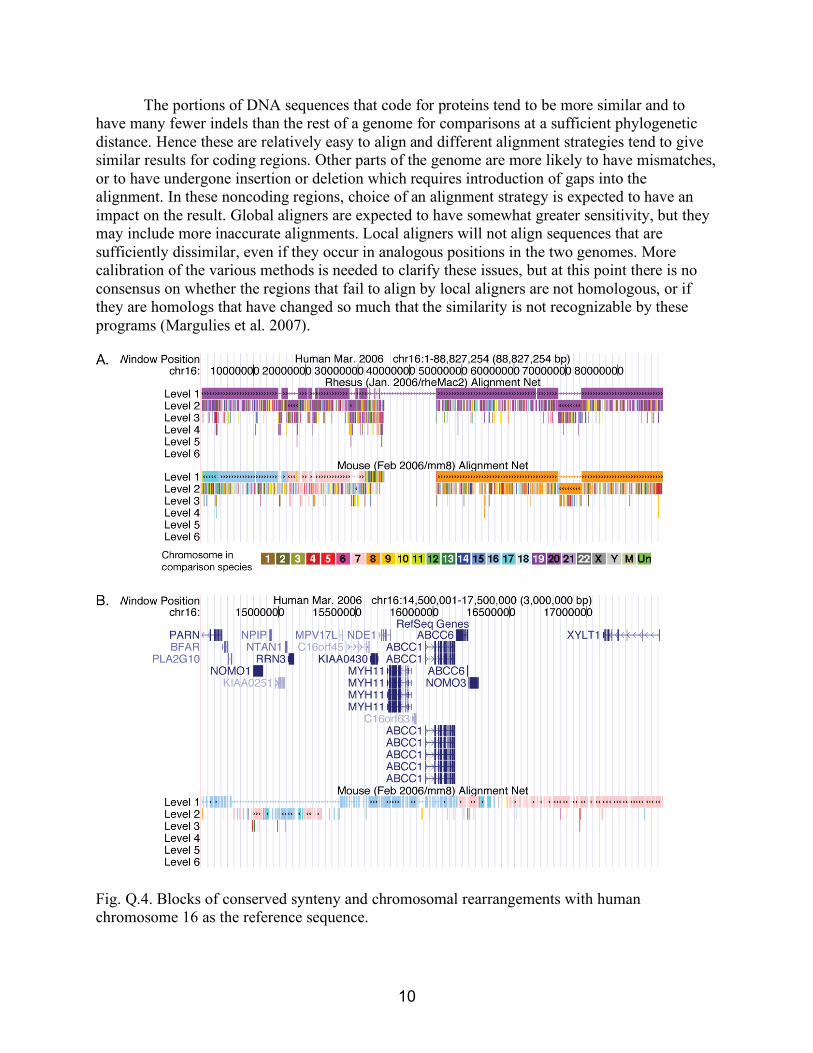
The portions of DNA sequences that code for proteins tend to be more similar and to have many fewer indels than the rest of a genome for comparisons at a sufficient phylogenetic distance. Hence these are relatively easy to align and different alignment strategies tend to give similar results for coding regions. Other parts of the genome are more likely to have mismatches, or to have undergone insertion or deletion which requires introduction of gaps into the alignment. In these noncoding regions, choice of an alignment strategy is expected to have an impact on the result. Global aligners are expected to have somewhat greater sensitivity, but they may include more inaccurate alignments. Local aligners will not align sequences that are sufficiently dissimilar, even if they occur in analogous positions in the two genomes. More calibration of the various methods is needed to clarify these issues, but at this point there is no consensus on whether the regions that fail to align by local aligners are not homologous, or if they are homologs that have changed so much that the similarity is not recognizable by these programs (Margulies et al. 2007).
Fig. Q.4. Blocks of conserved synteny and chromosomal rearrangements with human chromosome 16 as the reference sequence.

11
Chromosomal rearrangements complicate the construction of comprehensive alignments
between genomes. Genes that are on the same chromosome in one species are syntenic. Groups of genes that are syntenic in humans are frequently also syntenic in mouse, and thus these groups of genes display conserved synteny. In addition, they frequently maintain a similar order and orientation, indicating homology, which is similarity because of common ancestry. The homologous segments between distantly related species rarely extend for entire chromosomes, but rather one human chromosome will align with several homology blocks in mouse, many of which are different chromosomes in mouse (Fig. Q.4.). For genome comparisons, the goal is to find all the reliable alignments within the homology blocks and deduce how the various homology blocks are connected in genomes of the species being compared. This requires additional steps to the alignment procedure. For local aligners, it means that the large number of individual alignments need to be organized along chromosomes. For global aligners, it means that homology blocks must be identified prior to executing a global alignment.
Local alignments are restricted to the DNA segments between rearrangement breakpoints. A collection of local alignments can be organized into chains to maintain the order of DNA segments along the chromosome. In this case, local alignment A is connected to local alignment B in a chain if the beginning of the aligned sequences in B follow the ends of the aligned sequences in A. A nested group of chains, called a net (Kent et al. 2003), can be used to navigate local alignments through rearrangements (Fig. Q.4.). On a large scale, these nets can be used to illustrate chromosomal rearrangements between species, and on a smaller scale they can reveal mutliple events associated with rearrangement breakpoints Global aligners can be used in genomic regions that have not been rearranged. In practice, for whole-genome alignments, homology blocks are initially identified using a rapid local alignment procedure. Then a global aligner such as Lagan is run on the sequences in the unrearranged region (Brudno et al. 2003). Given the complexity of these alignment pipelines and the need for careful adjustment of alignment parameters for different comparisons, it is often prudent to use precomputed alignments. Nets and chains of local alignments generated by blastZ are available from the UCSC Genome Browser (Kuhn et al. 2007) and Ensembl (Hubbard et al. 2007). Precomuted alignments of whole genomes generated by pipelines using Lagan and VISTA are also available. As discussed in the next section, analyses of these alignments can be used to predict function in genomic DNA sequences. Table Q.1 lists a selection of network servers for making and viewing these alignments. Table Q.1. Selected network servers for making and viewing alignments of genome sequences Program or pipeline Name URL blastZ, nets and chains UCSC Genome Browser http://genome.ucsc.edu/ blastZ, nets and chains Ensembl http://www.ensembl.org/ VISTA and LAGAN VISTA Tools http://genome.lbl.gov/vista/index.shtml MAVID MAVID Server http://baboon.math.berkeley.edu/mavid
/ blastZ and others DCODE.org Comparative
Genomics Center http://www.dcode.org/
blastZ PipMaker http://pipmaker.bx.psu.edu/pipmaker/

12
Q.3. Assessment of conserved function from alignments Many of the sequences that are conserved between species can be found in the portions of genomes that align. As discussed above, alignment algorithms are good but imperfect, and no one can guarantee that all the conserved sequences will align, especially as the phylogenetic distance between the species increases. Nevertheless, the portions that align should have much of the conserved DNA. Within that conserved DNA is a subset that is functional; that is the portion that shows evidence of constraint, i.e. purifying selection. Thus searching genome alignments for evidence of constraint is a major, powerful approach for finding functional DNA sequences. Q.3.1. Phylogenetic depth of alignments The longer two species have been separated, the more divergent their genomes become, and thus one indicator of constraint operating on a sequence is that it aligns with sequences in distantly related species. Several insights can be gleaned by examining the phylogenetic distance at which a particular sequence or class of genomic features continues to align. As expected, most of the human genome aligns with the genomes of our closest relative, the chimpanzee, and an Old World monkey (the rhesus macaque). The genomes of the comparisons species are not finished for the most part, and thus the values in Table Q.2 will be underestimated, but they are still informative. Since almost all of the genome aligns, of course virtually all known functional regions align between human and apes or Old World monkeys. This includes coding exons (Pruitt and Maglott 2001) and putative transcriptional regulatory regions, which are deduced from high-resolution studies on occupancy of DNA by regulatory proteins (The_ENCODE_Project_Consortium 2007). When the comparison is made to genomes of eutherian mammals that are not primates, considerably less of the human genome aligns (Table Q.2). Within that 37-57% of the genome that aligns, however, we find that almost all of the coding exons (95-97%) and putative regulatory regions (74-89%) still align. Even less of the genome aligns with the marsupial opossum (about 13%). At this phylogenetic distance, the alignments of coding exons tend to persist, but only 39% of the putative regulatory regions still align. Only a small fraction of the human genome aligns to even more distant species such as chickens and fish. At this distance, the estimated substitution rate in neutral DNA (synonymous sites) is so high that a segment of neutral DNA is no longer expected to align, and thus it is highly likely that all of alignments between human and chicken or fish are in functional regions.

13
Table. Q.2. Portions of the human genome conserved and constrained between various species. Distance from human Fraction of human aligning to comparison species d Comparison species a
Divergence time (Myr) b
Substitutions per synonymous site c
Total genome e Coding exons f
Regulatory regions g
UCEs h
chimpanzee 5.40 0.015 0.95 0.96 0.97 0.99 macaque 25.0 0.081 0.87 0.96 0.96 0.99 dog 92.0 0.35 0.57 0.97 0.89 0.99 mouse 91.0 0.49 0.39 0.97 0.81 1.00 rat 91.0 0.51 0.37 0.95 0.74 1.00 opossum 173 0.86 0.13 0.87 0.39 0.98 chicken 310 1.2 0.037 0.67 0.090 0.97 zebrafish 450 1.6 0.023 0.65 0.031 0.76 Number 2.858x10⁹
nucleotides 250,607 1394 481
Notes: a Sources of genome sequences are human:
(International_Human_Genome_Sequencing_Consortium 2004), chimpanzee: (Chimpanzee_Sequencing_and_Analysis_Consortium 2005), macaque: (Rhesus_Macaque_Genome_Sequencing_and_Analysis_Consortium 2007), dog: (Lindblad-Toh et al. 2005), mouse: (Waterston et al. 2002), rat: (Gibbs et al. 2004), opossum: Broad Institute, chicken: (Hillier et al. 2004), zebrafish: Zebrafish sequencing group at the Sanger Institute.
b Divergence times for separation from the human branch to the branch leading to the indicated species are from Kumar and Hedges (1998).
c Estimated substitutions per synonymous site are from Margulies et al. (2007). d The human genomic intervals in each dataset were examined for whether they aligned with
DNA from each comparison species in whole-genome blastZ alignments (King et al. 2007). An interval that is in an alignment for at least 2% of its length was counted as aligning, but in the vast majority of cases the entire interval was aligned. The bioinformatic analysis was done by David King.
e The number of nucleotides in the human genome that align with each species was divided by the number of sequenced nucleotides in human (given on the last line).
f Coding exons are from the RefSeq collection of human genes (Pruitt and Maglott 2001). g Putative transcriptional regulatory regions were determined by high-throughput binding assays
and chromatin alterations in the ENCODE regions (The_ENCODE_Project_Consortium 2007); the set compiled by King et al. (2007) was used here.
h Ultraconserved elements (UCEs) are the ones with at least 200bp with no differences between human and mouse (Bejerano et al. 2004).
The insights about conservation of functional elements are easier to visualize when presented as a function of of phylogenetic distance (Fig. Q.5). No single comparison is adequate for all goals. Some are particularly good for one purpose, such as using human-opossum

14
alignments for examining coding regions. Almost all the coding regions still align at this distance, but only 13% of the genome aligns. Most comparisons involve a trade-off between sensitivity (the ability to find the desired feature) and specificity (the ability to reject undesired sequences). One may want to examine alignments at a sufficient distance such that no neutral DNA is aligning, but at that distance (e.g. human-chicken) a third of the coding exons and about 90% of the putative regulatory regions no longer align. This means that the specificity is excellent but the sensitivity is lower than usually desired. In practice, it is common to examine comparisons among multiple species that have given good sensitivity, such as alignments among eutherian mammals, and to apply some discriminatory function to better ascertain the regions that are constrained or show some other evidence of function. Alignments to more distant species can be included as well, but they should not be used as an exclusive filter.
Fig. Q.5. The fraction of genomic intervals that align with comparison species at increasing phylogenetic distance. The fractions of intervals in putative regulatory regions (pTRRs, red squares), coding exons from RefSeq (green triangles) and ultraconserved elements (purple diamonds) substantially exceed the fraction of the human genome (blue circles) that aligns with each species in almost all comparisons. The comparison species in increasing order of distance from human are chimpanzee, rhesus macaque, dog, mouse, rat, opossum, chicken and zebrafish (pictured above the graph). The distance is the estimated number of substitutions per synonymous site along the path in a tree from human to each species (Margulies et al. 2007). This measures takes into account faster rates on some lineages, and thus it places mouse and rat more distant from human than dog, despite the earlier divergence of carnivores.

15
The utility and limitations of examining multiple eutherian species has been studied extensively. explored in comparisons among human, mouse and rat. About 1000 megabases (Mb) align among human, mouse and rat (Gibbs et al. 2004), illustrated by the central portion of the Venn Diagram in Fig. Q.6. A similar study of human, dog and mouse revealed about 812 Mb conserved in all three (Lindblad-Toh et al. 2005). This approximately 1 Gigabase of genome sequence found in common can be considered the core of the genome of placental mammals. The DNA sequences needed for functions common to all eutherians is expected to be in this core, and indeed virtually all coding exons and putative regulatory regions are found in it (Table Q.2). However, it seems unlikely that all of this core is under constraint. About 162 Mb of the core consists of repetitive DNA that is ancestral to primates and rodents (Fig. Q.6.). As discussed above this is the source of one useful model for neutral DNA. Granted that some of these ancestral repeats may indeed be functional, it is unlikely that all of this is functional. Hence even in the approximately 800 Mb of the core that is nonrepetitive, it is expected that some and maybe much also lacks a function conserved in all eutherians. This illustrates the need for further discrimination of constrained sequences from those that conserved but are apparently neutral. Fig. Q.6. also shows that the rat and mouse genomes share many DNA sequences that are not in human, and about 358 Mb are nonrepetitive. One may expect to find rodent-specific functional sequences in these portions of the mouse and rat genome. Genomic DNA sequences that are found only in rat or only in mouse are dominated by lineage-specific interspersed repeats.
Fig. Q.6. Venn Diagram showing common and distinctive sequences in humans and two rodents. As summarized in the key (box under the diagram), the outlined ellipses represent the DNA in each genome, and the overlaps show the amount of sequence aligning in all three species (rat, mouse and human) or in only two species. Portions of the ellipses that do not overlap represent sequences that do not align. Different types of repeatitive DNA are shown as colored disks, and

16
are classified by their ancestry. Those that predate the divergence between rodents and primates are grey, and those that arose on the rodent lineage before the divergence between rat and mouse are lavender. Disks for repeats specific to each species are colored orange for rat, green for mouse, and blue for human; and disks for simple repeats are colored yellow. The disks for the repeats are placed to illustrate the approximate amount of each type in each alignment category. Uncolored areas represent non-repetitive DNA; the bulk is assumed to be ancestral to the human–rodent divergence. The numbers of nucleotides (in Mb) are given for each sector (type of sequence and alignment category). Reprinted from Gibbs et al. (2004) with permission from Macmillan press. Q.3.2. Portion of the human genome under constraint Within the subset of the human genome that aligns with other species, we want to know what fraction of it appears to be under constraint (covered in this section), and then to be able to identify the constrained sequences (covered in the next section). One way to estimate the portion of the human genome under constraint is to evaluate all the segments that align with a comparison species for a level of similarity higher than that seen for neutral DNA. This would be a straightforward approach if we knew all the neutral DNA (which we do not, see section Q.1.3.), and if the neutral DNA diverged at the same rate at all positions in the chromosome (illustrated by the ideal case in Fig. Q.2.). However, the estimated neutral rates show substantial local variation across the human genome (Fig. Q.7). This has been seen for comparison of the human genome with mouse (Waterston et al., 2002, Hardison et al., 2003), dog (Lindblad-Toh et al. 2005) and chimpanzee (Chimpanzee_Sequencing_and_Analysis_Consortium 2005). Thus estimates of constraint need to take into account the local rate variation.
Fig. Q.7. Variation in the rate of human-mouse divergence in neutral DNA along human Chromosome 22. The substitutions per site in ancestral repeats (tAR ,red) and in and in the subset of synonymous sites that are four-fold degenerate (t4D ,blue) were estimated in 5 Mb windows, overlapping by 4 Mb. The horizontal dotted lines indicate the estimates of tAR and t4D across the entire human genome. The confidence intervals are shown as brackets; the places where the confidence interval lies outside the genome-wide estimate are those with significant differences

17
in evolutionary rate. Reprinted from Waterston et al. (2002) with permission from Macmillan press. This was done initially for the comparison of the human and mouse genomes (Waterston et al. 2002). Alignments throughout the genomes were evaluated for a level of similarity that exceeds the similarity expected from the amount of divergence in ancestral repeats in the vicinity. The distribution of similarity scores in ancestral repeats is normal, and many alignment similarity scores in the bulk of the genome overlap with those in the neutral distribution (Fig. Q.8). Notably, a pronounced shoulder of alignments present a score higher than the scores for a vast majority of ancestral repeats. The complex distribution of alignment scores through the genome can be interpreted as the combination of two distributions, one for neutral DNA and one for DNA that is under constraint. Various models lead to the conclusion that about 5% of the human genome falls into latter distribution. A similar estimate has been obtained for alignments of the human genome dog (Lindblad-Toh et al. 2005). In support of the idea of a conserved eutherian core genome that encompasses the sequences with common function, the human sequences inferred to be under constraint are the same whether the comparison is with dog or mouse (Lindblad-Toh et al. 2005).
Fig. Q.8. Decomposition of conservation score into neutral and likely-selected portions. S is the conservation score adjusted for variation in the local substitution rate. The frequency of the S cores for all 50bp windows in the human genome, after alignment with mouse, is shown as the blue distribution. The frequency of S scores for ancestral repeats are shown in red. The inferred distribution of scores for regions under constraint is shown in light grey and light blue. This represents about 5% of the human genome. The figure is reprinted from Waterston et al., 2002, with permission from Macmillan Press (Nature). This result tells us that about 5% of the human genome has been under continuous purifying selection since the divergence of primates from carnivores and rodents, approximately 85 to 100 million years ago. The functions that would be subject to the continuous selection are those that were present in a eutherian ancestor and continue to play those roles in contemporary

18
primates, rodents and carnivores (and likely all eutherians). This is a lower bound estimate of the portion of the human genome that is functional. DNA sequences that have diverged for new functions in different lineages are not included in this estimate, nor are sequences that have acquired function recently through adaptive evolution. Thus the portion of the human genome that is functional is certainly higher than 5%, but it is not possible with current knowledge to place an upper bound on the estimate. The lower bound estimate of the portion under continuous constraint is a remarkable number. The portion of the human genome needed to code for proteins has been estimated at about 1.2%, with another 0.7% corresponding to untranslated regions of mature mRNA (International_Human_Genome_Sequencing_Consortium 2004), for about 2% of the genome devoted to coding for mRNA. This leaves about 3% of the human genome with sequences that carry out functions common to eutherian mammals. Among these additional sequences under constraint should be genes for noncoding RNAs and DNA sequences that regulate the level of expression of genes. It is striking that the fraction of the genome devoted to the conserved noncoding functions is greater than the fraction needed to code for proteins. Q.3.3. Identifying specific sequences under constraint In order to find particular functional sequences, it is necessary to identify specific sequences whose alignments are likely to be in the portion under constraint. In principle, it a matter of finding segments with a similarity score above the neutral background (Fig. Q.2). Of course, it is important to adjust the analysis for variation in local substitution rate, as just discussed. For example, from the distribution of S scores in ancestral repeats (Fig. Q.8) based on pairwise human-mouse alignments, one can compute a probability that a given alignment could result from the locally adjusted neutral rate. Those that are unlikely to result from neutral evolution between humans and nonprimates are likely to be under constraint. Other measures have been developed to utilize the greater amount of information in multiple sequence alignments to identify constrained sequences. One measure is based on modeling the genome as having two states of “conservation”, one that is effectively neutral and one that is the slowly-changing, constrained state. By combining phylogenetic models with Hidden Markov models of those states, a score called phastCons is computed that gives the posterior probability that any aligned position came from the constrained state (Siepel et al. 2005). This measure is routinely computed genome-wide for several sets of genome alignments, and is accessed as the “Conservation” track on the UCSC Genome Browser (Fig. Q.9). Note that it has a form similar to the idealized case in Fig. Q.2., with higher peaks associated with a greater likelihood of being constrained.
A constrained sequence is one that had an opportunity to change because it was mutated in an individual in a population, but the mutation was not fixed in the genome sequence of the species because of selective pressure against the change. Thus there could have been a substitution, but it was rejected by purifying selection. Another measure of constraint, called Genomic Evolutionary Rate Profiling or GERP (Cooper et al. 2005), explicitly models this process and estimates the number of “rejected substitutions.” (Fig. Q.9) Another method, binCons, models the substitution frequency as a binomial distribution, with the contribution of alignments of different species weighted according to their phylogenetic distance from the reference species (Margulies et al. 2003).

19
Fig. Q.9. PhastCons and GERP in a portion of ENCODE region ENm001. The first three exons (blue boxes) and introns (lines with arrows showing the direction of transcription from right to left) of the gene WNT2 are shown on the top line. The next two panels plot the phastCons and GERP scores, respectively, with higher values indicating a higher probability that a sequence is under constraint. The bottom panel shows the levels of multispecies conserved sequences (see text).
In a region evaluated by these methods, some segments are identified as being under
constraint by all three, and others are found by only one. Each approach has value, and each has some unique advantages and some idiosyncratic problems. Thus it is useful to combine the output of each to generate sets of “multispecies conserved sequences” (Margulies et al. 2007; The_ENCODE_Project_Consortium 2007). The strict, moderate and relaxed sets correspond to the MCSs found by intersection, inclusion in at least two, or the union of the three sets. The example shown in Fig. Q.9 shows strong constraint not only in the coding exons but also in the introns. Experimental tests on two of these intronic constrainted elements show that they affect the level of expression from a linked promoter (Schwartz et al. 2003a). Q.4. Evolution within protein-coding genes Comparative analysis of protein-coding genes requires several steps. First, a set of protein-coding genes must be defined in each species, and then a set of orthologous genes shared among the species is examined. With this, the rates of change among proteins can be computed and then one can study how those differences in rates correlate with function. Most protein-coding genes are under significant constraint over the course of mammalian evolution. However, genes whose products have roles in reproduction, chemosensation, immunity and metabolism of foreign compunds are found consistently to be changing more rapidly than other genes. Thus these are some of the functional classes that determine species-specfic functions. Q.4.1. Comparative genomics in gene-finding One of the most important tasks in genomics is to identify the segments of DNA that code for a protein. As covered in Chapter ___, most eukaryotic genes are composed of exons, which code for mRNA, and introns, which are transcribed but spliced out of the mature mRNA. Most internal exons encode a portion of the protein product of the gene, and the initial and terminal exons also contain untranslated regions of the mRNA. Most protein-coding exons can be identified by a variety of approaches. However, combining the exons into genes, including accurate determination of the initial exon (or multiple initial exons), is more of a challenge. The several approaches for finding exons and genes can be divided into two categories: evidence-based and ab initio. Evidence-based methods use information about mRNAs, such as complete mRNA sequences, expressed sequence tags (ESTs), which are short sequences

20
containing portions of a very large number of mRNAs, and tags of sequence derived from the 5’ capped ends of mRNAs. These are aligned with genomic regions, along with information about pre-mRNA splicing signals, to find exons. In order to find likely exons of genes whose mRNA sequences are not in the databases, ab initio methods based on models derived from basic knowledge about gene structure are applied. The genetic code and rules for splice junctions (Chapters ____) provide the rules that make up the basic grammar for encoding proteins. Hidden Markov models such as those in the programs genscan (Burge and Karlin 1997) and genmark (Henderson et al. 1997) are used to find likely exons and likely arrangements for these exons in genes.
Adding alignments of sequences of other species can improve gene prediction. Two commonly used methods are Twinscan (Wu et al. 2004) and SGP (Wiehe et al. 2001); these build on the models in genscan but also apply rules from comparative approaches, such as allowing mismatches at degenerate sites in the genetic code. Another program, exoniPhy (Siepel and Haussler 2004), uses the grammar of protein coding and a phylogenetic analysis of multispecies alignments to improve exon finding.
Often the initial and final exons do not code for protein, and thus the ab initio predictors no longer benefit from the well-known rules for encoding proteins. Furthermore, it is not uncommon for a gene to have multiple initial exons, with some used at particular times of development or in certain tissues. Thus the accuracy of fully assembling genes from exons is enhanced by evidence such as mRNA sequences and tags derived from the 5’ ends of mRNA. Powerful pipelines for gene annotations have been developed that combine both evidence-based and ab initio methods; one of the most widely used is the Ensembl automatic gene annotation system (Curwen et al. 2004). In the current assembly of the human genome (NCBI build 36, March 2006, hg18), the Ensembl pipeline predicts 270,239 exons. These are arranged into 44,537 mRNAs from 21,662 genes. Most genes code for multiple mRNAs, thereby greatly increasing the diversity of proteins encoded in the human genome. Of these exons and genes, how many are found in other species, and which contribute to lineage-specific characteristics? Q.4.2. Sets of related genes When discussing genes that are shared among species, we want to find the genes that are derived from the same gene in the last common ancestor. Homologous genes that separated because of a speciation event are orthologous. When there is a simple 1:1 relationship between orthologous genes, such as for RRM1 in Fig. Q.10, then any differences between the genes can be interpreted as changes since the time of divergence of the species. When homologous genes are members of multigene families, then it is important to distinguish genes that have separated as a result of gene duplication (paralogous genes) from the orthologous genes, which separated by speciation events (Fig. Q.10). For instance, the beta-like globin genes in humans arose by duplication in mammals. Within this gene family, each gene is paralogous to the other. For example, HBE1 and HBB are paralogs that resulted from an earlier duplication, whereas HBG1 and HBG2 are paralogs that duplicated recently. Each of the four beta-like globin genes in chickens are paralogous to the other three, again because of the duplication history.

21
Fig. Q.10. Orthologous and paralogous relationships among genes. When gene duplications have ocurred independently in both lineages, then all the duplicated genes in one species are orthologous to each of the genes in the other lineage. This is a many-to-many orthologous relationship. The human HBB gene is equally distant from each of the chicken beta-like globin genes, and it is orthologous to each. Frequently a comparison will involve multigene families in species that share a duplication history. In these cases, the genes that arose from duplication before speciation have 1:1 orthologous relationships, and these orthologs will be more similar than are paralogs resulting from the same duplication. These are the cases where correct assignments of paralogous and orthologous relationships are particularly important. For instance, a paralogous comparison will lead to a conclusion of greater sequence change since speciation than would an orthologous comparison. Once gene sets have been defined in two or more species, then orthologous gene sets can be determined. For the cases of 1:1 orthologs, reciprocal highest similarity is a good guide to orthologous relationships. The more complicated cases for multigene families can be summarized as many-to-many orthologous relationships. Fig. Q.11 shows the results of comparisons of protein-coding genes among human (Homo sapiens), chicken (Gallus gallus) and the teleost fish Fugu rubripes (Hillier et al. 2004). Of the almost 22,000 genes annotated in humans in this study, about a third are in 1:1:1 orthologous relationships with chicken and Fugu, and about 5% are in many-to-many relationships. About a third of the genes have clear homologous but cannot be definitively assigned as orthologous. Intriguingly, about 4,000 human genes do not have a clear homolog in either chicken or fish. These may encode mammal-specific functions.

22
Fig. Q.11. Homology relationships among protein-coding genes in human (Homo sapiens), chicken (Gallus gallus) and the fish Fugu rubripes. Genes in the three species are grouped by their orthology relationships among the three species (1:1:1 or n:n:n for many:many:many) or among two species if the gene is not detected in a third species. Genes that are clearly related between species but for which clear orthology relationships cannot be determined are placed in the “Homology” class. Genes not falling in the orthology or “homology” classes are considered “Unique”. Reprinted with permission from Hillier et al. 2004 (Nature, Macmillan Press). Q.4.3. Rates of sequence change in different parts of genes Within the set of 1:1 orthologous genes, the amount of sequence similarity can be determined in each of the basic parts of a gene. One of the first genome-wide studies in mammals compared human genes with mouse genes (Waterston et al. 2002), and it confirmed many insights from smaller scale studies. The protein-coding exons are the most similar between human and mouse, showing about 85% identity (Fig. Q.12). The regions adjacent to the splice junctions show peaks of higher identity, reflecting the selection on both coding potential and on splicing function. The introns have the lowest similarity, but they are considerably more similar than is DNA in ancestral repeats, the neutral model, which are about 60% identical. The untranslated regions of exons are about 75% identical. The higher percent identity in the untranslated regions and introns, compared to the neutral model, indicate that some portion of these sequences are under constraint. Intronic regions that provide important functions are splicing enhancers and transcriptional enhancers. In the 3’ untranslated region can be found targets for regulation by miRNAs as well as the polyadenylation signals. These short segments can be subject to stringent constraint. If all the intronic and untranslated sequences were subject to such stringent constraint, then their overall percent identity would be closer to that of the coding regions. Thus one interpretation of these results is that intronic and untranslated regions contain short constrained segments interspersed within larger regions with little or no signature of purifying selection.

23
Fig. Q.12. Sequence identity between human and mouse in a generic gene. Within a group of 3,165 RefSeq genes that aligned between the mouse and human genomes, 200 evenly spaced bases across each of the variable-length regions were sampled between human and mouse.The average percentage of bases aligning is shown by the blue line and the average base identity is shown by the black line. Used with permission from Waterston et al. 2002 (Macmillan Press). Q.4.4. Evolution and function in protein-coding exons From the earliest comparisons of homologous protein sequences, it was recognized that some proteins change little between species. A classic example is histone H4, which has only one amino acid replacement between peas and cows. Other proteins change rapidly. Among the most rapidly changing proteins are the fibrinopeptides, which are segments of fibrinogen molecules that are cleaved off by thrombin during blood clotting. It appears that the amino acid sequence of the fibrinopeptides is not critical for their function, and they are under little or no selective pressure. Interspecies comparisons of even a modest number of proteins showed that the rate of changes in amino acids ranged over 100 fold (Nei 1987). Some proteins, such as histones, are under stringent selection over most of their sequence, whereas others seem to be free to change extensively – or have been adapted to new function. Comparisons of the protein-coding genes for entire mammalian genomes provides the opportunity to examine these issues more comprehensively. The sets of related genes between species can be analyzed to show which genes are under strong purifying constraint and which shows signs of adaptive evolution. For protein-coding genes, it is common to consider substitutions at synonymous sites to be neutral. The number of synonymous subsitutions per synonymous sites in two species is called KS. This can be used as an estimate of the neutral rate. Then the number of nonsynonymous substitutions per nonsynonymous site, or KA, can be compared to KS to obtain an estimate of the stringency of the purifying selection or the strength of adaptive evolution. As a rule of thumb, a KA/KS ratio of 0.2 for human-mouse comparisons is indicative of constraint, whereas ratios of 1 or greater indicate adaptive evolution.

24
Fig. Q.13. Cumulative distribution of KA/KS values for mouse proteins compared with human homologs. The distribution of scores for proteins that are clearly orthologous between human and mouse is shown by the red points and line. The distribution of scores for for proteins encoded by locally duplicated, paralogous mouse-specific gene clusters is shown by the black points and line. Used with permission from Waterston et al. (2002) ; published by Macmillan Press. In a study of orthologous genes aligned between mouse and human (Waterston et al. 2002), about 80% show an overall signal for constraint (Fig. Q.13). Very few show evidence of positive selection over their entire length. Thus at the phylogenetic distance of mouse and human, evolution of protein-coding sequences in orthologous genes is dominated by constraint. This result indicates that the matching, orthologous segments code for proteins that provided a function in the ancestor, and their descendant sequences provide a similar function in contemporary species. Many changes in the encoded amino acid sequences have been selected against because they did not improve the function of the protein. We note that short segments or single codons under positive selection would not be detected in this test, and that will be addressed later.
In contrast, the set of paralogous genes compared between mouse and human are shifted to higher KA/KS ratios. Thus the paralogous genes are more likely to be undergoing adaptive evolution (positive or diversifying selection) than are the orthologous genes. The multigene families are major contributors to lineage-specific function. Duplication of genes leaves at least one copy free to accumulate changes that can provide an adaptive advantage. In constrast, genes that remain as single copies are constrained to fulfill the role that they have played since they arose in some distant ancestor. Q.4.5. Fast-changing genes that code for proteins The families of fast-changing genes appear to be adapting to new pressures in a lineage-specific manner. An examination of the types of gene families with this property should provide insights into the types of pressures that lead to adaptive changes. A remarkably consistent result has been found in multiple studies of this question. The four general categories of reproduction, chemosensation, immune response and xenobiotic metabolism (breakdown of drugs, toxins and other compounds not produced in the body) encompass many of the genes and gene families

25
subject to positive selection. Thus these are the major physiological functions in which rapid sequence change leads to adaptive evolution. For example, the locally duplicated gene families with relatively high KA/KS values fall into distinct functional classes (Figure Q.14). Members of the major categories for adaptive evolution (reproduction, chemosensation, immune response and xenobiotic metabolism) are apparent. For example, the mouse Rhox genes on chromosome X (called Hox (X) in Fig. Q.14) are homeobox genes expressed in male and female reproductive tissue, and targeted disruption of the Rhox5 gene leads to reduced male fertililty (Maclean et al. 2005).. Another example is the oocyte-specific homeobox gene Obox on mouse chromosome 7. The Obp gene cluster encodes odorant binding proteins such as lipocalins and aphrodisin, involved in both chemosensation and reproduction. Immune response genes include the MHC I genes on chromosome 17, which regulate the immune response, the Wfdc15 gene (called Elafin (2) in Fig. Q.14), which encodes an antibacterial protein, and the Defb genes on chromosome 8 (called Bdp in ig. Q.14) encoding beta-defensins. Several adaptive genes are involved in xenobiotic metabolism, including members of the cytochrome P450 gene family, Cyp4a and Cyp2d, and a glutathione-S-transferase gene (GST). Additional studies of lineage-specific expansions of gene families in comparisons of rat and mouse (Gibbs et al. 2004) and of humans and chickens (Hillier et al. 2004) identify the same general categories of reproduction, chemosensation, immune response and xenobiotic metabolism. Thus along multiple lineages, these gene families are implicated in adapting to unique pressures on each species. Enrichment of these functional categories for genes implicated in adaptive evolution can be readily rationalized. Changes in genes involved in reproduction and chemosensation could lead to or maintain the differences that cause divergence of species. Adaption of immune function and the ability to metabolize foreign compounds are important for survival in the distinctive environment of each species. Other families with rapid changes between species include keratins, which are involved in making feathers in birds but hair in mammals.
Fig. Q.14. b, Box plot of KA/KS values for different locally duplicated, paralogous mouse-specific gene clusters. The chromosome on which the clusters are found is indicated in brackets after the abbreviated cluster name. The KA/KS values for each sequence pair in the cluster was calculated from sequences aligned using ClustalW (see Supplementary Information). The red

26
horizontal line represents the median and the box indicates the middle 67% of the data between the 16th and 83rd percentiles. All of the paralogous clusters have median KA/KS values that are higher than the mouse–human orthologue median KA/KS (0.115), and 22 out of 25 have values greater than the 83rd percentile orthologue KA/KS (0.275). The Cyp2d category includes KA/KS values calculated separately over two sequence-similar regions in the alignment.” Used with permission from Waterston et al. (2002); published by Macmillan Press. Q.4.6. Recent adaptive selection in humans In addition to improving our understanding of the evolution of humans within the context of other vertebrates, comparative genomics also provides insights into recent adaptive changes that may eventually tell us what genome sequences make us distinctively human. Comparisons to close relatives such as the chimpanzee and analysis of human polymorphsims drive these new studies. As was the case for human-mouse comparisons discussed above, the KA/KS ratio was computed in genome-wide comparison of the human and chimpanzee gene sets (Clark et al. 2003; Bustamante et al. 2005; Chimpanzee_Sequencing_and_Analysis_Consortium 2005; Nielsen et al. 2005). The ratio for human-chimpanzee comparisons is significantly higher than that seen for mouse-rat comparisons, showing more changes in amino acids in proteins (normalized to synonymous substitutions) in the hominid lineages than in rodents. This does not, however, indicate an overall stronger positive selection in hominids, but rather it reflects the relaxation of purifying selection in species with a small population size. Estimates of effective population size for rodents far exceed those for humans and chimpanzees, and it is well-recognized that the severity of selection increases with population size. However, despite this relaxed selection, examination of the orthologous genes with the most extreme ratios of amino-acid changing substitutions to presumptive neutral changes reveals interesting candidates for hominid-specific adaptive evolution. One is the gene for glycophorin C, which is the membrane protein used for invasion of the malarial parasite Plasmodium falciparum into human erythrocytes. Others include granulysin, which is needed for defense against intracellular parasites, and semenogelins, which are involved in reproduction. A stronger signal for positive selection can be observed when genes are grouped together, either by physical proximity (often as duplicated genes) or by functional category. For human-chimpanzee comparisons, the sets of genes changing most rapidly include the now-familiar categories of reproduction (e.g. spermatogenesis, fertilization, and pregnancy), chemosensation (olfactory receptors, taste receptors), immunity (immunoglobulin lambda, immunoglobulin receptors, complement activation), and xenobiotic metabolism, plus additional categories such as inhibition of apoptosis. The distribution of human polymorphisms along chromosomes and their frequency in populations can be analyzed for insights into very recent selection (reviewed by Kreitman 2000; Biswas and Akey 2006). Positive selection is expected to drive mutations quickly to fixation, so loci under positive selection should be characterized by a skew in the allele frequency distribution toward rare alleles. One measure of that skew is Tajima’s D (Tajima 1989). The rapid fixation of an advantageous allele will bring along linked polymorphisms. These polymorphsims will not have had time to be separated from the selected allele by recombination, and thus linkage disequilibrium will extend further around positively selected alleles than is expected from neutral evolution. Various tests of properties such as these have been developed, and traditionally were applied to a small number of loci. A major limitation to these studies is
27
that changes in population demographics can generate the same signals. For example, recent expansion in population size, such as that experienced by humans, will also lead to an excess of rare alleles or extended linkage disequilibrium. Thus it is difficult to disentangle the confounding effects of population demographics and positive selection. However, the recent availability of genome-wide data on polymorphisms (International_Hapmap_Consortium 2005) provide one solution. Changes in population size should affect all loci in the genome, whereas selection should act on only a few. Thus when the distribution of values for Tajima’s D, long-range haplotype or related measures are examined for a large number of loci, then it is likely that the outliers are undergoing adaptive evolution (Biswas and Akey 2006). Recent genome-wide studies have identified significant outliers based on frequency or rare alleles (Tajima’s D, Carlson et al. 2005; Kelley et al. 2006) and linkage disequilibrium (Voight et al. 2006; Wang et al. 2006a). As much as a third of the regions containing candidates for positively selected genes are found in multiple studies, such as EDAR, SLC30A9, and HERC1. Other candidate genes are found by only one approach, such as TRPV5 and TRPV6. This is to be expected, because the features examined by one approach, such as low frequency alleles, are not contributing to other tests, such as linkage disequilibrium measurements based on common alleles (Biswas and Akey 2006). A third type of test for recent selection utilizes both human polymorphism data and interspecies divergence between human and close relative, such as chimpanzee. The McDonald-Kreitman (1991) test compares the ratio of polymorphisms to divergence (rpd ) at nonsynonymous sites (leading to amino acid changes in the protein product) with that ratio in synonymous sites, which do not change the amino acid sequence and are expected to be largely neutral. If the changes in nonsynonymous sites had no selective advantage or disadvantage, then rpd at these sites would not be significantly different from rpd at neutral sites. Deviation from neutral expectation can be evaluated with a chi-square or related statistic. Bustamante et al. (2005) applied this test to over 11,000 number of human genes (with polymorphsims determined in three different populations) compared with chimpanzee. They found that 9% had a significant signal for positive selection and 14% had a significant signal for negative selection. Each method for finding loci under recent selection in humans has its distinctive strengths and weaknesses. Much effort is currently devoted to examining overlaps and differences in the results. Among the several studies reviewed by Biswas and Akey (2006), a total of 2316 human genes have at least one signature for positive selection, but the overlap between studies ranged from high of 27% in common to some studies with no overlap. At least to some extent, the failure to overlap reflects the different types of selective events being assayed in the different tests. Some genes that are candidates for human-specific selection lead to intriguing and exciting possibilities, such as alterations in FOXP2 implicated in language acquisition (Enard et al. 2002) and MCPH1 and ASPM implicated in brain size (Evans et al. 2005; Mekel-Bobrov et al. 2005). Further studies of recent selection in humans should lead to critical new insights into human biology and disease. Q.4.7. Human disease-related genes Comparative genomics can be used to study the origins and implications of genetic variants associated with human disease. Disadvantageous mutations should be cleared from a population quickly, so why are some genetic diseases rather common? One factor is the relaxed selection against mildly deleterious alleles mentioned in the previous section. A common estimate of the effective population size of humans is about 10,000

28
individuals, and of course the population has expanded dramatically to the current level of over 6 billion. This would tend to favor the persistance of some deleterious mutations, and the results of a McDonald-Kreitman test (Bustamante et al. 2005) indicates that many of the amino acid polymorphisms in humans are moderately deleterious. Another factor is positive selection in one region of the world could drive an allele to high frequency, but that allele is pathogenic in other regions of the world. A classic example is the HBB-S allele of the gene encoding beta-globin. This allele encodes a mutant beta-globin that in combination with alpha-globin constitutes HbS. This is the hemoglobin variant that causes red blood cells to form a sickled, inflexible morphology when deoxygenated, and thus leads to sickle cell disease. However, the HBB-S allele reduces the susceptibility of humans to malaria, and thus it is a protective allele in regions of the world in which malaria is endemic. In fact, haplotype analysis has shown that the HBB-S allele has arisen independently multiple times in recent human history (Antonarakis et al. 1984; Pagnier et al. 1984). This indicates a strong positive selection in the presence of the malarial parasite. Unfortunately, the negative consequence is that people who are homozygous for the HBB-S allele are highly prone to sickle cell disease. A third factor is that some disease-associated variants were protective in the more distant past but are now detrimental for most contemporary human lifestyles. In the “thrifty genotype” hypothesis (Neel 1962), the limited caloric intake and need for high activity levels in ancestral humans would have favored a genotype that made efficient (thrifty) use of food. However, many contemporary humans live in an environment with an excess of available food. Being “too thrifty” with energy metabolism could lead to problems such as diabetes. Disease-associated variants that were advantageous in the past should match the amino acid at that position in ancestor, and some of these will still be seen in related species. Indeed, human disease-related variants match with the amino acid in the corresponding position of chimpanzee (Chimpanzee_Sequencing_and_Analysis_Consortium 2005) and rhesus macaque (Rhesus_Macaque_Genome_Sequencing_and_Analysis_Consortium 2007) in about 16 and 200 cases, respectively. Further studies of these candidates are needed, but the results suggest that retention of an ancestral state is also contributing to human disease alleles. Q.5. Evolution in regions that do not code for proteins or mRNA Despite the importance of protein-coding regions to genome function, these sequences account for about one-third of the sequences that have been under selection for a common function in eutherian mammals. Accounting for the remaining selection in noncoding regions is a major on-going effort in genomics and genetics. The two functional categories that are being examined most are genes that do not code for proteins, such as microRNA (miRNA) genes and gene regulatory regions. An equally important question is to what phylogenetic depth functional, noncoding regions are conserved. These issues will be examined in this section. Q.5.1. Ultraconserved elements Vertebrate genomes, including humans, contain hundreds of DNA segments that are subject to extremely intense constraint. The 481 human DNA segments that are identical to homologous mouse DNA for at least 200 nucleotides are called ultraconserved elements, or UCEs (Bejerano et al. 2004). Sequences that code for proteins have frequent mismatches between human and mouse at synonymous sites, so these UCEs are under stronger purifying

29
selection than most exons. This pattern of conservation indicates that all nucleotides in the identical segment are critical for some function. The UCEs are broadly conserved in vertebrates, and they show the slowest rate of divergence of any known elements in the genome (Table Q.2. Fig. Q.5). Determining the roles for the UCEs is currently a matter of intense interest. Only a small fraction (23%) overlap with mRNA for known protein-coding genes. Thus the majority are associated with some noncoding function. A small number are related to each other, and examination of these has revealed a family of sequences derived from an ancient transposable element that have been recruited for activity as a distal enhancer for one gene and part of an exon for another (Bejerano et al. 2006). Another subset of very slowly changing regions (across most eutherians) was examined for rapid change along the human lineage since divergence from chimpanzee. These human accelerated regions include a gene that encodes an RNA that may function in cortical development (Pollard et al. 2006). A full explanation of the stringent constraint on each nucleotide within the UCEs remains elusive. Not only is the intensity of constraint beyond that seen for almost all protein-coding regions, but even RNAs with considerable secondary structure rarely show this resistance to substitution. Another enigmatic aspect to UCEs is their restriction to vertebrates. Protein sequences, which evolve faster than UCEs in vertebrates, frequently show significant similarity between vertebrate and invertebrates species. Sometimes the similarity extends from vertebrates to eubacteria. In constrast, no homolog to a UCE sequence has been observed outside vertebrates. Finding the sources of the UCEs and explaining how they could be under such intense constraint are important goals for future work. Answers to these questions may reveal aspects of genome function that have not been imagined yet. The fact that the roles and origins of the most stringently constrained sequences in vertebrates are still unknown shows that much still needs to be accomplished in comparative genomics. Q.5.2 Evolution within noncoding genes Many genes do not code for protein, and these must account for some of the noncoding DNA that is under constraint. However, some of the better known noncoding genes do not help explain the fraction under constraint, but for technical reasons. Consider the genes for RNAs utilized in the mechanics of protein synthesis, such as ribosomal RNAs (rRNA) and transfer RNAs (tRNAs). The rRNA genes are clustered in highly duplicated regions on the short arms of Chromosomes 13, 14, 15, 21 and 22. These regions are not included in the assemblies of the human genome, and thus they do not contribute to the minimal estimate of 5% of the genome under constraint in mammals. The tRNA genes are small and contribute little to the selected fraction. Other RNAs, such as snRNAs involved in splicing and processing of precursors to mRNA, also tend to be encoded on small genes. Multiple copies of sequences related to the snRNA genes are present in the human genome, some of which may no longer be active. The contribution of snRNA genes to the fraction of the human genome under constraint needs further study. The miRNAs do not code for protein, but they negatively regulate mRNA function or abundance. Hybridization of a miRNA to its mRNA target to generate a duplex with some mismatches leads to inhibition of translation of the mRNA. Hybridization of a miRNA to its target to generate a perfect duplex leads to degradation of the target mRNA (see Chapter ___). The known miRNA genes are constrained, with many conserved from humans to chickens. However, the full set of miRNA genes is not known, and information is limited about the

30
structure and conservation of genes encoding the precursors to miRNAs. Thus the miRNAs clearly are important contributors to the fraction of the genome under purifying selection, and they could account for substantially more of the constraint that is currently known. Members of another class of RNA that apparently does not code for protein are detected by hybridization of copies of cytoplasmic RNA to high-density tiling arrays of nonrepetitive human genomic DNA. These results show transcription of protein-coding genes as expected, but about half the transcribed regions are not associated with known genes (Kampa et al. 2004). These unannotated transcripts, referred to as transfrags, are often of low abundance and are expressed in a limited set of tissues. The contribution of transfrags to constrained sequences in human is matter of current study. Q.5.3. Evolution and function in gene regulatory sequences DNA sequences needed to regulate the level, developmental timing and tissue-specificity of gene expression include promoters that designate the correct start site for transcription, enhancers that increase the level of expression, silencers that decrease the level of expression, and insulators that separate genes and regulatory regions from the effects of neighboring regulatory regions. Many but not all of these regulatory regions are conserved among mammals (Hardison 2000; Pennacchio and Rubin 2001). Some of the DNA sequences that regulate genes encoding developmental regulatory proteins are conserved from mammals to fish, indicative of strong constraint (Nobrega et al. 2003; Woolfe et al. 2005). One example is shown in Fig. Q.15. However, other regulatory regions show more rapid evolution, e.g. replacing one motifs for binding a transcription factor with a similar sequence in another location (Ludwig et al. 2000; Dermitzakis and Clark 2002) or being present in only one lineage. Despite numerous studies of the extent of conservation of regulatory regions in individual loci, no clear consensus had emerged on the dominant pattern of conservation. A major limitations to previous studies has been the small number of known regulatory regions. Establishing the role of a segment of DNA in regulation requires multiple experiments, and traditionally these were done in a highly directed manner that did not lend itself to high throughput. Now it is possible to enrich DNA for sites occupied by transcription factors (by chromatin immunoprecipitation or ChIP) and then hybridize this enriched DNA to high-density tiling arrays of genomic DNA (DNA chips). This ChIP-chip experiment (Ren et al. 2000) reveals sites bound by transcription factors in a high throughput manner. Experiments by the ENCODE Project Consortium (2007) evaluating sites occupied by several transcription factors have yielded a large set (over 1000) of putative transcriptional regulatory regions in about 1% of the human genome. This in turn can be analyzed for the phylogenetic depth of conservation (King et al. 2007). About 71% of these regulatory regions are conserved from humans to other placental mammals (but no further), and another 21% are conserved to marsupials. Only 4% are conserved from human to other tetrapods and 1% are conserved to fish. In contrast, about 3% is found only in primates. Thus the bulk of the regulatory regions are conserved among mammals, especially placental mammals. However, a particular phylogenetic depth of conservation is not a consistent property of gene regulatory sequences. Rather, the depth of conservation is a property that varies among the regulatory sequences. Ongoing studies may reveal whether particular functions of regulatory regions or their targets correlate with the depth of conservation. Although many regulatory regions have a significant signal for purifying selection, the constraint is not sufficiently strong to place most of them into the 5% of the human genome that

31
is under strong selection. Thus the putative reglatory sequences identified in the ENCODE project contribute only a small amount to the 5% under strong constraint (Margulies et al. 2007). Q.5.4. Prediction and tests of gene regulatory sequences Effective use of comparative genomics to find gene regulatory sequences is challenging for at least two reasons. The variation in phylogenetic depth of conservation is a major complication; some human regulatory regions will be observed only in alignments of primates whereas others align out to fish. Although the large majority of regulatory regions are conserved in multiple placental mammals, even some apparently neutral DNA aligns reliably at this phylogenetic distance. Thus the ability to align at this distance is not a property that identifies regulatory regions with good specificity. Most efforts to detect candidate gene regulatory regions from aligned sequences also use some form of pattern information. For example, the known regulatory regions are clusters of binding sites for transcription factors. The binding sites are short (about 6 bp to 8 bp) and many allow degeneracy (e.g. either purine or either pyrimidine works equally well at some sites). Therefore, the binding site motifs themselves do not confer strong specificity. However, in combination with clustering and with conservation, this set of criteria has good power to detect novel regulatory regions (Blanchette et al. 2006). A set of about 200,000 regions, called PReMods, has been identified as predicted regulatory regions in the human genome using this approach. The motifs for binding sites in regulatory regions are not known completely. These currently unknown motifs can be incorporated into the prediction of regulatory regions by using machine-learning procedures to find distinctive patterns of alignment columns that are common in a training set of alignments in known regulatory regions but are less abundant in a set of alignments from likely neutral DNA. The statistical models describing these distinctive patterns are then used to score any alignment for its regulatory potential. One implementation of this approach has generated a set of about 250,000 regions of human DNA with a high regulatory potential (Taylor et al. 2006). Many of these overlap with the PReMods discovered as conserved clusters of transription factor binding motifs. Regions with high regulatory potential and a conserved binding site for an erythroid transcription factor are validated at a good rate as enhancers in erythroid cells (Wang et al. 2006b). In summary, several methods based on comparative genomics can be used with some success to predict gene regulatory sequences, but none achieve the level of reliability desired. Deep conservation of noncoding sequences, e.g. from human to chicken or human to fish, can be used without additional information about patterns such as binding site motifs. However, this approach will miss the majority of gene regulatory regions. For noncoding sequences conserved among placental mammals, clustering of pattern information should be incorporated. The pattern information can either be based on prior knowledge (such as binding motifs) or learned from training sets. Additional data on site occupancy by particular transcription factors is expected to become widely available in the near future. Integration of this information with the comparative genomics should add considable power to the identification of regulatory regions (Elnitski et al. 2006).

32
Fig. Q.15. An enhancer of the DACH1 gene predicted by comparative genomics. This human gene is homologous to the Drosophila gene dachshund, and it is needed for development of the central nervous system and other organs. Within one of the very large introns of DACH1 are some deeply conserved DNA segments. Panel (A) shows sevedral features of the Dc2 region, including its conservation from humans to fish, high regulatory potential (Taylor et al. 2006), and prediction as a regulatory module by the PReMod pipeline (Blanchette et al. 2006). Examples of conserved matches to transcription factor binding site motifs are also shown. Panel (B) shows that this DNA segment is sufficient to enhance expression of a beta-galactosidase reporter gene in the hindbrain of a transgenic mouse embryo. The blue stain is a marker for beta-galactosidase activity. The Dc2 region was shown to be an enhancer by Nobrega et al. (2003); the image is from the Enhancer Browser (Table Q.3). Q.6. Resources for comparative genomics The large amount and wide variety of data on comparative genomics of mammals and other species can be daunting to those who wish to use it. Also, as discussed throughout this chapter, the level of conservation of functional regions tends to vary from region to region. Detailed information needs to be readily accessible for individual regions and for classes of features across a genome. These needs are accomodated by genome browsers and data marts. Computational tools for further analysis of the data are also available, and one work-space for such tools will be described here. Q.6.1. Genome browsers and data marts Genome browsers show tracks of user-specified information for a designated locus in a genome. The major browsers for mammalian genomes are the UCSC Genome Browser (Kuhn et al. 2007), Ensembl (Hubbard et al. 2007) and MapView at NCBI (Wheeler et al. 2007) (Table Q.3). Comparative genomics tracks showing results of whole-genome alignments are available at the UCSC Genome Browser and Ensembl. As illustrated in Fig. Q.4, the regions of the human aligning with a comparison species can be seen as nets and chains. Inferences about severity of

33
constraint are captured on the Conservation track (similar to that in Fig. Q.9), based on phastCons (Siepel et al., 2005). Often it is desirable to collect and analyze all members of a feature set across a genome or large genomic intervals. This requires the ability to query on the databases of features that underly the browsers. Two such “data marts” are the UCSC Table Browser (Karolchik et al. 2004) and BioMart at Ensembl (Kasprzyk et al. 2003). Both provide interactive query pages to provide access to the data. Table Q.3. Data resources and analysis workspaces for comparative genomics Name Description URL UCSC Genome Browser
Sequences, comparative genomics, annotations
http://genome.ucsc.edu
Ensembl Sequences, comparative genomics, annotations
http://www.ensembl.org/
NCBI MapViewer Gene, EST and other maps of chromosomes
http://www.ncbi.nlm.nih.gov/mapview/
UCSC Table Browser
Query for genomic features http://genome.ucsc.edu/cgi-bin/hgTables
BioMart Query for features of genes http://www.ensembl.org/biomart/martview/
VISTA Enhancer Browser
Data on conserved noncoding regions tested as developmental enhancers
http://enhancer.lbl.gov/
Galaxy Interactive workspace for analysis of genome sequences, alignments and annotation
http://main.g2.bx.psu.edu/
Q.6.2. Genome analysis work-spaces Once the data have been obtained, users frequently need to analyze it further. Different data sets may need to be combined or compared. The level of constraint or regulatory potential may be needed. Estimates of evolutionary rates may be desired. Different tasks will require distinct sets of tools. Considerable progress can be made by acquiring the necessary computer programs and executing them on the user’s computer system. However, this leaves it to user to find or write the needed tools. An alternative is to connect versatile data acquisition with integrated suites of computational tools in a common workspace such as Galaxy (Blankenberg et al. 2007) (Table Q.3). This resource allows users to import data from the UCSC Table Browser, BioMart, or as files from the user’s computer or other source. Once imported, a wide variety of operations can be perfomed on the datasets, such as edits, subtractions, unions, and intersections. Summary statistics can be computed and distributions can be plotted. Various evolutionary genetic analyses can be performed. Precomputed scores such as phastCons and regulatory potential can be aggregated on specified intervals. The interface at Galaxy for a series of operations that can predict gene regulatory regions is shown in Fig. Q.16.

34
Figure Q.16. Using Galaxy to find predicted regulatory regions. The user interface for Galaxy has three panels. Tools for obtaining and analyzing data are selected from the left panel, and the user selects input data and other parameters in the central panel. A history of previous results is maintained on the right panel. In this example, the results of queries to the UCSC Table Brwoser to obtain conserved matches to transcription factor binding motifs (query 3) and regions of of high regulatory potential (query 8, merged in query 9) from a 500 kb region of human Chromosome 16 are intersected to find candidates for gene regulatory modules. Intersections can reveal conserved motifs that are in regions of high regulatory potential (query 11) and vice versa (query 12). Concluding remarks Comparative genomics brings considerable power but daunting challenges to the study of human genetics. No aspect of comparative genomics has been perfected; even the commonly used methods of aligning sequences and predicting protein-coding genes have room for improvement. However, considerable insight and functionality can be gleaned from the predictions and comparisons that are currently available. Real biological variation, e.g. in the rate of evolutionary change at different loci or the phylogenetic depth of conservation of a feature class, means that no single threshold for a conservation-based score will be adequate to find all the features of interest. However, as the variation is better understood and as functional correlates of the variation are established, then the potential power of comparative genomics will be better harnessed. Current data can be readily accessed and evaluated. Additional types of data, such as genome-wide ChIP-chip results, coupled with tools for better integration of disparate

35
datatypes, should lead to considerable future progress in the functional annotation of the human genome. References Altschul, S.F., T.L. Madden, A.A. Schaffer, J. Zhang, Z. Zhang, W. Miller, and D.J. Lipman.
1997. Gapped BLAST and PSI-BLAST: a new generation of protein database search programs. Nucleic Acids Res 25: 3389-3402.
Antonarakis, S.E., C.D. Boehm, G.R. Serjeant, C.E. Theisen, G.J. Dover, and H.H. Kazazian, Jr. 1984. Origin of the beta S-globin gene in blacks: the contribution of recurrent mutation or gene conversion or both. Proc Natl Acad Sci U S A 81: 853-856.
Bejerano, G., C.B. Lowe, N. Ahituv, B. King, A. Siepel, S.R. Salama, E.M. Rubin, W.J. Kent, and D. Haussler. 2006. A distal enhancer and an ultraconserved exon are derived from a novel retroposon. Nature 441: 87-90.
Bejerano, G., M. Pheasant, I. Makunin, S. Stephen, W.J. Kent, J.S. Mattick, and D. Haussler. 2004. Ultraconserved elements in the human genome. Science 304: 1321-1325.
Biswas, S. and J.M. Akey. 2006. Genomic insights into positive selection. Trends Genet 22: 437-446.
Blanchette, M., A.R. Bataille, X. Chen, C. Poitras, J. Laganiere, C. Lefebvre, G. Deblois, V. Giguere, V. Ferretti, D. Bergeron et al. 2006. Genome-wide computational prediction of transcriptional regulatory modules reveals new insights into human gene expression. Genome Res 16: 656-668.
Blankenberg, D., J. Taylor, I. Schenck, J. He, Y. Zhang, M. Ghent, N. Veeraraghavan, I. Albert, W. Miller, K. Makova et al. 2007. A framework for collaborative analysis of ENCODE data: Making large-scale analyses biologist-friendly. Genome Res.: in press.
Boffelli, D., J. McAuliffe, D. Ovcharenko, K.D. Lewis, I. Ovcharenko, L. Pachter, and E.M. Rubin. 2003. Phylogenetic shadowing of primate sequences to find functional regions of the human genome. Science 299: 1391-1394.
Bray, N. and L. Pachter. 2003. MAVID multiple alignment server. Nucleic Acids Res 31: 3525-3526.
Brudno, M., C.B. Do, G.M. Cooper, M.F. Kim, E. Davydov, NISC_Comparative_Sequencing_Program, E.D. Green, A. Sidow, and S. Batzoglou. 2003. LAGAN and Multi-LAGAN: efficient tools for large-scale multiple alignment of genomic DNA. Genome Research 13: 721-731.
Burge, C. and S. Karlin. 1997. Prediction of complete gene structures in human genomic DNA. J Mol Biol 268: 78-94.
Bustamante, C.D., A. Fledel-Alon, S. Williamson, R. Nielsen, M.T. Hubisz, S. Glanowski, D.M. Tanenbaum, T.J. White, J.J. Sninsky, R.D. Hernandez et al. 2005. Natural selection on protein-coding genes in the human genome. Nature 437: 1153-1157.
Carlson, C.S., D.J. Thomas, M.A. Eberle, J.E. Swanson, R.J. Livingston, M.J. Rieder, and D.A. Nickerson. 2005. Genomic regions exhibiting positive selection identified from dense genotype data. Genome Res 15: 1553-1565.
Chimpanzee_Sequencing_and_Analysis_Consortium. 2005. Initial sequence of the chimpanzee genome and comparison with the human genome. Nature 437: 69-87.

36
Clark, A.G., S. Glanowski, R. Nielsen, P.D. Thomas, A. Kejariwal, M.A. Todd, D.M. Tanenbaum, D. Civello, F. Lu, B. Murphy et al. 2003. Inferring nonneutral evolution from human-chimp-mouse orthologous gene trios. Science 302: 1960-1963.
Cooper, G.M., E.A. Stone, G. Asimenos, E.D. Green, S. Batzoglou, and A. Sidow. 2005. Distribution and intensity of constraint in mammalian genomic sequence. Genome Res 15: 901-913.
Curwen, V., E. Eyras, T.D. Andrews, L. Clarke, E. Mongin, S.M. Searle, and M. Clamp. 2004. The Ensembl automatic gene annotation system. Genome Res 14: 942-950.
Dayhoff, M.O., R.M. Schwartz, and B.C. Orcutt. 1978. A model of evolutionary change in proteins. In Atlas of Protein Sequence and Structure (ed. M.O.D. (ed.)), pp. 345 - 352.
Dermitzakis, E. and A. Clark. 2002. Evolution of transcription factor binding sites in mammalian gene regulatory regions: Conservation and turnover. Mol Biol Evol 19: 1114-1121.
Elnitski, L., V.X. Jin, P.J. Farnham, and S.J. Jones. 2006. Locating mammalian transcription factor binding sites: a survey of computational and experimental techniques. Genome Res 16: 1455-1464.
Enard, W., M. Przeworski, S.E. Fisher, C.S. Lai, V. Wiebe, T. Kitano, A.P. Monaco, and S. Paabo. 2002. Molecular evolution of FOXP2, a gene involved in speech and language. Nature 418: 869-872.
Evans, P.D., S.L. Gilbert, N. Mekel-Bobrov, E.J. Vallender, J.R. Anderson, L.M. Vaez-Azizi, S.A. Tishkoff, R.R. Hudson, and B.T. Lahn. 2005. Microcephalin, a gene regulating brain size, continues to evolve adaptively in humans. Science 309: 1717-1720.
Gibbs, R.A. G.M. Weinstock M.L. Metzker D.M. Muzny E.J. Sodergren S. Scherer G. Scott D. Steffen K.C. Worley P.E. Burch et al. 2004. Genome sequence of the Brown Norway rat yields insights into mammalian evolution. Nature 428: 493-521.
Hardison, R.C. 2000. Conserved noncoding sequences are reliable guides to regulatory elements. Trends in Genetics 16: 369-372.
Hardison, R.C., K.M. Roskin, S. Yang, M. Diekhans, W.J. Kent, R. Weber, L. Elnitski, J. Li, M. O'Connor, D. Kolbe et al. 2003. Covariation in frequencies of substitution, deletion, transposition and recombination during eutherian evolution. Genome Res. 13: 13-26.
Henderson, J., S. Salzberg, and K.H. Fasman. 1997. Finding genes in DNA with a Hidden Markov Model. J Comput Biol 4: 127-141.
Henikoff, S. and J.G. Henikoff. 1992. Amino acid substitution matrices from protein blocks. Proc Natl Acad Sci U S A 89: 10915-10919.
Hillier, L.W. W. Miller E. Birney W. Warren R.C. Hardison C.P. Ponting P. Bork D.W. Burt M.A. Groenen M.E. Delany et al. 2004. Sequence and comparative analysis of the chicken genome provide unique perspectives on vertebrate evolution. Nature 432: 695-716.
Hubbard, T.J., B.L. Aken, K. Beal, B. Ballester, M. Caccamo, Y. Chen, L. Clarke, G. Coates, F. Cunningham, T. Cutts et al. 2007. Ensembl 2007. Nucleic Acids Res 35: D610-D617.
International_Hapmap_Consortium. 2005. A haplotype map of the human genome. Nature 437: 1299-1320.
International_Human_Genome_Sequencing_Consortium. 2004. Finishing the euchromatic sequence of the human genome. Nature 431: 931-945.
Kampa, D., J. Cheng, P. Kapranov, M. Yamanaka, S. Brubaker, S. Cawley, J. Drenkow, A. Piccolboni, S. Bekiranov, G. Helt et al. 2004. Novel RNAs identified from an in-depth
37
analysis of the transcriptome of human chromosomes 21 and 22. Genome Res 14: 331-342.
Karolchik, D., A.S. Hinrichs, T.S. Furey, K.M. Roskin, C.W. Sugnet, D. Haussler, and W.J. Kent. 2004. The UCSC Table Browser data retrieval tool. Nucleic Acids Res 32: D493-D496.
Kasprzyk, A., D. Keefe, D. Smedley, D. London, W. Spooner, C. Melsopp, M. Hammond, P. Rocca-Serra, T. Cox, and E. Birney. 2003. EnsMart – a generic system for fast and flexible access to biological data. Genome Res 14: 160-169.
Kelley, J.L., J. Madeoy, J.C. Calhoun, W. Swanson, and J.M. Akey. 2006. Genomic signatures of positive selection in humans and the limits of outlier approaches. Genome Res 16: 980-989.
Kent, W.J., R. Baertsch, A. Hinrichs, W. Miller, and D. Haussler. 2003. Evolution's cauldron: duplication, deletion, and rearrangement in the mouse and human genomes. Proc Natl Acad Sci U S A 100: 11484-11489.
Kimura, M. 1968. Evolutionary rate at the molecular level. Nature 217: 624-626. Kimura, M. 1977. Preponderance of synonymous changes as evidence for the neutral theory of
molecular evolution. Nature 267: 275-276. King, D.C., J. Taylor, Y. Zhang, Y. Cheng, J. Martin,
ENCODE_Transcriptional_Regulation_Group, ENCODE_Multispecies_Alignment_Group, F. Chiaromonte, W. Miller, and R.C. Hardison. 2007. Finding cis-regulatory elements using comparative genomics: Some lessons from ENCODE data. Genome Res.: in press.
Kondrashov, A.S. 2002. Direct Estimates of Human per Nucleotide Mutation Rates at 20 Loci Causing Mendelian Diseases. Human Mutation 21: 12-27.
Kreitman, M. 2000. Methods to detect selection in populations with applications to the human. Annu Rev Genomics Hum Genet 1: 539-559.
Kuhn, R.M., D. Karolchik, A.S. Zweig, H. Trumbower, D.J. Thomas, A. Thakkapallayil, C.W. Sugnet, M. Stanke, K.E. Smith, A. Siepel et al. 2007. The UCSC genome browser database: update 2007. Nucleic Acids Res 35: D668-673.
Kumar, S. and S.B. Hedges. 1998. A molecular timescale for vertebrate evolution. Nature 392: 917-920.
Li, W.H., T. Gojobori, and M. Nei. 1981. Pseudogenes as a paradigm of neutral evolution. Nature 292: 237-239.
Lindblad-Toh, K. C.M. Wade T.S. Mikkelsen E.K. Karlsson D.B. Jaffe M. Kamal M. Clamp J.L. Chang E.J. Kulbokas, 3rd M.C. Zody et al. 2005. Genome sequence, comparative analysis and haplotype structure of the domestic dog. Nature 438: 803-819.
Ludwig, M.Z., C. Bergman, N.H. Patel, and M. Kreitman. 2000. Evidence for stabilizing selection in a eukaryotic enhancer element. Nature 403: 564-567.
Maclean, J.A., 2nd, M.A. Chen, C.M. Wayne, S.R. Bruce, M. Rao, M.L. Meistrich, C. Macleod, and M.F. Wilkinson. 2005. Rhox: a new homeobox gene cluster. Cell 120: 369-382.
Margulies, E.H., M. Blanchette, NISC_Comparative_Sequencing_Program, D. Haussler, and E.D. Green. 2003. Identification and characterization of multi-species conserved sequences. Genome Res 13: 2507-2518.
Margulies, E.H., G.M. Cooper, G. Asimenos, D.J. Thomas, C.N. Dewey, A. Siepel, E. Birney, D. Keefe, A.S. Schwartz, M. Hou et al. 2007. Analyses of deep mammalian sequence

38
alignments and constraint predictions for 1% of the human genome. Genome Res.: in press.
Mayor, C., M. Brudno, J.R. Schwartz, A. Poliakov, E.M. Rubin, K.A. Frazer, L.S. Pachter, and I. Dubchak. 2000. VISTA: visualizing global DNA sequence alignments of arbitrary length. Bioinformatics 16: 1046-1047.
McDonald, J.H. and M. Kreitman. 1991. Adaptive protein evolution at the Adh locus in Drosophila. Nature 354: 114-116.
Mekel-Bobrov, N., S.L. Gilbert, P.D. Evans, E.J. Vallender, J.R. Anderson, R.R. Hudson, S.A. Tishkoff, and B.T. Lahn. 2005. Ongoing adaptive evolution of ASPM, a brain size determinant in Homo sapiens. Science 309: 1720-1722.
Nachman, M.W. and S.L. Crowell. 2000. Estimate of the Mutation Rate per Nucleotide in Humans. Genetics 156: 297–304.
Needleman, S.B. and C.D. Wunsch. 1970. A general method applicable to the search for similarities in the amino acid sequence of two proteins. J. Mol. Biol. 48: 443-453.
Neel, J.V. 1962. Diabetes mellitus: a "thrifty" genotype rendered detrimental by "progress"? Am J Hum Genet 14: 353-362.
Nei, M. 1987. Molecular Evolutionary Genetics. Columbia University Press, New York. Nielsen, R., C. Bustamante, A.G. Clark, S. Glanowski, T.B. Sackton, M.J. Hubisz, A. Fledel-
Alon, D.M. Tanenbaum, D. Civello, T.J. White et al. 2005. A scan for positively selected genes in the genomes of humans and chimpanzees. PLoS Biol 3: e170.
Nobrega, M.A., I. Ovcharenko, V. Afzal, and E.M. Rubin. 2003. Scanning human gene deserts for long-range enhancers. Science 302: 413.
Pagnier, J., J.G. Mears, O. Dunda-Belkhodja, K.E. Schaefer-Rego, C. Beldjord, R.L. Nagel, and D. Labie. 1984. Evidence for the multicentric origin of the sickle cell hemoglobin gene in Africa. Proc Natl Acad Sci U S A 81: 1771-1773.
Pennacchio, L.A. and E.M. Rubin. 2001. Genomic strategies to identify mammalian regulatory sequences. Nat Rev Genet 2: 100-109.
Pollard, K.S., S.R. Salama, N. Lambert, M.A. Lambot, S. Coppens, J.S. Pedersen, S. Katzman, B. King, C. Onodera, A. Siepel et al. 2006. An RNA gene expressed during cortical development evolved rapidly in humans. Nature 443: 167-172.
Pruitt, K.D. and D.R. Maglott. 2001. RefSeq and LocusLink: NCBI gene-centered resources. Nucleic Acids Res 29: 137-140.
Ren, B., F. Robert, J.J. Wyrick, O. Aparicio, E.G. Jennings, I. Simon, J. Zeitlinger, J. Schreiber, N. Hannett, E. Kanin et al. 2000. Genome-wide location and function of DNA binding proteins. Science 290: 2306-2309.
Rhesus_Macaque_Genome_Sequencing_and_Analysis_Consortium. 2007. Evolutionary and Biomedical Insights from the Rhesus Macaque Genome. Science: in press.
Schwartz, S., L. Elnitski, M. Li, M. Weirauch, C. Riemer, A. Smit, NISC_Comparative_Sequencing_Program, E.D. Green, R.C. Hardison, and W. Miller. 2003a. MultiPipMaker and supporting tools: alignments and analysis of multiple genomic DNA sequences. Nucleic Acids Res 31: 3518-3524.
Schwartz, S., W.J. Kent, A. Smit, Z. Zhang, R. Baertsch, R.C. Hardison, D. Haussler, and W. Miller. 2003b. Human-mouse alignments with Blastz. Genome Res. 13: 103-105.
Siepel, A., G. Bejerano, J.S. Pedersen, A.S. Hinrichs, M. Hou, K. Rosenbloom, H. Clawson, J. Spieth, L.W. Hillier, S. Richards et al. 2005. Evolutionarily conserved elements in vertebrate, insect, worm, and yeast genomes. Genome Res 15: 1034-1050.

39
Siepel, A. and D. Haussler. 2004. Computational identification of evolutionarily conserved exons. In Proceeding of the 8th Annual International Conference on Research in Computational Biology (RECOMB '04), pp. 177-186.
Smith, T.F. and M.S. Waterman. 1981. Identification of common molecular subsequences. J Mol Biol 147: 195-197.
Tajima, F. 1989. Statistical method for testing the neutral mutation hypothesis by DNA polymorphism. Genetics 123: 585-595.
Taylor, J., S. Tyekucheva, D.C. King, R.C. Hardison, W. Miller, and F. Chiaromonte. 2006. ESPERR: Learning strong and weak signals in genomic sequence alignments to identify functional elements. Genome Res 16: 1596-1604.
The_ENCODE_Project_Consortium. 2007. The ENCODE pilot project: Identification and analysis of functional elements in 1% of the human genome. Nature: revision under review.
Thompson, J.D., D.G. Higgins, and T.J. Gibson. 1994. CLUSTAL W: improving the sensitivity of progressive multiple sequence alignment through sequence weighting, position-specific gap penalties and weight matrix choice. Nucleic Acids Res 22: 4673-4680.
Voight, B.F., S. Kudaravalli, X. Wen, and J.K. Pritchard. 2006. A map of recent positive selection in the human genome. PLoS Biol 4: e72.
Wang, E.T., G. Kodama, P. Baldi, and R.K. Moyzis. 2006a. Global landscape of recent inferred Darwinian selection for Homo sapiens. Proc Natl Acad Sci U S A 103: 135-140.
Wang, H., Y. Zhang, Y. Cheng, Y. Zhou, D.C. King, J. Taylor, F. Chiaromonte, J. Kasturi, H. Petrykowska, B. Gibb et al. 2006b. Experimental validation of predicted mammalian erythroid cis-regulatory modules. Genome Res 16: 1480-1492.
Waterston, R.H. K. Lindblad-Toh E. Birney J. Rogers J.F. Abril P. Agarwal R. Agarwala R. Ainscough M. Alexandersson P. An et al. 2002. Initial sequencing and comparative analysis of the mouse genome. Nature 420: 520-562.
Wheeler, D.L., T. Barrett, D.A. Benson, S.H. Bryant, K. Canese, V. Chetvernin, D.M. Church, M. DiCuccio, R. Edgar, S. Federhen et al. 2007. Database resources of the National Center for Biotechnology Information. Nucleic Acids Res 35: D5-D12.
Wiehe, T., S. Gebauer-Jung, T. Mitchell-Olds, and R. Guigo. 2001. SGP-1: prediction and validation of homologous genes based on sequence alignments. Genome Res 11: 1574-1583.
Woolfe, A., M. Goodson, D.K. Goode, P. Snell, G.K. McEwen, T. Vavouri, S.F. Smith, P. North, H. Callaway, K. Kelly et al. 2005. Highly conserved non-coding sequences are associated with vertebrate development. PLoS Biol 3: e7.
Wu, J.Q., D. Shteynberg, M. Arumugam, R.A. Gibbs, and M.R. Brent. 2004. Identification of rat genes by TWINSCAN gene prediction, RT-PCR, and direct sequencing. Genome Res 14: 665-671.