Embed Size (px)
Citation preview
CSAP Na tional Cross-site Evaluation–Final Technical Report 58
CHAPTER FOUR
DEVELOPING MEASURES
The growing literature on prevention research and practice represents a classic “forest-and-trees”problem. Definitions of specific risk and protective factors reflect the simultaneous concern formultiple contexts of influence. The proliferation of risk and protection theories makes it difficultto discern the large-scale lessons that emerge from the detail of individual research projects.Certainly, one of these lessons is that adolescent substance use is a behavior that is deeply embeddedin the complex processes of youth development. It cannot be meaningfully addressed separate fromother issues of adolescent development, including the processes of establishing autonomy from thefamily and developing a personal and social identity.
This fundamental lesson is reflected in the evolution of prevention practice. Early prevention effortsrelied on educational approaches designed to inform youth about substance use and its legal andhealth dangers. The assumption was that youth could isolate their decisions about substance use andmake decisions through rational calculation. Research has contradicted this assumption, and, asreflected in the preceding chapter, prevention programs have moved away from an emphasis onATOD information as a prevention strategy.
Increasingly, rather than focusing directly on changing substance use behavior in isolation,prevention strategies target other facets of psychosocial development or the environment. Thepredominant focus of the programs in this study is on risk and protection--and specifically, malleableinternal risk and protective factors. The hope is that changing these factors will put youth on adevelopmental trajectory that will prevent or moderate their involvement with substances.
From a research perspective, evaluating programs that focus on risk and protection requires adequatemeasurement of the mediating risk and protective factors that are the immediate targets of change,as well as the substance use behaviors that are the eventual targets of change. This chaptersummarizes the development and status of cross-site measures of substance use and mediating riskand protective factors. Specifically, it explains the following analytical steps:
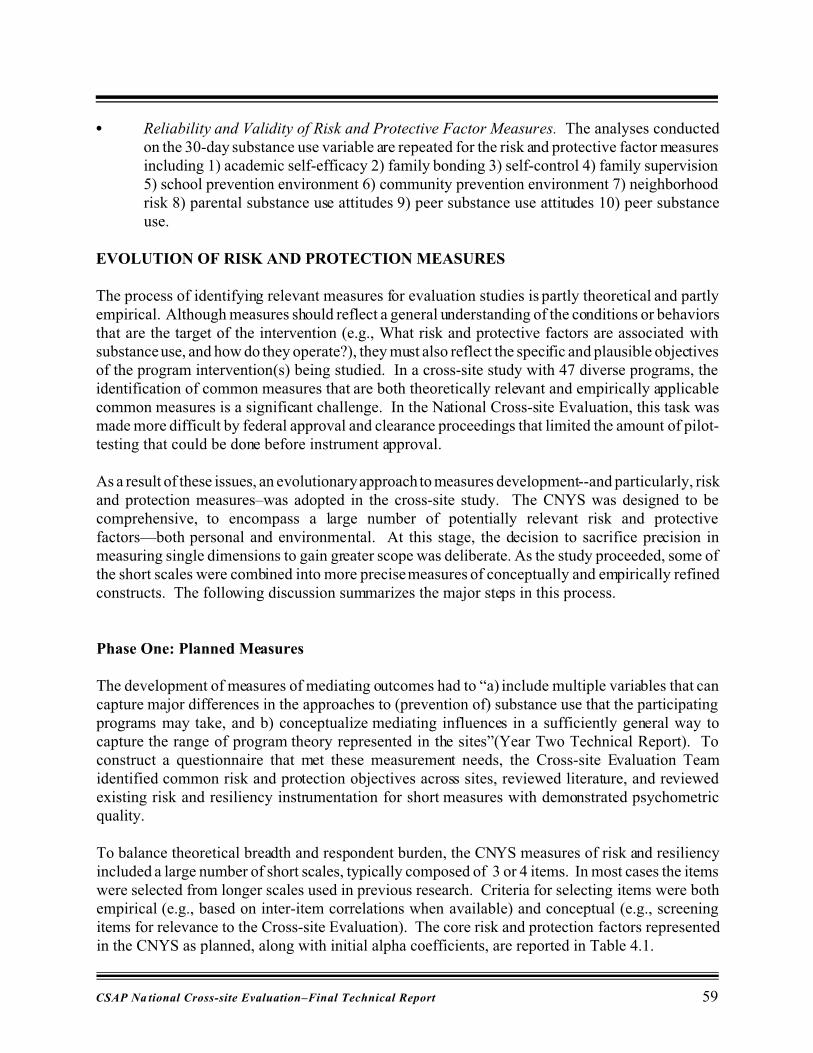
C Evolution of Risk and Protection Measures. The Cross-site Evaluation Team cast a wide netin constructing the CNYS (CSAP National Youth Survey). The survey was initiallydesigned to include “short-scale” measures of a broad range of risk and protective factors.However, the measurement grid was subsequently simplified into a smaller number of moretheoretically relevant and empirically robust measures. The first section of this chapterbriefly summarizes this evolutionary process.
C Reliability and Validity of Substance Use Measures. Prior reports have shown the reliabilityand validity of the substance use measures at baseline. This report expands that discussion,providing reliability and validity information and confirmatory factor analysis for a measureof total 30-day substance use.
CSAP Na tional Cross-site Evaluation–Final Technical Report 59
C Reliability and Validity of Risk and Protective Factor Measures. The analyses conductedon the 30-day substance use variable are repeated for the risk and protective factor measuresincluding 1) academic self-efficacy 2) family bonding 3) self-control 4) family supervision5) school prevention environment 6) community prevention environment 7) neighborhoodrisk 8) parental substance use attitudes 9) peer substance use attitudes 10) peer substanceuse.
EVOLUTION OF RISK AND PROTECTION MEASURES
The process of identifying relevant measures for evaluation studies is partly theoretical and partlyempirical. Although measures should reflect a general understanding of the conditions or behaviorsthat are the target of the intervention (e.g., What risk and protective factors are associated withsubstance use, and how do they operate?), they must also reflect the specific and plausible objectivesof the program intervention(s) being studied. In a cross-site study with 47 diverse programs, theidentification of common measures that are both theoretically relevant and empirically applicablecommon measures is a significant challenge. In the National Cross-site Evaluation, this task wasmade more difficult by federal approval and clearance proceedings that limited the amount of pilot-testing that could be done before instrument approval.
As a result of these issues, an evolutionary approach to measures development--and particularly, riskand protection measures–was adopted in the cross-site study. The CNYS was designed to becomprehensive, to encompass a large number of potentially relevant risk and protectivefactors—both personal and environmental. At this stage, the decision to sacrifice precision inmeasuring single dimensions to gain greater scope was deliberate. As the study proceeded, some ofthe short scales were combined into more precise measures of conceptually and empirically refinedconstructs. The following discussion summarizes the major steps in this process.
Phase One: Planned Measures
The development of measures of mediating outcomes had to “a) include multiple variables that cancapture major differences in the approaches to (prevention of) substance use that the participatingprograms may take, and b) conceptualize mediating influences in a sufficiently general way tocapture the range of program theory represented in the sites”(Year Two Technical Report). Toconstruct a questionnaire that met these measurement needs, the Cross-site Evaluation Teamidentified common risk and protection objectives across sites, reviewed literature, and reviewedexisting risk and resiliency instrumentation for short measures with demonstrated psychometricquality.
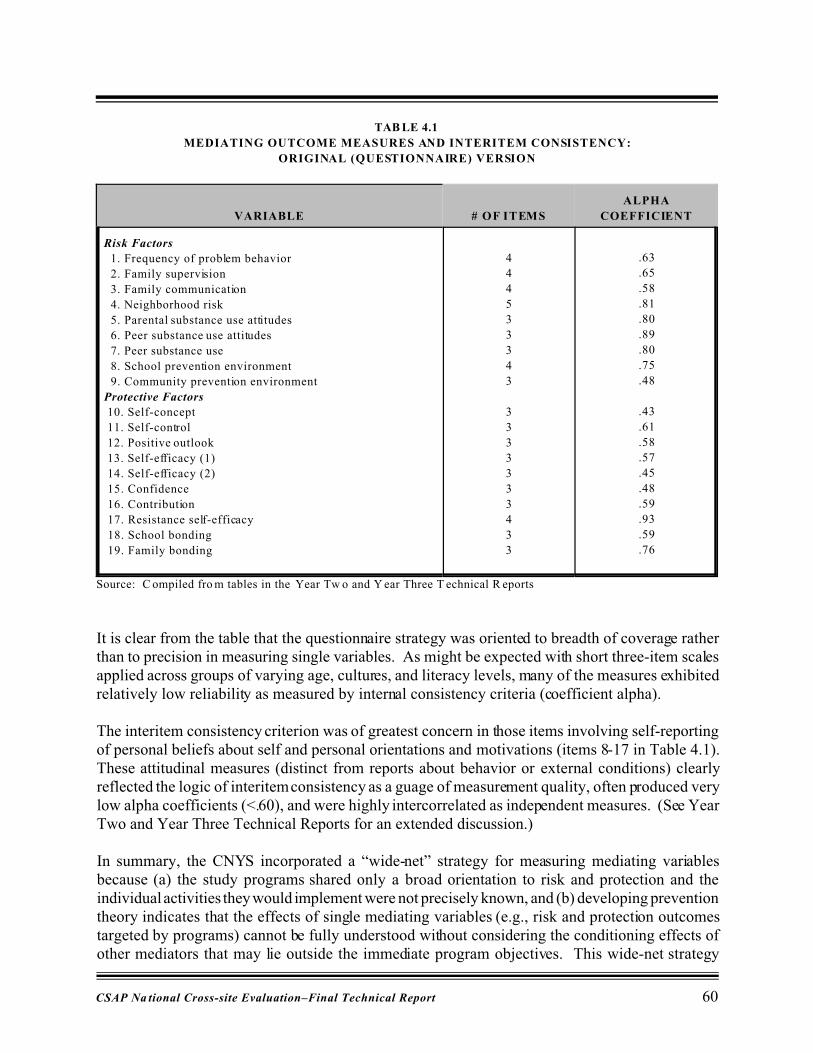
To balance theoretical breadth and respondent burden, the CNYS measures of risk and resiliencyincluded a large number of short scales, typically composed of 3 or 4 items. In most cases the itemswere selected from longer scales used in previous research. Criteria for selecting items were bothempirical (e.g., based on inter-item correlations when available) and conceptual (e.g., screeningitems for relevance to the Cross-site Evaluation). The core risk and protection factors representedin the CNYS as planned, along with initial alpha coefficients, are reported in Table 4.1.
CSAP Na tional Cross-site Evaluation–Final Technical Report 60
TAB LE 4.1
MEDIATING OUTCOME MEASURES AND INTERITEM CONSISTENCY:
ORIGINAL (QUESTIONNAIRE) VERSION
VARIABLE # OF ITEMS
ALPHA
COEFFICIENT
Risk Factors
1. Frequency of problem behavior
2. Family supervision
3. Family communication
4. Neighborhood risk
5. Parental substance use attitudes
6. Peer substance use attitudes
7. Peer substance use
8. School prevention environment
9. Community prevention environment
Protective Factors
10. Self-concept
11. Self-control
12. Positive outlook
13. Self-efficacy (1)
14. Self-efficacy (2)
15. Confidence
16. Contribution
17. Resistance self-efficacy
18. School bonding
19. Family bonding
4
4
4
5
3
3
3
4
3
3
3
3
3
3
3
3
4
3
3
.63
.65
.58
.81
.80
.89
.80
.75
.48
.43
.61
.58
.57
.45
.48
.59
.93
.59
.76
Source: C ompiled fro m tables in the Year Tw o and Y ear Three T echnical R eports
It is clear from the table that the questionnaire strategy was oriented to breadth of coverage ratherthan to precision in measuring single variables. As might be expected with short three-item scalesapplied across groups of varying age, cultures, and literacy levels, many of the measures exhibitedrelatively low reliability as measured by internal consistency criteria (coefficient alpha).
The interitem consistency criterion was of greatest concern in those items involving self-reportingof personal beliefs about self and personal orientations and motivations (items 8-17 in Table 4.1).These attitudinal measures (distinct from reports about behavior or external conditions) clearlyreflected the logic of interitem consistency as a guage of measurement quality, often produced verylow alpha coefficients (<.60), and were highly intercorrelated as independent measures. (See YearTwo and Year Three Technical Reports for an extended discussion.)
In summary, the CNYS incorporated a “wide-net” strategy for measuring mediating variablesbecause (a) the study programs shared only a broad orientation to risk and protection and theindividual activities they would implement were not precisely known, and (b) developing preventiontheory indicates that the effects of single mediating variables (e.g., risk and protection outcomestargeted by programs) cannot be fully understood without considering the conditioning effects ofother mediators that may lie outside the immediate program objectives. This wide-net strategy
CSAP Na tional Cross-site Evaluation–Final Technical Report 61
required a sacrifice in scale length for individual variables, and therefore a sacrifice in measurementprecision. Early analyses (of partial samples) suggested that the initial large number of variablesmight be winnowed both conceptually and empirically. The next section briefly summarizes of thefirst phase of revision.
Phase Two: Revised Measures
During Year Two of the study, analyses of measurement quality were initiated on a preliminarybaseline sample of approximately 3,800 treatment and comparison youth. These data provided abasis for assessing the initial configuration of variables as planned in the questionnaire. Revisionswere made for several reasons.
In the case of the resistance self-efficacy variable, for example, early analyses revealed that the itemsproduced highly redundant responses, limited variance, and correlational patterns that contradictedconstruct validity. The construct was therefore dropped from further analysis. Other revisions weredriven by conceptual or empirical considerations.
Conceptual Clarification
As analysis was initiated and data from the CNYS were considered in the context of growingknowledge about the programs, the Cross-site evaluation Team revised and articulated a conceptualframework for grouping mediating outcomes. The major features of this conceptual frameworkinvolved the following classifications:
C Other Outcomes. The team identified several constructs that were highly correlated withsubstance use but that were (a) behavioral indicators of “bad outcomes” similar to substanceuse (i.e., individual problem behaviors, school performance), or that were (b) proximal tosubstance use measures and directly addressed through traditional ATOD educationstrategies (i.e., substance use attitudes). These variables were categorized as “otheroutcomes.”
C Social Norms. Second, constructs related to respondent perceptions of peer use, peerattitudes toward use, and parental attitudes toward use were categorized as social norms.These variables--i.e., the expectations and behaviors of significant others and societyregarding substance use-- are perceptions that the prevention research literature has clearlyidentified as strong correlates of individual attitudes and use. The CNYS constructs tapthose social norm characteristics that matter the most—the attitudes and behaviors of familyand friends.
C Internal and External Risk and Protection. Third, the evaluation divided risk and protectionindicators into internal and external categories. This distinction was made because ofinternal and external factors different relationships have to program activities andto the objectives discussed in Chapter Two, and because internal and external factors havevery different implications for the design of organized prevention programming. Put simply,
CSAP Na tional Cross-site Evaluation–Final Technical Report 62
this distinction has a more direct link to practice than more subtle distinctions concerningdifferences between risk and protection.
Empirical Considerations
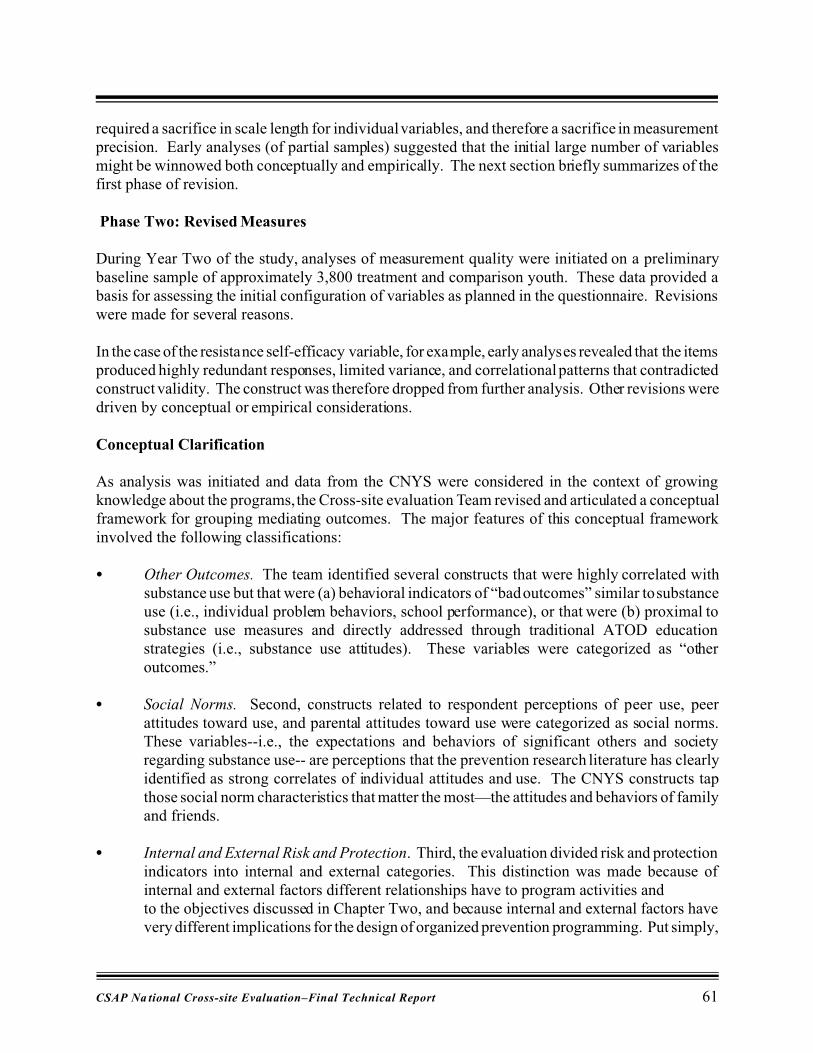
A second set of revisions concentrated on the internal risk and protection variables found in items8 through 17 of Table 4.1. The fact that these dimensions clustered in the internal domain, that theyoften demonstrated low internal consistency, and that they were highly intercorrelated suggested thatthey might be regrouped into a smaller number of dimensions.
The process of revising these measures was both conceptual and empirical. Some constructs, suchas school bonding and family bonding, were important theoretically and had been identified in priorstudies as strong covariates with adolescent substance use. They were retained as separateconstructs. In other areas, interitem correlations and exploratory factor analysis were used to informthe conceptual revision of the internal risk and protection constructs. Table 4.2 presents the revisedvariables.
TAB LE 4.2
REVISED INTERNAL RISK AND PROTECTION CONSTRUCTS
Variab le Sample Size # of Items Interitem Consistency
School bonding 9,997 4 .62
Family bonding 9,695 6 .76
Self-efficacy 9,995 5 .59
Self-control 10,098 3 .61
Belief in self 9,998 4 .61
Social confidence 9,930 5 .56
In summary, the second phase of mediating-outcomes measurement development producedconceptual recategorization of variables and a revision and simplification of variables within theinternal risk and protection domain. This revised set of variables supported a third phase ofmeasurement development in which the interaction of factors, and their relation to substance use,was taken into consideration.
Phase Three: Data Reduction
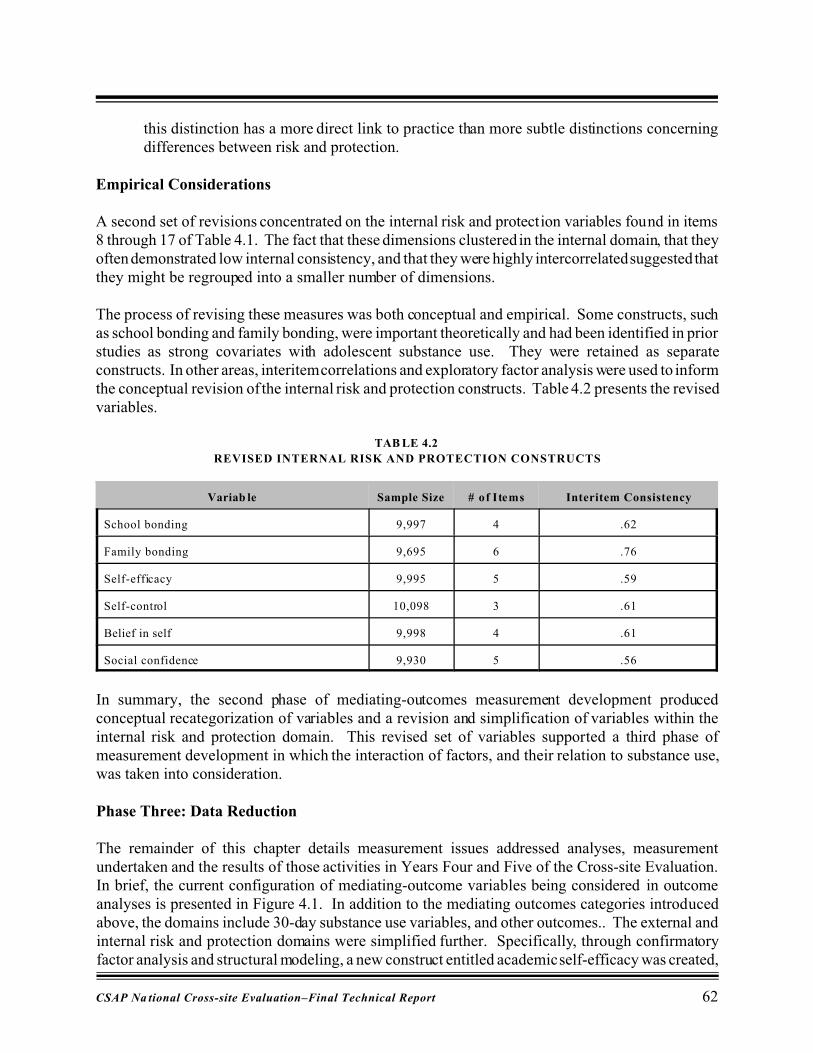
The remainder of this chapter details measurement issues addressed analyses, measurementundertaken and the results of those activities in Years Four and Five of the Cross-site Evaluation.In brief, the current configuration of mediating-outcome variables being considered in outcomeanalyses is presented in Figure 4.1. In addition to the mediating outcomes categories introducedabove, the domains include 30-day substance use variables, and other outcomes.. The external andinternal risk and protection domains were simplified further. Specifically, through confirmatoryfactor analysis and structural modeling, a new construct entitled academic self-efficacy was created,
1The specific wording of the questions about 30-day use is: “On how many DAYS in the LAST MONTH
(30 days) did you (smoke a cigarette/have an alcoholic drink/use any marijuana)?” Response categories included 0)
“none” 1) “1-2 days” 2) “3-5 days” 3) “6-9 days” 4) “10-19 days” 5) “20-31 days” in the last month.
CSAP Na tional Cross-site Evaluation–Final Technical Report 63
INTERNAL RISK ANDPROTECTIVE FACTORS
C Academic self-efficacyC Self-controlC Family bonding
EXTERNAL RISK ANDPROTECTIVE FACTORS
C Family supervisionC School prevention
environmentC Community prevention
environment C Neighborhood risk
SUBSTANCE USE NORMS
C Parental substance useattitudes
C Peer substance useC Peer substance use attitudes
SUBSTANCE USE
C Combined 30-day use(excluding inhalants)
C 30-day cigarette useC 30-day alcohol useC 30-day marijuana useC 30-day inhalant use
OTHER OUTCOMES
C School performanceC Individual substance use
attitudesC Problem behaviors
aggregating school bonding and self-efficacy. This measure exhibited high interscale correlationsin prior analysis, and forms one theoretically important latent variable. For reasons of theory andparsimony, a new family bonding construct including all measures related to family bonding andfamily communication was created. The following sections report on measurement analysesconducted during the final two years of the study.
FIGU RE 4.1
FINAL SUBSTANCE USE AND RISK AND PROTECTION MEASURES
RELIABILITY AND VALIDITY OF SUBSTANCE USE MEASURES
The CSAP National Youth Survey contains a series of questions that explore substance use in youth,including questions on lifetime, ‘30-day’, and daily use of cigarettes, alcohol, and marijuana and on30-day use of inhalants and other illicit drugs1. Although it would have been possible to configurethe substance use variable in a number of ways, this report utilizes a “total 30-day substance use”variable that aggregates 30-day cigarette, alcohol, and marijuana use. This variable was selectedbecause of its straightforward interpretation and because prior analysis (Springer, Sale, Sambrano, & Hermann, 1998) has suggested that more encompassing measures dilute program effects becausethey incorporate empirically normative behavior. The report also reports 30-day cigarette, alcohol,and marijuana use independently. The following section describes the reliability of the total 30-daysubstance use measure.
Inter-item Consistency. The reliability of the total 30-day substance use measure was confirmedthrough inter-item consistency checks using coefficient alpha. The alpha coefficient is based uponthe number of items in a scale and their interitem correlations. The greater the correlation and the
2Inter-item consistency, the parameter assessed by alpha, is just one indication of reliability. In some
instances a lpha is not an appropriate indicator of relia bility.
*Age 18 and older not reported due to low sample size.
CSAP Na tional Cross-site Evaluation–Final Technical Report 64
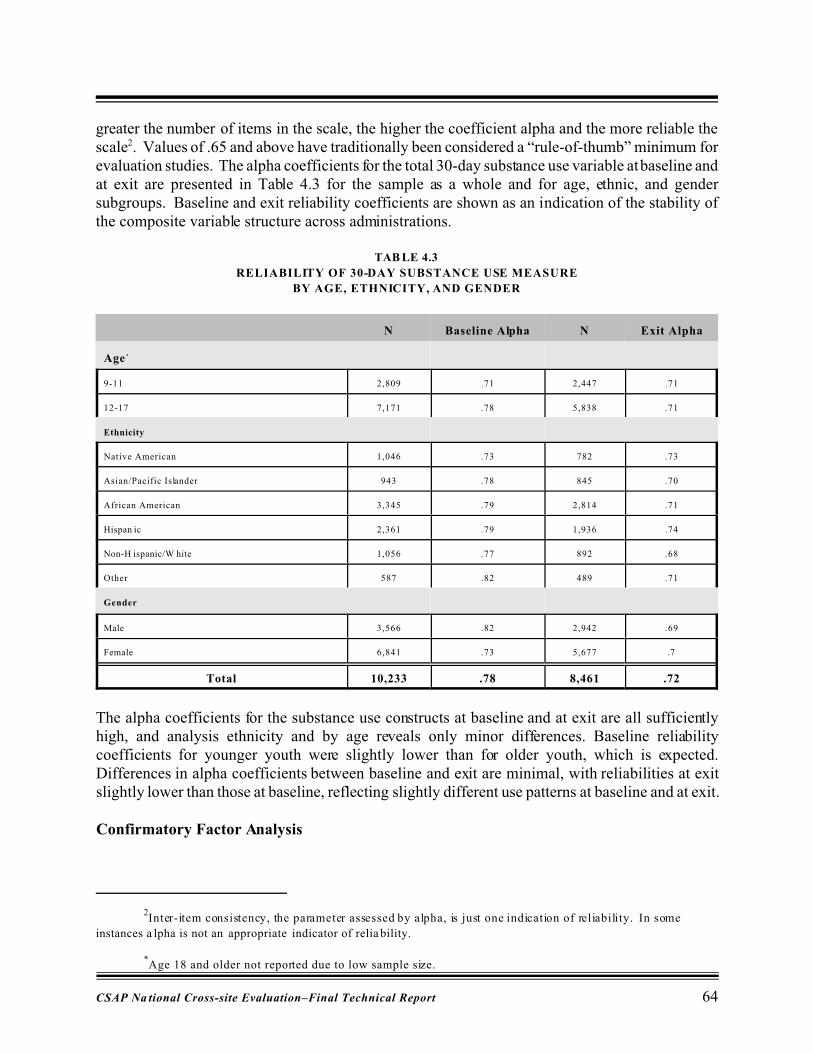
greater the number of items in the scale, the higher the coefficient alpha and the more reliable thescale2. Values of .65 and above have traditionally been considered a “rule-of-thumb” minimum forevaluation studies. The alpha coefficients for the total 30-day substance use variable at baseline andat exit are presented in Table 4.3 for the sample as a whole and for age, ethnic, and gendersubgroups. Baseline and exit reliability coefficients are shown as an indication of the stability ofthe composite variable structure across administrations.
TAB LE 4.3
RELIABILITY OF 30-DAY SUBSTANCE USE MEASURE
BY AGE, ETHNICITY, AND GENDER
N Baseline Alpha N Exit Alpha
Age *
9-11 2,809 .71 2,447 .71
12-17 7,171 .78 5,838 .71
Ethnicity
Native American 1,046 .73 782 .73
Asian/Pacific Islander 943 .78 845 .70
African American 3,345 .79 2,814 .71
Hispan ic 2,361 .79 1,936 .74
Non-H ispanic/W hite 1,056 .77 892 .68
Other 587 .82 489 .71
Gender
Male 3,566 .82 2,942 .69
Female 6,841 .73 5,677 .7
Total 10,233 .78 8,461 .72
The alpha coefficients for the substance use constructs at baseline and at exit are all sufficientlyhigh, and analysis ethnicity and by age reveals only minor differences. Baseline reliabilitycoefficients for younger youth were slightly lower than for older youth, which is expected.Differences in alpha coefficients between baseline and exit are minimal, with reliabilities at exitslightly lower than those at baseline, reflecting slightly different use patterns at baseline and at exit.
Confirmatory Factor Analysis
CSAP Na tional Cross-site Evaluation–Final Technical Report 65
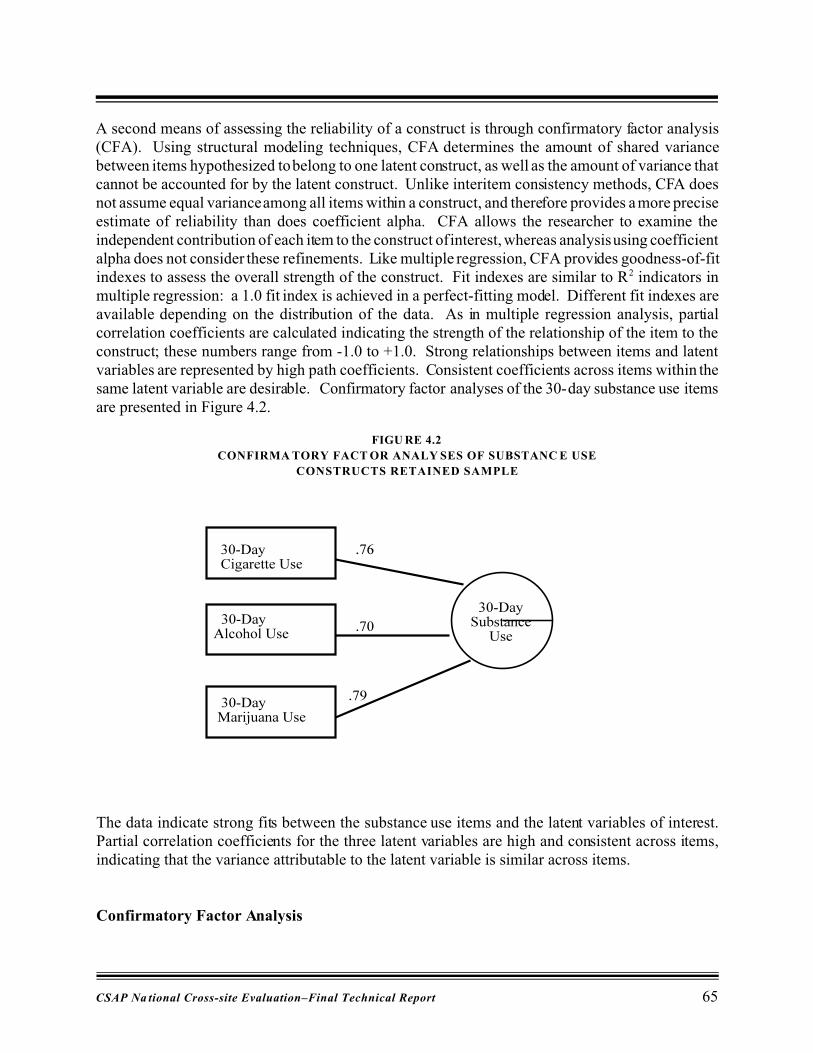
A second means of assessing the reliability of a construct is through confirmatory factor analysis(CFA). Using structural modeling techniques, CFA determines the amount of shared variancebetween items hypothesized to belong to one latent construct, as well as the amount of variance thatcannot be accounted for by the latent construct. Unlike interitem consistency methods, CFA doesnot assume equal variance among all items within a construct, and therefore provides a more preciseestimate of reliability than does coefficient alpha. CFA allows the researcher to examine theindependent contribution of each item to the construct of interest, whereas analysis using coefficientalpha does not consider these refinements. Like multiple regression, CFA provides goodness-of-fitindexes to assess the overall strength of the construct. Fit indexes are similar to R2 indicators inmultiple regression: a 1.0 fit index is achieved in a perfect-fitting model. Different fit indexes areavailable depending on the distribution of the data. As in multiple regression analysis, partialcorrelation coefficients are calculated indicating the strength of the relationship of the item to theconstruct; these numbers range from -1.0 to +1.0. Strong relationships between items and latentvariables are represented by high path coefficients. Consistent coefficients across items within thesame latent variable are desirable. Confirmatory factor analyses of the 30-day substance use itemsare presented in Figure 4.2.
FIGU RE 4.2
CONFIRMA TORY FACT OR ANALY SES OF SUBSTANC E USE
CONSTRUCTS RETAINED SAMPLE
The data indicate strong fits between the substance use items and the latent variables of interest.Partial correlation coefficients for the three latent variables are high and consistent across items,indicating that the variance attributable to the latent variable is similar across items.
Confirmatory Factor Analysis
CSAP Na tional Cross-site Evaluation–Final Technical Report 66
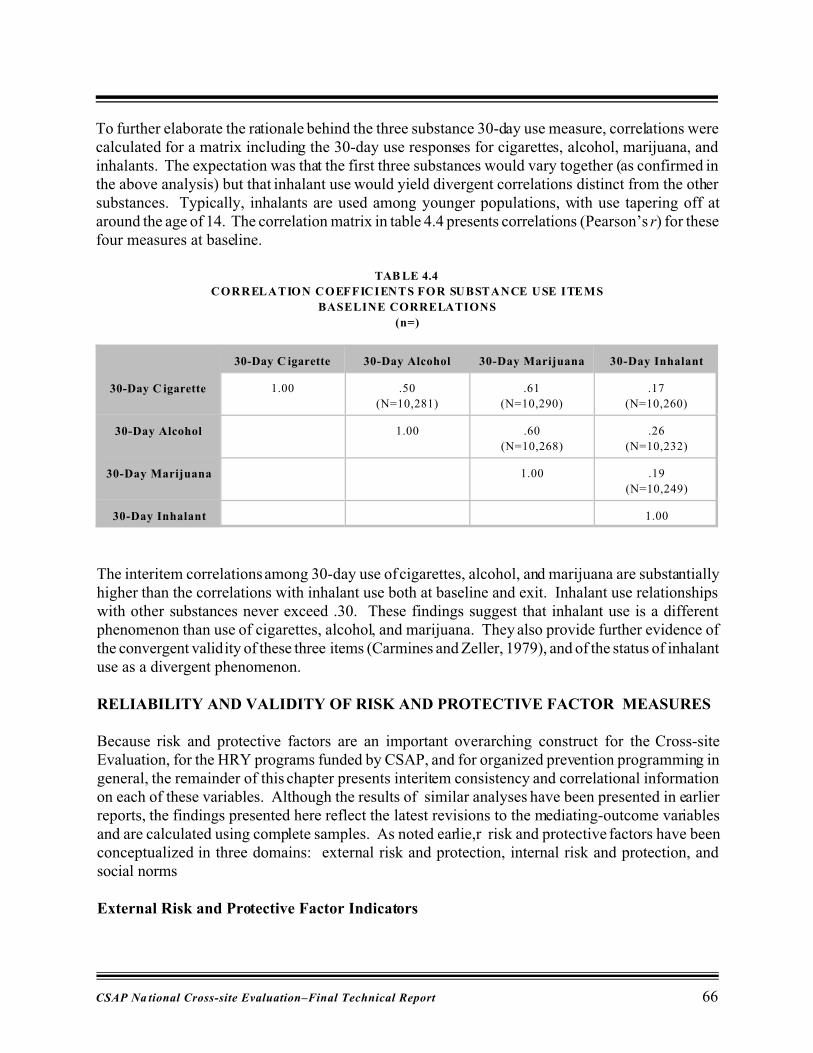
To further elaborate the rationale behind the three substance 30-day use measure, correlations werecalculated for a matrix including the 30-day use responses for cigarettes, alcohol, marijuana, andinhalants. The expectation was that the first three substances would vary together (as confirmed inthe above analysis) but that inhalant use would yield divergent correlations distinct from the othersubstances. Typically, inhalants are used among younger populations, with use tapering off ataround the age of 14. The correlation matrix in table 4.4 presents correlations (Pearson’s r) for thesefour measures at baseline.
TAB LE 4.4
CORRELATION COEFFICIENTS FOR SUBSTANCE USE ITEMS
BASELINE CORRELATIONS
(n=)
30-Day C igarette 30-Day Alcohol 30-Day Marijuana 30-Day Inhalant
30-Day C igarette 1.00 .50
(N=10,281)
.61
(N=10,290)
.17
(N=10,260)
30-Day Alcohol 1.00 .60
(N=10,268)
.26
(N=10,232)
30-Day Marijuana 1.00 .19
(N=10,249)
30-Day Inhalant 1.00
The interitem correlations among 30-day use of cigarettes, alcohol, and marijuana are substantiallyhigher than the correlations with inhalant use both at baseline and exit. Inhalant use relationshipswith other substances never exceed .30. These findings suggest that inhalant use is a differentphenomenon than use of cigarettes, alcohol, and marijuana. They also provide further evidence ofthe convergent validity of these three items (Carmines and Zeller, 1979), and of the status of inhalantuse as a divergent phenomenon.
RELIABILITY AND VALIDITY OF RISK AND PROTECTIVE FACTOR MEASURES
Because risk and protective factors are an important overarching construct for the Cross-siteEvaluation, for the HRY programs funded by CSAP, and for organized prevention programming ingeneral, the remainder of this chapter presents interitem consistency and correlational informationon each of these variables. Although the results of similar analyses have been presented in earlierreports, the findings presented here reflect the latest revisions to the mediating-outcome variablesand are calculated using complete samples. As noted earlie,r risk and protective factors have beenconceptualized in three domains: external risk and protection, internal risk and protection, andsocial norms
External Risk and Protective Factor Indicators
** Categories for the family supervision questions were (1) YES! (2) yes (3) no, and ( 4) NO! Categories for school prevention
environment were yes/no. Response categories for the community prevention environment construct was (1) almost every day, (2) once or twice a
week, (3) a few times a mon th, (4) a few times a year, and (5) nev er.
CSAP Na tional Cross-site Evaluation–Final Technical Report 67
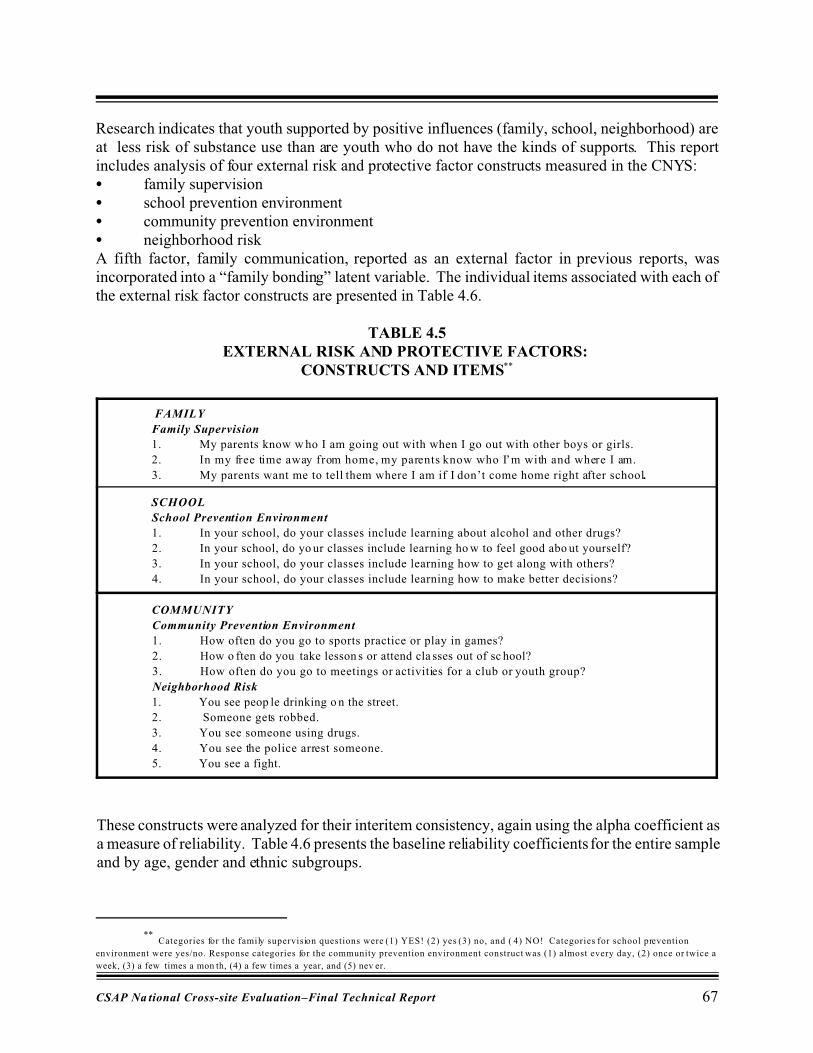
Research indicates that youth supported by positive influences (family, school, neighborhood) areat less risk of substance use than are youth who do not have the kinds of supports. This reportincludes analysis of four external risk and protective factor constructs measured in the CNYS: C family supervisionC school prevention environmentC community prevention environmentC neighborhood riskA fifth factor, family communication, reported as an external factor in previous reports, wasincorporated into a “family bonding” latent variable. The individual items associated with each ofthe external risk factor constructs are presented in Table 4.6.
TABLE 4.5EXTERNAL RISK AND PROTECTIVE FACTORS:
CONSTRUCTS AND ITEMS**
FAMILY
Family Supervision
1. My parents know w ho I am going out with when I go out with other boys or girls.
2. In my free time away from home, my parents know who I’m with and where I am.
3. My parents want me to tell them where I am if I don’t come home right after school.
SCHOOL
School Prevention Environment
1. In your school, do your classes include learning about alcohol and other drugs?
2. In your school, do yo ur classes include learning ho w to feel good abo ut yourself?
3. In your school, do your classes include learning how to get along with others?
4. In your school, do your classes include learning how to make better decisions?
COMMUNITY
Community Prevention Environment
1. How often do you go to sports practice or play in games?
2. How o ften do you take lesson s or attend cla sses out of sc hool?
3. How often do you go to meetings or activities for a club or youth group?
Neighborhood Risk
1. You see peop le drinking o n the street.
2. Someone gets robbed.
3. You see someone using drugs.
4. You see the police arrest someone.
5. You see a fight.
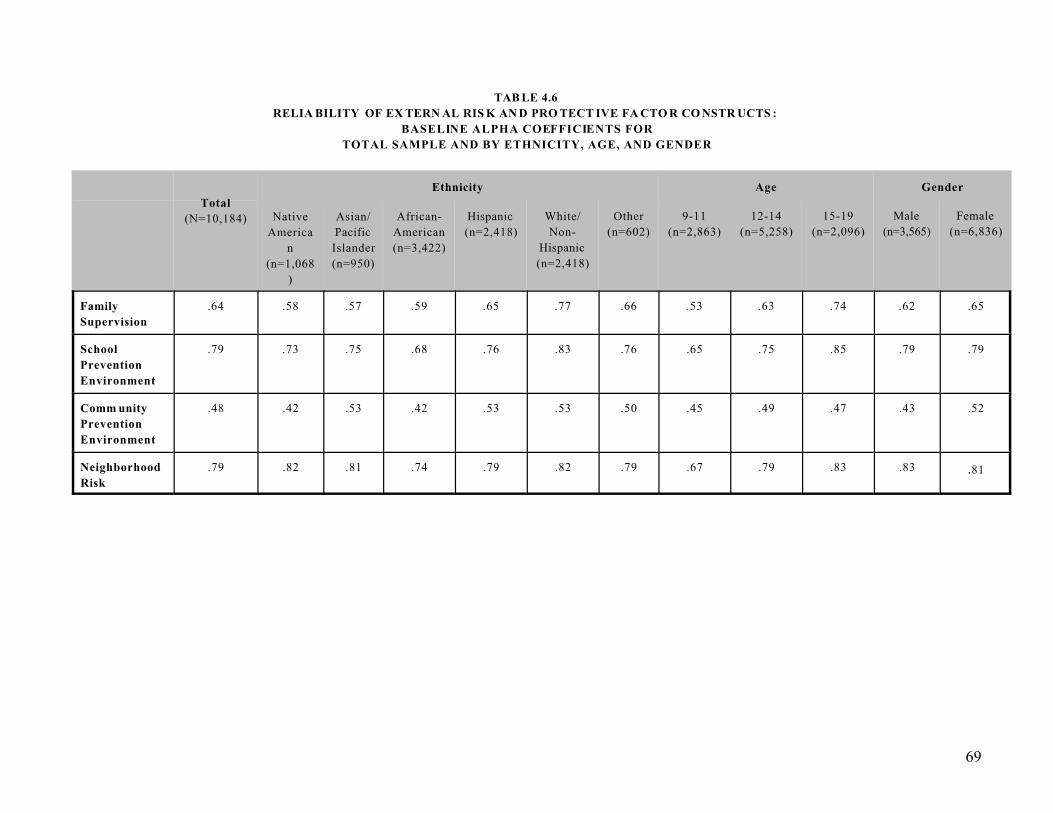
These constructs were analyzed for their interitem consistency, again using the alpha coefficient asa measure of reliability. Table 4.6 presents the baseline reliability coefficients for the entire sampleand by age, gender and ethnic subgroups.

CSAP Na tional Cross-site Evaluation–Final Technical Report 68
69
TAB LE 4.6
RELIA BILITY OF EX TERN AL RIS K AN D PRO TECT IVE FA CTO R CO NSTR UCTS :
BASELINE ALPHA COEFFICIENTS FOR
TOTAL SAMPLE AND BY ETHNICITY, AGE, AND GENDER
Total
(N=10,184)
Ethnicity Age Gender
Native
America
n
(n=1,068
)
Asian/
Pacific
Islander
(n=950)
African-
American
(n=3,422)
Hispanic
(n=2,418)
White/
Non-
Hispanic
(n=2,418)
Other
(n=602)
9-11
(n=2,863)
12-14
(n=5,258)
15-19
(n=2,096)
Male
(n=3,565)
Female
(n=6,836)
Family
Supervision
.64 .58 .57 .59 .65 .77 .66 .53 .63 .74 .62 .65
School
Prevention
Environment
.79 .73 .75 .68 .76 .83 .76 .65 .75 .85 .79 .79
Comm unity
Prevention
Environment
.48 .42 .53 .42 .53 .53 .50 .45 .49 .47 .43 .52
Neighborhood
Risk
.79 .82 .81 .74 .79 .82 .79 .67 .79 .83 .83 .81
CSAP Na tional Cross-site Evaluation–Final Technical Report 70
Several observations are warranted:
C The alpha coefficients reported indicate a moderate level of interitem consistency for theserisk and protection measures, with some variation between specific measures. The interitemconsistencies for neighborhood risk items are highest. Low interitem consistency forcommunity prevention environment is not sufficient to eliminate this measure from thestudy, for several reasons. First, the scale for this variable contains only three items. Second,it can be thought of as a behavioral observation checklist for which interitem consistency isnot a necessary criterion for reliability. Third, the measure is of theoretical importance tothe study.
C Differences across gender and ethnic groups are minimal. Reliability scores increase withage, except in the area of community prevention.
Although numerous components of the external environment may shape attitudes and behaviors,these variables represent select dimensions of the three levels of external environment thought tobe particularly relevant to this study:
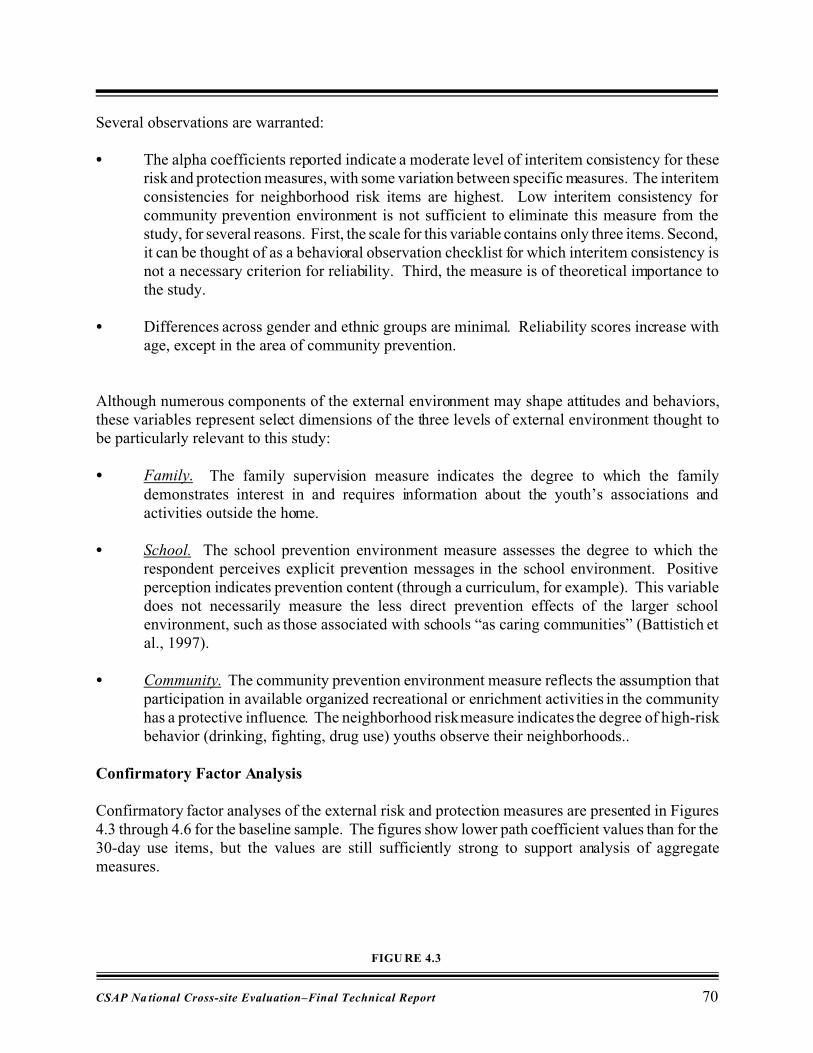
C Family. The family supervision measure indicates the degree to which the familydemonstrates interest in and requires information about the youth’s associations andactivities outside the home.
C School. The school prevention environment measure assesses the degree to which therespondent perceives explicit prevention messages in the school environment. Positiveperception indicates prevention content (through a curriculum, for example). This variabledoes not necessarily measure the less direct prevention effects of the larger schoolenvironment, such as those associated with schools “as caring communities” (Battistich etal., 1997).
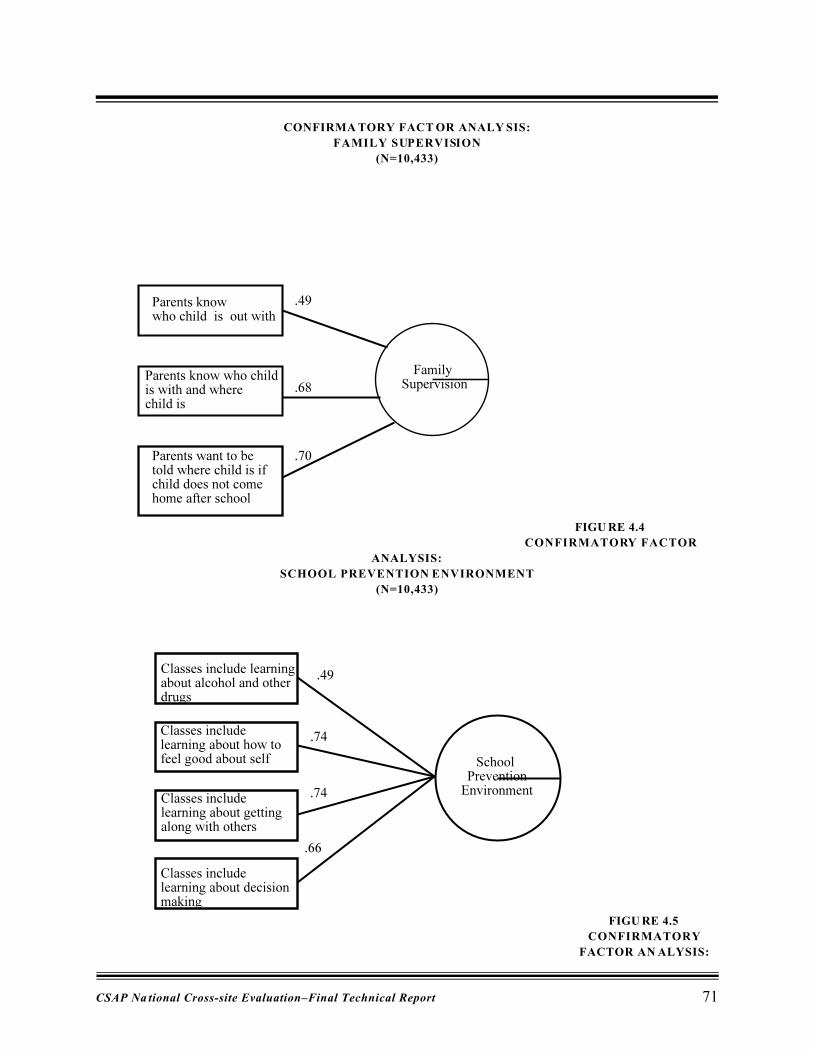
C Community. The community prevention environment measure reflects the assumption thatparticipation in available organized recreational or enrichment activities in the communityhas a protective influence. The neighborhood risk measure indicates the degree of high-riskbehavior (drinking, fighting, drug use) youths observe their neighborhoods..
Confirmatory Factor Analysis
Confirmatory factor analyses of the external risk and protection measures are presented in Figures4.3 through 4.6 for the baseline sample. The figures show lower path coefficient values than for the30-day use items, but the values are still sufficiently strong to support analysis of aggregatemeasures.
FIGU RE 4.3
CSAP Na tional Cross-site Evaluation–Final Technical Report 71
CONFIRMA TORY FACT OR ANALY SIS:
FAMILY SUPERVISION
(N=10,433)
FIGU RE 4.4
CONFIRMATORY FACTOR
ANALYSIS:
SCHOOL PREVENTION ENVIRONMENT
(N=10,433)
FIGU RE 4.5
CONFIRMATORY
FACTOR AN ALYSIS:
CSAP Na tional Cross-site Evaluation–Final Technical Report 72
COMMUNITY PREVENTION ENVIRONMENT
(N=10,433)
FIGU RE 4.6
CONFIRMATORY FACTOR
ANALYSIS:
NEIGHBOR HOOD RISK
(N=10,433)
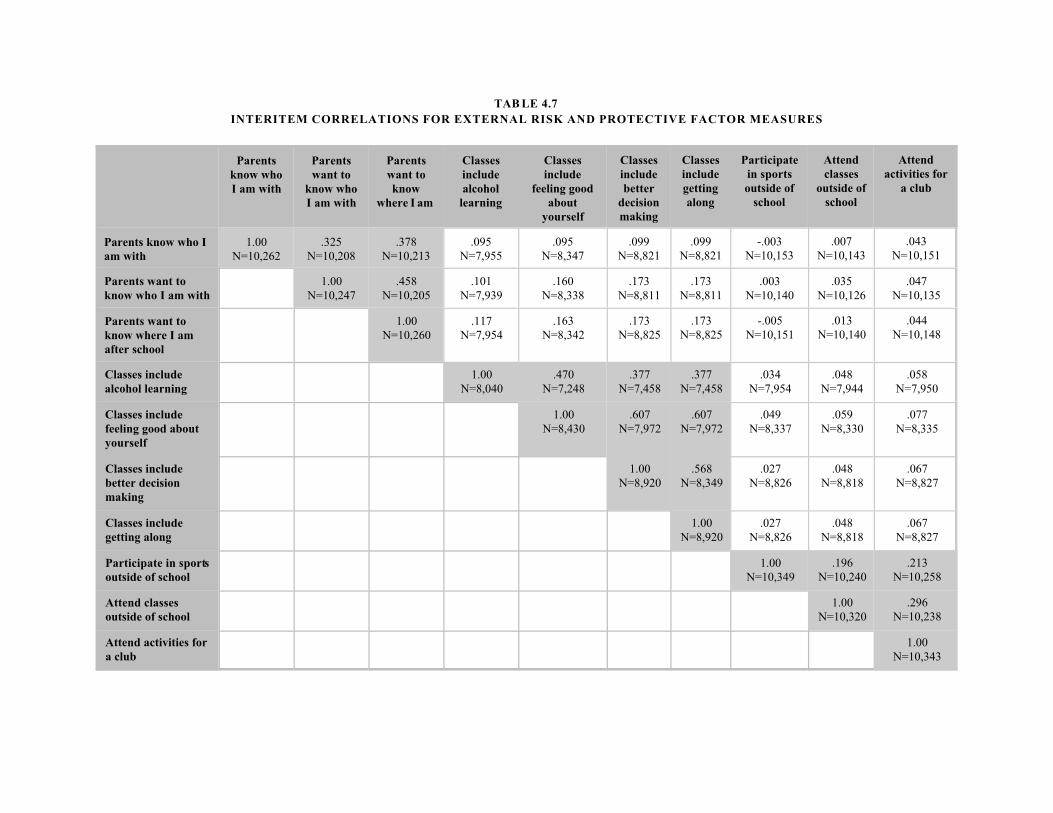
TAB LE 4.7
INTERITEM CORRELATIONS FOR EXTERNAL RISK AND PROTECTIVE FACTOR MEASURES
Parentsknow whoI am with
Parentswant to
know whoI am with
Parentswant toknow
where I am
Classesincludealcohol
learning
Classesinclude
feeling goodabout
yourself
Classesincludebetter
decisionmaking
Classesincludegettingalong
Participatein sportsoutside of
school
Attendclasses
outside ofschool
Attendactivities for
a club
Parents know who Iam with
1.00N=10,262
.325N=10,208
.378N=10,213
.095N=7,955
.095N=8,347
.099N=8,821
.099N=8,821
-.003N=10,153
.007N=10,143
.043N=10,151
Parents want toknow who I am with
1.00N=10,247
.458N=10,205
.101N=7,939
.160N=8,338
.173N=8,811
.173N=8,811
.003N=10,140
.035N=10,126
.047N=10,135
Parents want toknow where I amafter school
1.00N=10,260
.117N=7,954
.163N=8,342
.173N=8,825
.173N=8,825
-.005N=10,151
.013N=10,140
.044N=10,148
Classes includealcohol learning
1.00N=8,040
.470N=7,248
.377N=7,458
.377N=7,458
.034N=7,954
.048N=7,944
.058N=7,950
Classes includefeeling good aboutyourself
1.00N=8,430
.607N=7,972
.607N=7,972
.049N=8,337
.059N=8,330
.077N=8,335
Classes includebetter decisionmaking
1.00N=8,920
.568N=8,349
.027N=8,826
.048N=8,818
.067N=8,827
Classes includegetting along
1.00N=8,920
.027N=8,826
.048N=8,818
.067N=8,827
Participate in sportsoutside of school
1.00N=10,349
.196N=10,240
.213N=10,258
Attend classesoutside of school
1.00N=10,320
.296N=10,238
Attend activities fora club
1.00N=10,343
CSAP Na tional Cross-site Evaluation–Final Technical Report 74
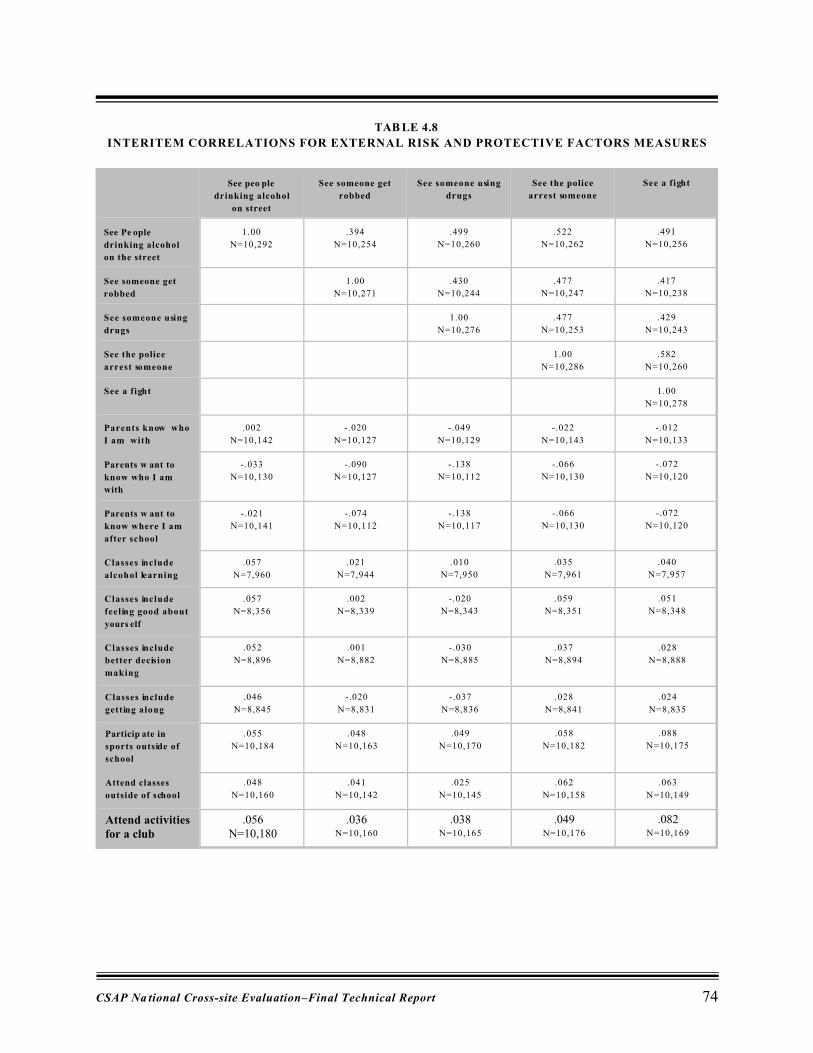
TAB LE 4.8
INTERITEM CORRELATIONS FOR EXTERNAL RISK AND PROTECTIVE FACTORS MEASURES
See peo ple
drinking alcohol
on street
See someone get
robbed
See someone using
drugs
See the police
arrest someone
See a fight
See Pe ople
drinking alcohol
on the street
1.00
N=10,292
.394
N=10,254
.499
N=10,260
.522
N=10,262
.491
N=10,256
See someone get
robbed
1.00
N=10,271
.430
N=10,244
.477
N=10,247
.417
N=10,238
See someone using
drugs
1.00
N=10,276
.477
N=10,253
.429
N=10,243
See the police
arrest someone
1.00
N=10,286
.582
N=10,260
See a fight 1.00
N=10,278
Parents know who
I am with
.002
N=10,142
-.020
N=10,127
-.049
N=10,129
-.022
N=10,143
-.012
N=10,133
Parents w ant to
know who I am
with
-.033
N=10,130
-.090
N=10,127
-.138
N=10,112
-.066
N=10,130
-.072
N=10,120
Parents w ant to
know where I am
after school
-.021
N=10,141
-.074
N=10,112
-.138
N=10,117
-.066
N=10,130
-.072
N=10,120
Classes include
alcohol learning
.057
N=7,960
.021
N=7,944
.010
N=7,950
.035
N=7,961
.040
N=7,957
Classes include
feeling good about
yours elf
.057
N=8,356
.002
N=8,339
-.020
N=8,343
.059
N=8,351
.051
N=8,348
Classes include
better decision
making
.052
N=8,896
.001
N=8,882
-.030
N=8,885
.037
N=8,894
.028
N=8,888
Classes include
getting along
.046
N=8,845
-.020
N=8,831
-.037
N=8,836
.028
N=8,841
.024
N=8,835
Particip ate in
sports outside of
school
.055
N=10,184
.048
N=10,163
.049
N=10,170
.058
N=10,182
.088
N=10,175
Attend classes
outside of school
.048
N=10,160
.041
N=10,142
.025
N=10,145
.062
N=10,158
.063
N=10,149
Attend activitiesfor a club
.056N=10,180
.036N=10,160
.038N=10,165
.049N=10,176
.082N=10,169
CSAP Na tional Cross-site Evaluation–Final Technical Report 75
Correlational Analysis
A bivariate correlational analysis was conducted for the four external risk and protective factormeasures. The results are presented in Table 4.8. Although not as strong as those for the substanceuse measures, correlations within scales are more robust than are correlations across scales. Allwithin-scale correlations exceed .20, with the strongest correlations within the school preventionmeasure. Correlations across scales are not strong, with most correlations below .10. Because thesescales measure different phenomena (family, school, and community factors), this finding isexpected. Findings are also consistent with the convergent and construct validity of these measures.
INTERNAL RISK AND PROTECTIVE FACTOR INDICATORS
Internal risk and protective factors are the focal point of the HRY programs in this study. Whereas external risk and protective factors and social norm indicators measure environmentalinfluences that can protect youth from substance use, internal indicators measure the extent towhich youth themselves have attitudes, self-perceptions, or internal orientations to life thatprotect them against substance abuse. These internal measures reflect the focus of protectivefactor literature on the ability of youth to draw on internal resources to cope with theirenvironment.
There are three measures of internal risk and protection in the cross-site analysis: C academic self-efficacyC family bondingC self-control..Academic self-efficacy is a new latent variable that is a combination of the school bonding andself-efficacy measures reported in previous analyses. This variable combines positive attitudestoward school with the belief that one is capable of productive work that will bring rewards. Family bonding is also a new latent variable composed of family bonding and familycommunication. Both of these latent variables are a product of the structural equation models ofbaseline data described in Chapter Five. Table 4.9 presents the items used to measure theacademic self-efficacy, family bonding, and self-control constructs.
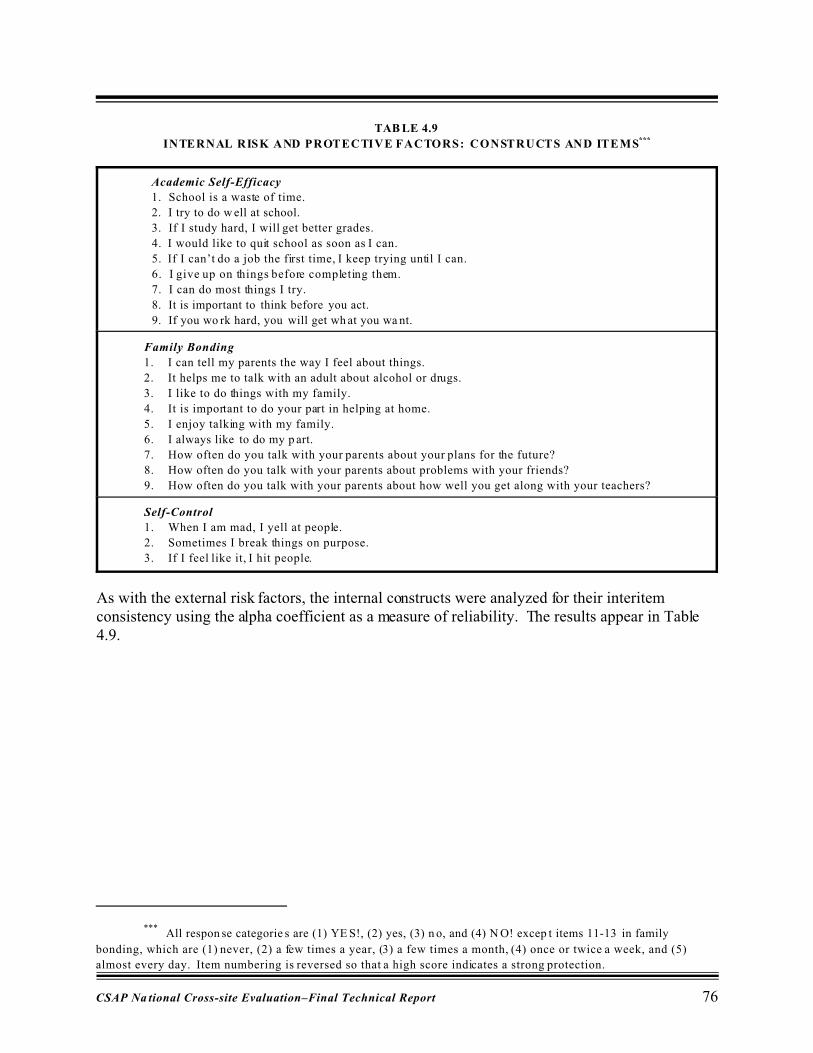
*** All respon se categorie s are (1) YE S!, (2) yes, (3) n o, and (4) N O! excep t items 11-13 in family
bonding, which are (1) never, (2) a few times a year, (3) a few times a month, (4) once or twice a week, and (5)
almost every day. Item numbering is reversed so that a high score indicates a strong protection.
CSAP Na tional Cross-site Evaluation–Final Technical Report 76
TAB LE 4.9
INTERNAL RISK AND PROTECTIVE FACTORS: CONSTRUCTS AND ITEMS***
Academic Self-Efficacy
1. School is a waste of time.
2. I try to do w ell at school.
3. If I study hard, I will get better grades.
4. I would like to quit school as soon as I can.
5. If I can’t do a job the first time, I keep trying until I can.
6. I give up on things before completing them.
7. I can do most things I try.
8. It is important to think before you act.
9. If you wo rk hard, you will get wh at you wa nt.
Family Bonding
1. I can tell my parents the way I feel about things.
2. It helps me to talk with an adult about alcohol or drugs.
3. I like to do things with my family.
4. It is important to do your part in helping at home.
5. I enjoy talking with my family.
6. I always like to do my p art.
7. How often do you talk with your parents about your plans for the future?
8. How often do you talk with your parents about problems with your friends?
9. How often do you talk with your parents about how well you get along with your teachers?
Self-Control
1. When I am mad, I yell at people.
2. Sometimes I break things on purpose.
3. If I feel like it, I hit people.
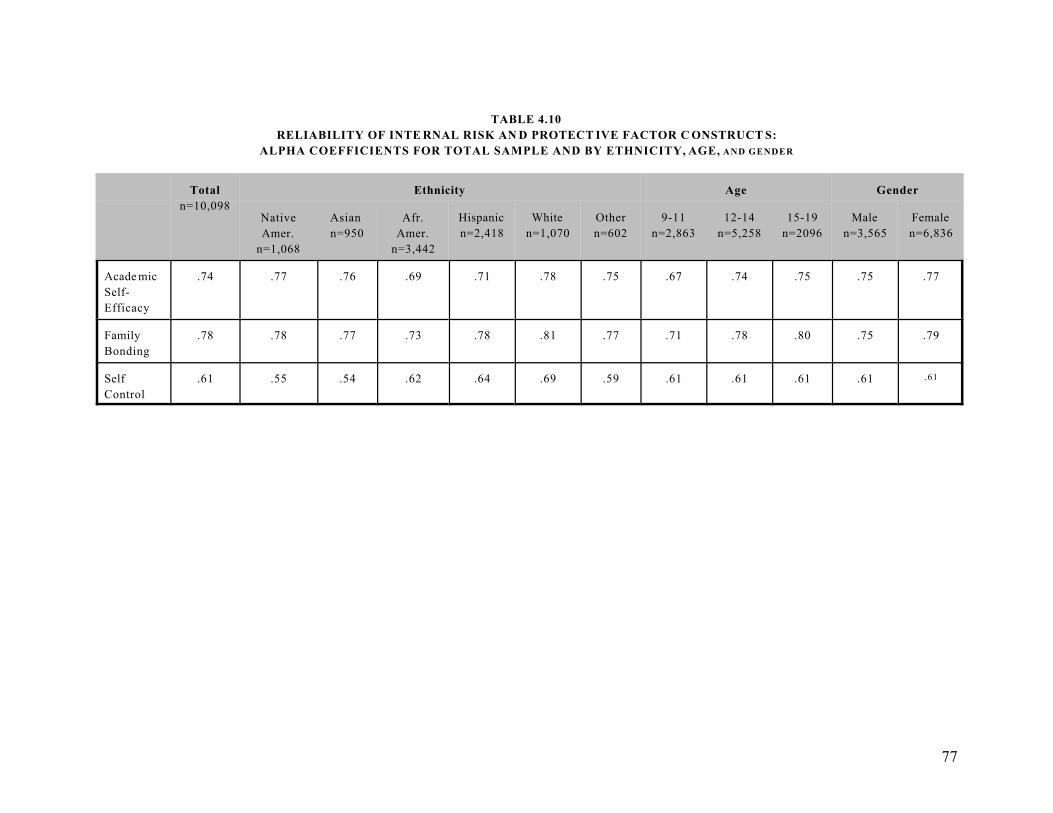
As with the external risk factors, the internal constructs were analyzed for their interitemconsistency using the alpha coefficient as a measure of reliability. The results appear in Table4.9.
77
TABLE 4.10
RELIABILITY OF INTE RNAL RISK AN D PROTECT IVE FACTOR C ONSTRUCT S:
ALPHA COEFFICIENTS FOR TOTAL SAMPLE AND BY ETHNICITY, AGE, AND GENDER
Total
n=10,098
Ethnicity Age Gender
Native
Amer.
n=1,068
Asian
n=950
Afr.
Amer.
n=3,442
Hispanic
n=2,418
White
n=1,070
Other
n=602
9-11
n=2,863
12-14
n=5,258
15-19
n=2096
Male
n=3,565
Female
n=6,836
Acade mic
Self-
Efficacy
.74 .77 .76 .69 .71 .78 .75 .67 .74 .75 .75 .77
Family
Bonding
.78 .78 .77 .73 .78 .81 .77 .71 .78 .80 .75 .79
Self
Control
.61 .55 .54 .62 .64 .69 .59 .61 .61 .61 .61 .61
CSAP Na tional Cross-site Evaluation–Final Technical Report 78
The table indicates that:C The alpha coefficients for academic self-efficacy and family bonding are well within the range
of acceptability. The lower alpha coefficients for self-control are expected because there arefewer items (3) in that scale.
C Interitem consistency increases with age across all of the measures with the exception of self-control, suggesting that youth’s cognitive coherence increases with age. However, all alphacoefficients are .60 or above.
C The coefficients are relatively stable across racial/ethnic groups, though the alpha coefficientfor self-control is below .60 forNative American and Asian youth. These items are consistent across gender.
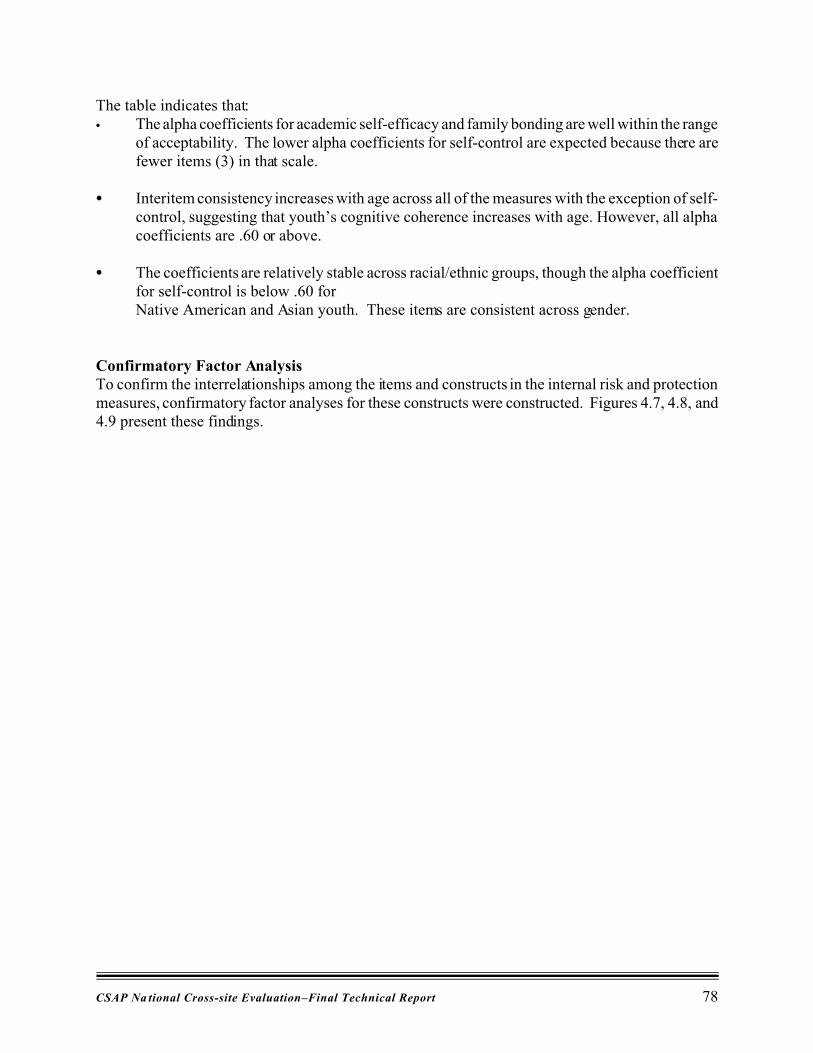
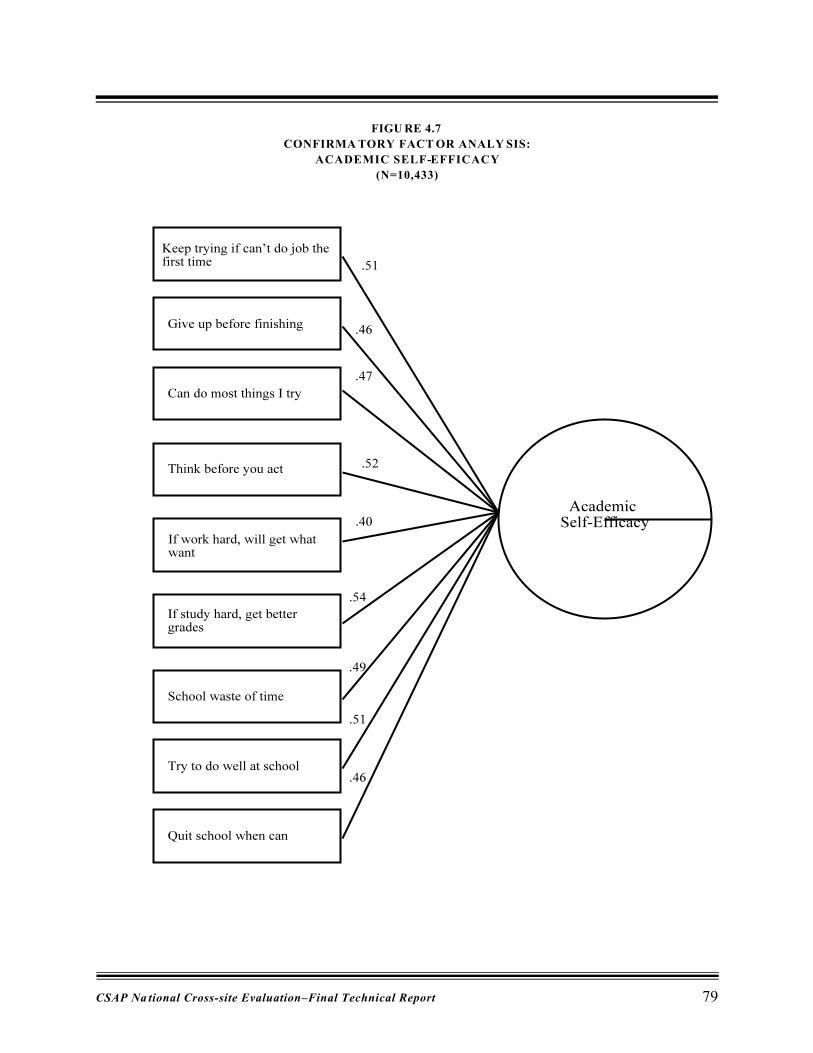
Confirmatory Factor AnalysisTo confirm the interrelationships among the items and constructs in the internal risk and protectionmeasures, confirmatory factor analyses for these constructs were constructed. Figures 4.7, 4.8, and4.9 present these findings.
CSAP Na tional Cross-site Evaluation–Final Technical Report 79
FIGU RE 4.7
CONFIRMA TORY FACT OR ANALY SIS:
ACADEMIC SELF-EFFICACY
(N=10,433)
CSAP Na tional Cross-site Evaluation–Final Technical Report 80
FIGU RE 4.8
CONFIRMA TORY FACT OR ANALY SIS:
FAMILY BONDING
(N=10,433)
CSAP Na tional Cross-site Evaluation–Final Technical Report 81
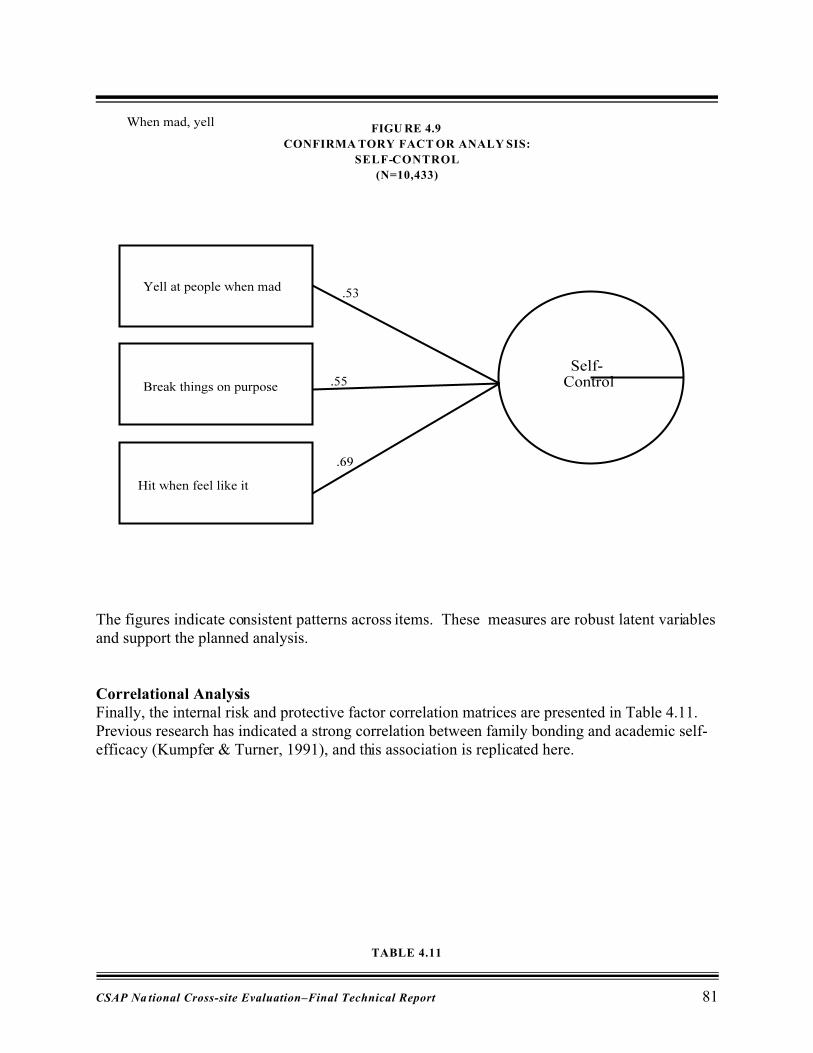
FIGU RE 4.9
CONFIRMA TORY FACT OR ANALY SIS:
SELF-CONTROL
(N=10,433)
The figures indicate consistent patterns across items. These measures are robust latent variablesand support the planned analysis.
Correlational AnalysisFinally, the internal risk and protective factor correlation matrices are presented in Table 4.11.Previous research has indicated a strong correlation between family bonding and academic self-efficacy (Kumpfer & Turner, 1991), and this association is replicated here.
TABLE 4.11
CSAP Na tional Cross-site Evaluation–Final Technical Report 82
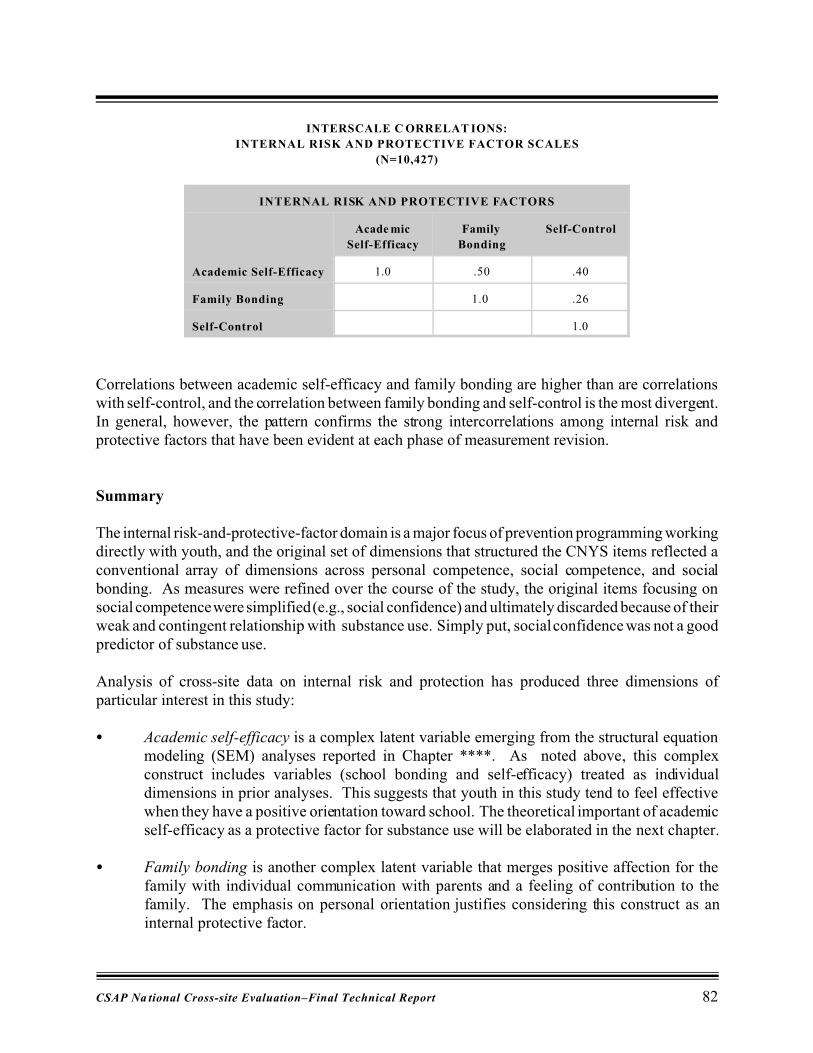
INTERSCALE C ORRELAT IONS:
INTERNAL RISK AND PROTECTIVE FACTOR SCALES
(N=10,427)
INTERNAL RISK AND PROTECTIVE FACTORS
Acade mic
Self-Efficacy
Family
Bonding
Self-Control
Academic Self-Efficacy 1.0 .50 .40
Family Bonding 1.0 .26
Self-Control 1.0
Correlations between academic self-efficacy and family bonding are higher than are correlationswith self-control, and the correlation between family bonding and self-control is the most divergent.In general, however, the pattern confirms the strong intercorrelations among internal risk andprotective factors that have been evident at each phase of measurement revision.
Summary
The internal risk-and-protective-factor domain is a major focus of prevention programming workingdirectly with youth, and the original set of dimensions that structured the CNYS items reflected aconventional array of dimensions across personal competence, social competence, and socialbonding. As measures were refined over the course of the study, the original items focusing onsocial competence were simplified (e.g., social confidence) and ultimately discarded because of theirweak and contingent relationship with substance use. Simply put, social confidence was not a goodpredictor of substance use.
Analysis of cross-site data on internal risk and protection has produced three dimensions ofparticular interest in this study:
C Academic self-efficacy is a complex latent variable emerging from the structural equationmodeling (SEM) analyses reported in Chapter ****. As noted above, this complexconstruct includes variables (school bonding and self-efficacy) treated as individualdimensions in prior analyses. This suggests that youth in this study tend to feel effectivewhen they have a positive orientation toward school. The theoretical important of academicself-efficacy as a protective factor for substance use will be elaborated in the next chapter.
C Family bonding is another complex latent variable that merges positive affection for thefamily with individual communication with parents and a feeling of contribution to thefamily. The emphasis on personal orientation justifies considering this construct as aninternal protective factor.
CSAP Na tional Cross-site Evaluation–Final Technical Report 83
C Self-control is a short scale that has maintained a separate structure and an independentcontribution to substance use throughout the analyses. The other factors that have emergedin this domain focus on youths’ orientation to significant external environments, butself-control focuses on youths’ relation to their own impulses and their ability to controlthem. In this sense self-control may be a deeper personal trait than the others.
Thus, the phased analysis of measurement conducted in the study to date has simplified the manyintercorrelated internal risk and protection measures into three distinct constructs. These outcomemediators play an important role in this study because internal risk and protective factors have beenidentified as the focal mediating-outcome domain for prevention programs.
SUBSTANCE USE NORM INDICATORS
The attitudes and behaviors of significant others in a youth’s social milieu have consistently beenshown to be strong correlates of substance use. Three constructs included in the CNYS measuresocial norm attitudes or behavior toward substance use:C perceived parental attitudes toward their child’s use of tobacco, alcohol, and marijuanaC perceived peer use of tobacco, alcohol, and marijuanaC perceived peer attitudes toward the youth’s use of tobacco, alcohol, and marijuana
For this analysis, each of these constructs is analyzed separately; and each measure consists of threeitems. These constructs and individual items are presented in Table 4.12.
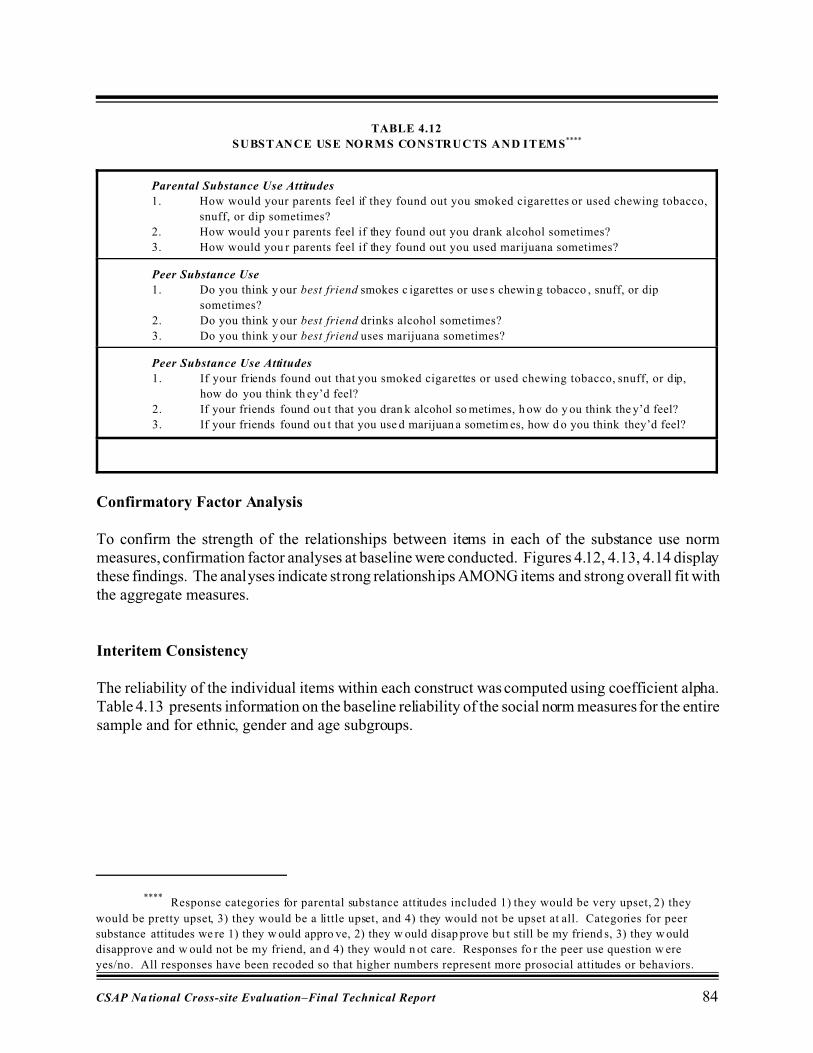
**** Response categories for parental substance attitudes included 1) they would be very upset, 2) they
would be pretty upset, 3) they would be a little upset, and 4) they would not be upset at all. Categories for peer
substance attitudes we re 1) they w ould appro ve, 2) they w ould disap prove bu t still be my friend s, 3) they w ould
disapprove and w ould not be my friend, an d 4) they would n ot care. Responses fo r the peer use question w ere
yes/no. All responses have been recoded so that higher numbers represent more prosocial attitudes or behaviors.
CSAP Na tional Cross-site Evaluation–Final Technical Report 84
TABLE 4.12
SUBSTANCE USE NORMS CONSTRUCTS AND ITEMS****
Parental Substance Use Attitudes
1. How would your parents feel if they found out you smoked cigarettes or used chewing tobacco,
snuff, or dip sometimes?
2. How would you r parents feel if they found out you drank alcohol sometimes?
3. How would you r parents feel if they found out you used marijuana sometimes?
Peer Substance Use
1. Do you think y our best friend smokes c igarettes or use s chewin g tobacco , snuff, or dip
sometimes?
2. Do you think y our best friend drinks alcohol sometimes?
3. Do you think y our best friend uses marijuana sometimes?
Peer Substance Use Attitudes
1. If your friends found out that you smoked cigarettes or used chewing tobacco, snuff, or dip,
how do you think th ey’d feel?
2. If your friends found ou t that you dran k alcohol so metimes, h ow do y ou think the y’d feel?
3. If your friends found ou t that you use d marijuan a sometim es, how d o you think they’d feel?
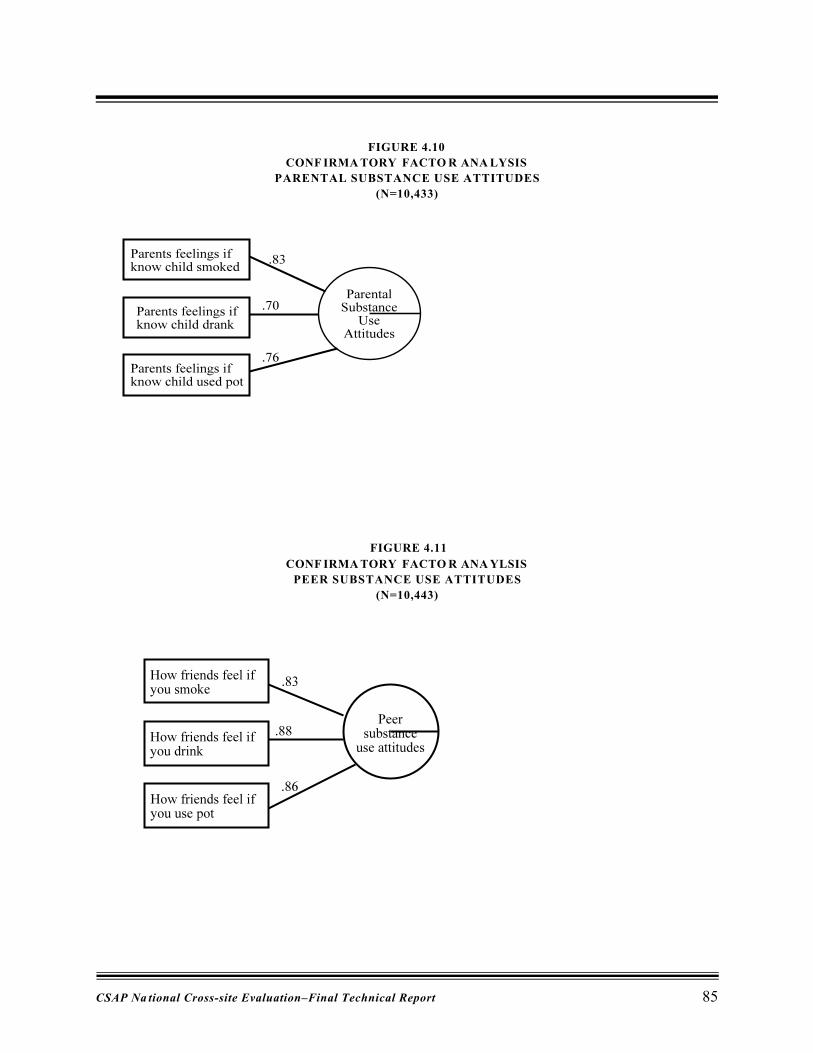
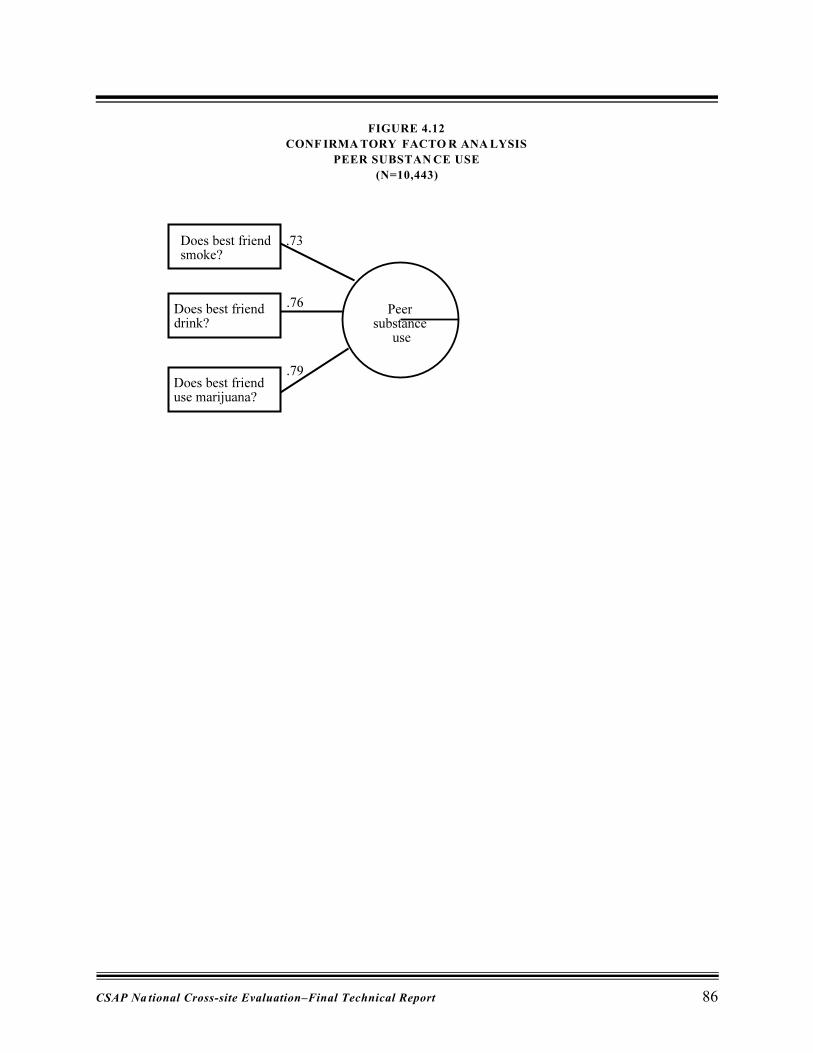
Confirmatory Factor Analysis
To confirm the strength of the relationships between items in each of the substance use normmeasures, confirmation factor analyses at baseline were conducted. Figures 4.12, 4.13, 4.14 displaythese findings. The analyses indicate strong relationships AMONG items and strong overall fit withthe aggregate measures.
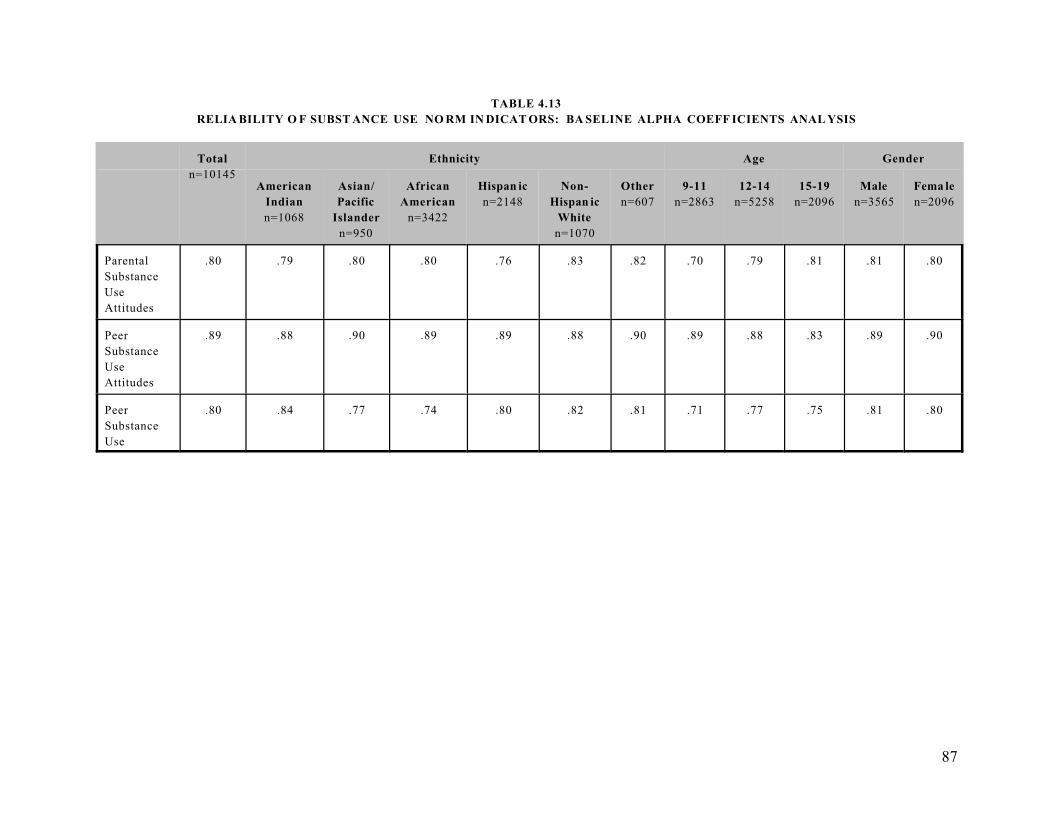
Interitem Consistency
The reliability of the individual items within each construct was computed using coefficient alpha.Table 4.13 presents information on the baseline reliability of the social norm measures for the entiresample and for ethnic, gender and age subgroups.
CSAP Na tional Cross-site Evaluation–Final Technical Report 85
FIGURE 4.10
CONF IRMA TORY FACTO R ANA LYSIS
PARENTAL SUBSTANCE USE ATTITUDES
(N=10,433)
FIGURE 4.11
CONF IRMA TORY FACTO R ANA YLSIS
PEER SUBSTANCE USE ATTITUDES
(N=10,443)
CSAP Na tional Cross-site Evaluation–Final Technical Report 86
FIGURE 4.12
CONF IRMA TORY FACTO R ANA LYSIS
PEER SUBSTAN CE USE
(N=10,443)
87
TABLE 4.13
RELIA BILITY O F SUBST ANCE USE NO RM IN DICAT ORS: BA SELINE ALPHA COEFF ICIENTS ANAL YSIS
Total
n=10145
Ethnicity Age Gender
American
Indian
n=1068
Asian/
Pacific
Islander
n=950
African
American
n=3422
Hispan ic
n=2148
Non-
Hispan ic
White
n=1070
Other
n=607
9-11
n=2863
12-14
n=5258
15-19
n=2096
Male
n=3565
Fema le
n=2096
Parental
Substance
Use
Attitudes
.80 .79 .80 .80 .76 .83 .82 .70 .79 .81 .81 .80
Peer
Substance
Use
Attitudes
.89 .88 .90 .89 .89 .88 .90 .89 .88 .83 .89 .90
Peer
Substance
Use
.80 .84 .77 .74 .80 .82 .81 .71 .77 .75 .81 .80
CSAP Na tional Cross-site Evaluation–Final Technical Report 88
Table 4.13 indicates the following:
C The alpha coefficients for the substance-use-norm constructs are within the acceptablerange; alpha coefficients for the total sample equal or exceed .80, and coefficients forsubsamples equa lor exceed .70.
C The reliability coefficients for all age groups are acceptable, ranging from .70 to .89.
C In the areas of parental substance use attitudes and peer substance use attitudes,reliability coefficients are slightly higher among those of Asian ethnicity. In the peersubstance use construct, reliability coefficients are slightly higher for Native Americansand Whites. Despite small differences, all reliability coefficients for all ethnic groups arerelatively high.
Despite these moderate variations, the selected social norm measures yield a consistent pattern ofinteritem consistency.
Interitem Correlations
Table 4.14 presents the correlation coefficients for parental and peer attitudes and peer use. Theinteritem correlations within the parental attitudes, peer attitudes, and peer use items are quitestrong (r >.55 for all relationships), as reflected in the reliability coefficients.
Convergent validity is affirmed in the comparison of the within-scale correlations and thebetween-scale correlations. Although interitem correlations of all social norm variables aremoderate (r >.20), all within-scale correlations are considerably higher than between-scalecorrelations. This analysis thus affirms the structure of the three substance-use-norm measures.
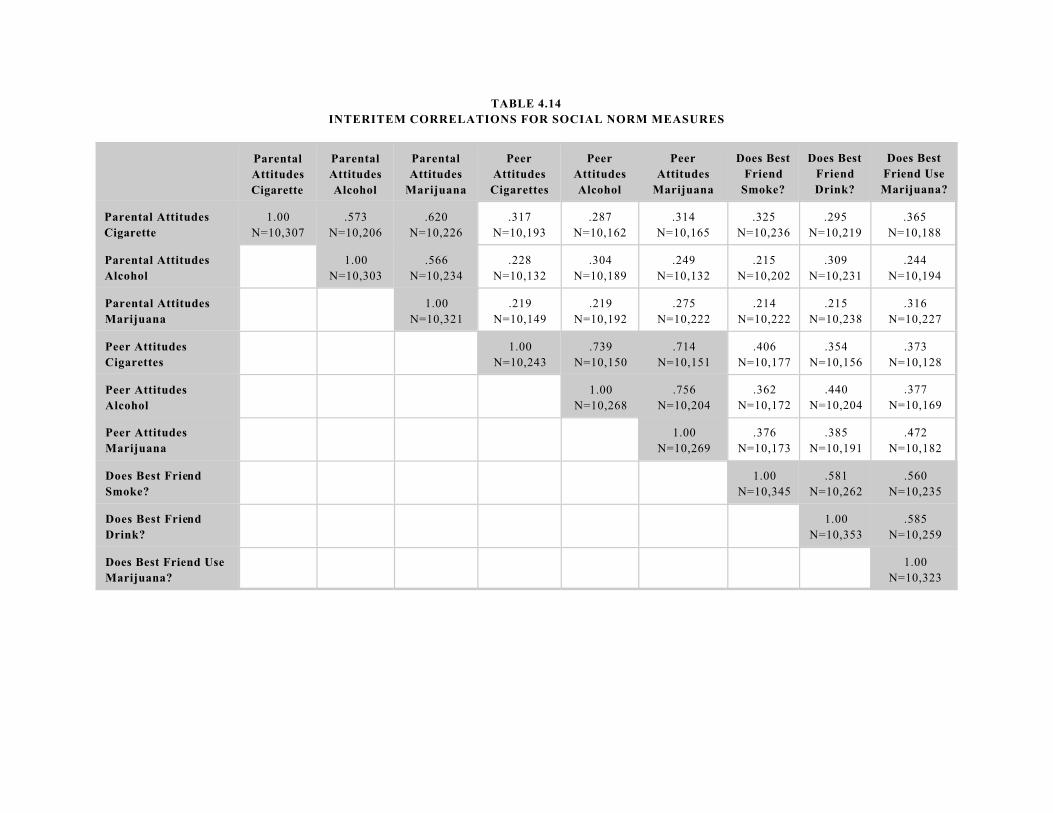
TABLE 4.14
INTERITEM CORRELATIONS FOR SOCIAL NORM MEASURES
Parental
Attitudes
Cigarette
Parental
Attitudes
Alcohol
Parental
Attitudes
Marijuana
Peer
Attitudes
Cigarettes
Peer
Attitudes
Alcohol
Peer
Attitudes
Marijuana
Does Best
Friend
Smoke?
Does Best
Friend
Drink?
Does Best
Friend Use
Marijuana?
Parental Attitudes
Cigarette
1.00
N=10,307
.573
N=10,206
.620
N=10,226
.317
N=10,193
.287
N=10,162
.314
N=10,165
.325
N=10,236
.295
N=10,219
.365
N=10,188
Parental Attitudes
Alcohol
1.00
N=10,303
.566
N=10,234
.228
N=10,132
.304
N=10,189
.249
N=10,132
.215
N=10,202
.309
N=10,231
.244
N=10,194
Parental Attitudes
Marijuana
1.00
N=10,321
.219
N=10,149
.219
N=10,192
.275
N=10,222
.214
N=10,222
.215
N=10,238
.316
N=10,227
Peer Attitudes
Cigarettes
1.00
N=10,243
.739
N=10,150
.714
N=10,151
.406
N=10,177
.354
N=10,156
.373
N=10,128
Peer Attitudes
Alcohol
1.00
N=10,268
.756
N=10,204
.362
N=10,172
.440
N=10,204
.377
N=10,169
Peer Attitudes
Marijuana
1.00
N=10,269
.376
N=10,173
.385
N=10,191
.472
N=10,182
Does Best Friend
Smoke?
1.00
N=10,345
.581
N=10,262
.560
N=10,235
Does Best Friend
Drink?
1.00
N=10,353
.585
N=10,259
Does Best Friend Use
Marijuana?
1.00
N=10,323
CSAP Na tional Cross-site Evaluation–Final Technical Report 90
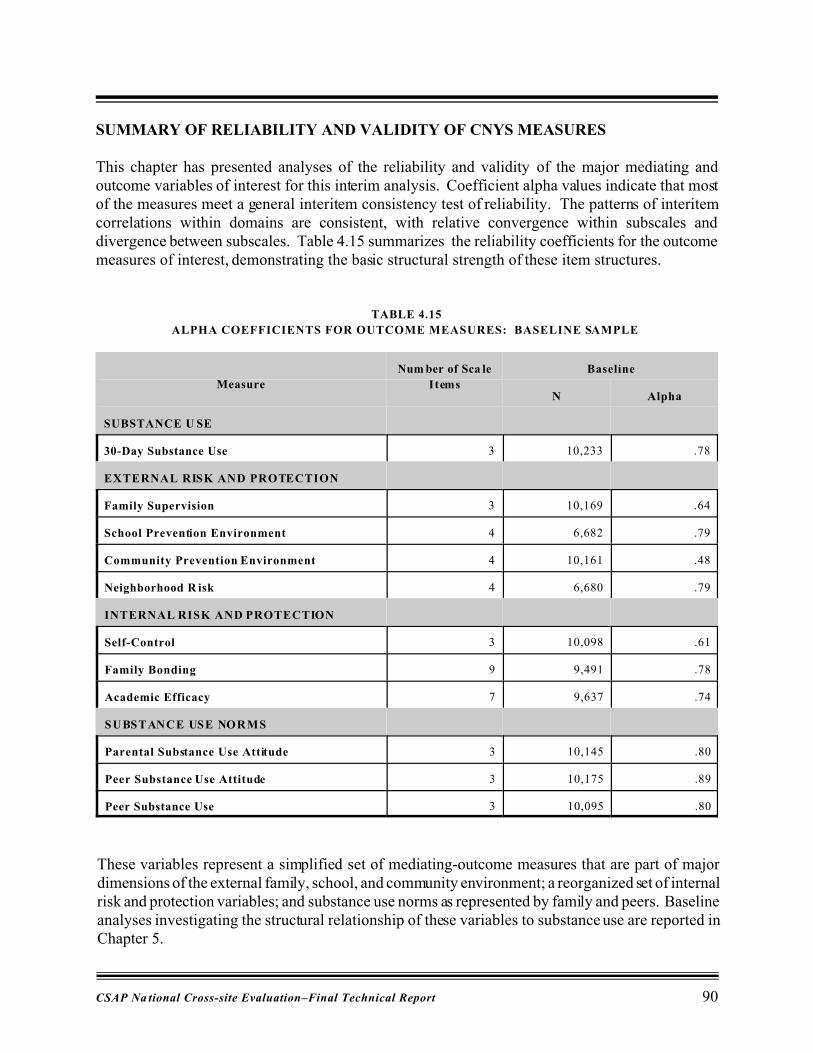
SUMMARY OF RELIABILITY AND VALIDITY OF CNYS MEASURES
This chapter has presented analyses of the reliability and validity of the major mediating andoutcome variables of interest for this interim analysis. Coefficient alpha values indicate that mostof the measures meet a general interitem consistency test of reliability. The patterns of interitemcorrelations within domains are consistent, with relative convergence within subscales anddivergence between subscales. Table 4.15 summarizes the reliability coefficients for the outcomemeasures of interest, demonstrating the basic structural strength of these item structures.
TABLE 4.15
ALPHA COEFFICIENTS FOR OUTCOME MEASURES: BASELINE SAMPLE
Measure
Num ber of Sca le
Items
Baseline
N Alpha
SUBSTANCE U SE
30-Day Substance Use 3 10,233 .78
EXTERNAL RISK AND PROTECTION
Family Supervision 3 10,169 .64
School Prevention Environment 4 6,682 .79
Community Prevention Environment 4 10,161 .48
Neighborhood R isk 4 6,680 .79
INTERNAL RISK AND PROTECTION
Self-Control 3 10,098 .61
Family Bonding 9 9,491 .78
Academic Efficacy 7 9,637 .74
SUBSTANCE USE NORMS
Parental Substance Use Attitude 3 10,145 .80
Peer Substance Use Attitude 3 10,175 .89
Peer Substance Use 3 10,095 .80
These variables represent a simplified set of mediating-outcome measures that are part of majordimensions of the external family, school, and community environment; a reorganized set of internalrisk and protection variables; and substance use norms as represented by family and peers. Baselineanalyses investigating the structural relationship of these variables to substance use are reported inChapter 5.