Embed Size (px)
Citation preview

3
CHAPTER II
THE WAGE GAINS OF AFRICAN-AMERICAN WOMEN IN THE 1940S
During the 1940s, the average real weekly wages of black women nearly doubled, thereby
narrowing the racial earnings gap among women by a full 15 percentage points.1 Although racial
convergence slowed in the 1950s, it is clear that there was no reversion toward the pre-war
black/white earnings ratio, and so the large episodic gains of the 1940s proved highly durable.2
Black men also experienced large relative wage gains in the 1940s (Maloney 1994, Margo 1995), but
in general, the racial wage gap among women has evolved quite differently from that for men during
the twentieth century (Blau and Beller 1992, Neal 2004). Therefore, the analytical narrative that
economists have developed to explain the racial gap among men may be an insufficient guide to the
broader history of the labor market implications of race. In this context, the 1940s are an especially
important period of change.
Previous studies of labor markets in the 1940s have emphasized changes in the distribution of
wages among men by skill group (Goldin and Margo 1992) and race (Maloney 1994, Margo 1995,
Collins 2000), or changes in the labor-force participation of white women (Goldin 1991). Long-run
studies of labor market disparities between black and white women have tended to focus on
occupational changes. For example, Sundstrom (2000) documents the dramatic occupational
redistribution of black women between 1940 and 1980, with emphasis on their movement into the
clerical sector after 1960. Cunningham and Zalokar (1992) also emphasize changes in occupational
distributions in the context of examining relative wage gains from 1940 to 1980. However, because
their paper examines changes over twenty-year periods (1940, 1960, and 1980), it tends to blur the
1 The consumer price index was used for deflation. The figures are calculated using the wage income variable of the Integrated Public Use Microdata Series. Average weekly wages for black women rose from $13 to $24 (1950 dollars). The black/white ratio increased from 0.44 to 0.59. See Table 4 notes for sample restrictions. Cunningham and Zalokar (1992) report results of a similar magnitude (0.44 to 0.64) for estimates of hourly wages. Ad hoc adjustments for cost of living differences between metropolitan areas and non-metropolitans areas (discounting metro area income by 20 percent) have little effect on the magnitude of the wage gains. And, as discussed later, the bulk of the absolute and the relative gains were not driven by selection into the labor force. 2 It is impossible to document changes in the 1930s earnings distribution in the absence of nationally representative income data, but the scope for racial convergence during the Depression would have been narrow. An exercise similar to that undertaken by Smith (1984), but applied to the job distributions of women, suggests no inter-racial change in the 1930s. Goldin and Margo (1992) do not find wage compression across skill groups in the 1930s (though not gender or race specific). For the 1940s, it is clear that most of the job redistribution that we observe from 1940 to 1950 was already in place by 1944 (Bureau of Labor Statistics 1945), and the minimum wage and its coverage was unchanged from 1945 to 1950.

4
distinctiveness of the 1940s and to limit its investigation of any particular decade.3
This chapter focuses specifically on the absolute and relative wage gains of black women in
the 1940s. We start by assessing the relative importance of increasing educational attainment,
occupational and industrial shifts, geographic relocation, and changing personal characteristics (e.g.,
age and marital status) of women in the labor force. Then, we explore the influence of the changing
structure of wages across occupations, industries, regions, and educational groups. We find that
within-occupation changes in earnings were at least as important as the redistribution of workers
across jobs and places of residence.
Our methodological approach for decomposing wage gains differs from previous studies in
technique, but not in spirit. To measure the contribution of changing worker characteristics, we use a
semi-parametric decomposition technique, originally developed by DiNardo, Fortin, and Lemieux
(1996). Essentially, we re-weight each individual observed in 1950 so that the distribution of worker
characteristics resembles that observed in 1940. One basic advantage of this approach is that it
facilitates both an analytical decomposition and a graphical presentation of changes across the entire
wage distribution, rather than focusing exclusively on changes at the distribution’s mean. A second
advantage is that one can retain the complete 1950 wage structure while adjusting individual
characteristics, rather than weighting changes in characteristics by a vector of regression coefficients.
Thus, the counterfactuals obtained using this technique provide both a richer characterization of
racial wage convergence over the 1940s and require less restrictive parametric assumptions than the
more standard Oaxaca decompositions. 4 After adjusting for changes in characteristics, we adjust for
changes in the structure of wages based on race-specific wage regressions for 1940 and 1950.
Our results suggest that racial wage convergence among women differs in important ways
from the story for men (cf. Maloney, 1994; Margo, 1995), although it shares some common themes.
As with men, increasing educational attainment, migration, occupational and industrial shifts, and
differential wage changes across job categories contributed meaningfully to earnings convergence
between black and white women. But differential wage changes across job categories appear to be
much more important among women than among men.5 The crucial categories for understanding
women’s wage convergence are service and clerical jobs. Black women were heavily concentrated
3 Anderson (1982) discusses pervasive labor market discrimination faced by black women during the 1940s, including their treatment during the post-war reconversion of industry. 4 See Barsky et al. (2002) for a discussion of potential problems associated with standard parametric assumptions in the context of decomposing the inter-racial wealth gap. 5 Maloney, for example, attributes 0.04 log points of mean wage convergence among men to changes in occupation and industry wage coefficients (1994, p. 372), whereas we attribute about 0.09 log points among women.

5
in the occupational category (service) that recorded the largest earnings gains during the 1940s,
whereas white women were heavily concentrated in the occupational category (clerical) that recorded
the smallest gains. A second notable difference between the story for women and that for men is that
there was virtually no compression within the black women’s income distribution, whereas there is
evidence of strong compression in the income distributions for white women, white men, and black
men.
Returning to a feature that bears a strong resemblance to the men’s story, we find that a
sizable portion of black women’s relative gains cannot be accounted for by changes in workers’
observable characteristics or by changes in the general wage structure. Even when controlling for all
observable characteristics, there was a widespread rise in black women’s non-agricultural wages
relative to white women’s. Given the flow of black women into non-agricultural jobs, these
widespread relative wage gains are consistent with an increase in the non-agricultural sector’s
relative demand for black women. Although we cannot directly measure discrimination, we
document significant changes in the likelihood of black women’s employment in operative and
household service jobs after accounting for observable characteristics. This evidence suggests a
changing pattern of labor market discrimination that lasted well beyond the exceptional labor market
conditions of World War II.
A Characterization of Black Women’s Labor Market Outcomes during the 1940s
Owing largely to the extraordinary demands of wartime production and military conscription,
the 1940s witnessed a high level of job and geographic mobility (Wolfbein 1945, Palmer 1954).
Using data from the 1940 and 1950 federal censuses, as reported in the Integrated Public Use
Microdata Series (IPUMS, Ruggles et al. 2004), we start by illustrating the pattern of wage growth
among black women, and we highlight how it differs from that of other groups. Then, we
characterize the redistribution of workers that accompanied and underpinned the observed wage
changes.
Earnings Growth and Compression
Figure 1 plots the 1939 and 1949 distribution of the log of real weekly earnings in 1950
dollars for both white and black women, including vertical lines at the distributions’ medians. The
samples include workers between the ages of 18 and 64, who were not in school, in the Armed
Forces, or self-employed (because non-wage income is not reported in 1940); who were not farmers,
farm managers, or farm workers; who did not reside in institutional group quarters; and who worked

6
more than four weeks in the previous calendar year.6 It is not possible to adjust perfectly for hours of
work per week because the census question pertains to the previous week rather than to the previous
year (for which income and weeks are reported). But later in the chapter, we do account for reported
hours worked in the decomposition analysis. Although one might expect unobserved, in-kind
payments to be quite important for domestic servants, robustness checks (discussed later) suggest
that the potential impact of these payments on our results is slight.
Panel A of figure 1 shows that in 1939 black women’s weekly earnings at each percentile fell
far below the earnings of white women. By 1950, these disparities had narrowed considerably, as
shown in panel B. The earnings distributions of both groups shifted rightward, but the black
women’s distribution converged strongly upon that of white women. This is clearly reflected in the
narrowing space between the vertical lines indicating each distribution’s median. By 1950, the
median of the black distribution was near the 15th percentile of the white distribution, and the 90th
percentile of the black distribution increased from about the 45th percentile of the white distribution
to above the 65th.
Although the rate of increase among black women was large relative to the rates for white
women and white men at almost every percentile, wages gains varied considerably across the
distribution. Figure 2 plots the increase in real weekly wages between 1940 and 1950 by percentile
in the income distributions for black and white women as well as for men. All four plots rest well
above zero, which reflects real wage gains throughout the income distribution for men and women of
both race categories. At the medians, blacks’ weekly earnings (for both men and women) increased
at nearly twice the rate of those for whites.
Another notable feature of Figure 2 is that for each group except black women, the graphs
trend strongly downward and reflect the compression of wages within race-gender categories.7 For
black men, for instance, the percentage increases in wages at the 20th percentile were almost twice as
large as those at the 80th percentile. In contrast, the increases for black women were comparable
throughout the distribution, and so the graph for black women is relatively flat.
6 In 1940, only wage and salary income are reported, and therefore the self-employed (including farmers) generally will not have accurate income figures recorded in that year. For consistency, we exclude workers who are not classified primarily as wage and salary workers in both 1940 and 1950. We also exclude relief workers in 1940 and extreme outliers in terms of weekly wages. 7 There is compression in the sense that the percentage change in income is larger below the median than above it, although absolute dollar gains need not reflect the same pattern.

7
0.2
.4.6
.81
1 2 3 4 5 6Log of weekly wages
White women African American women
A. 1940 Distributions
0.2
.4.6
.81
1 2 3 4 5 6Log of weekly wages
White women African American women
B. 1950 Distributions
Figure 1. Kernel Density Estimates of Real Weekly Wages for Black and White Women
Kernel estimates are obtained using a Gaussian kernel. Sample consists of individuals between the ages of 18 and 64, who were not in school, in the Armed Forces, or self-employed; who were not farmers, farm managers, or unpaid family farm workers; who did not reside in institutional group quarters; and who worked more than four weeks in the previous calendar year. For consistency, we exclude workers who are not classified primarily as wage and salary workers in both 1940 and 1950. We also exclude relief workers in 1940. In 1950, only sample line workers have their income data reported. Extreme outliers are omitted. Sources: IPUMS (Ruggles et al. 2004).

8
0
.5
1
1.5
0 20 40 60 80 100Percentile
Black women White womenBlack men White men
Figure 2. Changes in Real Weekly Wages by Percentile, 1940-1950
Percentage change in real weekly wages is computed as the change in the weekly wage at a given percentile divided by the 1940 weekly wage at that percentile. Sample includes individuals between the ages of 18 and 64, who were not in school, in the Armed Forces, or self-employed; who were not farmers, farm managers, or unpaid family farm workers; who did not reside in institutional group quarters; and who worked more than four weeks in the previous calendar year. For consistency, we exclude workers who are not classified primarily as wage and salary workers in both 1940 and 1950. We also exclude relief workers in 1940. In 1950, only sample line workers report income. Extreme outliers are omitted. Source: Authors’ tabulations us the 1940-50 IPUMS (Ruggles et al 2004).
Labor Mobility
Differential wage changes across race categories may have been driven in part by disparate
patterns of labor mobility. Tables 1 and 2 document the occupational and industrial redistribution of
black and white women during the 1940s. The samples used for these tables are larger than those
used for figures 1 and 2. To provide the broadest view possible of the activities of women in each
census year, the samples include all available observations for whites and blacks between 18 and 64
years old.
The first line of Table 1 indicates that black women’s labor-force participation rate was
nearly identical in 1940 and 1950, whereas white women’s participation rate increased by
approximately four percentage points. Even so, a significantly higher proportion of black women (43
percent) than white (33 percent) were in the labor force in 1950. In both years, unemployment (line
two of table 1) among black women exceeded that of white women by slightly more than two

9
percentage points.
Among employed women, racial differences in the distributions across industries and
occupations reflected differences in geographic and skill distributions, as well as pervasive labor
market discrimination (Myrdal 1944, Goldin 1990). In both 1940 and 1950, white women were
much more likely than black women to be employed in professional, clerical, sales, and operative
jobs. In contrast, even after accounting for observable characteristics, African-American women
were much more likely to be employed in household service. Conditional on being employed, a
simple probit regression of “household service occupation” on a series of individual characteristics
(e.g., age, marital status, child at home, education, region, and metropolitan status) and a dummy
variable for race (=1 if black), returns a large positive coefficient on the race dummy (dF/dX = 0.43
in 1940). This echoes the arguments of both Margo (1990) and Sundstrom (2000). Around mid-
century, educational differences cannot fully explain pervasive occupational segregation by race, a
point we return to in section 5.8
Between 1940 and 1950, the occupational and industrial distributions of women changed
rapidly. For black women, occupational change in Table 1 is most evident in the decline in
Table 1. Occupational Shifts by Race, 1940-1950
Black women White women 1940 1950 1940 1950 Not in labor force 56.79 57.38 71.45 67.35 Unemployed 4.71 2.76 2.50 1.03 Employed 38.50 39.86 26.05 31.63
Proportion in occupation, conditional upon being employed Professional 4.67 5.99 14.20 13.85 Clerical 1.31 4.30 25.73 32.32 Craft 0.41 0.74 1.49 1.77 Operative 7.44 15.01 21.81 20.60 Laborer 1.02 1.75 0.99 0.63 Service 68.06 61.27 21.34 14.50 Household 57.99 41.71 9.93 3.32 Not household 10.07 19.56 11.41 11.18 Manager 0.88 1.36 4.24 4.63 Sales 0.68 1.49 8.15 9.21 Farmers, farm labor 15.54 8.08 2.05 2.50
For the first three lines, the samples include all observations from age 18 to 64. In the lower panel, the samples include only employed workers. Source: Author’s tabulations from the 1940-50 IPUMS (Ruggles et al. 2004).
8 Margo (1990) focuses on men, but our analysis suggests that the results for women would be qualitatively similar.

10
Table 2. Industrial Shifts by Race, 1940-1950
Black women White women 1940 1950 1940 1950 Not in labor force 56.79 57.38 71.45 67.35 Unemployed 4.71 2.76 2.50 1.03 Employed 38.50 39.86 26.05 31.63
Proportion in industry conditional upon being employed Agriculture 15.81 8.21 2.27 2.69 Mining 0.05 0.01 0.16 0.20 Construction 0.23 0.13 0.51 0.66 Manufacturing 4.37 9.66 25.57 26.42 Durable 0.51 2.54 6.03 9.27 Nondurable 3.86 7.12 19.54 17.15 Transport, communication, utilities 0.26 0.91 3.66 5.05 Trade 4.37 10.91 21.19 24.51 Wholesale 0.21 0.84 1.82 2.83 Retail 4.16 10.07 19.37 21.68 Finance, insurance, real estate 0.83 1.36 4.59 5.54 Business, repair services 0.20 0.35 0.90 1.38 Personal services 65.96 53.38 17.69 8.94 Entertainment, recreation services 0.44 0.50 0.95 0.92 Professional services 6.60 11.77 18.43 18.79 Public administration 0.90 2.82 4.07 4.90
For the first three lines, the samples include all observations from age 18 to 64. In the lower panel, the samples include only employed workers. Source: Authors’ tabulations from the 1940-50 IPUMS (Ruggles et al 2004).
employment in household service and farm labor, and in large increases in operative jobs and in
service work outside households. Although the proportion of white women employed in household
service also declined (from a relatively low base), the proportion working as operatives remained
fairly constant. Instead, white women tended to shift into the clerical sector, where their
representation increased by almost seven percentage points.
The industrial redistributions in Table 2 mirror those in the occupational data. For black
women, increases in three primary industries — manufacturing, trade, and professional services
industries (e.g., hospitals and education) — offset the declines in personal service and agricultural
employment. These industrial shifts are similar to those reported by the Bureau of Labor Statistics
for the 1940 to 1944 period (Wolfbein 1945, p. 2), confirming World War II’s central place in the
story. With the exception of personal service, the industrial transitions of white women are much
less concentrated than those for black women.

11
Table 3. Geographic Distribution by Race, 1940-1950
Black women White women Distribution of residents 1940 1950 1940 1950 Northeast Proportion in region 12.38 15.89 30.87 29.21 Metro area residents 94.90 96.07 82.03 82.38 Midwest Proportion in region 12.01 16.07 32.80 30.75 Metro area residents 86.12 89.94 52.63 55.97 South Proportion in region 74.01 63.93 25.38 26.37 Metro area residents 32.69 39.83 33.68 40.88 West Proportion in region 1.59 4.11 10.94 13.67 Metro area residents 81.16 87.32 59.11 63.24 U.S., Metropolitan area residents 47.59 58.77 57.61 60.70
“Proportion in region” refers to the proportion of all blacks (or whites) who resided in a particular region. “Metro area residents” refers to the proportion of black (or white) residents in a particular region who resided in metropolitan areas. Sources: IPUMS (Ruggles et al. 2004).
Finally, the occupational and industrial redistribution was accompanied by a high volume of
geographic mobility, the net impact of which is reflected in Table 3. The 1940s were the most
important decade of the “Great Migration” of African-Americans from the South. In just ten years,
the proportion of black women living in the South declined from 74 to 64 percent (whereas the
proportion of whites living in the South increased very slightly to just over 26 percent). Most of the
black migrants went to the Midwest and Northeast, and for the first time, a large number moved to
the West. Even within the South, the shift from rural to urban areas was strong for both black and
white women, as the proportion of southern blacks residing in metropolitan areas increased from 33
to 40 percent.
The labor demand surge associated with World War II was met by a large redistribution of
workers across jobs and locations. At this stage, the quantitative contribution of this redistribution to
the absolute and relative wage gains of black women is unclear. But by decomposing the earnings
data, we can get a better view of the labor-market links that underpinned the shifting wage
distributions. We start by focusing on changes in the observable characteristics of workers (in
section 3), and then shift our attention to changes in the returns to these characteristics (in section 4).

12
Decomposing Changes in the Worker Characteristics
Our decomposition employs a semi-parametric approach developed by DiNardo, Fortin and
Lemieux (1996, henceforth “DFL”). This approach is similar in spirit to standard Blinder-Oaxaca
decompositions (Blinder 1973, Oaxaca 1973), and as such, it involves estimating counterfactual
wages that reflect changes in worker characteristics and wage structures. The DFL approach re-
weights observations from 1950 in such a way that the distribution of individuals’ characteristics
resembles the distribution of characteristics from 1940 while retaining the 1950 wage structure for
each race. This provides a visual and quantitative assessment of the proximate factors contributing to
women’s wage gains at each point in the distribution rather than just at the distributions’ means, and
does so without recourse to weights from a regression that characterizes the wage structure of just
one race category.
Let W be a non-negative random variable denoting the log of earnings, X denote the vector of
individual characteristics, and tw and tx be binary random variables that indicate the year (1940 or
1950 for this analysis) in which either W or X, respectively, is observed. For example, an
observation on an individual sampled in the 1950 census could be written (W, X, tw=50, tx=50). We
assume that wages and characteristics have the joint distribution, F(w, x, tw, tx). Thus, the distribution
of wages and attributes in 1950, for instance, can be written as F(w, x| tw=50, tx=50). Using Bayes’
rule, the marginal density of wages in 1950 can be written as the expected value of the conditional
density of wages given the vector of characteristics, X, in 1950, or
f50(w) ≡ f (w; tw=50, tx=50) = ∫ f (w| x, tw=50) dFX(x| tx=50) = EX { f (w| X, tw=50) }. (1)
As is common in decomposition analyses, we ignore potential general equilibrium and spillover
effects.9 Ignoring these effects, the counterfactual density of wages that would have prevailed if
worker characteristics had remained as in 1940 can be written as a weighted function of the actual
1950 density,
∫ ===== )40|()50,|()40,50;( xwxw txdFtxwfttwf
{ })()50,|(
)50|()50|()40|(
)50,|(
50 XtXwfE
txdFtxdFtxdF
txwf
xwX
xx
xw
ψ×==
===
== ∫ (2)
9 See Acemoglu, Autor, and Lyle (2004) on the potential effects of changes in women’s labor supply on wage inequality during the 1940s.

13
where )50|()40|(
)(==
=x
x
txdFtxdF
xψ is a counterfactual “reweighting function” that can be applied to the 1950
wage density. The weight function is simply the ratio of the probability mass in 1940 to that in 1950
for the realization of a specific set of characteristics, X. For instance, a woman observed in 1950
whose characteristics are less likely to be observed in 1940 receives less weight in the counterfactual
distribution. Thus, the counterfactual density is obtained by reweighting every individual observed in
1950 such that the distribution of individual characteristics resembles the distribution of Xs in 1940.
While more standard decomposition techniques summarize the wage structure in a vector of
estimated coefficients, the reweighting of characteristics requires no such estimates and retains the
complete 1950 pay scale observed in the empirical distribution.
The high-dimensional reweighting function can be transformed into a one-dimensional
estimation problem. By again applying Bayes’ rule and the definition of discrete probability
functions we obtain
)40=()50=(
)()|50=()()|40=(
=)50=|()40=|(
=)(xX
xX
xX
xX
xX
xXx tdF
tdFxdFxtdFxdFxtdF
txdFtxdF
xψ
)40Pr()50Pr(
)|50Pr()|40Pr(
==
⋅==
=x
x
x
x
tt
xtxt
. (3)
The first ratio in the final expression can be estimated parametrically using a standard probit model,
and the second ratio of the unconditional probabilities can be replaced with the ratio of the count of
observations in 1950 relative to 1940. After obtaining estimates of ψx, the empirical distribution and
the weights are used to compute the counterfactual wage distribution. More details on our
implementation of this method are available in appendix A.
In the context of this investigation, it is useful to partition the vector of individual
characteristics, X, into four subsets: individual attributes including eight age categories, six hours
categories, and indicator variables for marital status and the presence of a child at home; a set of five
dummy variables denoting the levels of educational attainment; a set of eleven occupational and ten
industrial categories; and finally a set of indicator variables for the nine census regions and
metropolitan residence. We elaborate on the exact specification of each of these variables in
appendix B.
Decomposing the Impact of Changes in Worker Characteristics on Weekly Earnings
Beginning with the observed 1950 earnings distribution, we first re-weight the distribution of

14
personal characteristics, then educational attainment, then occupations and industries, and finally the
distribution of workers across geographic location. We choose this sequence to adjust, first, for pre-
war factors (childbearing, marital, and educational decisions as well as hours as a proxy for worker
preferences for work); this is similar in spirit to correcting for selection on observable worker
characteristics.10 Following this correction, we examine how the labor markets of the 1940s resorted
workers across jobs and locations. At each step along the way, the new counterfactual distribution
allows us to assess how changes in a subset of characteristics may have transformed the overall
distribution of wages, while retaining the 1950 wage structure.
Table 4 decomposes the absolute real income gains of black (panel A) and white (panel B)
women during the 1940s. Taken together, changes in observable characteristics (line 2 of panel A)
account for an increase of 0.14 log points at the mean of the black women’s distribution, or about one
quarter of their average earnings gains during the decade. However, changes in characteristics can
account for none of the wage gains at the 10th percentile of the black distribution. The significance of
changes in characteristics to the overall distribution of black women’s wages is illustrated in panel A
of figure 3, which presents both the original 1950 distribution and (shifted leftward) a counterfactual
distribution that reflects changes in all observable worker characteristics during the decade.11 That is,
the distribution labeled “1940 characteristics” keeps the 1950 wage structure but re-weights the 1950
observations to match the characteristics of those observed in the 1940 sample. Both the graphical
depiction in figure 3 and the analytical results in Table 4 suggest that returning black workers’
characteristics to their 1940 levels would have substantially reduced earnings among black women
throughout the midsection of the distribution.
Table 4 also breaks down results into four subcomponents. For black women (Panel A),
changes in the basic composition of the work force (i.e., age, marital status, child at home, and hours)
tended to raise weekly wages by the largest amount at and above the median. In contrast, the
influence of personal characteristics is smaller for white women and is evident throughout the
10 This approach is similar in spirit to corrections for selectivity bias at the mean. For instance, Blau and Beller (1992) estimate a wage regression for participants and evaluate the model at the means for non-participants to obtain the imputed mean wage for non-participants. We do not impute the wages of individuals based upon inferences from the 1950 distribution, nor adjust mean attributes back to 1940 levels. Our correction strategy reweights the 1950 distribution of attributes to resemble the 1940 distribution of attributes. This should effectively account for shifts of selection into the labor market based on observable characteristics. Of course, differential changes unobservable characteristics cannot be directly measured in a decomposition framework. 11 For white women (Table 4, panel B), the total increase at the mean is much smaller than for blacks, as is the contribution of changes in observable characteristics (0.06 log points, or 19 percent of the mean gain).

15
distribution.12 Changes in educational attainment had positive and relatively uniform effects
throughout the distributions for both black and white women, but for black women the contributions
were somewhat larger.
Table 4. Decomposing the Absolute Wage Gains of Women: The Contribution of Changes in Worker Characteristics, 1940-1950
Percentile Mean 10 25 50 75 90 A. Black women Total change (1950- 1940) 0.567 0.441 0.608 0.664 0.590 0.580 Due to characteristics 0.137 0.000 0.098 0.211 0.185 0.146 (0.241) (0.000) (0.161) (0.318) (0.314) (0.252) Detailed Changes in Characteristics Age/married/child/hours 0.030 -0.059 0.000 0.061 0.047 0.082 (0.052) (-0.135) (0.000) (0.092) (0.080) (0.142) Education 0.049 0.059 0.071 0.039 0.067 0.042 (0.086) (0.135) (0.116) (0.059) (0.113) (0.072) Occupation/industry 0.041 0.000 0.027 0.092 0.071 0.003 (0.072) (0.000) (0.045) (0.138) (0.121) (0.006) Region/metro 0.018 0.000 0.000 0.019 0.000 0.019 (0.031) (0.000) (0.000) (0.029) (0.000) (0.033) B. White women Total change (1950 – 1940) 0.307 0.492 0.383 0.367 0.291 0.185 Due to characteristics 0.058 0.125 0.054 0.052 0.040 0.032 (0.188) (0.254) (0.141) (0.142) (0.137) (0.173) Detailed Changes in Characteristics Age/married/child/hours 0.024 0.035 0.016 0.028 0.001 0.022 (0.079) (0.070) (0.043) (0.077) (0.003) (0.122) Education 0.033 0.045 0.038 0.024 0.039 0.029 (0.107) (0.092) (0.098) (0.067) (0.135) (0.156) Occupation/industry 0.010 0.078 0.020 0.000 0.000 -0.007 (0.034) (0.159) (0.052) (0.000) (0.000) (-0.039) Region/metro -0.006 -0.033 -0.020 0.000 0.000 -0.012 (-0.020) (-0.067) (-0.052) (0.000) (0.000) (-0.065) The percentages of the total change are reported in parentheses. The decomposition is performed in the order presented in the table and discussed in appendix A. Source: Authors’ tabulations using the 1940-50 IPUMS (Ruggles et al. 2004).
12 The nature of the decomposition, which adjusts for personal characteristics simultaneously, makes it difficult to infer precisely what drives this result. But a Oaxaca decomposition at the means suggests that no single factor or characteristic is responsible.

16
0.2
.4.6
1 2 3 4 5 6
0.2
.4.6
1 2 3 4 5 6 A. Adjust for characteristics B. Adjust for changes in general wage structure
0.2
.4.6
1 2 3 4 5 6
0.2
.4.6
1 2 3 4 5 6 C. Adjust for differential changes in the black wage structure D. Residual differences
Before adjustment After adjustment
Figure 3. Decomposing the Wage Gains of African-American Women, 1940-1950
Actual 1950
Actual 1940
With 1940 characteristics
Adjust for 1940 wage structure for whites
With 1940 characteristics
With 1940 wage structure for whites
Adjust for 1940 wage structure for blacks
With 1940 wage structure for blacks
17
Occupational and industrial changes made almost no difference to the earnings profile of
white women, except at the low end of the percentile distribution where the decline in domestic
service would be most influential for whites.13 For black women, however, occupational and
industrial shifts made their biggest impact at the middle of the percentile distribution, accounting for
a 0.09 log point increase in wages (14 percent of total). Again, this largely reflects the shift out of
domestic service employment, and it represents the single largest contribution (at any percentile)
coming from a change in observable characteristics.
The geographic redistribution out of the rural South and into cities went hand in hand with
the occupational and industrial redistributions. After accounting for occupational and industrial
shifts, the remaining influence of geographic shifts was small for both black and white women. This
suggests that the Great Migration’s influence on black women’s earnings was inextricably linked to
the job changes that migration facilitated.
Most of these changes in characteristics had larger positive effects on the wages of black
women and, by extension, contributed to the overall racial convergence in earnings. Table 5
combines the information from the two panels of Table 4 to highlight the contributions of changes in
characteristics to racial earnings convergence. The median of the black real earnings distribution
increased by 0.66 log points, far greater than the 0.37 increase experienced by white women. At
other points in the distribution, however, Table 5 indicates that the relative gains were very different,
as initially suggested by figure 2. Wages at the 10th percentile of the black women’s distribution
declined relative to those at the 10th percentile of the white distribution, but at every other percentile,
the gains for blacks were larger than for whites. The unevenness of the relative gains over the
percentiles reflects the strong compression of wages among white women (i.e., slow wage growth at
90th percentile compared to 10th) and the lack of compression in the distribution for black women.
Each line of Table 5 estimates how changes in relative characteristics contributed to racial
earnings convergence. Occupational and industrial shifts appear to have been the most important
factors for racial convergence, especially from the 50th to 75th percentiles. Combining the
“region/metro” and “occupation/industry” rows of Table 5 suggests that the redistribution of workers
across jobs and locations made an economically significant, direct contribution to blacks’ gains
relative to whites, especially above the 25th percentile.
13 It is possible, of course, that non-pecuniary aspects of the their jobs improved.

18
Table 5. Decomposing the Relative Wage Gains of African-American Women: The Contribution of Changes in Worker Characteristics, 1940-1950
Percentile Mean 10 25 50 75 90 Total Change (Black – White) 0.260 -0.051 0.225 0.297 0.299 0.395 Due to characteristics 0.079 -0.125 0.044 0.159 0.145 0.114 (0.304) (2.451) (0.196) (0.535) (0.485) (0.289) Detailed Changes in Characteristics Age/married/child/hours 0.006 -0.094 -0.016 0.033 0.046 0.060 (0.023) (1.843) (-0.071) (0.111) (0.154) (0.152) Education 0.016 0.014 0.033 0.015 0.028 0.013 (0.062) (-0.275) (0.147) (0.051) (0.094) (0.033) Occupation/industry 0.031 -0.078 0.007 0.092 0.071 0.010 (0.119) (1.529) (0.031) (0.310) (0.237) (0.025) Region/metro 0.024 0.033 0.020 0.019 0.000 0.031 (0.092) (-0.647) (0.089) (0.064) (0.000) (0.078) The percentages of the total change are reported in parentheses. The decomposition is performed for blacks and whites in the order presented in the table and discussed in appendix A. Sources: calculations from the 1940-50 IPUMS (Ruggles et al 2004).
The implications of differential trends in educational attainment are a major theme in the
economics literature on wage convergence among black and white men (Smith and Welch 1984;
Margo 1990; Donohue, Heckman, and Todd 2002). As the century progressed, the racial gap in
educational attainment among workers narrowed as better-educated black cohorts replaced poorly
educated black cohorts. This long-term process contributed to the decline in the racial earnings gap
during the 1940s, but the contribution is relatively small. This finding does not undercut the
economic importance of educational gains among African-Americans. Rather, the small contribution
to racial earnings convergence reflects increasing educational attainment among both white and black
women workers during the decade.
Because the 1940s are often cited as a period of significant change in the labor-force
participation of women, particularly white married women, a fundamental question arises regarding
the observed racial convergence in income among women: Do the relative gains by black women
primarily represent true improvements in labor market outcomes, or do they reflect strong shifts in
the characteristics of white workers?14 We can approach this question from two avenues. First,
14 For example, between 1940 and 1950, there was a relatively large increase in the proportion of white female

19
Table 5 shows that the influence of differential changes in age, marital status, child-at-home, and
hours worked grows larger at higher percentiles, but the strong racial convergence of the 1940s
certainly was not primarily a reflection of relative changes in worker characteristics.
Second, although we cannot observe workers’ experience level in the census data (a
potentially important omitted variable), we can make useful comparisons using the unique
retrospective information in the Palmer Survey. The study, directed by Gladys Palmer, collected
work histories in 1951 for more than 4,000 female workers residing in Chicago, Los Angeles, New
Haven, Philadelphia, San Francisco or St. Paul. In these data, there is no statistically or economically
significant difference between races in the number of months that women (who were still in the labor
force in 1950) worked during the 1940s.15 While this evidence does not completely dismiss the
hypothesis that differential changes in experience levels mattered, it does deflate the notion that
white female workers in 1950 were much less experienced than black workers.
All together, approximately 0.08 log points at the means and 0.16 at the medians can be
attributed to differential racial shifts in observable characteristics, or about one third to one half of
the decade’s total wage convergence. Around the center of the black women’s distribution, changes
in occupation and industry made the largest contributions to the observed convergence. As detailed
below, the remainder of the convergence was driven by sharp changes in the structure of women’s
wages.
Decomposing Changes in the Wage Structure
The changing structure of wages across regions, occupations, and educational groups during
the 1940s had strong implications for the racial gap in earnings. In broad terms, the changes in the
wage structure were similar for black and white women: service wages increased relative to other
fields; wages in the South increased relative to other those in other regions; the relative returns to
high levels of education fell; and baseline real wages increased. But because black and white women
were distributed quite differently across occupations, regions, and educational groups, the changes in
the wage structure had different implications for the distribution of wages for black and white women workers who were married (from about 33 to 53 percent in our sample); the increase among black workers was smaller (from 38 to 46 percent). 15 The Palmer Survey (also known as the Six-City Survey) is the only dataset that we know of that contains longitudinal information on women’s labor market experiences during the 1940s (Palmer 1954). Only women in the labor force at the time of the survey (1951) are included. A simple regression of months in the labor force during the 1940s on city dummies and a race dummy indicates that white women worked about 1.8 months less than black women during the 1940s, but the difference is not statistically significant. On average, both groups worked approximately 90 months (out of a possible 120). We thank Claudia Goldin for sharing the data with us.

20
and favored reductions in the overall gap in earnings. Moreover, the wage gains within categories for
blacks were often larger than for whites.
Characterizing Within-Group Wage Changes
Table 6 provides a quantitative perspective on changes in the wage distribution across
occupations, regions, and educational groups by race. The first column of panel A simply lists the
proportion of black or white female workers in four broad occupational categories in 1950. The
second column reports the average change in real weekly wages for women in a particular category
(by race) from 1940 to 1950. The third column is the product of the first two. Large within-category
wage changes carry more weight if they occur in categories that include a large proportion of
workers.
Because the change in wages within occupational categories could reflect not only “pure”
changes in occupational wages but also in the characteristics of those in the occupation cell, we have
also calculated an “adjusted change”. For each occupation, the adjustment is made by regressing
wages for workers in 1940 and 1950 (separately by race) on all observable characteristics other than
occupation and industry, plus a year dummy for 1950.16 We report the coefficient on the year
dummy as the adjusted within-occupation change in earnings in column 4, effectively controlling for
changes in characteristics within occupation cells. Subsequent panels in the table repeat the exercise
for column 4, but they omit either region (panel B) or education (panel C) categories rather than the
occupation/industry controls (omitted in panel A).
Several interesting points emerge. Panel A of Table 6 reveals a large increase in the average
earnings of female service workers during the 1940s (0.55 log points) for blacks, and as noted above,
black women were heavily concentrated in these jobs. Although wage gains in the service category
for white women were also large (0.45 log points), the effect on the overall white wage structure was
much smaller because so few white women worked in service occupations. Rather, white women
were highly concentrated in the professional, clerical, and sales category, and earnings gains in that
16 These characteristics include a set of age, education, hours, and region of residence dummy variables as well as a binary indicator for marital status, metropolitan residence and the presence of a child at home. See appendix B for a detailed description of these variables. Subsequent panels in the table repeat the exercise but omit region (panel B) or education (panel C) categories.

21
Table 6. Average Changes in Weekly Wages, by Race, Occupation, Education and Region, 1940-1950
(1) Prop. in
sample, 1950
(2) Wage change
(3) Col.1 × Col.2
(4) Adjusted
wage change
(5) Col.1 × Col.4
A: By occupation Blacks Prof, clerical, manager, sales 0.125 0.377 0.047 0.265 0.033 Crafts, operative 0.188 0.485 0.091 0.375 0.070 Service 0.667 0.552 0.368 0.520 0.347 Laborer 0.020 0.385 0.008 0.287 0.006 Whites Prof, clerical, manager, sales 0.604 0.190 0.115 0.151 0.091 Crafts, operative 0.250 0.386 0.097 0.348 0.087 Service 0.139 0.451 0.063 0.406 0.056 Laborer 0.007 0.430 0.003 0.400 0.003 B: By region Blacks Northeast 0.182 0.512 0.093 0.411 0.075 Midwest 0.160 0.530 0.085 0.406 0.065 South 0.611 0.589 0.360 0.494 0.302 West 0.046 0.416 0.019 0.407 0.019 Whites Northeast 0.344 0.300 0.103 0.207 0.071 Midwest 0.299 0.370 0.110 0.274 0.082 South 0.228 0.352 0.080 0.272 0.062 West 0.130 0.296 0.039 0.214 0.028 C: By years of education Blacks <=4 0.188 0.641 0.121 0.526 0.099 5-8 0.404 0.542 0.219 0.467 0.189 9-11 0.187 0.588 0.110 0.489 0.092 12 0.131 0.624 0.082 0.440 0.058 >12 0.089 0.468 0.042 0.302 0.027 Whites <=4 0.032 0.447 0.014 0.370 0.012 5-8 0.220 0.360 0.079 0.297 0.066 9-11 0.188 0.346 0.065 0.282 0.053 12 0.365 0.342 0.125 0.258 0.094 >12 0.196 0.141 0.028 0.100 0.020
The means are computed using sample weights. Column 4 reports an adjusted wage change that essentially nets out the influence of changes in characteristics within cells. Sources: Authors’ calculations from the 1940-50 IPUMS (Ruggles et al 2004).
22
category were small in comparison (0.19 log points). These broad patterns remain even after
adjusting for observable characteristics (columns 4 and 5).
Panel B reports wages across regions. Earnings of southern blacks converged on the earnings
of blacks elsewhere in the country, and within every region, black wage gains far exceeded those of
whites. Differential regional trends in earnings had a much smaller proximate influence on white
women’s wages than on black women’s. As in the occupational breakdown, black women were
highly concentrated in the geographic areas in which they experienced their largest wage gains, and
this impression is unchanged after adjusting for observable characteristics. Nonetheless, the
importance of the differential wage growth in the South should not be overstated: assigning southern
black women the 0.50 log point wage gains that occurred elsewhere (rather than the 0.59 log point
increase that actually occurred in the South) would lower the national average wage gain by only a
few percentage points.
Finally, Panel C describes much greater wage growth for black women in every educational
category than for white women. Among whites, the wage gains got progressively smaller at higher
rungs in the educational ladder, but strong earnings growth for black women occurred across
educational groups. Since nearly 80 percent of black female workers had less than 12 years of
education in 1950, strong wage growth within the less educated groups was crucial to the group’s
overall income gains. An interesting aspect of the black gains within educational groups is that for
those with 12 or more years of education the “adjusted” change is much smaller than the “raw”
change, implying that a substantial amount of the raw wage gains for relatively well-educated blacks
during the 1940s were driven by occupational upgrading and regional redistribution.
In short, the racial convergence in earnings among women was a widespread phenomenon.
Whether the data are partitioned by region, educational attainment, or occupation, black women in
nearly every cell gained ground relative to whites.
Decomposing the Impact of Changes in Labor Market Prices on Weekly Earnings
The combined implications of these differential changes on the overall wage distribution are
highlighted in the final phase of our decomposition. In this step, we compute changes in regression
coefficients to assess the influence of the changing structure of wages during the 1940s. First, we
estimate separate wage regressions for white and black women in 1940 and 1950, including controls
for age, education, region, occupational and industrial categories, marital and child status, and
metropolitan residence, or riy
riy
riy
riy XW εβ += (4)

23
where r indexes race and y indexes the year (results are reported in appendix C).17 Based on the
estimates of β from these regressions, we predict a counterfactual 1940 wage for each woman
observed in the 1950 sample as:
)ˆˆ(ˆ 4050505040ri
ri
ri
ri
ri XWw ββ −−= . (5)
The wage changes for black women can be decomposed into a part attributable to changes in the
overall wage structure (represented by changes in the white regression coefficients) and a part
attributable to differential changes in the wage structure for black relative to white women. Thus, the
simulated 1940 wage for a black woman observed in 1950 can be written as:
)]ˆˆ()ˆˆ(ˆˆ[ˆ 405040504050505040Wi
Wi
Wi
Wi
Bi
Bi
Bi
Bi
Bi XWw ββββββ −+−−−−=
)]ˆˆ()ˆˆ[()]ˆˆ[( 405040505040505050Wi
Wi
Bi
Bi
Bi
Wi
Wi
Bi
Bi XXW ββββββ −−−−−−= . (6)
In equation 6, )]ˆˆ[( 405050Wi
Wi
BiX ββ − captures the change in black wages associated with changes in the
general (white) wage structure for women. The next component, )]ˆˆ()ˆˆ[( 4050405050Wi
Wi
Bi
Bi
BiX ββββ −−− ,
captures the influence of differential changes the black wage structure relative to the white structure.
This adjustment essentially revalues the 1950 characteristics according to the 1940 wage structure.
In combination with the procedure that re-weights the 1950 observations to match the 1940
distribution of characteristics, this adjustment simulates the full 1940 wage distribution.18
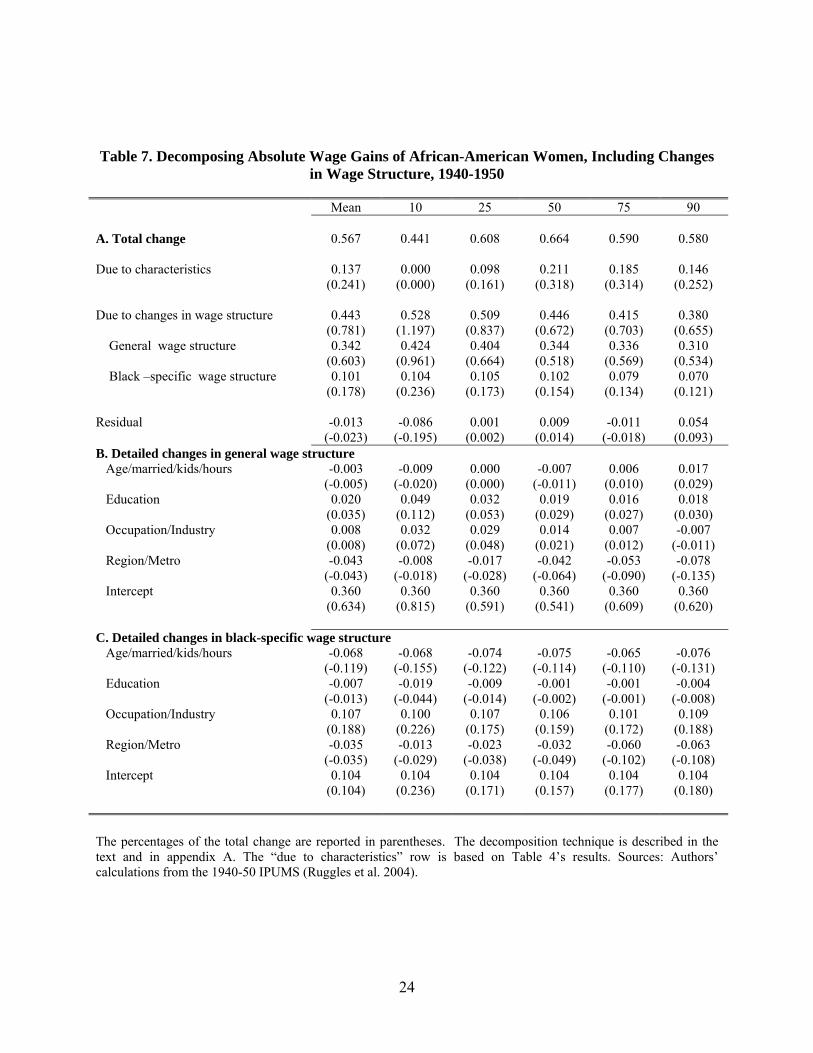
Table 7 breaks the absolute real wage changes for black women into four components: the
influence of changing characteristics (as derived in Table 4), the influence of changes in the general
wage structure for women, the influence of differential changes in the wage structure for black
women (relative to whites), and a residual. At the median and mean, the contribution of wage
17 The omitted category consists of unmarried women, ages 35 to 39, with 9 to 11 years of schooling, who worked as non-durable manufacturing operatives for 31 to 40 hours in the week before the census, and lived in the East North Central census division. Any reference to changes in “baseline” wages or to change in the constant term of regressions implicitly refers to this group. 18 Although this is a description of the general procedure, we actually adjust the prices after first reweighting 1950 characteristics to reflect those observed in 1940. Thus, after obtaining the estimates from equation 6, we use the distribution generated by ]ˆˆ[ˆ 4050505040
Bi
Bi
Bi
Bii
Bi
Bii
Bi
Bii XWw ββψθψθψθ −−= , where θi denotes the sample line weight
assigned to individual i in 1950, to decompose the prices and report the numbers obtained at different percentiles in Table 7 and Table 8.
24
Table 7. Decomposing Absolute Wage Gains of African-American Women, Including Changes in Wage Structure, 1940-1950
Mean 10 25 50 75 90 A. Total change 0.567 0.441 0.608 0.664 0.590 0.580 Due to characteristics 0.137 0.000 0.098 0.211 0.185 0.146 (0.241) (0.000) (0.161) (0.318) (0.314) (0.252) Due to changes in wage structure 0.443 0.528 0.509 0.446 0.415 0.380 (0.781) (1.197) (0.837) (0.672) (0.703) (0.655) General wage structure 0.342 0.424 0.404 0.344 0.336 0.310 (0.603) (0.961) (0.664) (0.518) (0.569) (0.534) Black –specific wage structure 0.101 0.104 0.105 0.102 0.079 0.070 (0.178) (0.236) (0.173) (0.154) (0.134) (0.121) Residual -0.013 -0.086 0.001 0.009 -0.011 0.054 (-0.023) (-0.195) (0.002) (0.014) (-0.018) (0.093) B. Detailed changes in general wage structure Age/married/kids/hours -0.003 -0.009 0.000 -0.007 0.006 0.017 (-0.005) (-0.020) (0.000) (-0.011) (0.010) (0.029) Education 0.020 0.049 0.032 0.019 0.016 0.018 (0.035) (0.112) (0.053) (0.029) (0.027) (0.030) Occupation/Industry 0.008 0.032 0.029 0.014 0.007 -0.007 (0.008) (0.072) (0.048) (0.021) (0.012) (-0.011) Region/Metro -0.043 -0.008 -0.017 -0.042 -0.053 -0.078 (-0.043) (-0.018) (-0.028) (-0.064) (-0.090) (-0.135) Intercept 0.360 0.360 0.360 0.360 0.360 0.360 (0.634) (0.815) (0.591) (0.541) (0.609) (0.620) C. Detailed changes in black-specific wage structure Age/married/kids/hours -0.068 -0.068 -0.074 -0.075 -0.065 -0.076 (-0.119) (-0.155) (-0.122) (-0.114) (-0.110) (-0.131) Education -0.007 -0.019 -0.009 -0.001 -0.001 -0.004 (-0.013) (-0.044) (-0.014) (-0.002) (-0.001) (-0.008) Occupation/Industry 0.107 0.100 0.107 0.106 0.101 0.109 (0.188) (0.226) (0.175) (0.159) (0.172) (0.188) Region/Metro -0.035 -0.013 -0.023 -0.032 -0.060 -0.063 (-0.035) (-0.029) (-0.038) (-0.049) (-0.102) (-0.108) Intercept 0.104 0.104 0.104 0.104 0.104 0.104 (0.104) (0.236) (0.171) (0.157) (0.177) (0.180) The percentages of the total change are reported in parentheses. The decomposition technique is described in the text and in appendix A. The “due to characteristics” row is based on Table 4’s results. Sources: Authors’ calculations from the 1940-50 IPUMS (Ruggles et al. 2004).
25
structure changes is more than twice that of changes in characteristics. In other words, near the
center of the distribution, changes in characteristics account for one-quarter to one-third of black
women’s absolute wages gains, while changes in the wage structure account for two-thirds to three-
quarters. Differential changes in the wage structure for black women (relative to whites) account for
roughly 15 percent of the absolute wage gains.
In addition to these computations, a visual assessment of the magnitude of change is offered
in figure 3 which works step by step from the observed 1950 wage distribution of black women back
toward the observed 1940 wage distribution. Panel B starts with the “1940 characteristics”
distribution that was described in panel A (i.e., the 1950 wage structure re-weighted to reflect 1940
workers’ characteristics), and then it adjusts the distribution to reflect changes in the general wage
structure (based on wage regressions for white women). Because workers generally experienced
large wage gains during the 1940s, this adjustment pushes the distribution much further to the left.
Starting from that point, panel C makes a further adjustment for black-specific wage gains, resulting
in an additional shift to the left and reflecting gains for blacks relative to whites within observable
categories. Panel D graphs the black wage distribution after the adjustments for changes in
characteristics and changes in wage structure (labeled “1940 wage structure for black women”)
against the actual observed distribution for 1940; the differences are residuals.
These overall changes in the wage structure are decomposed into subcomponents in the lower
two panels of Table 7. For example, under the “general wage structure” category in panel B, the
“occupation/industry” subcomponent reports the influence of changes in the market returns to
various jobs based on changes in the white regression coefficients. Changes in the returns to
education, which tended to benefit those with few years of education, had their largest impact at the
bottom of the wage distribution (0.05 log points). The “constant” row is simply the estimated change
in baseline weekly earnings for the omitted category, which reflects a large (0.36 log points)
rightward shift of the wage distribution.19
Changes in the black-specific wage structure are decomposed in panel C of Table 7.
Differential wage changes within occupation and industry cells made a large contribution to black
women’s wage gains (approximately 0.11 log points throughout distribution), implying that 16 to 23
percent of black women’s total wage gains can be associated with race-specific changes in the
19 In a decomposition framework, this kind of shift cannot be explained. It reflects a general rise in the wage level, associated with some combination of labor productivity increases, business cycle conditions, and institutional factors (e.g., minimum wage and unionization). Though important and worthy of study, an examination of those issues is beyond the scope of this paper.

26
Table 8. Decomposing Absolute Wage Gains for White Women, Including Changes in Wage Structure, 1940-1950
Mean 10 25 50 75 90 A. Total change 0.307 0.492 0.383 0.367 0.291 0.185 Due to characteristics 0.058 0.125 0.054 0.052 0.040 0.032 (0.188) (0.254) (0.141) (0.142) (0.137) (0.173) Due to changes in wage structure 0.248 0.303 0.310 0.272 0.217 0.161 (0.808) (0.616) (0.809) (0.741) (0.746) (0.870) Residual 0.002 0.064 0.020 0.043 0.035 -0.008 (0.005) (0.131) (0.051) (0.119) (0.119) (-0.044) B. Detailed changes in wage structure Age/married/kids/hours 0.024 0.013 0.042 0.047 0.030 0.012 (0.080) (0.026) (0.110) (0.127) (0.102) (0.062) Education 0.003 0.004 0.010 0.006 0.002 -0.010 (0.011) (0.008) (0.026) (0.017) (0.006) (-0.055) Occupation -0.076 -0.038 -0.050 -0.071 -0.100 -0.129 (-0.076) (-0.077) (-0.130) (-0.194) (-0.342) (-0.697) Region/Metro -0.063 -0.036 -0.052 -0.070 -0.075 -0.072 (-0.063) (-0.073) (-0.136) (-0.192) (-0.256) (-0.389) Intercept 0.360 0.360 0.360 0.360 0.360 0.360 (1.170) (0.731) (0.938) (0.980) (1.234) (1.948) The percentages of the total change are reported in parentheses. The decomposition technique is described in the text and in appendix A. The “due to characteristics” row are based on Table 4’s results. Sources: Authors’ calculations based on the 1940-50 IPUMS (Ruggles et al 2004) structure of wages across occupations and industries. In addition, the baseline wage gains for black
women were large compared to those for whites (an additional 0.10 log points). We discuss possible
interpretations of this shift below.
Table 8 reports a similar breakdown for white women.20 Importantly, changes in the
coefficients on occupation and industry groups tended to lower white women’s wages during the
1940s relative to the omitted categories (operatives, manufacturing). In fact, significant declines in
the earnings premiums occurred in professional, clerical, and sales jobs—the occupations employing
high concentrations of white women. The shifts in regional and metropolitan residence coefficients
also tended to lower white women’s relative wages throughout the percentile distribution relative to
the omitted group (East North Central region, non-metropolitan).
20 Because the changing wage structure for white women is used to represent the “general change” in the wage structure, there are no separate race-specific rows in the table.

27
Table 9. Summary Decomposition of Racial Wage Convergence , 1940-1950
Mean 10 25 50 75 90 Total change (Black-White) 0.260 -0.051 0.225 0.293 0.299 0.395 Due to characteristics 0.079 -0.125 0.044 0.159 0.145 0.114 (0.304) (2.451) (0.196) (0.543) (0.485) (0.289) Due to changes in wage structure 0.195 0.225 0.199 0.174 0.198 0.219 (0.750) (-4.412) (0.884) (0.594) (0.662) (0.554) General wage structure 0.094 0.121 0.094 0.072 0.119 0.149 (0.362) (-2.373) (0.418) (0.246) (0.398) (0.377) Black-specific wage structure 0.101 0.104 0.105 0.102 0.079 0.070 (0.388) (-2.039) (0.467) (0.348) (0.264) (0.177) Residual -0.015 -0.150 -0.019 -0.034 -0.046 0.062 (-0.058) (2.941) (-0.084) (-0.116) (-0.154) (0.157) The percentages of the total change are reported in parentheses. The decomposition technique is described in the text and in appendix A. The “due to characteristics” row are based on Table 4’s results. Underlying decompositions for blacks and whites are reported in tables 5 and 6. Sources: Authors’ calculations based on the 1940-50 IPUMS (Ruggles et al 2004)
Table 9 condenses the combined implications of tables 5 and 6 and summarizes our central
empirical results. First, near and above the center of the distribution, black wages increased by
nearly 0.30 log points relative to whites. Second, changes in relative characteristics, especially
changes in the distributions of workers over jobs and locations, made significant contributions to
racial convergence, explaining about one third of all convergence at the means (and more at the
medians). Third, changes in the general wage structure and changes in the black-specific wage
structure made even larger contributions than changes in characteristics throughout the percentile
distribution. This is driven largely by changes in relative wages across occupations and industries
and by increases in blacks’ wages relative to whites within occupations and industries.
Service Jobs, Discrimination, and Black Wage Gains
The movement out of service jobs and, just as importantly, earnings gains within service jobs
made large contributions to the observed increase of black women’s wages during the 1940s. The
economics literature has rarely investigated service occupations, despite George Stigler’s claim that
“in 1939 there were as many domestic servants as employees of the railroads, coal mines, and
automobile industry combined” (1946, p. 2; see also Anderson and Bowman 1953). This section
addresses three aspects of the service sector that are relevant to black women’s earnings gains in the
28
1940s: changes in occupations within the service sector (household vs. non-household); the potential
influence of in-kind payments on our measures of overall wage changes; and the residual influence of
being black, conditional on other characteristics, on the likelihood of holding a service job (as
opposed to some other kind of job).
The three-digit occupational codes in the IPUMS data allow a fairly detailed view of the
service sector. The great majority of black female service workers worked in private households:
about 87 percent of service workers in 1940 and 70 percent in 1950. But weekly wages were
substantially higher for those working outside households (for instance, as cooks). Controlling for
observable characteristics, domestic workers earned about 24 percent less in 1940 and about 28
percent less in 1950.21 Thus, the shift of black workers across occupations within the service sector
also appears to have made a non-trivial contribution to the observed overall gain in black workers’
income.22
A separate concern is that unobserved payments-in-kind to live-in servants (e.g., implicit
rent) might lead to overstatements of actual earnings gains as black women moved out of an
occupation with relatively high levels of unobserved compensation. In 1940, approximately five
percent of employed black and white women (ages 18 to 64) are identified as live-in domestic
servants.23 By 1950, only one percent of employed white women and two percent of employed black
women appear to be live-in servants. The comparatively small proportion of women working as live-
in servants, and the declines of similar magnitude across race groups, lead us to believe that any bias
associated with their reported wages is also comparatively small. To test this assertion, we inflated
reported earnings for live-in servants by 50 percent (since the typical valuation of housing is one
third of earnings) and recalculated the income distributions for 1940 and 1950. For log weekly
income among black women in 1940 (who worked at least four weeks, not in agriculture, not in
school), there is no difference at the 10th percentile, a 0.04 difference at the median, and a 0.02
difference at the 90th percentile. Among white women, there is a 0.10 difference at the 10th
percentile, a 0.02 difference at the median, and a 0.01 difference at the 90th percentile. Since the 21 Three factors could explain the earnings gap within the service sector: workers in households may have been more likely to receive in-kind payments (we address this later); workers outside of households may have been more likely to be covered by minimum wage laws; and there may have been selection on unobservables between the groups. It is not possible to assess these possibilities thoroughly with census data. 22 Interestingly, the wage gains in household service occupations were about 11 percent less than those elsewhere in service (log gains of 0.44 versus 0.55), but nearly the entire discrepancy can be accounted for differential changes in the characteristics of workers in the two subgroups. Thus, the large overall gains in service sector wages were underpinned by large real gains in both household and non-household occupations. 23 We use the detailed “related” variable in the IPUMS data to identify “domestic employees”. We cannot be sure that this captures all live-in servants.

29
distributions are barely affected by the inflation, we conclude that any bias introduced by in-kind pay
should have little effect on our basic results.
Discriminatory hiring practices surely contributed to the high level occupational segregation
among women in 1940 (Myrdal 1944, Goldin 1990), and it is plausible that changes in discriminatory
practices helped mitigate racial wage gaps over time. In 1940, as we pointed out earlier, black
women were much more likely to work as household servants than would be predicted on the basis of
their observable characteristics (dF/dBlack = 0.43). At the same time, employed black women were
far less likely to work in operative and clerical jobs than one would predict (dF/dBlack = -0.16 in
clerical; -0.14 in operative). By 1950, the unexplained race “effect” had fallen to 0.26 in household
service, and it had risen to -0.08 in the operative category. For clerical work, however, there was a
surprising decline in the race coefficient, falling to -0.22. Such measures are, of course, indirect and
imperfect indicators of discriminatory practices in hiring during the 1940s, but they suggest a
retreating color line in operative employment and a declining level of occupational crowding (in
household service work) even after accounting for worker characteristics.24 The breakthrough to
clerical work did not occur until after 1960 (Cunningham and Zalokar 1994, Sundstrom 2000).
Within the non-agricultural sector, it appears that there must have been a shift in the relative
demand for black workers outside of household service. Although it is impossible to follow women
through job transitions in the census data, the cross-sections of tables 1a and 1b suggest that new
openings as manufacturing operatives were particularly important for black women. This is
confirmed in the samples available from the Palmer Survey, which was described above. Out of the
black women who worked in service industries in 1940 but not in 1950 (and remained in the labor
force), more than half had moved to manufacturing. 25 In the census data, between 1940 and 1950,
black women increased their share of female employment in manufacturing from 2.6 percent to 4.8
percent.26
More broadly, black women increased their share of female employment outside domestic
service from 6.8 to 7.7 percent, even as white women increased their labor-force participation rate.
Although evolving household-production technologies may have undermined demand for domestic
service during the 20th century, it does not appear that blacks’ rapid movement from the service
24 See Sundstrom (2000) for an investigation of changes in occupational segregation over the 1940 to 1980 period. 25 In this case, our inference is based on 142 black women who held service jobs in 1940 and still worked in 1950. 26 Within manufacturing, the largest employers of black women in 1950 were apparel and accessories (32 percent of blacks in manufacturing), tobacco (8 percent), canning (6 percent), and meat products (5 percent). While the proportion of black manufacturing workers increased in the apparel industry during the 1940s (from 29 percent), it fell in tobacco (from 21 percent).
30
sector in the 1940s was driven primarily by declining employment opportunities in that sector.
Rather, black domestic servants had wage gains that were in line with those in other fields, indicating
that they were drawn from domestic service jobs by higher wage levels and new job openings
elsewhere.27
Interpretation and Conclusion
Although the wartime economy was exceptional and temporary, its impact on the post-war
economic outcomes of African-American women was extensive. Large absolute and relative income
gains were propelled by the redistribution of black workers across jobs and places, by strong within-
job wage growth in jobs that employed many black women, and by large increases in black-specific
wages across a broad range of activities. We found that about one-third of the racial wage
convergence (at the means) is accounted for by changes in black women’s observable characteristics
relative to white women’s, most importantly by shifts in their occupational and industrial
distributions. Another third of the mean convergence is accounted for by changes in the general
wage structure that raised the wages of service workers relative to those of clerical workers. The last
third of the mean convergence is associated with black-specific wage gains that were especially
strong in services, but that were apparent throughout the occupational and industrial distribution. By
using the DFL semi-parametric technique in combination with wage regressions, we were also able
to see how changing worker characteristics and changing wage structures influenced the shape and
location of the entire black wage distribution, as depicted in figure 3.
The patterns of wage changes and worker flows that we observe are highly suggestive of an
increase in the relative demand for black women and an increase in the relative supply of white
women in the non-agricultural sector. Specifically, we observe a large increase in the ratio of
black/white wages among non-agricultural workers, but we see almost no change in the black/white
non-agricultural employment ratio: the black/white non-agricultural employment ratio was 0.14 in
1940 and 0.13 in 1950.28 If there had only been a rightward shift of relative demand for black
workers, we would expect both the black/white wage ratio and the black/white employment ratio to 27 This interpretation is consistent with contemporary observations. For example, based on a wartime survey in New Orleans, Gilmore and Wilson report that “the principal complaints coming from full-time employers [of servants], however, were that the better types of servants were going into war industry” and that part-time employers “blamed rising wages and the shortage of really competent Negro women” on the defense boom. “As one housewife expressed it: ‘To tell you the truth, I think they’re [black women] making too much money. . . . I hope I’ll live to see the day when they’ll be glad to work for you again’” (1944, p. 321-322). 28 The movement of black women out of agriculture offsets the inflow of white women from out of the labor force in the overall non-agricultural employment figures.

31
rise (as long as relative supply slopes upward); if there had only been a leftward shift of the relative
supply of black workers (reflecting an exogenous increase in supply of white women), then we
would expect a rise of the black/white wage ratio and a decline in the black/white employment ratio
(as long as relative demand slopes downward). The combination of both shifts would allow the wage
ratio to rise significantly with little or no change in the observed employment ratio.
As noted above, within the non-agricultural sector, it also appears that there must have been a
shift in the relative demand for black workers outside of household service, as they increased their
proportion of non-domestic service jobs from 6.8 to 7.7 percent. A deeper identification of the forces
driving a relative demand shift in favor of black workers is beyond the scope of this analysis, but we
can suggest a number of plausible, and perhaps complementary, hypotheses. The sharp increase in
demand for relatively unskilled workers during the war (Goldin and Margo 1991), in combination
with a sharp decline in the availability of new immigrants, might have led employers to seek out
black workers. Wartime propaganda that emphasized the urgent need to raise levels of production
might have facilitated the racial integration of workplaces (or at least given employers an excuse to
do so). Government enforced anti-discrimination policies during and after the war might have
allowed black workers, including women, to enter lines of work that had previously excluded them
(Collins 2001, 2003). The ascendance of the CIO (which split from the AFL in 1936) and its internal
anti-discrimination policies might have effectively boosted industrial employment opportunities for
black workers (Northrup 1944). Finally, the likelihood of being covered by minimum wage laws
(and union bargaining) increased as black women left the household service sector. Further study of
the connections between African-American women’s income and changes in employers’ behavior,
union and minimum wage coverage, and anti-discrimination laws could significantly advance our
understanding of the decade’s racial wage convergence, and could also help put the last 50 years of
racial wage gaps in better perspective.