Embed Size (px)
Citation preview
CHAPTER III
DEMOGRAPHIC TRANSITION THEORETICAL
IMPLICATIONS
3.1. Demographic Transition: Stages
3.2. Population Growth in India and Kerala
3.3. Demographic Transition in Kerala
3.4. Demographic Profile of Kerala
3.5. Demographic Transition and Decadal Growth Rat e of
Population
3.6. Kerala’s Changing Age Structure
3.7. Demographic Shift and Population Ageing
3.8. Demographic Transition and Elderly in Kerala
3.9. Dependency Ratios
3.10. Social Security for Elderly
Chapter IChapter IChapter IChapter IIIIIIIII---- Demographic Transition Theoretical Implications Demographic Transition Theoretical Implications Demographic Transition Theoretical Implications Demographic Transition Theoretical Implications
53
SOCIO ECONOMIC IMPACT OF DEMOGRAPHIC TRANSITION IN KERALA ON ELDERLY WOMEN
DEMOGRAPHIC TRANSITION THEORETICAL
IMPLICATIONS
There are a number of distinct stages in demographic growth
through which population passes is collectively known as the
population cycle or the theory of demographic transition.
The demographic transition is the relationship between fertility
and mortality, i.e., between the birth rates and death rates. The
theory pinpoints the changes in these rates which occur as a
consequence of economic development (Sinha, 2000). Demographic
transition is the process of shift from high birth rates and high death
rates to low birth rates and low death rates.
According to E.G. Dolan, “Demographic transition refers to a
population cycle that begins with a fall in the death rate, continues
with a phase of rapid population growth and concludes with a
decline in the birth rate”. (Cherunilam, Francis, 1987).
3.1. Demographic Transition: Stages
The theory of demographic transition is based on the actual
population trends of advanced countries of the world. This theory
states that every country passes through different stages of
population development. According to C.P. Blacker, they are:(i) the
high stationary phase marked by high fertility and mortality rates;
(ii) the early expanding phase marked by high fertility and high but
declining mortality; (iii) the late expanding phase with declining
fertility but with mortality declining more rapidly;(iv) the low stationary
phase with low fertility balanced by equally low mortality; and (v) the
Chapter IChapter IChapter IChapter IIIIIIIII---- Demographic Transition Theoretical Implications Demographic Transition Theoretical Implications Demographic Transition Theoretical Implications Demographic Transition Theoretical Implications
54
SOCIO ECONOMIC IMPACT OF DEMOGRAPHIC TRANSITION IN KERALA ON ELDERLY WOMEN
declining phase with low mortality, lower fertility and an excess of
deaths over births.
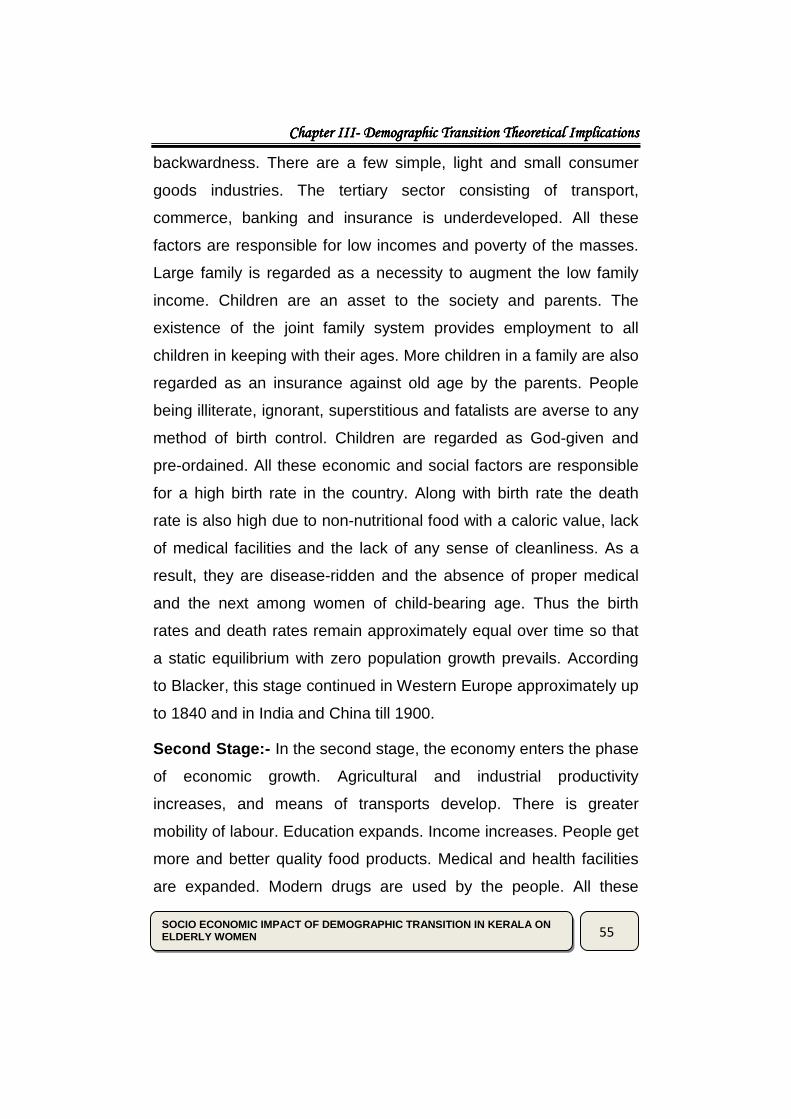
These stages are explained in the Fig.3.1. In the figure, the
time for different stages is taken on the horizontal axis and annual
birth and death rates on the vertical axis.
Figure 3.1 Stages of Demographic Transition
Source: Bhatt (2005): “Demography”, Vrinda Publications Private
Limited, New Delhi ,p126.
First Stage :-In this stage the country is backward and is
characterized by high birth and death rates with the result that the
growth rate of population is low. People mostly live in rural areas
and their main occupation is agriculture which is in a state of
Chapter IChapter IChapter IChapter IIIIIIIII---- Demographic Transition Theoretical Implications Demographic Transition Theoretical Implications Demographic Transition Theoretical Implications Demographic Transition Theoretical Implications
55
SOCIO ECONOMIC IMPACT OF DEMOGRAPHIC TRANSITION IN KERALA ON ELDERLY WOMEN
backwardness. There are a few simple, light and small consumer
goods industries. The tertiary sector consisting of transport,
commerce, banking and insurance is underdeveloped. All these
factors are responsible for low incomes and poverty of the masses.
Large family is regarded as a necessity to augment the low family
income. Children are an asset to the society and parents. The
existence of the joint family system provides employment to all
children in keeping with their ages. More children in a family are also
regarded as an insurance against old age by the parents. People
being illiterate, ignorant, superstitious and fatalists are averse to any
method of birth control. Children are regarded as God-given and
pre-ordained. All these economic and social factors are responsible
for a high birth rate in the country. Along with birth rate the death
rate is also high due to non-nutritional food with a caloric value, lack
of medical facilities and the lack of any sense of cleanliness. As a
result, they are disease-ridden and the absence of proper medical
and the next among women of child-bearing age. Thus the birth
rates and death rates remain approximately equal over time so that
a static equilibrium with zero population growth prevails. According
to Blacker, this stage continued in Western Europe approximately up
to 1840 and in India and China till 1900.
Second Stage:- In the second stage, the economy enters the phase
of economic growth. Agricultural and industrial productivity
increases, and means of transports develop. There is greater
mobility of labour. Education expands. Income increases. People get
more and better quality food products. Medical and health facilities
are expanded. Modern drugs are used by the people. All these

Chapter IChapter IChapter IChapter IIIIIIIII---- Demographic Transition Theoretical Implications Demographic Transition Theoretical Implications Demographic Transition Theoretical Implications Demographic Transition Theoretical Implications
56
SOCIO ECONOMIC IMPACT OF DEMOGRAPHIC TRANSITION IN KERALA ON ELDERLY WOMEN
factors bring down the death rate. But the birth rate is almost stable.
People do not have any inclination to reduce the birth of children
because with economic growth employment opportunities increase
and children are able to add more to the family income. With
improvements in the standards of living and he dietary habits of the
people, the life expectancy also increases. People do not make any
effort to control the size of family because of the presence of
religious dogmas and social taboos towards family planning. Of all
the factors in economic growth it is difficult to break with the past
social institutions, customs and beliefs. As a result of these factors,
the birth rate remains at the previous high level. With the decline in
the death rate and no change in the birth rate, population increases
at a rapid rate. This leads to Population Explosion.
Third Stage:- In this stage, birth rate starts declining accompanied
by death rates declining rapidly. With better medical facilities, the
survival rate of children increases. People are not willing to support
large families. The country is burdened with the growing population.
People adopt the use of contraceptives so as to limit families. Birth
rates decline a initially in urban areas. With death rates declining
rapidly, the population grows a diminishing rate. This is the “Late
Expanding” stage.
Fourth Stage:- In this stage, the fertility rate declines and tends to
equal the death rate so that the growth rate of population is
stationary. As growth gains momentum and people’s level of income
increases, their standard of living rises. The leading growth sectors
expand and lead to an expansion in output in other sectors through
Chapter IChapter IChapter IChapter IIIIIIIII---- Demographic Transition Theoretical Implications Demographic Transition Theoretical Implications Demographic Transition Theoretical Implications Demographic Transition Theoretical Implications
57
SOCIO ECONOMIC IMPACT OF DEMOGRAPHIC TRANSITION IN KERALA ON ELDERLY WOMEN
technical transformations. Education expands and permeates the
entire society. People discard old customs, dogmas and beliefs,
develop individualistic spirit and break with the joint family. Men and
women prefer to marry late. People rapidly adopt family planning
devices. They prefer to go in for a baby car rather than a baby.
Moreover, increases specialization following rising income levels
and the consequent social and economic mobility make it costly and
inconvenient to rear a large number of children. All this tends to
reduce the birth at further which along with an already low death rate
brings a decline in the growth rate of population. The advanced
countries of the world are passing through this “Lower Stationary”
(LS) stage of population development, as shown in Fig (A) and CD
in Fig (B). Population growth is curtailed and there is zero population
growth.
Fifth Stage:- In this stage, death rates exceed birth rates and the
population growth declines. This is shown as D in Fig. (A)and the
portion DP in Fig.(B). A continuing decline in birth rates when it is
not possible to lower death rates further in the advanced countries
leads to a “declining” stage of population. The existence of this stage
in any developed country is a matter of speculation.
The theory of demographic transition is the most acceptable
theory of population growth. It does not lay emphasis on food supply
like the Malthusian theory, nor does it develop a pessimistic outlook
towards population growth. It is also superior to the optimum theory
which lays an exclusive emphasis on the increase in per capita
income for the growth of population and neglects the other factors
which influence it. The demographic transition theory is superior to
Chapter IChapter IChapter IChapter IIIIIIIII---- Demographic Transition Theoretical Implications Demographic Transition Theoretical Implications Demographic Transition Theoretical Implications Demographic Transition Theoretical Implications
58
SOCIO ECONOMIC IMPACT OF DEMOGRAPHIC TRANSITION IN KERALA ON ELDERLY WOMEN
all the theories of population because it is based on the actual
population growth trends of the developed countries of Europe.
Almost all the European countries have passed through the first
three stages of this theory and are now in the fourth stage
(Zachariah and Rajan, 1997).
The demographic transition implies the shift of population
growth from the stage of high birth and death rates to a stage of low
birth and death rates. The theory of demographic transition dealing
with the relationship between birth and death rates and the result of
growth rates of population at different stages of development (Asha
Bhende, 2006). These stages are described in detail as follows:
Stage 1: High Birth and Death Rates
In the first stage, both birth and death rules are high. The
population remains more or less stable. Even if there is some
increase in the population because birth rate is somewhat higher
than death rate, it does not pose any severe problem. A large
number of people live on inadequate and unbalanced diet; their
housing conditions are appalling and, in the absence of
opportunities for education, their outlook towards life becomes
unscientific and irrational. Under these circumstance, when medical
facilities are limited, the mortality rate is bound to be high. Lack of
education, superstition and such other social evils result in high birth
rates. In the first stage of demographic transition high birth rate is
followed by an equally high death rate, and thus population remains
stable over a long period.
Chapter IChapter IChapter IChapter IIIIIIIII---- Demographic Transition Theoretical Implications Demographic Transition Theoretical Implications Demographic Transition Theoretical Implications Demographic Transition Theoretical Implications
59
SOCIO ECONOMIC IMPACT OF DEMOGRAPHIC TRANSITION IN KERALA ON ELDERLY WOMEN
Stage II: Falling Death and High Birth Rates
The second stage of demographic transition is characterized
by rapid growth of population. With the beginning of the process of
development, living standards of people improve, education
expends, medical and health facility increase and governments
make special efforts to check small pox, malaria, cholera, plague
etc. These developments generally bring down the death rates. But
as long as society remains primarily agrarian and education
available only to a narrow section of the society, attitude of people
towards the size of family does not change radically and the birth
rate remains high. In this situation, population increases at an
alarming rate.
Stage III: Low Birth Rate and Low Death Rate
In the third stage of demographic transition, birth rate declines
significantly and thus rate of population growth remains low. A
country can hope to overcome the problem of population explosion if
the process of industrialization accompanied by urbanization is fast
and education becomes widespread. Only in this situation birth rate
shows a tendency to fall. Life in a city is not the same as in a village.
Industrialization results in overcrowding in cities and housing
problem compels people to revise their attitudes towards size of
family. Their experiences of the urban life help them in recognizing
the merits of a small family. When the process of economic
development gets accelerated, women seek all kinds of employment
in order to supplement family earnings. For working women,
upbringing of children is not an easy task. Furthermore, in industrial
societies there are very few employment opportunities for children.
In most cases, some technical training is also necessary along with
Chapter IChapter IChapter IChapter IIIIIIIII---- Demographic Transition Theoretical Implications Demographic Transition Theoretical Implications Demographic Transition Theoretical Implications Demographic Transition Theoretical Implications
60
SOCIO ECONOMIC IMPACT OF DEMOGRAPHIC TRANSITION IN KERALA ON ELDERLY WOMEN
education. Thus both social and economic factors prevent a large
number of people from having many children, and in course of time,
the birth rate declines from above 40 per thousand to about 20 per
thousands. Once the critical phase of population explosion is over, in
the third stage, the birth rate and death rate become stable at low
level resulting in a very slow rising population.
The process of demographic transition in the course of
economic development, as experienced by today’s industrialized
countries, may be briefly explained as follows: “All nations in the
modern era, which have moves from a traditional, agrarian-based
economic system to a largely industrial, urbanized base, have also
moved from a condition of high mortality and fertility to low mortality
and fertility (Stolnitz, 1964).
3.2. Population Growth in India and Kerala
The population of India as of 1st March 2001 stood at 1027
millions. The corresponding figure for Kerala was 32 millions. Figure
3.2 outlines the population growth for Kerala and India over the last
100 years. Though India had a negative growth rate during the
period 1911-21, the growth rates in Kerala remained positive. Kerala
registered a growth rate of above 2 per cent during 1941-71,
whereas the same pattern was true fact India between 1961-
91.Until 1971, Kerala’s growth rate was always higher than India’s
and India only overtook Kerala in terms of the growth rate during
1971-81(Census of India, Various Years).
Over the last century, Kerala’s population doubled five times
(6 million in 1901 to 32 million in 2001) whereas India’s population
grew slightly more than three times (238 million in 1901 to 1027
Chapter IChapter IChapter IChapter IIIIIIIII---- Demographic Transition Theoretical Implications Demographic Transition Theoretical Implications Demographic Transition Theoretical Implications Demographic Transition Theoretical Implications
61
SOCIO ECONOMIC IMPACT OF DEMOGRAPHIC TRANSITION IN KERALA ON ELDERLY WOMEN
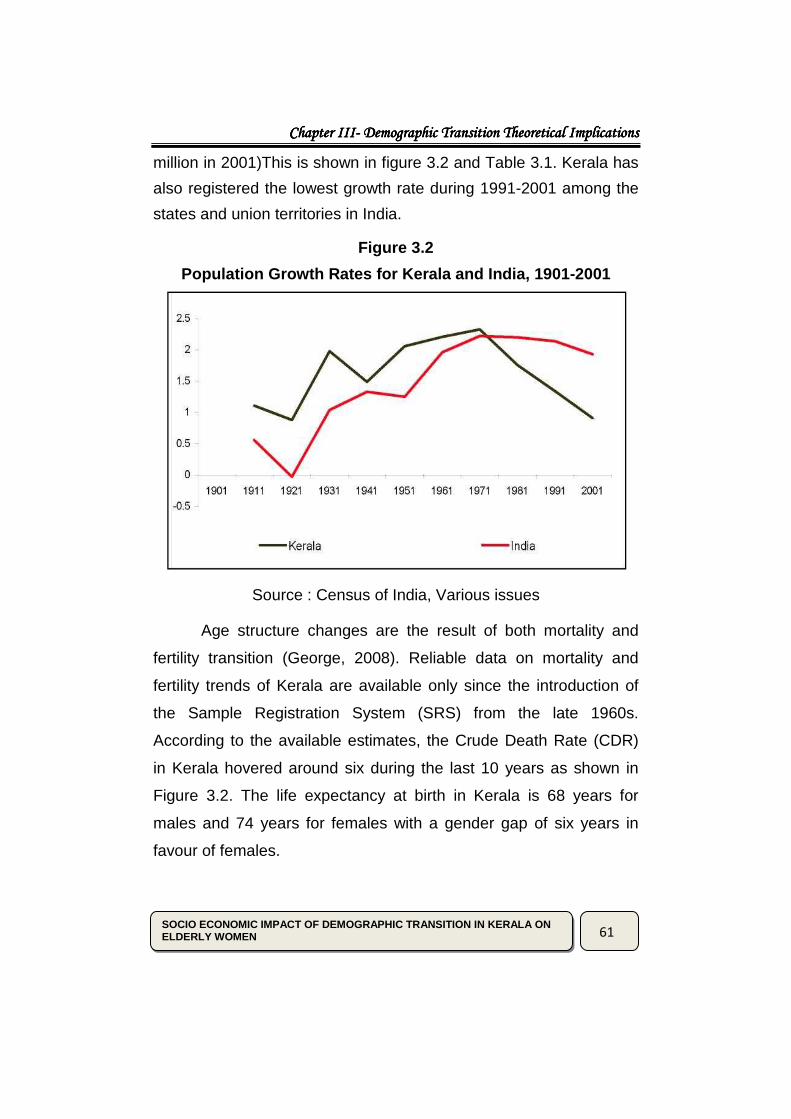
million in 2001)This is shown in figure 3.2 and Table 3.1. Kerala has
also registered the lowest growth rate during 1991-2001 among the
states and union territories in India.
Figure 3.2
Population Growth Rates for Kerala and India, 1901- 2001
Source : Census of India, Various issues
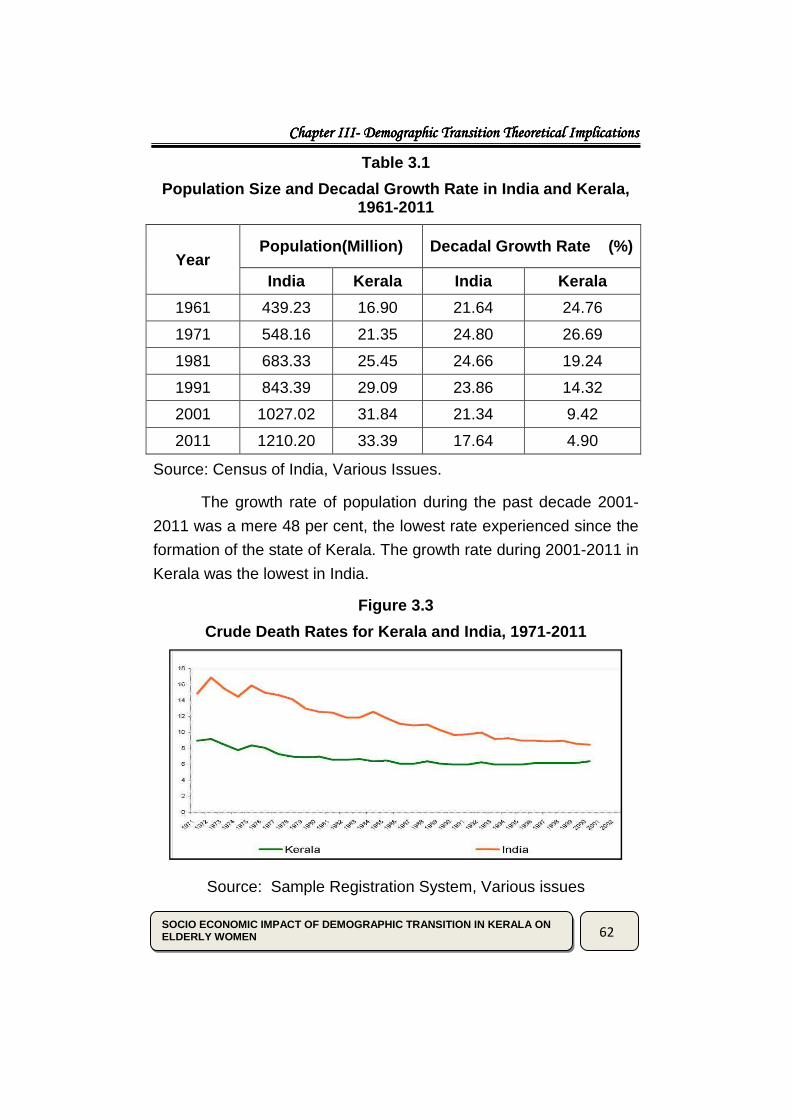
Age structure changes are the result of both mortality and
fertility transition (George, 2008). Reliable data on mortality and
fertility trends of Kerala are available only since the introduction of
the Sample Registration System (SRS) from the late 1960s.
According to the available estimates, the Crude Death Rate (CDR)
in Kerala hovered around six during the last 10 years as shown in
Figure 3.2. The life expectancy at birth in Kerala is 68 years for
males and 74 years for females with a gender gap of six years in
favour of females.
Chapter IChapter IChapter IChapter IIIIIIIII---- Demographic Transition Theoretical Implications Demographic Transition Theoretical Implications Demographic Transition Theoretical Implications Demographic Transition Theoretical Implications
62
SOCIO ECONOMIC IMPACT OF DEMOGRAPHIC TRANSITION IN KERALA ON ELDERLY WOMEN
Table 3.1
Population Size and Decadal Growth Rate in India an d Kerala, 1961-2011
Year
Population(Million) Decadal Growth Rate (%)
India Kerala India Kerala
1961 439.23 16.90 21.64 24.76
1971 548.16 21.35 24.80 26.69
1981 683.33 25.45 24.66 19.24
1991 843.39 29.09 23.86 14.32
2001 1027.02 31.84 21.34 9.42
2011 1210.20 33.39 17.64 4.90
Source: Census of India, Various Issues.
The growth rate of population during the past decade 2001-
2011 was a mere 48 per cent, the lowest rate experienced since the
formation of the state of Kerala. The growth rate during 2001-2011 in
Kerala was the lowest in India.
Figure 3.3
Crude Death Rates for Kerala and India, 1971-2011
Source: Sample Registration System, Various issues
SOCIO ECONOMIC IMPACT OF DEMOGRAPHIC TRANSITION IN KERALA ON ELDERLY WOMEN
Trends in Total Fertility Rate Kerala and India
Source: Bhat and Rajan (1990) and Sample Registration System, Various issues
The fertility has also shown a significant declining trend in
Kerala, particularly since the 1970s. Figure 3.3 presents the trend in
total fertility rate (TFR) in Kerala and Indi
decadal figures are drawn from census and other data are from
Sample Registration System (SRS). According to the estimates the
TFR declined from 5.8 to 1.7 by 1991 and then stabilized at that
point. However, at all India level
replacement level of 2 children per women.
As fertility declined faster in Kerala, the fertility gap between
India and Kerala has widened till the early 1990s. But the gap is
solely narrowing down for the last one deca
Chapter IChapter IChapter IChapter IIIIIIIII---- Demographic Transition Theoretical Implications Demographic Transition Theoretical Implications Demographic Transition Theoretical Implications Demographic Transition Theoretical Implications
SOCIO ECONOMIC IMPACT OF DEMOGRAPHIC TRANSITION IN KERALA ON
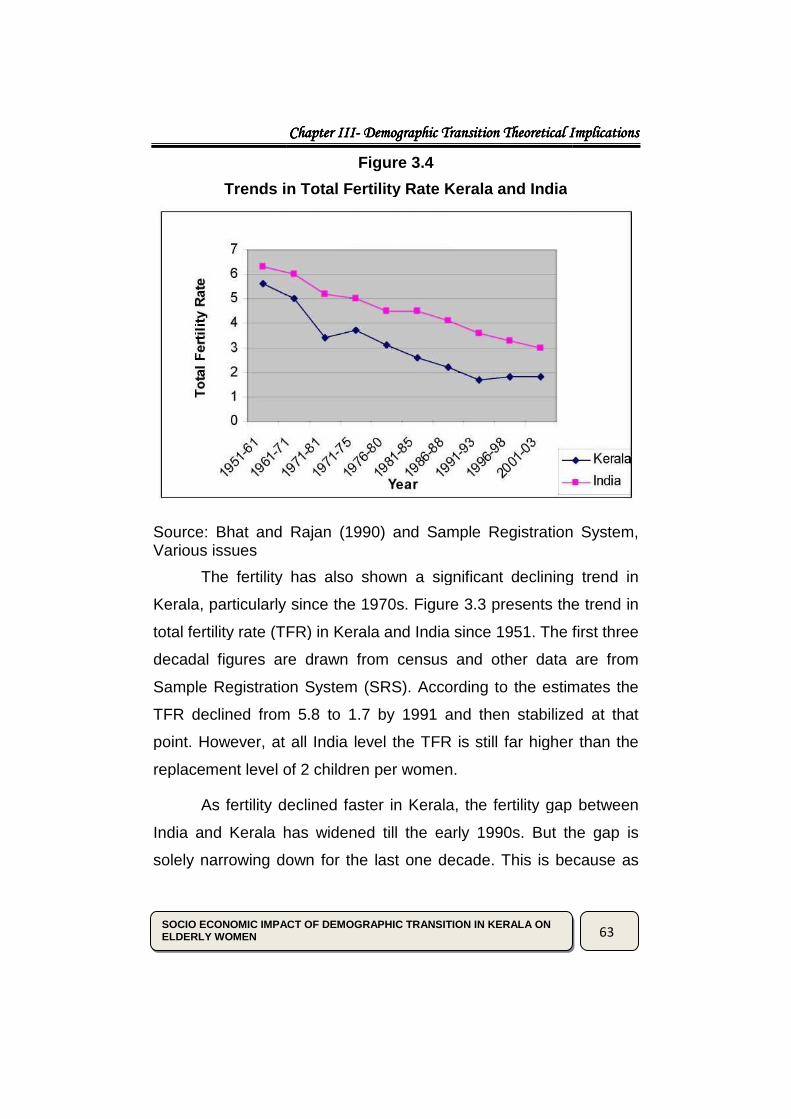
Figure 3.4
Trends in Total Fertility Rate Kerala and India
Source: Bhat and Rajan (1990) and Sample Registration System,
The fertility has also shown a significant declining trend in
Kerala, particularly since the 1970s. Figure 3.3 presents the trend in
total fertility rate (TFR) in Kerala and India since 1951. The first three
decadal figures are drawn from census and other data are from
Sample Registration System (SRS). According to the estimates the
TFR declined from 5.8 to 1.7 by 1991 and then stabilized at that
point. However, at all India level the TFR is still far higher than the
replacement level of 2 children per women.
As fertility declined faster in Kerala, the fertility gap between
India and Kerala has widened till the early 1990s. But the gap is
solely narrowing down for the last one decade. This is because as
Demographic Transition Theoretical Implications Demographic Transition Theoretical Implications Demographic Transition Theoretical Implications Demographic Transition Theoretical Implications
63
Source: Bhat and Rajan (1990) and Sample Registration System,
The fertility has also shown a significant declining trend in
Kerala, particularly since the 1970s. Figure 3.3 presents the trend in
a since 1951. The first three
decadal figures are drawn from census and other data are from
Sample Registration System (SRS). According to the estimates the
TFR declined from 5.8 to 1.7 by 1991 and then stabilized at that
the TFR is still far higher than the
As fertility declined faster in Kerala, the fertility gap between
India and Kerala has widened till the early 1990s. But the gap is
de. This is because as
Chapter IChapter IChapter IChapter IIIIIIIII---- Demographic Transition Theoretical Implications Demographic Transition Theoretical Implications Demographic Transition Theoretical Implications Demographic Transition Theoretical Implications
64
SOCIO ECONOMIC IMPACT OF DEMOGRAPHIC TRANSITION IN KERALA ON ELDERLY WOMEN
Kerala has already reached a very low fertility there is no scope for
further decline (George, 2008).
Table 3.2
Sex Ratio in India and Kerala, 1951-2011
Year Sex Ratio
India Kerala
1951 946 1028
1961 941 1022
1971 930 1016
1981 934 1032
1991 927 1036
2001 933 1058
2011 940 1084
Source: Census of India, Various Years
Kerala has a unique position with regard to sex ratio. In all
the censuses females outnumbered males in Kerala. Kerala is the
only state in India in which the excess of female has been growing
during the entire 20th century. In 2011 there is 84 excess females for
1000 males.
Density of Population
Kerala is one among the top, with 859 per sq.km in 2011 in
matter of density of population. Table 3.3 reveals the density of
population in India and Kerala.
SOCIO ECONOMIC IMPACT OF DEMOGRAPHIC TRANSITION IN KERALA ON ELDERLY WOMEN
Density of Population India and Kerala
Year
1951
1961
1971
1981
1991
2001
2011
Source: Census of
Density of Population India and Kerala
0
100
200
300
400
500
600
700
800
900
1951 1961
Chapter IChapter IChapter IChapter IIIIIIIII---- Demographic Transition Theoretical Implications Demographic Transition Theoretical Implications Demographic Transition Theoretical Implications Demographic Transition Theoretical Implications
SOCIO ECONOMIC IMPACT OF DEMOGRAPHIC TRANSITION IN KERALA ON
Table 3.3
Density of Population India and Kerala
Density of Population
India Kerala
117 349
142 435
177 549
216 655
267 749
324 819
382 859
Source: Census of India
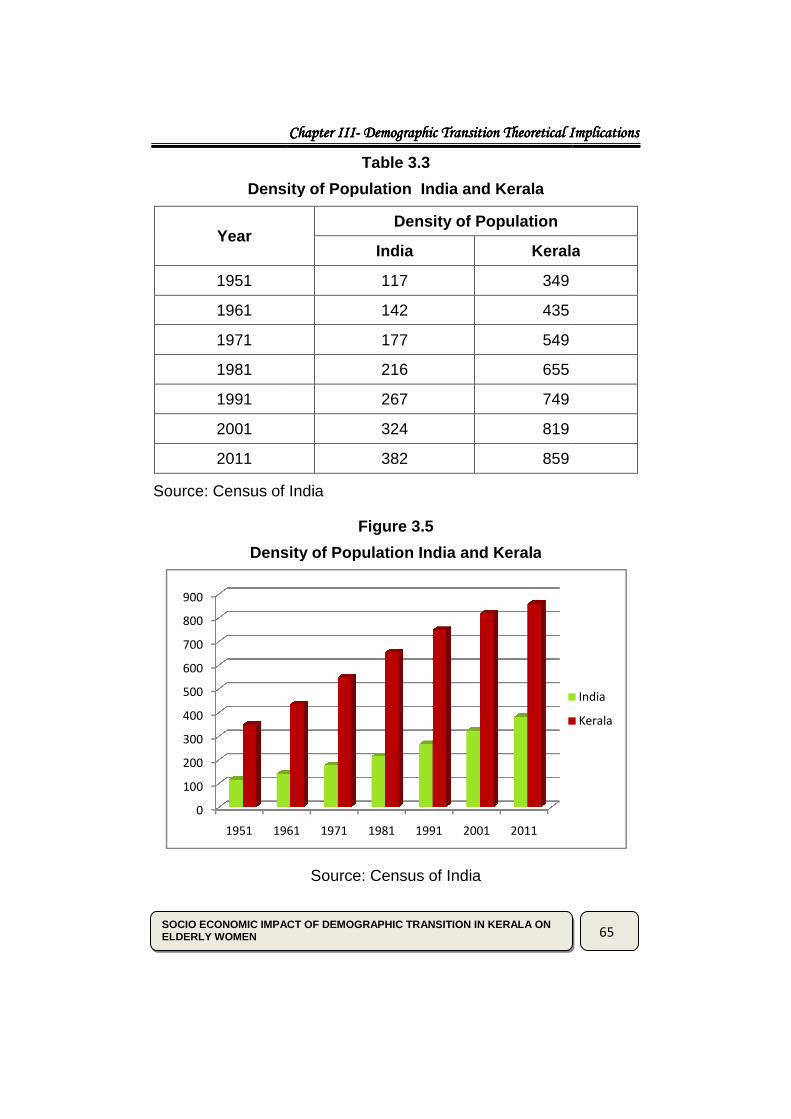
Figure 3.5
Density of Population India and Kerala
Source: Census of India
1961 1971 1981 1991 2001 2011
Demographic Transition Theoretical Implications Demographic Transition Theoretical Implications Demographic Transition Theoretical Implications Demographic Transition Theoretical Implications
65
Kerala
India
Kerala
Chapter IChapter IChapter IChapter IIIIIIIII---- Demographic Transition Theoretical Implications Demographic Transition Theoretical Implications Demographic Transition Theoretical Implications Demographic Transition Theoretical Implications
66
SOCIO ECONOMIC IMPACT OF DEMOGRAPHIC TRANSITION IN KERALA ON ELDERLY WOMEN
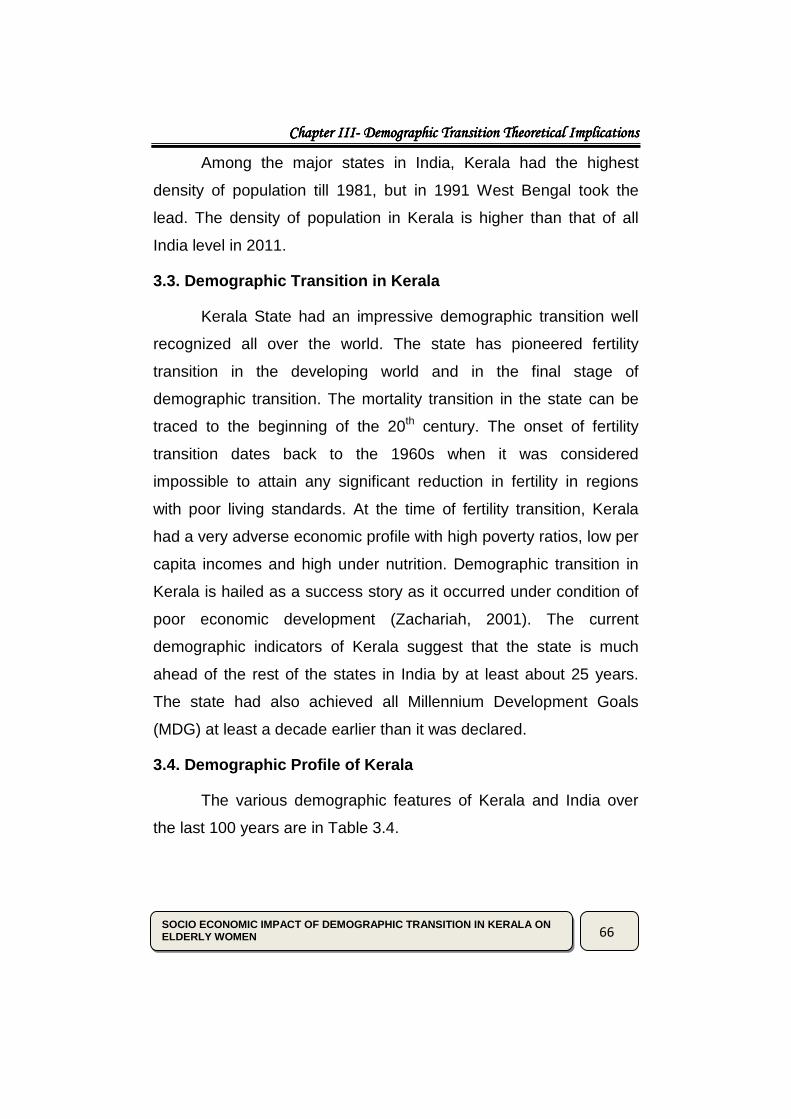
Among the major states in India, Kerala had the highest
density of population till 1981, but in 1991 West Bengal took the
lead. The density of population in Kerala is higher than that of all
India level in 2011.
3.3. Demographic Transition in Kerala
Kerala State had an impressive demographic transition well
recognized all over the world. The state has pioneered fertility
transition in the developing world and in the final stage of
demographic transition. The mortality transition in the state can be
traced to the beginning of the 20th century. The onset of fertility
transition dates back to the 1960s when it was considered
impossible to attain any significant reduction in fertility in regions
with poor living standards. At the time of fertility transition, Kerala
had a very adverse economic profile with high poverty ratios, low per
capita incomes and high under nutrition. Demographic transition in
Kerala is hailed as a success story as it occurred under condition of
poor economic development (Zachariah, 2001). The current
demographic indicators of Kerala suggest that the state is much
ahead of the rest of the states in India by at least about 25 years.
The state had also achieved all Millennium Development Goals
(MDG) at least a decade earlier than it was declared.
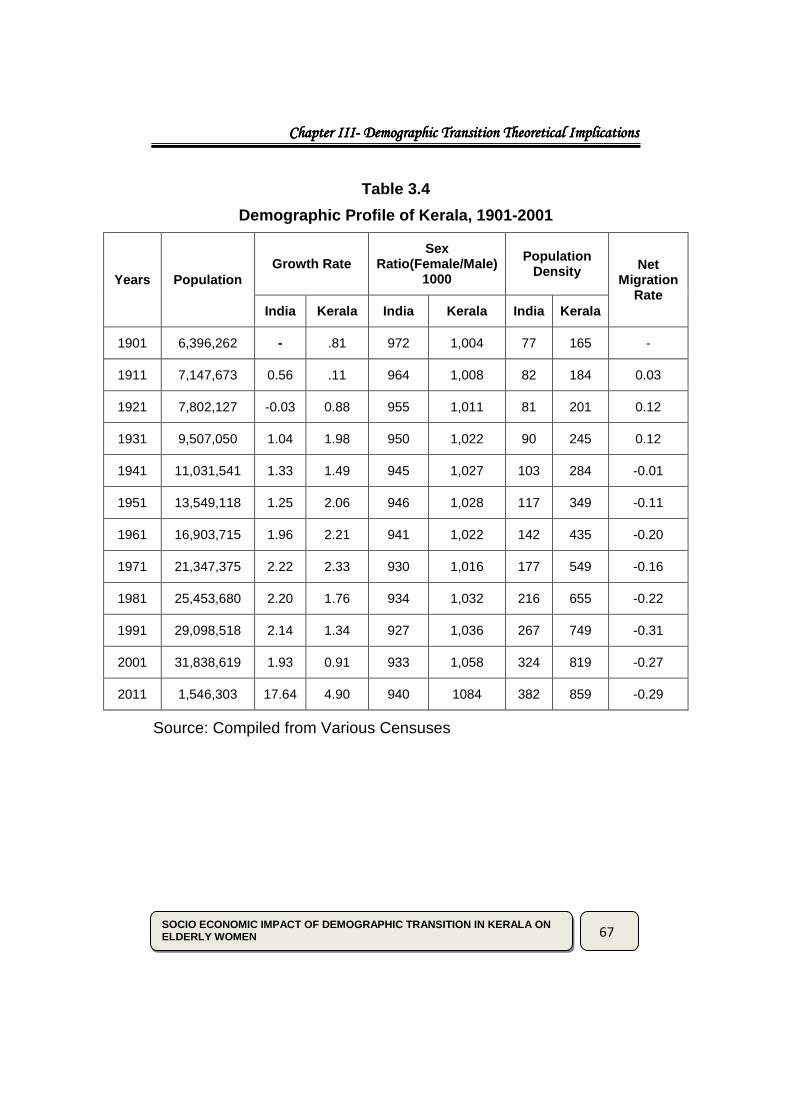
3.4. Demographic Profile of Kerala
The various demographic features of Kerala and India over
the last 100 years are in Table 3.4.
Chapter IChapter IChapter IChapter IIIIIIIII---- Demographic Transition Theoretical Implications Demographic Transition Theoretical Implications Demographic Transition Theoretical Implications Demographic Transition Theoretical Implications
67
SOCIO ECONOMIC IMPACT OF DEMOGRAPHIC TRANSITION IN KERALA ON ELDERLY WOMEN
Table 3.4
Demographic Profile of Kerala, 1901-2001
Years Population Growth Rate
Sex Ratio(Female/Male)
1000
Population Density Net
Migration Rate
India Kerala India Kerala India Kerala
1901 6,396,262 - .81 972 1,004 77 165 -
1911 7,147,673 0.56 .11 964 1,008 82 184 0.03
1921 7,802,127 -0.03 0.88 955 1,011 81 201 0.12
1931 9,507,050 1.04 1.98 950 1,022 90 245 0.12
1941 11,031,541 1.33 1.49 945 1,027 103 284 -0.01
1951 13,549,118 1.25 2.06 946 1,028 117 349 -0.11
1961 16,903,715 1.96 2.21 941 1,022 142 435 -0.20
1971 21,347,375 2.22 2.33 930 1,016 177 549 -0.16
1981 25,453,680 2.20 1.76 934 1,032 216 655 -0.22
1991 29,098,518 2.14 1.34 927 1,036 267 749 -0.31
2001 31,838,619 1.93 0.91 933 1,058 324 819 -0.27
2011 1,546,303 17.64 4.90 940 1084 382 859 -0.29
Source: Compiled from Various Censuses
Chapter IChapter IChapter IChapter IIIIIIIII---- Demographic Transition Theoretical Implications Demographic Transition Theoretical Implications Demographic Transition Theoretical Implications Demographic Transition Theoretical Implications
68
SOCIO ECONOMIC IMPACT OF DEMOGRAPHIC TRANSITION IN KERALA ON ELDERLY WOMEN
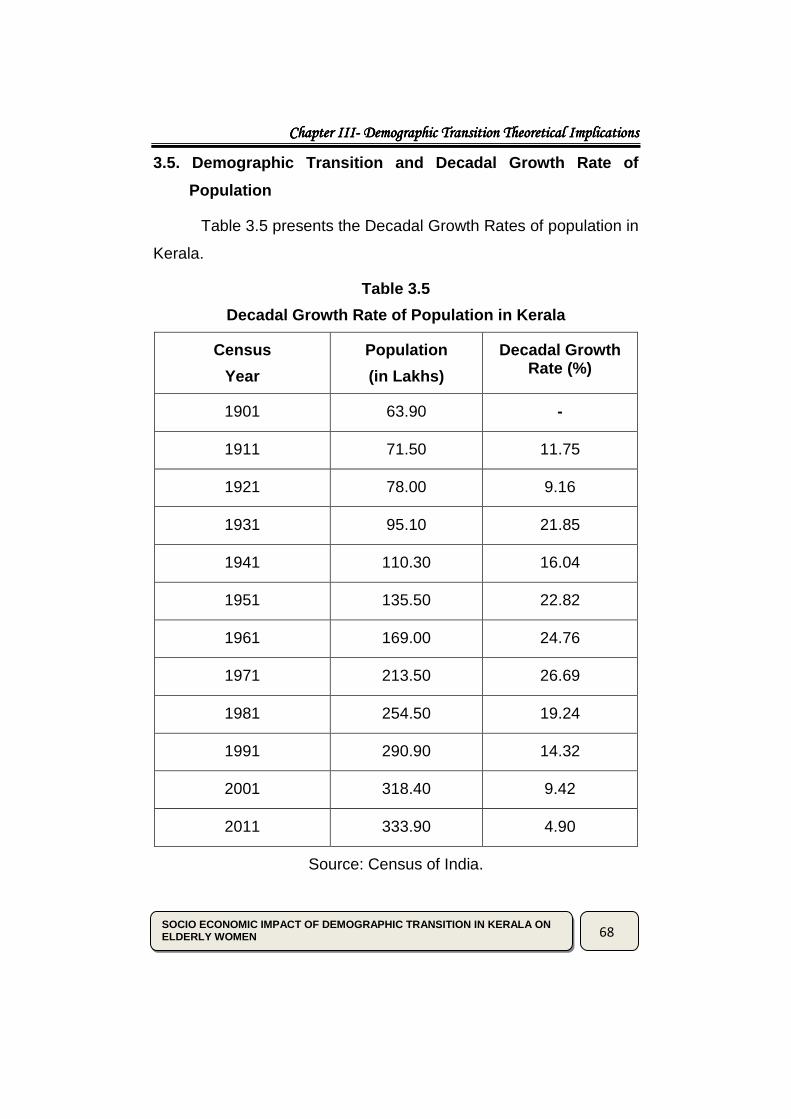
3.5. Demographic Transition and Decadal Growth Rate of
Population
Table 3.5 presents the Decadal Growth Rates of population in
Kerala.
Table 3.5
Decadal Growth Rate of Population in Kerala
Census
Year
Population
(in Lakhs)
Decadal Growth Rate (%)
1901 63.90 -
1911 71.50 11.75
1921 78.00 9.16
1931 95.10 21.85
1941 110.30 16.04
1951 135.50 22.82
1961 169.00 24.76
1971 213.50 26.69
1981 254.50 19.24
1991 290.90 14.32
2001 318.40 9.42
2011 333.90 4.90
Source: Census of India.
SOCIO ECONOMIC IMPACT OF DEMOGRAPHIC TRANSITION IN KERALA ON ELDERLY WOMEN
Decadal Growth Rate of Population in Kerala
Source: Compiled from various census of India
It is clear from both Table 3.5 and Figure 3.6 that after
rate of growth of population is declining faster in Kerala.
3.6. Kerala’s Changing Age Structure
An important effect of demographic transition in the state is
the change in the age structure of population. There has been a shift
in the age structur
adults. The bulge in the working age group population is clearly
evident in recent years. As a result of early demographic transition,
Kerala is experiencing a fast change in the age structure of
population (Census of India).
0
5
10
15
20
25
30
1901 1911 1921
Chapter IChapter IChapter IChapter IIIIIIIII---- Demographic Transition Theoretical Implications Demographic Transition Theoretical Implications Demographic Transition Theoretical Implications Demographic Transition Theoretical Implications
SOCIO ECONOMIC IMPACT OF DEMOGRAPHIC TRANSITION IN KERALA ON
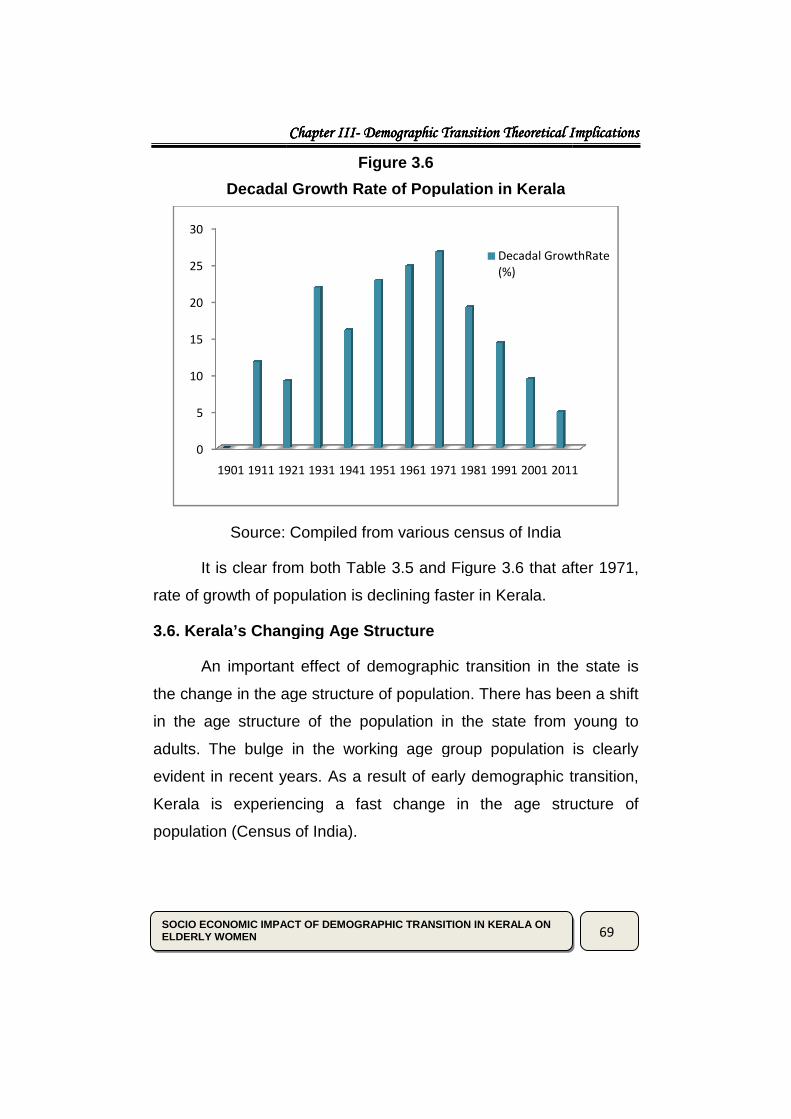
Figure 3.6
Decadal Growth Rate of Population in Kerala
Source: Compiled from various census of India
It is clear from both Table 3.5 and Figure 3.6 that after
rate of growth of population is declining faster in Kerala.
3.6. Kerala’s Changing Age Structure
An important effect of demographic transition in the state is
the change in the age structure of population. There has been a shift
in the age structure of the population in the state from young to
adults. The bulge in the working age group population is clearly
evident in recent years. As a result of early demographic transition,
Kerala is experiencing a fast change in the age structure of
ensus of India).
1921 1931 1941 1951 1961 1971 1981 1991 2001 2011
Decadal GrowthRate
(%)
Demographic Transition Theoretical Implications Demographic Transition Theoretical Implications Demographic Transition Theoretical Implications Demographic Transition Theoretical Implications
69
It is clear from both Table 3.5 and Figure 3.6 that after 1971,
An important effect of demographic transition in the state is
the change in the age structure of population. There has been a shift
e of the population in the state from young to
adults. The bulge in the working age group population is clearly
evident in recent years. As a result of early demographic transition,
Kerala is experiencing a fast change in the age structure of
2011
Decadal GrowthRate
Chapter IChapter IChapter IChapter IIIIIIIII---- Demographic Transition Theoretical Implications Demographic Transition Theoretical Implications Demographic Transition Theoretical Implications Demographic Transition Theoretical Implications
70
SOCIO ECONOMIC IMPACT OF DEMOGRAPHIC TRANSITION IN KERALA ON ELDERLY WOMEN
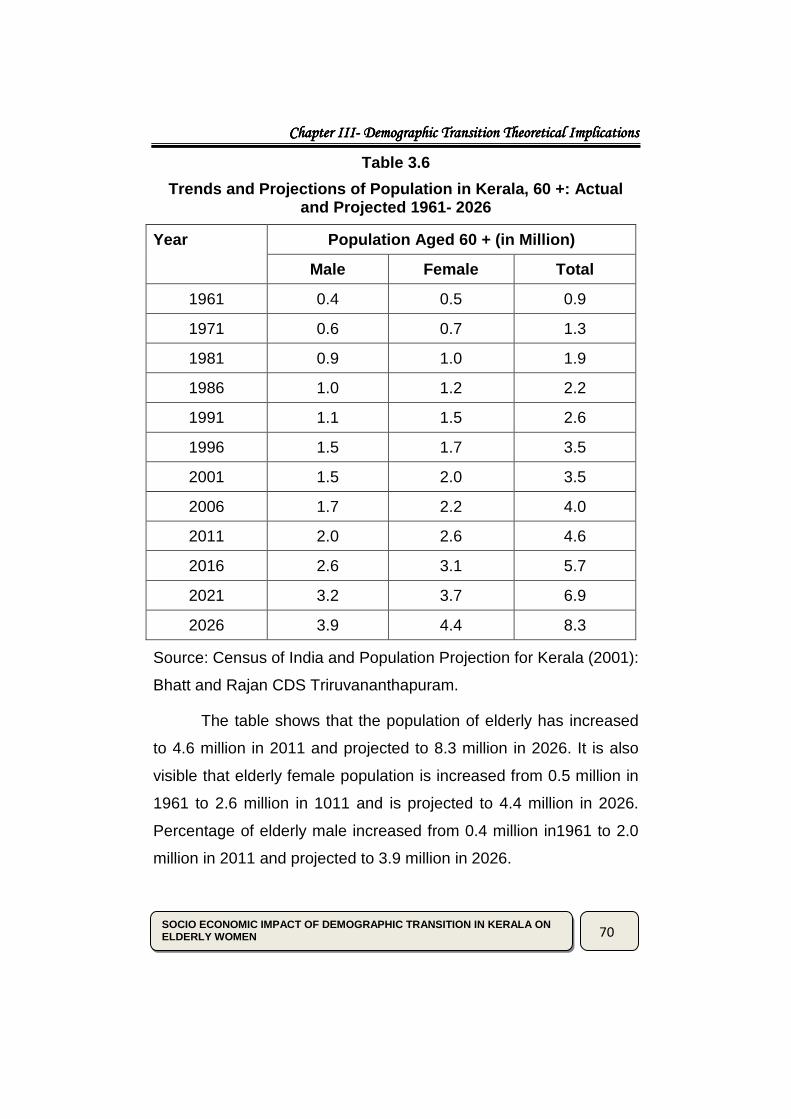
Table 3.6
Trends and Projections of Population in Kerala, 60 +: Actual and Projected 1961- 2026
Year Population Aged 60 + (in Million)
Male Female Total
1961 0.4 0.5 0.9
1971 0.6 0.7 1.3
1981 0.9 1.0 1.9
1986 1.0 1.2 2.2
1991 1.1 1.5 2.6
1996 1.5 1.7 3.5
2001 1.5 2.0 3.5
2006 1.7 2.2 4.0
2011 2.0 2.6 4.6
2016 2.6 3.1 5.7
2021 3.2 3.7 6.9
2026 3.9 4.4 8.3
Source: Census of India and Population Projection for Kerala (2001):
Bhatt and Rajan CDS Triruvananthapuram.
The table shows that the population of elderly has increased
to 4.6 million in 2011 and projected to 8.3 million in 2026. It is also
visible that elderly female population is increased from 0.5 million in
1961 to 2.6 million in 1011 and is projected to 4.4 million in 2026.
Percentage of elderly male increased from 0.4 million in1961 to 2.0
million in 2011 and projected to 3.9 million in 2026.
Chapter IChapter IChapter IChapter IIIIIIIII---- Demographic Transition Theoretical Implications Demographic Transition Theoretical Implications Demographic Transition Theoretical Implications Demographic Transition Theoretical Implications
71
SOCIO ECONOMIC IMPACT OF DEMOGRAPHIC TRANSITION IN KERALA ON ELDERLY WOMEN
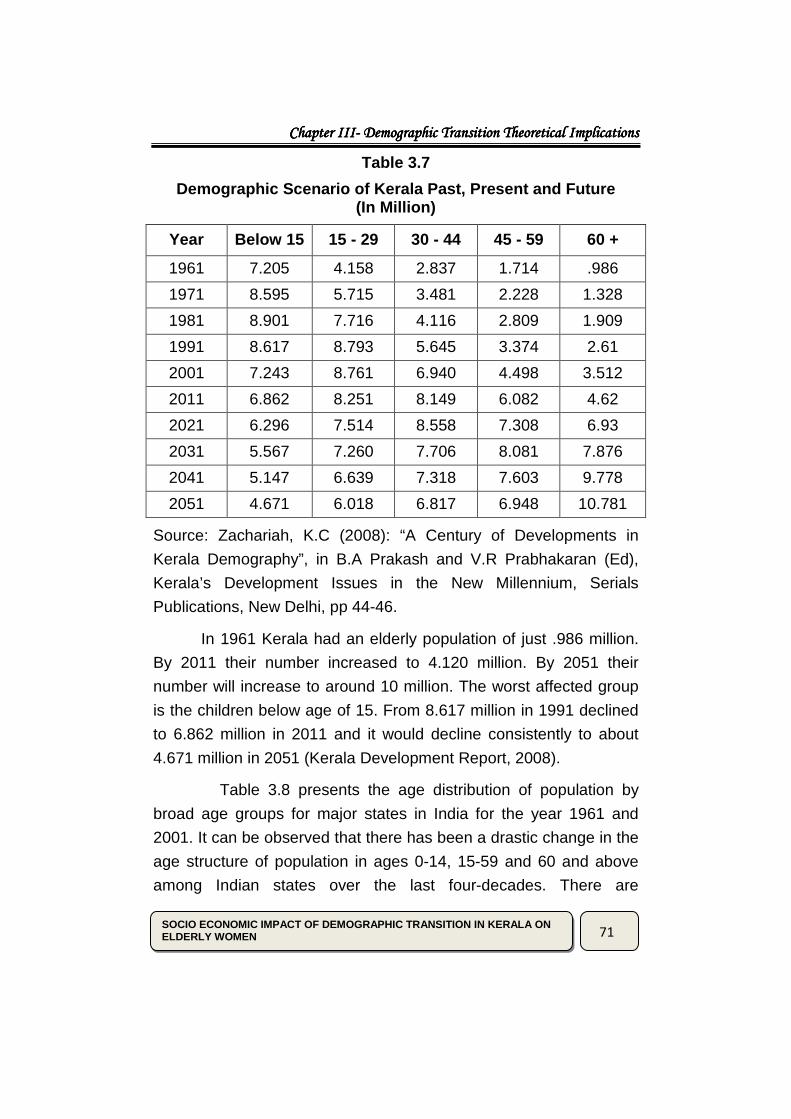
Table 3.7
Demographic Scenario of Kerala Past, Present and Fu ture (In Million)
Year Below 15 15 - 29 30 - 44 45 - 59 60 +
1961 7.205 4.158 2.837 1.714 .986
1971 8.595 5.715 3.481 2.228 1.328
1981 8.901 7.716 4.116 2.809 1.909
1991 8.617 8.793 5.645 3.374 2.61
2001 7.243 8.761 6.940 4.498 3.512
2011 6.862 8.251 8.149 6.082 4.62
2021 6.296 7.514 8.558 7.308 6.93
2031 5.567 7.260 7.706 8.081 7.876
2041 5.147 6.639 7.318 7.603 9.778
2051 4.671 6.018 6.817 6.948 10.781
Source: Zachariah, K.C (2008): “A Century of Developments in
Kerala Demography”, in B.A Prakash and V.R Prabhakaran (Ed),
Kerala’s Development Issues in the New Millennium, Serials
Publications, New Delhi, pp 44-46.
In 1961 Kerala had an elderly population of just .986 million.
By 2011 their number increased to 4.120 million. By 2051 their
number will increase to around 10 million. The worst affected group
is the children below age of 15. From 8.617 million in 1991 declined
to 6.862 million in 2011 and it would decline consistently to about
4.671 million in 2051 (Kerala Development Report, 2008).
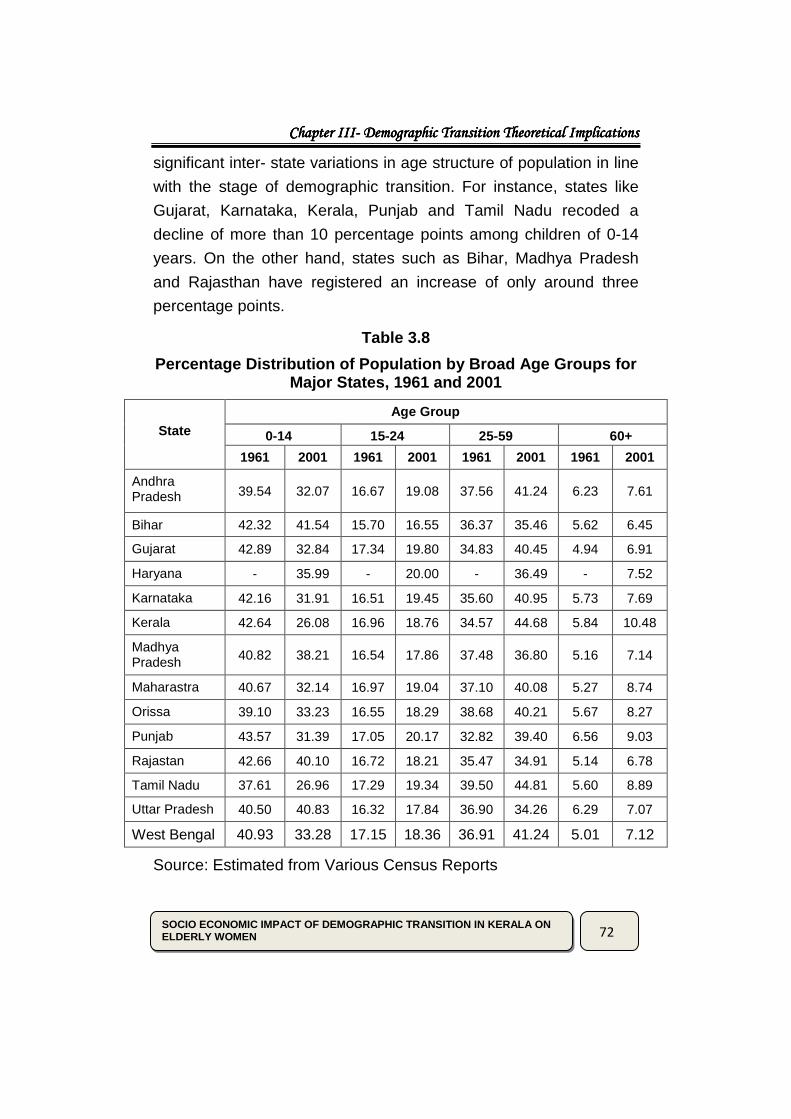
Table 3.8 presents the age distribution of population by
broad age groups for major states in India for the year 1961 and
2001. It can be observed that there has been a drastic change in the
age structure of population in ages 0-14, 15-59 and 60 and above
among Indian states over the last four-decades. There are
Chapter IChapter IChapter IChapter IIIIIIIII---- Demographic Transition Theoretical Implications Demographic Transition Theoretical Implications Demographic Transition Theoretical Implications Demographic Transition Theoretical Implications
72
SOCIO ECONOMIC IMPACT OF DEMOGRAPHIC TRANSITION IN KERALA ON ELDERLY WOMEN
significant inter- state variations in age structure of population in line
with the stage of demographic transition. For instance, states like
Gujarat, Karnataka, Kerala, Punjab and Tamil Nadu recoded a
decline of more than 10 percentage points among children of 0-14
years. On the other hand, states such as Bihar, Madhya Pradesh
and Rajasthan have registered an increase of only around three
percentage points.
Table 3.8
Percentage Distribution of Population by Broad Age Groups for Major States, 1961 and 2001
State
Age Grou p
0-14 15-24 25-59 60+
1961 2001 1961 2001 1961 2001 1961 2001
Andhra Pradesh 39.54 32.07 16.67 19.08 37.56 41.24 6.23 7.61
Bihar 42.32 41.54 15.70 16.55 36.37 35.46 5.62 6.45
Gujarat 42.89 32.84 17.34 19.80 34.83 40.45 4.94 6.91
Haryana - 35.99 - 20.00 - 36.49 - 7.52
Karnataka 42.16 31.91 16.51 19.45 35.60 40.95 5.73 7.69
Kerala 42.64 26.08 16.96 18.76 34.57 44.68 5.84 10.48
Madhya Pradesh 40.82 38.21 16.54 17.86 37.48 36.80 5.16 7.14
Maharastra 40.67 32.14 16.97 19.04 37.10 40.08 5.27 8.74
Orissa 39.10 33.23 16.55 18.29 38.68 40.21 5.67 8.27
Punjab 43.57 31.39 17.05 20.17 32.82 39.40 6.56 9.03
Rajastan 42.66 40.10 16.72 18.21 35.47 34.91 5.14 6.78
Tamil Nadu 37.61 26.96 17.29 19.34 39.50 44.81 5.60 8.89
Uttar Pradesh 40.50 40.83 16.32 17.84 36.90 34.26 6.29 7.07
West Bengal 40.93 33.28 17.15 18.36 36.91 41.24 5.01 7.12
Source: Estimated from Various Census Reports
Chapter IChapter IChapter IChapter IIIIIIIII---- Demographic Transition Theoretical Implications Demographic Transition Theoretical Implications Demographic Transition Theoretical Implications Demographic Transition Theoretical Implications
73
SOCIO ECONOMIC IMPACT OF DEMOGRAPHIC TRANSITION IN KERALA ON ELDERLY WOMEN
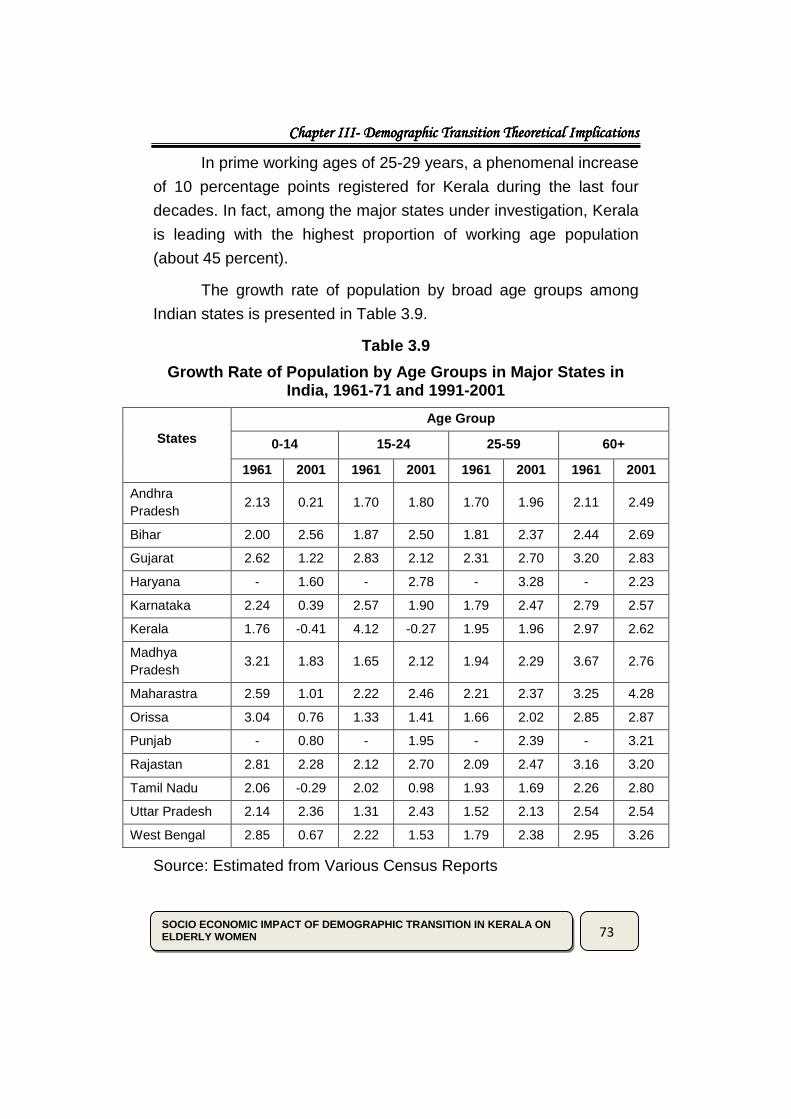
In prime working ages of 25-29 years, a phenomenal increase
of 10 percentage points registered for Kerala during the last four
decades. In fact, among the major states under investigation, Kerala
is leading with the highest proportion of working age population
(about 45 percent).
The growth rate of population by broad age groups among
Indian states is presented in Table 3.9.
Table 3.9
Growth Rate of Population by Age Groups in Major St ates in India, 1961-71 and 1991-2001
States
Age Group
0-14 15-24 25-59 60+
1961 2001 1961 2001 1961 2001 1961 2001
Andhra Pradesh
2.13 0.21 1.70 1.80 1.70 1.96 2.11 2.49
Bihar 2.00 2.56 1.87 2.50 1.81 2.37 2.44 2.69
Gujarat 2.62 1.22 2.83 2.12 2.31 2.70 3.20 2.83
Haryana - 1.60 - 2.78 - 3.28 - 2.23
Karnataka 2.24 0.39 2.57 1.90 1.79 2.47 2.79 2.57
Kerala 1.76 -0.41 4.12 -0.27 1.95 1.96 2.97 2.62
Madhya Pradesh
3.21 1.83 1.65 2.12 1.94 2.29 3.67 2.76
Maharastra 2.59 1.01 2.22 2.46 2.21 2.37 3.25 4.28
Orissa 3.04 0.76 1.33 1.41 1.66 2.02 2.85 2.87
Punjab - 0.80 - 1.95 - 2.39 - 3.21
Rajastan 2.81 2.28 2.12 2.70 2.09 2.47 3.16 3.20
Tamil Nadu 2.06 -0.29 2.02 0.98 1.93 1.69 2.26 2.80
Uttar Pradesh 2.14 2.36 1.31 2.43 1.52 2.13 2.54 2.54
West Bengal 2.85 0.67 2.22 1.53 1.79 2.38 2.95 3.26
Source: Estimated from Various Census Reports
Chapter IChapter IChapter IChapter IIIIIIIII---- Demographic Transition Theoretical Implications Demographic Transition Theoretical Implications Demographic Transition Theoretical Implications Demographic Transition Theoretical Implications
74
SOCIO ECONOMIC IMPACT OF DEMOGRAPHIC TRANSITION IN KERALA ON ELDERLY WOMEN
It can be seen that those in younger ages of 0-14, Kerala had
the lowest growth rate of 1.76 percent in 1961-71 and reached a
negative growth rate during the last two decades. On the other hand,
Bihar and Uttar Pradesh have recorded an increase in the growth
rate of population during the same period. Similarly, Kerala had also
recorded a significant decline in the growth of population among
ages 15-24 years compared to the rest of the states.
Unlike the age groups 0-14 and 15-24, which witnessed
negative growth rates, in the prime working age groups, growth rate
reveals an opposite trend in Kerala. For instance, the growth rate of
prime working age groups (25-59) worked out to be 2.0 percent
during 1961-71, reached a peak of 2.6 in 1981-91 and reached the
same level of 2.0 in 1991-2001. India’s general population is
growing at 2 per cent annum today whereas Kerala’s working age
groups follow similar pattern of growth.
Chapter IChapter IChapter IChapter IIIIIIIII---- Demographic Transition Theoretical Implications Demographic Transition Theoretical Implications Demographic Transition Theoretical Implications Demographic Transition Theoretical Implications
75
SOCIO ECONOMIC IMPACT OF DEMOGRAPHIC TRANSITION IN KERALA ON ELDERLY WOMEN
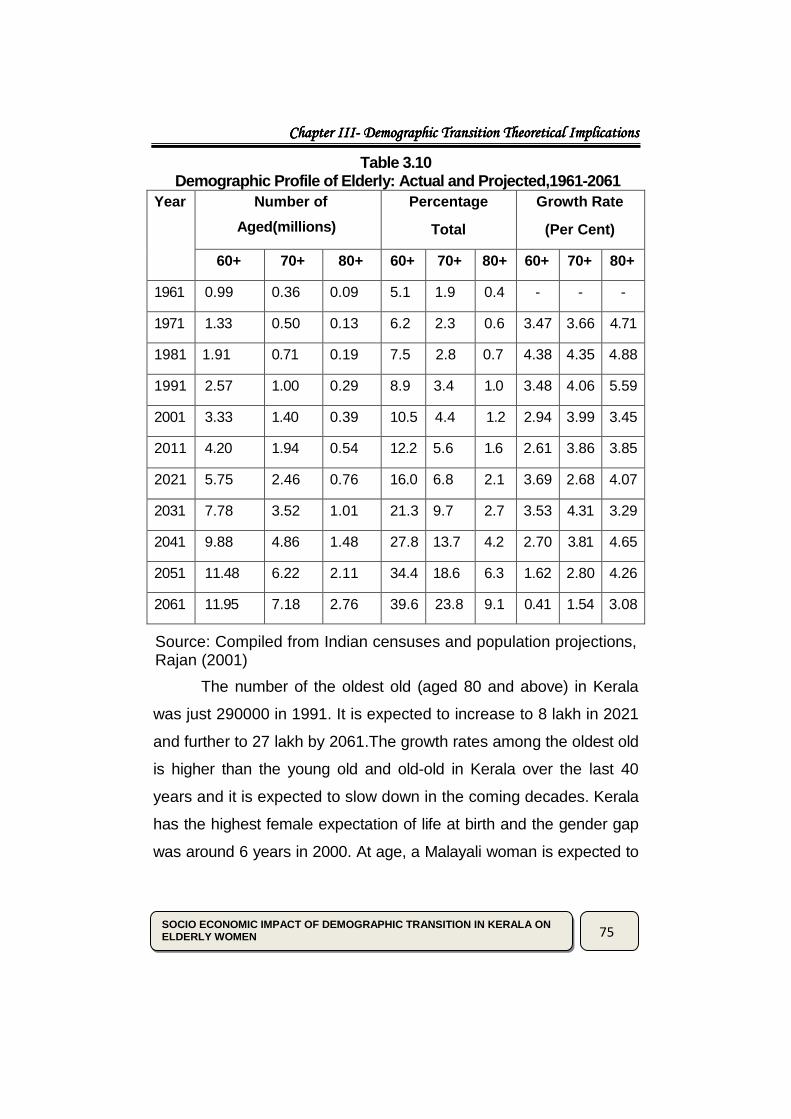
Table 3.10 Demographic Profile of Elderly: Actual and Project ed,1961-2061
Year Number of
Aged(millions)
Percentage
Total
Growth Rate
(Per Cent)
60+ 70+ 80+ 60+ 70+ 80+ 60+ 70+ 80+
1961 0.99 0.36 0.09 5.1 1.9 0.4 - - -
1971 1.33 0.50 0.13 6.2 2.3 0.6 3.47 3.66 4.71
1981 1.91 0.71 0.19 7.5 2.8 0.7 4.38 4.35 4.88
1991 2.57 1.00 0.29 8.9 3.4 1.0 3.48 4.06 5.59
2001 3.33 1.40 0.39 10.5 4.4 1.2 2.94 3.99 3.45
2011 4.20 1.94 0.54 12.2 5.6 1.6 2.61 3.86 3.85
2021 5.75 2.46 0.76 16.0 6.8 2.1 3.69 2.68 4.07
2031 7.78 3.52 1.01 21.3 9.7 2.7 3.53 4.31 3.29
2041 9.88 4.86 1.48 27.8 13.7 4.2 2.70 3.81 4.65
2051 11.48 6.22 2.11 34.4 18.6 6.3 1.62 2.80 4.26
2061 11.95 7.18 2.76 39.6 23.8 9.1 0.41 1.54 3.08
Source: Compiled from Indian censuses and population projections, Rajan (2001)
The number of the oldest old (aged 80 and above) in Kerala
was just 290000 in 1991. It is expected to increase to 8 lakh in 2021
and further to 27 lakh by 2061.The growth rates among the oldest old
is higher than the young old and old-old in Kerala over the last 40
years and it is expected to slow down in the coming decades. Kerala
has the highest female expectation of life at birth and the gender gap
was around 6 years in 2000. At age, a Malayali woman is expected to
Chapter IChapter IChapter IChapter IIIIIIIII---- Demographic Transition Theoretical Implications Demographic Transition Theoretical Implications Demographic Transition Theoretical Implications Demographic Transition Theoretical Implications
76
SOCIO ECONOMIC IMPACT OF DEMOGRAPHIC TRANSITION IN KERALA ON ELDERLY WOMEN
live 21 years, as against 19 years in the case of their male counter
parts.
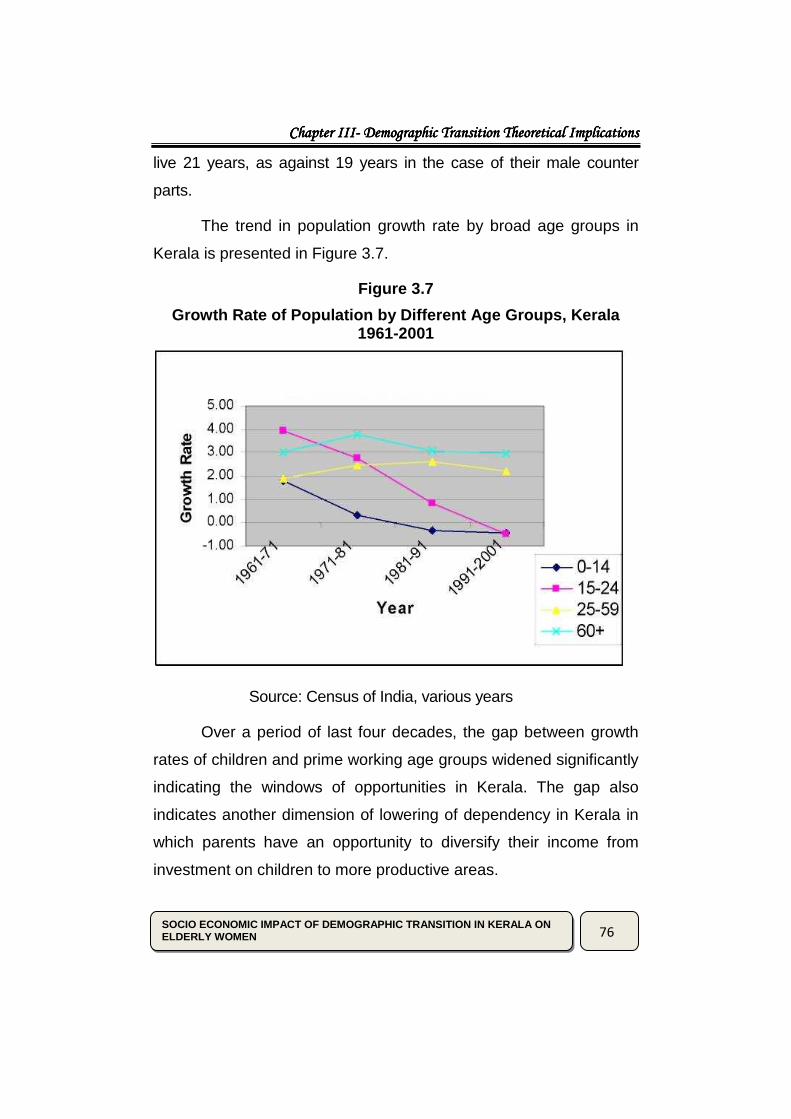
The trend in population growth rate by broad age groups in
Kerala is presented in Figure 3.7.
Figure 3.7
Growth Rate of Population by Different Age Groups, Kerala 1961-2001
Source: Census of India, various years
Over a period of last four decades, the gap between growth
rates of children and prime working age groups widened significantly
indicating the windows of opportunities in Kerala. The gap also
indicates another dimension of lowering of dependency in Kerala in
which parents have an opportunity to diversify their income from
investment on children to more productive areas.
Chapter IChapter IChapter IChapter IIIIIIIII---- Demographic Transition Theoretical Implications Demographic Transition Theoretical Implications Demographic Transition Theoretical Implications Demographic Transition Theoretical Implications
77
SOCIO ECONOMIC IMPACT OF DEMOGRAPHIC TRANSITION IN KERALA ON ELDERLY WOMEN
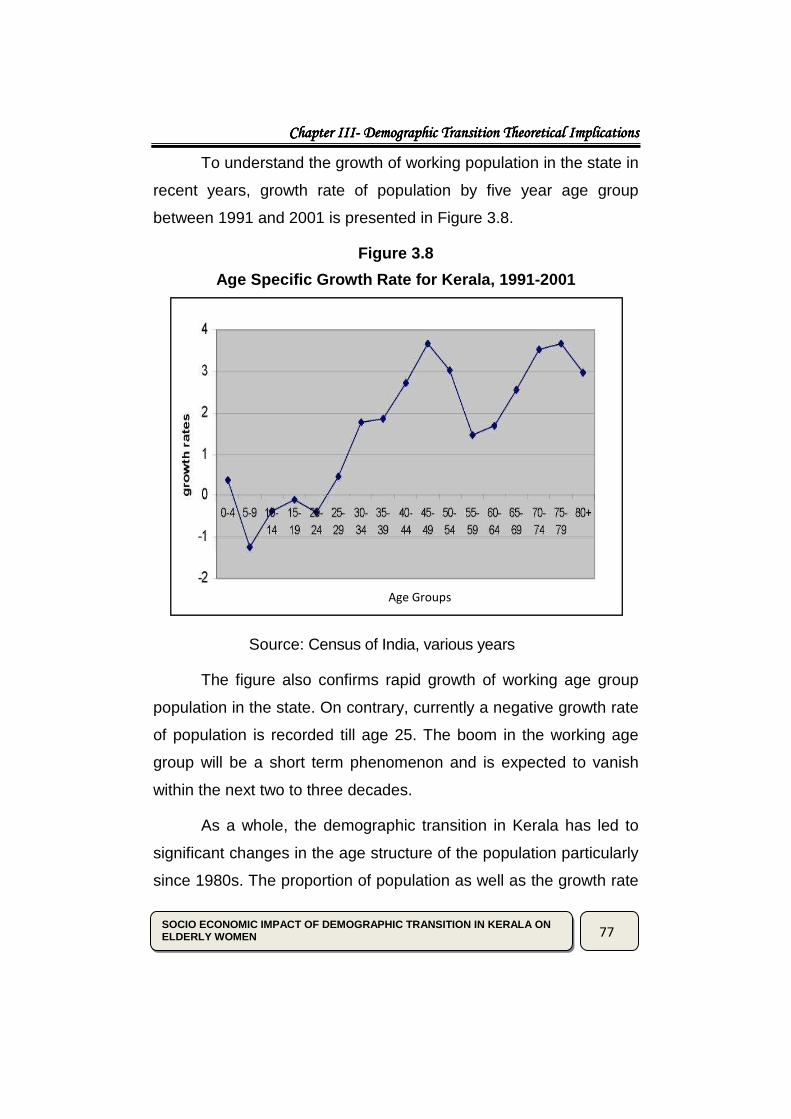
To understand the growth of working population in the state in
recent years, growth rate of population by five year age group
between 1991 and 2001 is presented in Figure 3.8.
Figure 3.8
Age Specific Growth Rate for Kerala, 1991-2001
Source: Census of India, various years
The figure also confirms rapid growth of working age group
population in the state. On contrary, currently a negative growth rate
of population is recorded till age 25. The boom in the working age
group will be a short term phenomenon and is expected to vanish
within the next two to three decades.
As a whole, the demographic transition in Kerala has led to
significant changes in the age structure of the population particularly
since 1980s. The proportion of population as well as the growth rate
Age Groups
Chapter IChapter IChapter IChapter IIIIIIIII---- Demographic Transition Theoretical Implications Demographic Transition Theoretical Implications Demographic Transition Theoretical Implications Demographic Transition Theoretical Implications
78
SOCIO ECONOMIC IMPACT OF DEMOGRAPHIC TRANSITION IN KERALA ON ELDERLY WOMEN
in the prime working age group 25-59 is significant by higher in
Kerala leading to a ‘window of opportunity’ for the state as far as
economic growth is concerned (United Nations).
3.7. Demographic Shift and Population Ageing
A population’s age composition can only change through the
fundamental demographic processes of birth, death and migration.
Generally changes in the number of births play the most important
role in a country’s overall age structure. Decreasing fertility along
with lengthening life expectancy has reshaped age structure of the
population in most regions by shifting relative weight from the
younger to older groups (Ghazy Mujahid, 2000). Following rapid
fertility declines and sustained improvements in the life expectancy
during the second half of the twentieth century, most developed
countries faced with the problem of population ageing. The world’s
population is not only growing larger, it is also becoming older. The
proportion of population aged above sixty (60) is increasing at a
faster rate than any other age groups. In developed countries the
proportion of older people already exceeds that of children. In
developing countries, the growth of the older population is occurring
more rapidly due to the faster pace of fertility decline that has
resulted from the success of reproduction health and family planning
programmes.
The sources of population ageing lie in two demographic
phenomena; rising life expectancy and declining fertility. An increase
in longevity rises the average age of the population by rising the
number of years that each person is old relative to numbers of years
Chapter IChapter IChapter IChapter IIIIIIIII---- Demographic Transition Theoretical Implications Demographic Transition Theoretical Implications Demographic Transition Theoretical Implications Demographic Transition Theoretical Implications
79
SOCIO ECONOMIC IMPACT OF DEMOGRAPHIC TRANSITION IN KERALA ON ELDERLY WOMEN
in which he is young. A decline in fertility increases the average of
the population by changing the balance of people born recently (the
young) to people born further in the past (the old). Of these two
forces, it is declining fertility that is the dominant contributor to
population ageing in the world today.
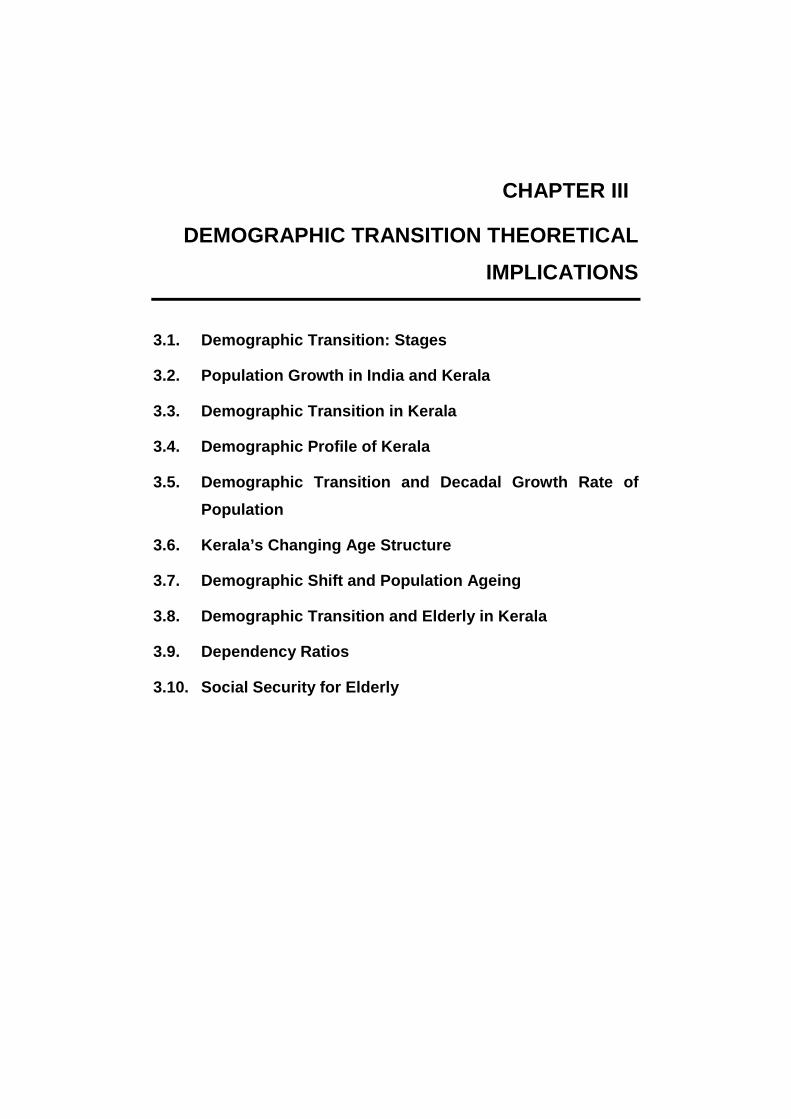
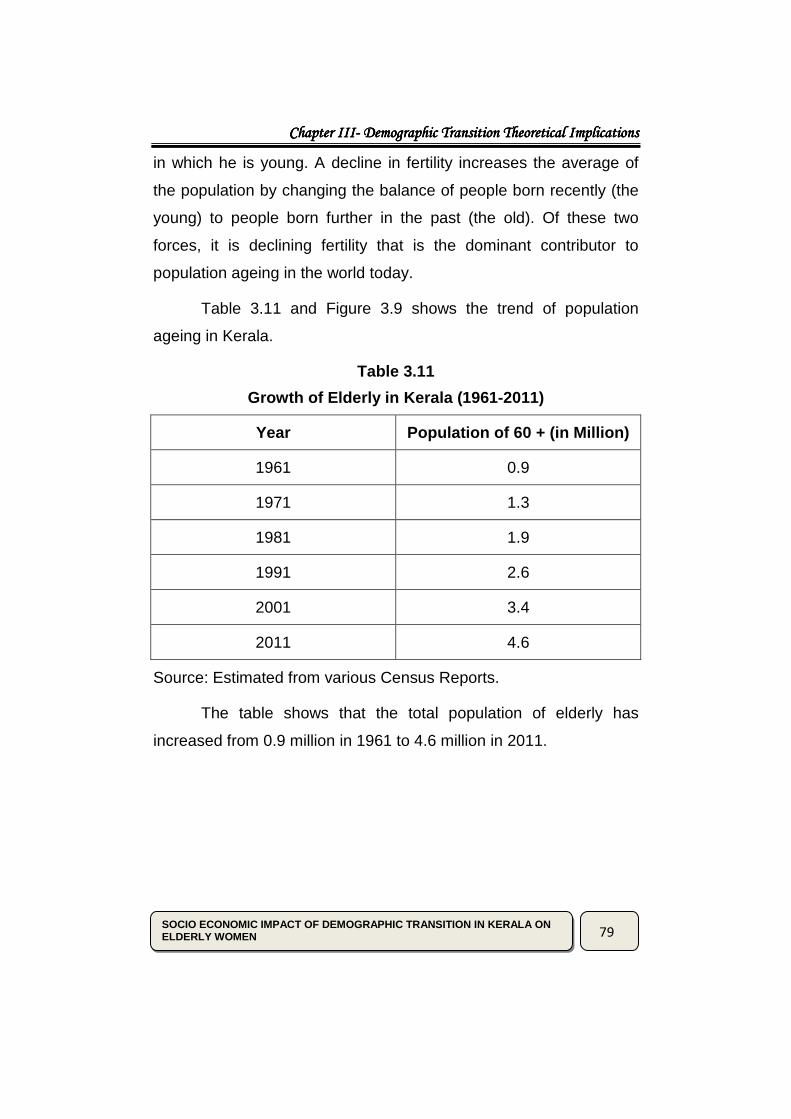
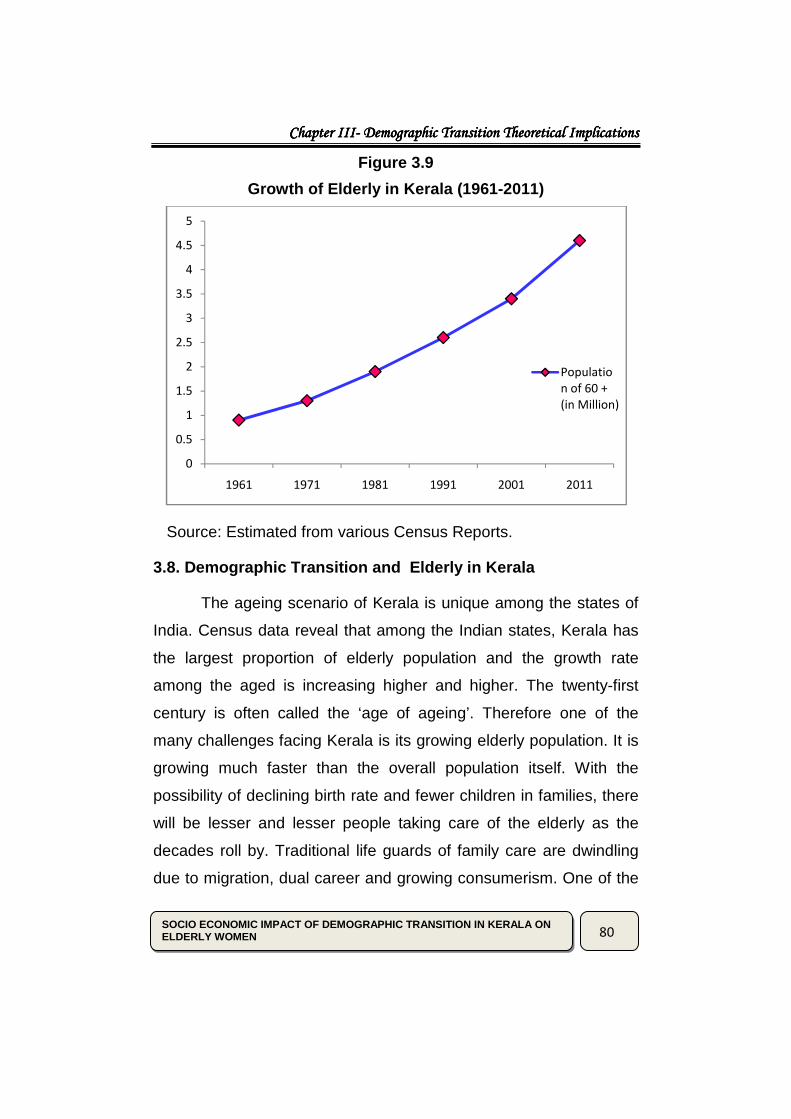
Table 3.11 and Figure 3.9 shows the trend of population
ageing in Kerala.
Table 3.11
Growth of Elderly in Kerala (1961-2011)
Year Population of 60 + (in Million)
1961 0.9
1971 1.3
1981 1.9
1991 2.6
2001 3.4
2011 4.6
Source: Estimated from various Census Reports.
The table shows that the total population of elderly has
increased from 0.9 million in 1961 to 4.6 million in 2011.
Chapter IChapter IChapter IChapter IIIIIIIII---- Demographic Transition Theoretical Implications Demographic Transition Theoretical Implications Demographic Transition Theoretical Implications Demographic Transition Theoretical Implications
80
SOCIO ECONOMIC IMPACT OF DEMOGRAPHIC TRANSITION IN KERALA ON ELDERLY WOMEN
Figure 3.9
Growth of Elderly in Kerala (1961-2011)
Source: Estimated from various Census Reports.
3.8. Demographic Transition and Elderly in Kerala
The ageing scenario of Kerala is unique among the states of
India. Census data reveal that among the Indian states, Kerala has
the largest proportion of elderly population and the growth rate
among the aged is increasing higher and higher. The twenty-first
century is often called the ‘age of ageing’. Therefore one of the
many challenges facing Kerala is its growing elderly population. It is
growing much faster than the overall population itself. With the
possibility of declining birth rate and fewer children in families, there
will be lesser and lesser people taking care of the elderly as the
decades roll by. Traditional life guards of family care are dwindling
due to migration, dual career and growing consumerism. One of the
0
0.5
1
1.5
2
2.5
3
3.5
4
4.5
5
1961 1971 1981 1991 2001 2011
Populatio
n of 60 +
(in Million)
Chapter IChapter IChapter IChapter IIIIIIIII---- Demographic Transition Theoretical Implications Demographic Transition Theoretical Implications Demographic Transition Theoretical Implications Demographic Transition Theoretical Implications
81
SOCIO ECONOMIC IMPACT OF DEMOGRAPHIC TRANSITION IN KERALA ON ELDERLY WOMEN
greatest challenges of Kerala in 21st century would be in managing
the ever increasing number of elderly population who are
progressively getting older. All these make the well-being of the
elderly, a growing challenge to the state. A significant aspect of this
challenge comprises the socio-economic and psychological status of
the aged. Caring the elderly people will therefore emerge as a new
challenge in the area of social security and welfare in the coming
decades (Kannan, 2006).
The elderly suffer from a host of physical and psychological
ailments. The major diseases of the elderly include hypertension,
cardio vascular disorders, renal problems, diabetes, arthritis etc.
According to the National Sample Survey, the proportion of the
elderly who reported good health declined from 70 per cent among
persons in the age group of 60 years and above to 65 per cent
among persons of 80 years of age and above. In general, the poor
among the elderly seldom receive medical treatment and
hospitalization except in very grave situations.
The majority of the elderly tend to work even after the age of
retirement due to inadequate social security and financial resources.
However, the work participation ratio of the elderly tends to decline
with advancement in age. Even in the age group of 80 and above
the elderly participated in remunerative work due to lack of adequate
old-age social security, both emotional and material. Widows, whose
numbers are far greater than widowers, are the most affected due to
poverty, illiteracy and lack of property rights and social support.
(Sreerupa, 2006)
Chapter IChapter IChapter IChapter IIIIIIIII---- Demographic Transition Theoretical Implications Demographic Transition Theoretical Implications Demographic Transition Theoretical Implications Demographic Transition Theoretical Implications
82
SOCIO ECONOMIC IMPACT OF DEMOGRAPHIC TRANSITION IN KERALA ON ELDERLY WOMEN
Given the advanced stage in Kerala’s demographic transition,
the share of the aged in the population will continue to increase
through the next couple of decades. In Kerala, as in other parts of
the country, families have customarily supported elderly persons.
With Kerala having undergone the demographic transition, however
the number of care givers in families has been on the decline.
Reduction in family size, national and international job-seeking flows
out- migration and a high work participation rate of women, have
contributed to an alternation of resources for the care of the elderly.
At the same time, the increasing presence of older persons in the
state is making people of all ages more aware that we live in a
diverse and multi generational society. It is no longer possible to
ignore ageing, regardless of whether one views it positively or
negatively.
Even when families can support the older generation, they
essentially have difficulty in doing so because people above sixty
years today, live much longer than those of former generations and
require care and medical treatment for many more years. Many
older persons in Kerala who have worked in the formal sector and
receive in pension or have participated in other income security
schemes will be to able economically support themselves in varying
degrees during their post retirement years. However most of them
are not covered by any such schemes and earn their livelihood in
the informal sector by working even at the age of 80 years. The
majority of them are women, they have not been able, for one
reason or other to accumulate sufficient savings to ensure their well
being on old age. It is vital that the social safety net should be
extended to cover all elderly persons.
Chapter IChapter IChapter IChapter IIIIIIIII---- Demographic Transition Theoretical Implications Demographic Transition Theoretical Implications Demographic Transition Theoretical Implications Demographic Transition Theoretical Implications
83
SOCIO ECONOMIC IMPACT OF DEMOGRAPHIC TRANSITION IN KERALA ON ELDERLY WOMEN
3.9. Dependency Ratios
Dependency Ratios refers to the ratio of the population below 14
years of and above 60 years of age to the population in working
ages(15-59). The following ratios are presented for Kerala for the
periods 1961 to 2061.
a) Young Dependency Ratio:
The number of persons aged 0-14 to per 100 persons of
intermediate age (working age 15-59).
b) Aged Dependency Ratio:
The number of persons aged 60 years and above per 100
persons of working age (15-59)
c) Total Dependency Ratio:
The number of persons in the non-working age group (0-14
and 60+) to per 100 persons of working age (15-59).
d) Index of Ageing:
The proposition of the population aged sixty and above to the
population aged 0-14. It is intended to measure the structure of
dependency.
e) Index of Children
The population of aged 0-14 per 100 to population aged 60
years and above
f) Index of Parents to Children
The population aged 60-74 per 100 to population aged 40-44
Chapter IChapter IChapter IChapter IIIIIIIII---- Demographic Transition Theoretical Implications Demographic Transition Theoretical Implications Demographic Transition Theoretical Implications Demographic Transition Theoretical Implications
84
SOCIO ECONOMIC IMPACT OF DEMOGRAPHIC TRANSITION IN KERALA ON ELDERLY WOMEN
g) Index of Oldest to Young Old
The population aged 80 years above per 100 to population aged
60-64.
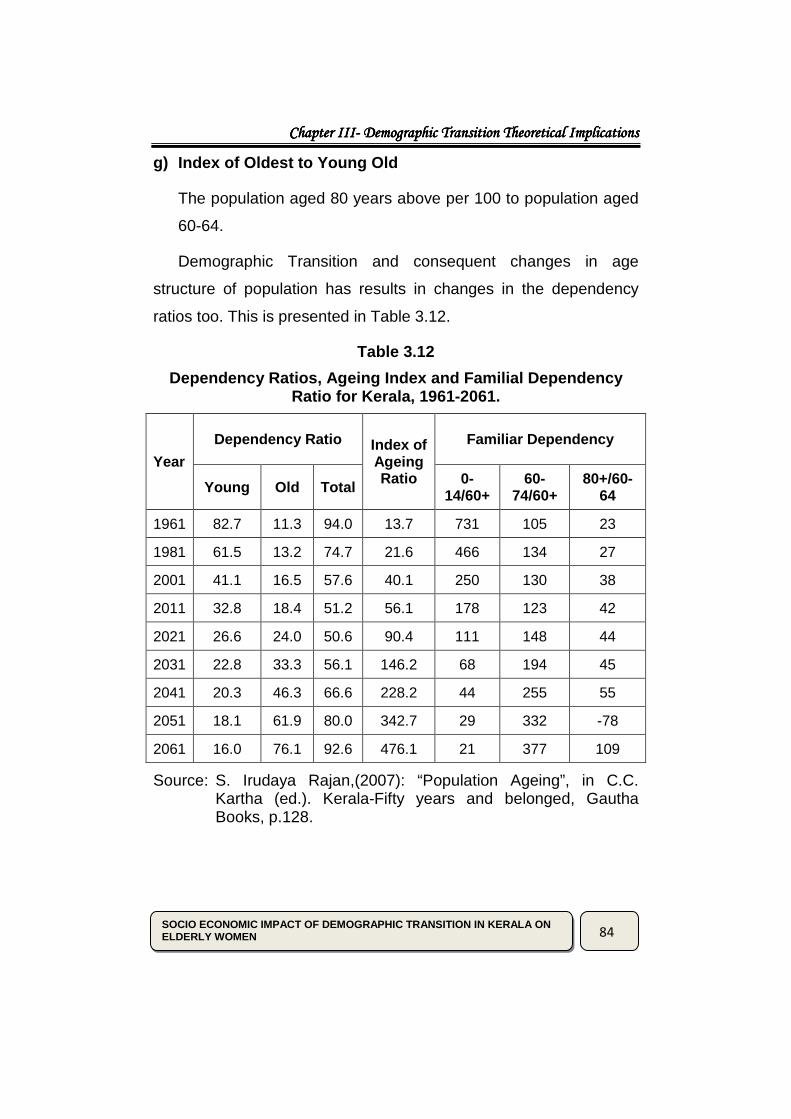
Demographic Transition and consequent changes in age
structure of population has results in changes in the dependency
ratios too. This is presented in Table 3.12.
Table 3.12
Dependency Ratios, Ageing Index and Familial Depend ency Ratio for Kerala, 1961-2061.
Year
Dependency Ratio Index of Ageing Ratio
Familiar Dependency
Young Old Total 0-14/60+
60-74/60+
80+/60-64
1961 82.7 11.3 94.0 13.7 731 105 23
1981 61.5 13.2 74.7 21.6 466 134 27
2001 41.1 16.5 57.6 40.1 250 130 38
2011 32.8 18.4 51.2 56.1 178 123 42
2021 26.6 24.0 50.6 90.4 111 148 44
2031 22.8 33.3 56.1 146.2 68 194 45
2041 20.3 46.3 66.6 228.2 44 255 55
2051 18.1 61.9 80.0 342.7 29 332 -78
2061 16.0 76.1 92.6 476.1 21 377 109
Source: S. Irudaya Rajan,(2007): “Population Ageing”, in C.C. Kartha (ed.). Kerala-Fifty years and belonged, Gautha Books, p.128.
Chapter IChapter IChapter IChapter IIIIIIIII---- Demographic Transition Theoretical Implications Demographic Transition Theoretical Implications Demographic Transition Theoretical Implications Demographic Transition Theoretical Implications
85
SOCIO ECONOMIC IMPACT OF DEMOGRAPHIC TRANSITION IN KERALA ON ELDERLY WOMEN
The decline in fertility has reduced the overall dependency
burden from 94.0 to in 1961 to 57.6 in 2001. Though the aged
dependency ratio are on the increase, the overall dependency ratio
has shown a decline of 37 points during 1961-2001.
The projected age dependency ratios for the period 2001-
2061 are also shown in the table. During this period the young
dependency ratios are expected to decline from 41 in 2001 to 16 in
2061. The implications of these ratios for the future is that instead of
every six working age persons there would be only two working
persons in 2061 who will have to share the responsibility of taking
care of at least one aged persons. Moreover, the probability of the
aged person being a woman, who is a widow, less skilled, less
educated and not working, non-recipient of social security
allowance, unhealthy without health insurance, is also much higher.
In Kerala, the rate of increase among elderly persons will much
higher. In 2061, there is likely to be 476 elderly persons for every
100 children in Kerala.
Chapter IChapter IChapter IChapter IIIIIIIII---- Demographic Transition Theoretical Implications Demographic Transition Theoretical Implications Demographic Transition Theoretical Implications Demographic Transition Theoretical Implications
86
SOCIO ECONOMIC IMPACT OF DEMOGRAPHIC TRANSITION IN KERALA ON ELDERLY WOMEN
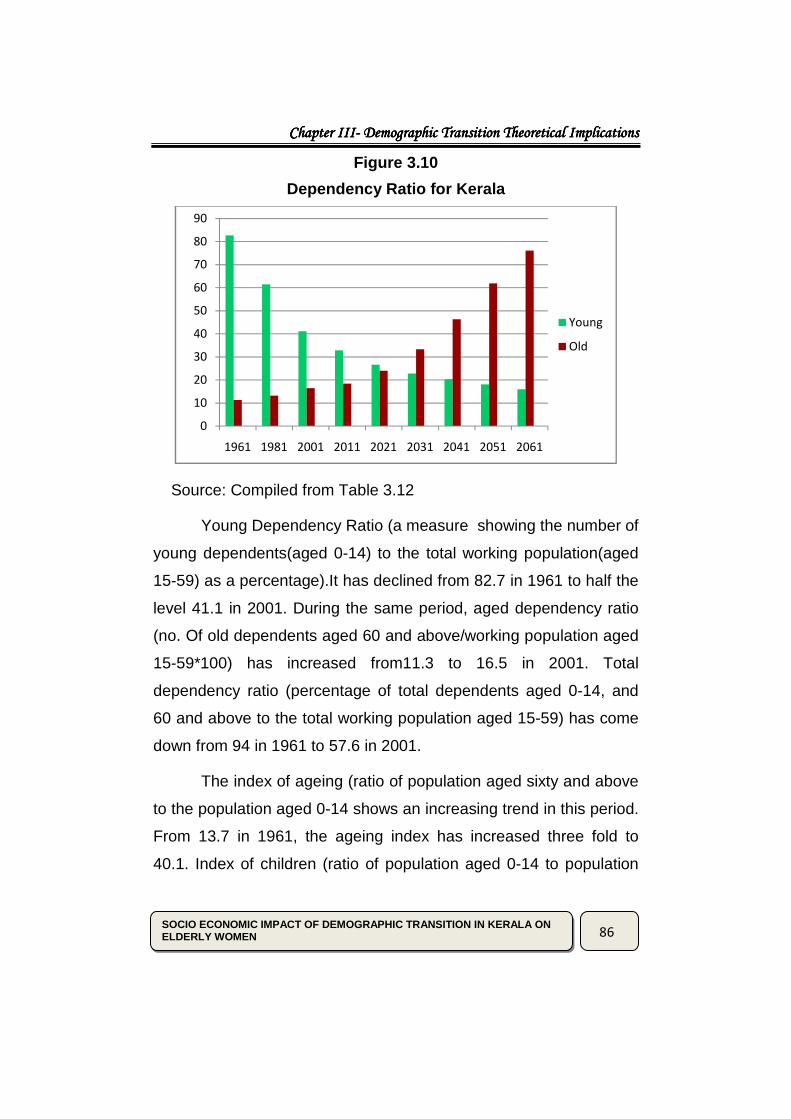
Figure 3.10
Dependency Ratio for Kerala
Source: Compiled from Table 3.12
Young Dependency Ratio (a measure showing the number of
young dependents(aged 0-14) to the total working population(aged
15-59) as a percentage).It has declined from 82.7 in 1961 to half the
level 41.1 in 2001. During the same period, aged dependency ratio
(no. Of old dependents aged 60 and above/working population aged
15-59*100) has increased from11.3 to 16.5 in 2001. Total
dependency ratio (percentage of total dependents aged 0-14, and
60 and above to the total working population aged 15-59) has come
down from 94 in 1961 to 57.6 in 2001.
The index of ageing (ratio of population aged sixty and above
to the population aged 0-14 shows an increasing trend in this period.
From 13.7 in 1961, the ageing index has increased three fold to
40.1. Index of children (ratio of population aged 0-14 to population
0
10
20
30
40
50
60
70
80
90
1961 1981 2001 2011 2021 2031 2041 2051 2061
Young
Old
Chapter IChapter IChapter IChapter IIIIIIIII---- Demographic Transition Theoretical Implications Demographic Transition Theoretical Implications Demographic Transition Theoretical Implications Demographic Transition Theoretical Implications
87
SOCIO ECONOMIC IMPACT OF DEMOGRAPHIC TRANSITION IN KERALA ON ELDERLY WOMEN
aged 60 years and above) has drastically come down from 731 to
250. Index of parents to children (ratio of population aged 60-74 to
population aged 40-44 as a percentage) which was 105 in 1961 has
increased to 130 in 2001. Index of oldest to young old (ratio of the
population aged 80 years above to the population aged 60-64) also
has increased from 23 to 38 during the period 1961-2001.
Though the aged dependency ratios are on the increase, the
overall dependency ratio has shown a decline of 37 points during
1961-2001.
The projected age dependency ratios for the period 2001-
2026 are also shown in the table. During this period the young
dependency ratios are expected to decline from 41 in 2001 to 16 in
2061. The implications of these ratios for the future is that instead of
every six working age persons there would be only two working
persons in 2061who will have to share the responsibility of taking
care of at least one aged person. Moreover, the probability of the
aged person being a woman, who is a widow, less skilled, less
educated and not working, non-recipient of social security
allowance, unhealthy without health insurance, is also much higher.
In Kerala, the rate of increase among elderly persons will be much
higher. In 2061, there is likely to be 476 elderly persons for every
100 children in Kerala.
3.10. Social Security for Elderly
Successive governments in Kerala have introduced 35 social
security and assistance schemes, which are currently being
implemented. Among the southern states, Kerala spends close to 3
Chapter IChapter IChapter IChapter IIIIIIIII---- Demographic Transition Theoretical Implications Demographic Transition Theoretical Implications Demographic Transition Theoretical Implications Demographic Transition Theoretical Implications
88
SOCIO ECONOMIC IMPACT OF DEMOGRAPHIC TRANSITION IN KERALA ON ELDERLY WOMEN
per cent of its budget for social security programs and the
neighboring states of Tamil Nadu and Karnataka. The schemes are
classified into four categories (Rajan, 1999).
A. Schemes which are fully financed by the state and central
governments:
1. National Old Age Pension (NOAP).
B. Schemes which are fully financed by the State:
1. Kerala Destitute and Widow Pension Scheme
2. Kerala Agricultural Workers Pension Scheme
3. Special Pension Scheme for the Physically Handicapped and
Mentally Retarded
4. Old Age Pension to Craftsmen
5. Pension to Sportsmen in Indigent Circumstances
6. Pension to Journalists in Indigent Circumstances
7. Pension to Cine Artists in Indigent Circumstances
8. Pension to Freedom Fighters
9. Pension to Second World War Veterans
C. Major schemes which are financed with partial state support
1. Kerala Coir Workers' Welfare Fund
2. Kerala Construction Workers' Welfare Fund
3. Kerala Fishermen' Welfare Fund
Chapter IChapter IChapter IChapter IIIIIIIII---- Demographic Transition Theoretical Implications Demographic Transition Theoretical Implications Demographic Transition Theoretical Implications Demographic Transition Theoretical Implications
89
SOCIO ECONOMIC IMPACT OF DEMOGRAPHIC TRANSITION IN KERALA ON ELDERLY WOMEN
D. Schemes which are financed outside the budget and
operated by respective boards
1. Kerala Headload Workers' Welfare Fund
2. Kerala Abkari Workers' Welfare Fund Scheme
3. Kerala Toddy Workers' Welfare Fund
4. Kerala Agricultural Workers' Welfare Fund
Indira Gandhi National Old Age Pension Scheme (IGNOAPS)
covers older persons having no regular source of income his/her own
or no financial support from family members. In 2007 it renamed as
Indira Gandhi National Policy of Older Persons (IGNPOP) include all
persons below 65 years of age (Kannan, 2007).
Annapurna Scheme covers the elderly Below Poverty Line
(B.P.L) who are not covered under (NOAPS) 10 kg of food grains per
person per month are supplied free of cost.
The Old Age Social and Income Security (OASIS) appointed
by the central government have recommended the old age pension
scheme for the old belonging to the unorganised sector. National
Adhar scheme introduced by the central government will help the
senior citizens to get concessions in railway and fight tickets.
The national policy on older persons was announced by the
government in 1999, as an international year of older persons by UN
and the year 2000 was declared as national year by the India
government.
Chapter IChapter IChapter IChapter IIIIIIIII---- Demographic Transition Theoretical Implications Demographic Transition Theoretical Implications Demographic Transition Theoretical Implications Demographic Transition Theoretical Implications
90
SOCIO ECONOMIC IMPACT OF DEMOGRAPHIC TRANSITION IN KERALA ON ELDERLY WOMEN
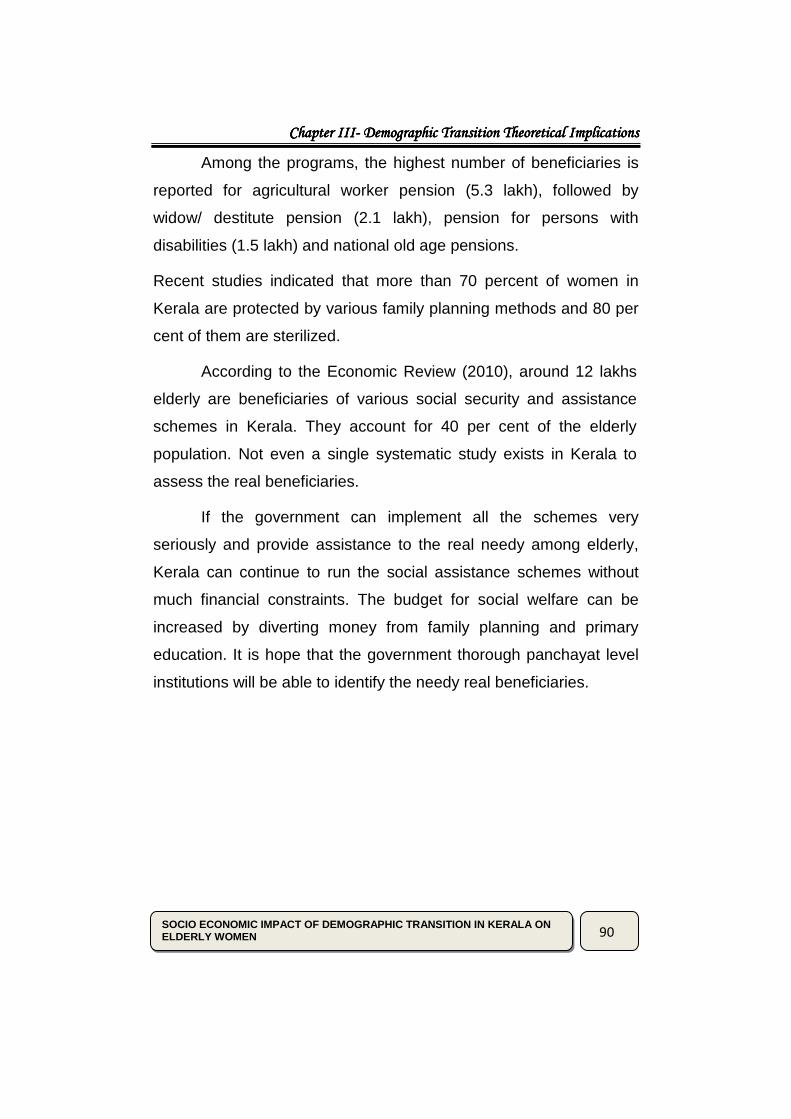
Among the programs, the highest number of beneficiaries is
reported for agricultural worker pension (5.3 lakh), followed by
widow/ destitute pension (2.1 lakh), pension for persons with
disabilities (1.5 lakh) and national old age pensions.
Recent studies indicated that more than 70 percent of women in
Kerala are protected by various family planning methods and 80 per
cent of them are sterilized.
According to the Economic Review (2010), around 12 lakhs
elderly are beneficiaries of various social security and assistance
schemes in Kerala. They account for 40 per cent of the elderly
population. Not even a single systematic study exists in Kerala to
assess the real beneficiaries.
If the government can implement all the schemes very
seriously and provide assistance to the real needy among elderly,
Kerala can continue to run the social assistance schemes without
much financial constraints. The budget for social welfare can be
increased by diverting money from family planning and primary
education. It is hope that the government thorough panchayat level
institutions will be able to identify the needy real beneficiaries.
Chapter IChapter IChapter IChapter IIIIIIIII---- Demographic Transition Theoretical Implications Demographic Transition Theoretical Implications Demographic Transition Theoretical Implications Demographic Transition Theoretical Implications
91
SOCIO ECONOMIC IMPACT OF DEMOGRAPHIC TRANSITION IN KERALA ON ELDERLY WOMEN
REFERENCES
Asha A. Bhende, Tara Kanitkar (2006): “Principals of Population
Studies”, Himalaya Publishing House, Mumbai, p130.
Census of India (2001, 2011)
Cherunilam, Francis (1987):“Migration-Causes, Correlates,
Consequences, Trends and Policies”, Bombay, Himalaya
Publishing House.
District Census Hand Books (2011) Alappuzha, Kottayam and
Pathanamthitta.
Economic Review, State Planning Board, Thiruvananthapuram
(2010, 2011)
George J. Stolnitz, Ronald Freedman (1964): “The Demographic
Transition: From High to Low Birth Rates and Death Rates”,
(Ed.) Population: The Vital Revolution, New York: Doubleday
and Co, p.30.
George T.M (2008): “Demographic Changes and Challenges to
Development”, Nirmala Academic and Research Publications,
Kerala.
Ghazy Mujahid (2000): “Population Ageing in East and South-East
Asia”, 1950-2050, Implications for Elderly Care.
Government of Kerala, Census of India, Trivandram.
Jhingan M.L, Bhatt B.K, Desai J.N (2005): “Demography”, Vrinda
Publications Private Limited, New Delhi, p126.
Chapter IChapter IChapter IChapter IIIIIIIII---- Demographic Transition Theoretical Implications Demographic Transition Theoretical Implications Demographic Transition Theoretical Implications Demographic Transition Theoretical Implications
92
SOCIO ECONOMIC IMPACT OF DEMOGRAPHIC TRANSITION IN KERALA ON ELDERLY WOMEN
Kannan, K.P (2006): “Kerala’s Development Challenges”, in
R.Sathanumoorthy (Ed.), Kerala Economy Achievements and
Challenges, ICFAI University Press, Hyderabad, p 278.
Kannan,K.P. and Vijayakumar. N (2007): “Evolution of Social
Security in the Lap of Public Action Recounting the Experience
of Kerala”, C.D.S, Thiruvananthapuram.
Kerala Development Report (2008): Government of Kerala, p 32.
Rajan, S I (2007): “Population Ageing”, in C.C. Kartha (ed.) ‘Kerala-
Fifty years and beyong’, Goutha Books.
Rajan, S.I.Mishra, U.S and Sharma P.S (1999): “India’s Elderly
Burden of Challenge”, Sage Publications, New Delhi, p 175.
Sinha V.C, Zacharia E (2000): “Elements of Demography”, Allied
Publishers Ltd, New Delhi, p282.
Sreerupa (2006): “Gender Ageing and Widowhood: Health
Vulnerability and Socio-Economic Influences, M.Phil.
Dissertation, submitted to Jawaharlal Nehru University.
World Population Ageing, 1950-2050, Population Division, D.E.S.A.,
UN.
Zachariah K.C, Mathew, E.T, Irudaya Rajan S (2001): “Dynamics of
Migration in Kerala Dimensions, Differentials and
Consequences”, Orient long man Private Limited, Hyderabad.
pp 175-181.
Chapter IChapter IChapter IChapter IIIIIIIII---- Demographic Transition Theoretical Implications Demographic Transition Theoretical Implications Demographic Transition Theoretical Implications Demographic Transition Theoretical Implications
93
SOCIO ECONOMIC IMPACT OF DEMOGRAPHIC TRANSITION IN KERALA ON ELDERLY WOMEN
Zachariah, K.C (2008): “A Century of Developments in Kerala
Demography”, in B.A Prakash and V.R Prabhakaran (Ed.),
Kerala’s Development Issues in the New Millennium, Serials
Publications, New Delhi, pp 44-46.
Zachariah, K.C and S Irudaya Rajan (eds.) (1997): “Kerala's
Demographic Transition: Determinants and Consequences”,
Sage Publications, New Delhi.