Embed Size (px)
Citation preview

Chapter III : MARINE RECREATIONAL FISHERY STATISTICS
TABLE OF CONTENTS
PROGRAM NARRATIVE .......................................................................................................................... III-5 SURVEY METHODOLOGY ...................................................................................................................... III-6
Marine Recreational Information Program (MRIP) ............................................................................... III-6 Dockside Interviews .............................................................................................................................. III-6 Fishing Effort Survey ............................................................................................................................ III-8 Effort Estimates..................................................................................................................................... III-9 Catch Estimates .................................................................................................................................... III-9 Precision of Estimates ........................................................................................................................ III-11
SURVEY LIMITATIONS .......................................................................................................................... III-11 Rare Event and Pulse Species ........................................................................................................... III-11 Anadromous Species .......................................................................................................................... III-12
CONTACTS…… ..................................................................................................................................... III-12 INFOGRAPHIC. ...................................................................................................................................... III-13
LIST OF TABLES Table III.1 North Carolina marine recreational finfish harvest by species. .................................... III-14 Table III.2 North Carolina marine recreational finfish overall harvest and released finfish. .......... III-15 Table III.3 North Carolina marine recreational fishing trip estimates by mode (numbers). ........... III-16 Table III.4 North Carolina Coastal Recreational Fishing Licenses3 issued by residency. ............. III-17 Table III.5 Directed trips for major species in North Carolina by year. .......................................... III-18 Table III.6 Atlantic Bonito recreational catch in North Carolina by year. ....................................... III-24 Table III.7 Atlantic Bonito recreational catch by state, 2019. ......................................................... III-25 Table III.8 Atlantic Croaker recreational catch in North Carolina by year. ..................................... III-26 Table III.9 Atlantic Croaker recreational catch by state, 2019. ...................................................... III-27 Table III.10 Black Drum recreational catch in North Carolina by year. ............................................ III-28 Table III.11 Black Drum recreational catch by state, 2019. ............................................................. III-29 Table III.12 Black Sea Bass recreational catch in North Carolina by year. ..................................... III-30 Table III.13 Black Sea Bass recreational catch by state, 2019. ....................................................... III-31 Table III.14 Bluefish recreational catch in North Carolina by year. .................................................. III-32 Table III.15 Bluefish recreational catch by state, 2019. ................................................................... III-33 Table III.16 Cobia recreational catch in North Carolina by year. ..................................................... III-34 Table III.17 Cobia recreational catch by state, 2019. ...................................................................... III-35 Table III.18 Dolphinfish recreational catch in North Carolina by year. ............................................. III-36 Table III.19 Dolphinfish recreational catch by state, 2019. .............................................................. III-37 Table III.20 Florida Pompano recreational catch in North Carolina by year. ................................... III-38 Table III.21 Florida Pompano recreational catch by state, 2019. .................................................... III-39 Table III.22 Gag Grouper recreational catch in North Carolina by year. ......................................... III-40 Table III.23 Gag Grouper recreational catch by state, 2019. ........................................................... III-41 Table III.24 Greater Amberjack recreational catch in North Carolina by year. ................................ III-42 Table III.25 Greater Amberjack recreational catch by state, 2019. .................................................. III-43 Table III.26 Great Barracuda recreational catch in North Carolina by year. .................................... III-44 Table III.27 Great Barracuda recreational catch by state, 2019. ..................................................... III-45 Table III.28 Gulf Kingfish recreational catch in North Carolina by year. .......................................... III-46 Table III.29 Gulf Kingfish recreational catch by state, 2019. ........................................................... III-47 Table III.30 King Mackerel recreational catch in North Carolina by year. ........................................ III-48 Table III.31 King Mackerel recreational catch by state, 2019. ......................................................... III-49 Table III.32 Northern Kingfish recreational catch in North Carolina by year. ................................... III-50 Table III.33 Northern Kingfish recreational catch by state, 2019. .................................................... III-51 Table III.34 Northern Puffer recreational catch in North Carolina by year. ...................................... III-52 Table III.35 Northern Puffer recreational catch by state, 2019. ....................................................... III-53

III-2
Table III.36 Pigfish recreational catch in North Carolina by year. .................................................... III-54 Table III.37 Pigfish recreational catch by state, 2019. ..................................................................... III-55 Table III.38 Pinfish recreational catch in North Carolina by year. .................................................... III-56 Table III.39 Pinfish recreational catch by state, 2019. ..................................................................... III-57 Table III.40 Red Drum recreational catch in North Carolina by year. .............................................. III-58 Table III.41 Red Drum recreational catch by state, 2019. ............................................................... III-59 Table III.42 Sheepshead recreational catch in North Carolina by year. .......................................... III-60 Table III.43 Sheepshead recreational catch by state, 2019. ............................................................ III-61 Table III.44 Silver Perch recreational catch in North Carolina by year. ........................................... III-62 Table III.45 Silver Perch recreational catch by state, 2019. ............................................................ III-63 Table III.46 Southern Flounder recreational catch in North Carolina by year. ................................. III-64 Table III.47 Southern Flounder recreational catch by state, 2019. .................................................. III-65 Table III.48 Southern Kingfish recreational catch in North Carolina by year. .................................. III-66 Table III.49 Southern Kingfish recreational catch by state, 2019. ................................................... III-67 Table III.50 Spanish Mackerel recreational catch in North Carolina by year. .................................. III-68 Table III.51 Spanish Mackerel recreational catch by state, 2019. ................................................... III-69 Table III.52 Spot recreational catch in North Carolina by year. ....................................................... III-70 Table III.53 Spot recreational catch by state, 2019. ........................................................................ III-71 Table III.54 Spotted Seatrout recreational catch in North Carolina by year. ................................... III-72 Table III.55 Spotted Seatrout recreational catch by state, 2019. ..................................................... III-73 Table III.56 Striped Bass10 recreational catch in North Carolina by year. ....................................... III-74 Table III.57 Striped Bass10 recreational catch by state, 2019. ......................................................... III-75 Table III.58 Summer Flounder recreational catch in North Carolina by year. .................................. III-76 Table III.59 Summer Flounder recreational catch by state, 2019. ................................................... III-77 Table III.60 Wahoo recreational catch in North Carolina by year. ................................................... III-78 Table III.61 Wahoo recreational catch by state, 2019. .................................................................... III-79 Table III.62 Weakfish recreational catch in North Carolina by year. ................................................ III-80 Table III.63 Weakfish recreational catch by state, 2019. ................................................................. III-81 Table III.64 White Grunt recreational catch in North Carolina by year. ........................................... III-82 Table III.65 White Grunt recreational catch by state, 2019. ............................................................. III-83 Table III.66 Yellowfin Tuna recreational catch in North Carolina by year. ....................................... III-84 Table III.67 Yellowfin Tuna recreational catch by state, 2019. ........................................................ III-85 Table III.68 Large coastal shark recreational catch in North Carolina by year. ............................... III-86 Table III.69 Large coastal shark recreational catch by state, 2019. ................................................ III-87 Table III.70 Small coastal shark recreational catch in North Carolina by year. ............................... III-88 Table III.71 Small coastal shark recreational catch by state, 2019. ................................................. III-89 Table III.72 Pelagic shark recreational catch in North Carolina by year. ......................................... III-90 Table III.73 Pelagic shark recreational catch by state, 2019. .......................................................... III-91 Table III.74 Dogfish shark family recreational catch in North Carolina by year. .............................. III-92 Table III.75 Dogfish shark family recreational catch by state, 2019. ............................................... III-93 Table III.76 Reported North Carolina highly migratory species landings (numbers). ...................... III-94 Table III.77 Reported North Carolina recreational Atlantic Bluefin Tuna landings14 (numbers). ..... III-94 Table III.78 Atlantic Coast saltwater fishing trips by state and mode, 2019. ................................... III-95 Table III.79 Marine recreational fishing trips in North Carolina by mode. ........................................ III-96

III-3
LIST OF FIGURES
Figure III.1 Atlantic Bonito recreational catch in North Carolina by year. ............................................ III-24 Figure III.2 Atlantic Bonito recreational catch by state, 2019. .............................................................. III-25 Figure III.3 Atlantic Croaker recreational catch in North Carolina by year. .......................................... III-26 Figure III.4 Atlantic Croaker recreational catch by state, 2019. ........................................................... III-27 Figure III.5 Black Drum recreational catch in North Carolina by year. ................................................. III-28 Figure III.6 Black Drum recreational catch by state, 2019. .................................................................. III-29 Figure III.7 Black Sea Bass recreational catch in North Carolina by year. .......................................... III-30 Figure III.8 Black Sea Bass recreational catch by state, 2019. ............................................................ III-31 Figure III.9 Bluefish recreational catch in North Carolina by year. ....................................................... III-32 Figure III.10 Bluefish recreational catch by state, 2019. ........................................................................ III-33 Figure III.11 Cobia recreational catch in North Carolina by year. .......................................................... III-34 Figure III.12 Cobia recreational catch by state, 2019. ........................................................................... III-35 Figure III.13 Dolphinfish recreational catch in North Carolina by year. .................................................. III-36 Figure III.14 Dolphinfish recreational catch by state, 2019. ................................................................... III-37 Figure III.15 Florida Pompano recreational catch in North Carolina by year. ........................................ III-38 Figure III.16 Florida Pompano recreational catch by state, 2019. ......................................................... III-39 Figure III.17 Gag Grouper recreational catch in North Carolina by year. .............................................. III-40 Figure III.18 Gag Grouper recreational catch by state, 2019. ................................................................ III-41 Figure III.19 Greater Amberjack recreational catch in North Carolina by year. ..................................... III-42 Figure III.20 Greater Amberjack recreational catch by state, 2019. ....................................................... III-43 Figure III.21 Great Barracuda recreational catch in North Carolina by year. ......................................... III-44 Figure III.22 Great Barracuda recreational catch by state, 2019. .......................................................... III-45 Figure III.23 Gulf Kingfish recreational catch in North Carolina by year. ............................................... III-46 Figure III.24 Gulf Kingfish recreational catch by state, 2019. ................................................................ III-47 Figure III.25 King Mackerel recreational catch in North Carolina by year. ............................................. III-48 Figure III.26 King Mackerel recreational catch by state, 2019. .............................................................. III-49 Figure III.27 Northern Kingfish recreational catch in North Carolina by year. ........................................ III-50 Figure III.28 Northern Kingfish recreational catch by state, 2019. ......................................................... III-51 Figure III.29 Northern Puffer recreational catch in North Carolina by year. ........................................... III-52 Figure III.30 Northern Puffer recreational catch by state, 2019. ............................................................ III-53 Figure III.31 Pigfish recreational catch in North Carolina by year. ......................................................... III-54 Figure III.32 Pigfish recreational catch by state, 2019. .......................................................................... III-55 Figure III.33 Pinfish recreational catch in North Carolina by year. ......................................................... III-56 Figure III.34 Pinfish recreational catch by state, 2019. .......................................................................... III-57 Figure III.35 Red Drum recreational catch in North Carolina by year. ................................................... III-58 Figure III.36 Red Drum recreational catch by state, 2019. .................................................................... III-59 Figure III.37 Sheepshead recreational catch in North Carolina by year. ............................................... III-60 Figure III.38 Sheepshead recreational catch by state, 2019. ................................................................. III-61 Figure III.39 Silver Perch recreational catch in North Carolina by year. ................................................ III-62 Figure III.40 Silver Perch recreational catch by state, 2019. ................................................................. III-63 Figure III.41 Southern Flounder recreational catch in North Carolina by year. ...................................... III-64 Figure III.42 Southern Flounder recreational catch by state, 2019. ....................................................... III-65 Figure III.43 Southern Kingfish recreational catch in North Carolina by year. ....................................... III-66 Figure III.44 Southern Kingfish recreational catch by state, 2019. ........................................................ III-67 Figure III.45 Spanish Mackerel recreational catch in North Carolina by year. ....................................... III-68 Figure III.46 Spanish Mackerel recreational catch by state, 2019. ........................................................ III-69 Figure III.47 Spot recreational catch in North Carolina by year. ............................................................ III-70 Figure III.48 Spot recreational catch by state, 2019. ............................................................................. III-71 Figure III.49 Spotted Seatrout recreational catch in North Carolina by year. ........................................ III-72 Figure III.50 Spotted Seatrout recreational catch by state, 2019. .......................................................... III-73 Figure III.51 Striped Bass recreational catch in North Carolina from the Atlantic Ocean by year. ........ III-74 Figure III.52 Striped Bass recreational catch from the Atlantic Ocean by state, 2019. .......................... III-75 Figure III.53 Summer Flounder recreational catch in North Carolina by year. ....................................... III-76

III-4
Figure III.54 Summer Flounder recreational catch by state, 2019. ........................................................ III-77 Figure III.55 Wahoo recreational catch in North Carolina by year. ........................................................ III-78 Figure III.56 Wahoo recreational catch by state, 2019. ......................................................................... III-79 Figure III.57 Weakfish recreational catch in North Carolina by year. ..................................................... III-80 Figure III.58 Weakfish recreational catch by state, 2019. ...................................................................... III-81 Figure III.59 White Grunt recreational catch in North Carolina by year. ................................................ III-82 Figure III.60 White Grunt recreational catch by state, 2019. .................................................................. III-83 Figure III.61 Yellowfin Tuna recreational catch in North Carolina by year. ............................................ III-84 Figure III.62 Yellowfin Tuna recreational catch by state, 2019. ............................................................. III-85 Figure III.63 Large coastal shark recreational catch in North Carolina by year. .................................... III-86 Figure III.64 Large coastal shark recreational catch by state, 2019. ..................................................... III-87 Figure III.65 Small coastal shark recreational catch in North Carolina by year. .................................... III-88 Figure III.66 Small coastal shark recreational catch by state, 2019. ...................................................... III-89 Figure III.67 Pelagic shark recreational catch in North Carolina by year. .............................................. III-90 Figure III.68 Pelagic shark recreational catch by state, 2019. ............................................................... III-91 Figure III.69 Dogfish shark family recreational catch in North Carolina by year. ................................... III-92 Figure III.70 Dogfish shark family recreational catch by state, 2019. .................................................... III-93 Figure III.71 Atlantic Coast saltwater fishing trips by state and mode, 2019. ........................................ III-95 Figure III.72 Marine recreational fishing trips in North Carolina by mode. ............................................. III-96
LIST OF APPENDICES Appendix III.1 NCDMF highly migratory species reporting stations……………………………….. ............ III-97 Appendix III.2 North Carolina APAIS Intercept Form. ............................................................................... III-98 Appendix III.3 North Carolina Fishing Effort Survey. .............................................................................. III-100 Appendix III.4 Glossary of terminology in MRIP survey. ......................................................................... III-102 Appendix III.5 Data elements in MRIP survey. ....................................................................................... III-106

III-5
PROGRAM NARRATIVE
Information on commercial fisheries has long been collected by the National Oceanic and
Atmospheric Administration (NOAA) Fisheries, formerly the National Marine Fisheries Service
(NMFS). However, data on marine recreational fisheries were not collected in a systematic manner
by NOAA Fisheries on a continuing basis until 1979. The purpose of the NOAA Fisheries Marine
Recreational Information Program (MRIP) is to establish a reliable database for estimating the
impact of marine recreational fishing on marine resources.
Effective fisheries management requires information on the number and size distributions of each
species caught in every state, sub-region, or finer sub-unit. The North Carolina Fisheries Reform
Act of 1997 mandated the development of fishery management plans (FMPs) for fisheries of
importance to North Carolina. The estimates of finfish harvest and angler participation provided by
the MRIP play a key role in the FMP development process. The MRIP helps meet the goals of the
Magnuson-Stevens Fishery Conservation and Management Act (MSFCMA). The MSFCMA
mandates a national program for management of fishery resources in the ocean zone known as
the Exclusive Economic Zone (EEZ), or the area between 3 to 200 miles from shore. MSFCMA
also requires that fishery management plans consider both recreational and commercial fisheries
as well as their harvests.
Due to the MRIP survey’s inability to provide reliable catch statistics for fisheries management of
some species at the state level due to low sample size, the North Carolina Division of Marine
Fisheries (NCDMF) increased the annual number of anglers interviewed by approximately six
times (1,400 to 8,000) beginning in 1987. A target sample size of 15,000 angler intercepts was
later established to further improve precision of catch estimates, which improved dramatically. The
NCDMF also implemented quality control measures needed to improve estimates of catch.
The NCDMF receives approximately 700 data requests for information from MRIP each year. This
chapter is designed to help understand how the data are collected and what types of data are
available within this program. This summary should also allow individuals to more precisely choose
the information that is most applicable to their specific needs.

III-6
SURVEY METHODOLOGY
Marine Recreational Information Program (MRIP)
MRIP is a national program that uses several surveys to obtain catch and effort data for marine
finfish at the regional level. MRIP evolved from the Marine Recreational Fisheries Statistics Survey
(MRFSS) and included improvements in survey and estimation methodologies to remove sources
of bias. Prior to 2018, MRIP consisted of two complementary surveys: 1) the Coastal Household
Telephone Survey (CHTS), a random-digit-dialing landline telephone survey within the coastal
zones of each state to determine the number of fishing households and the numbers of fishing trips
taken and 2) the Access Point Angler Intercept Survey (APAIS) for obtaining catch rates and
species composition from anglers fishing in shore-based, charter boat, and private boat fishing
modes. The data from the two surveys were combined to provide estimates of the total number of
fish caught, released, and harvested; weight of the harvest; total number of trips; and the number
of people participating in marine recreational fishing. The National Research Council (NRC)
identified under-coverage, inefficiency and bias issues within the MRFSS survey and estimation
methodologies (NRC 2006). These deficiencies spurred the development of MRIP as an
alternative data collection program to MRFSS.
The APAIS component of MRIP was improved in 2013 to sample throughout the day (24-hour
coverage) and remove any potential bias by controlling the movement of field staff to alternative
sampling sites. Before this improvement, samplers were allowed to move from their assigned site
to more active fishing locations but could not statistically account for this movement when
calculating estimates. MRIP also implemented the Fishing Effort Survey (FES) in 2018 to address
the NRC concerns of under-coverage of the angling public, declining number of households using
landline telephones, reduced response rates, and memory recall issues of the CHTS.
Now, MRIP consists of two complementary surveys: 1) a mail survey of households (FES) in
coastal counties to obtain trip information and 2) an intercept survey of anglers (APAIS) at shore
side access sites to obtain catch rates and species composition. The data from the two surveys
are combined to provide estimates of the total number of fish caught, released, and harvested; the
weight of the harvest; the total number of trips; and the number of people participating in marine
recreational fishing. For-hire fishing effort is captured through telephone interviews of for-hire
captains. All states on the Atlantic and Gulf coasts participate in the FES and APAIS with the
exception of Texas and Louisiana.
Dockside Interviews
The intercept survey gathers catch and demographic data from marine recreational anglers who
have just completed fishing in one of five fishing modes (the type of place or platform from which
marine recreational fishing occurred):
• Charter boat
• Private/rental boat
• Beach/bank
• Man-made structure

III-7
• Headboat
The intercept survey in North Carolina continuously samples angler catches throughout the year.
Intercept sampling is separated by mode and wave (two-month time period).
A complete statewide list of access sites for marine recreational fishing is continuously updated
(https://www.st.nmfs.noaa.gov/msd/html/siteRegister.jsp). Sites are chosen for interviewing by
randomly selecting from access sites that are weighted by estimates of expected fishing activity.
The sites are weighted to ensure that each angler trip has a representative probability of being
included in the sample. Sampling is distributed among weekdays, weekends, and holidays.
Anglers are intercepted, screened, and interviewed at assigned access sites upon completion of
their fishing trips. Data are recorded on standard APAIS coding forms (Appendix 2). A small
number of interviews (less than five percent) are conducted with beach/bank shore mode anglers
who have not completed their trip. At heavy use sites, every attempt is made to intercept and
interview all anglers. If that is not possible, angler counts are obtained to augment interviews. In
2005, NCDMF began routine sampling of headboats to obtain length data from discards.
Each intercept interview consists of:
• an introduction to the survey,
• an oral interview concerning the fishing trip just completed,
• thorough examination of the respondent's catch (visually inspect for correct species
identification), and
• measurement of lengths and weights from all of the fish in the respondent's catch (or if
necessary, a random sample).
Interview procedures vary slightly among fishing modes:
• Private/rental/charter boat anglers are interviewed at boat ramps, marina slips, and hoists
while they are leaving their boats or dockside while they are cleaning their boats.
• Anglers fishing from natural shorelines can be widely distributed along beaches and banks
with multiple access points. Samplers often have to move from angler to angler within the
defined boundaries of the site to obtain interviews.
• Man-made structures commonly have a single exit point where samplers can easily
intercept departing anglers.
• Headboat sampling is conducted onboard the vessel at sea.
Interviewing procedures have been developed to allow separate recording of information on:
• catch unavailable for identification (Type B catch),
• available catch that cannot be easily subdivided among anglers,
• catch obtained during multiple-day boat trips, and
• at-sea discards from headboats.
Fish that are available for identification, enumeration, weighing, and measuring by the interviewers
are called landings or Type A catch. Fish not brought ashore in whole form but used as bait,

III-8
filleted, discarded dead, or are otherwise unavailable for inspection are called Type B1 catch.
Finally, fish released alive are called Type B2 catch. Type A and Type B1 together comprise
harvest, while all three types (A, B1, and B2) represent total catch.
Species such as flounder and kingfish are morphologically ambiguous and cannot be reliably
identified to the species level by the angler. As such, discards are identified to the nearest
taxonomic category and estimates of released catch are produced at the genus level. Because
there are no sources of information with an appropriate timeline or area resolution that can be used
to partition the released estimates of ambiguous congener species into their constituent species,
Type A catch is used to delineate between them. For example, a ratio of Southern Flounder,
Summer Flounder, and Gulf Flounder to total flounder observed is determined from the Type A
catch at the estimation level (i.e., state, year, wave, area). These proportions of southern, summer,
and Gulf Flounder are applied to the estimates of left-eyed flounder released (unobserved Type
B2) catch to produce estimates of discards for each of the specific flounder species. An identical
approach is applied to kingfish (e.g., gulf, southern, northern) as well as Spotted Seatrout and
Weakfish.
For the Type B catch (fish not available for the interviewer’s examination), information is only
recorded for individual anglers. Beginning in 2005, headboat anglers were sampled at sea,
allowing accurate identification of Type B catch for the first time. For the Type A catch (fish
available for inspection), grouped catch is allowed, except when in beach/bank mode. This is a
concession to the fact that multiple anglers often will keep all their catch in a single container, and
at the end of the trip they are not sure who caught which fish.
Fishing Effort Survey
The FES mail survey employs a dual-frame design with two non-overlapping frames: 1) state
residents sampled from the United States Postal Service computerized delivery sequence file
(CDS) and 2) non-residents sampled from state-specific lists of licensed saltwater anglers. Non-
residents are defined as individuals who were licensed to fish in one of the target states but lived in
a different state. Sampling from the CDS uses a stratified design in which households with licensed
anglers are identified prior to data collection. The address frame for each state is stratified into
coastal and non-coastal strata defined by geographic proximity to the coast. For each wave and
stratum, a simple random sample of addresses are selected from the CDS and matched to
addresses of anglers who are licensed to fish within their state of residence. Non-resident anglers
were sampled directly from state license databases. The sample frame for
each of the targeted states consisted of unique household addresses that were not in the targeted
state but had at least one person with a license to fish in the targeted state during the wave.
The FES mail survey (Appendix 3) collects fishing effort data for all household residents, including
the number of saltwater fishing trips by fishing mode (shore and private boat). The FES is a self-
administered mail survey, administered for six, two-month reference waves annually. The initial
survey mailing is sent one week prior to the end of the reference wave so that materials are
received right at the end of that wave. This initial mailing is delivered by regular, first class mail
and includes a cover letter stating the purpose of the survey, a survey questionnaire, a postage-

III-9
paid return envelope, and a $2 cash incentive. One week after the initial mailing, a follow-up,
thank you and reminder postcard is mailed via regular first-class mail to all sampled addresses.
For addresses that could be matched to a landline telephone number, an automated voice
message is also delivered as a reminder to complete and return the questionnaire. Three weeks
after the initial survey mailing, a final mailing is delivered to all addresses that have not yet
responded to the survey.
Effort Estimates
In the MRIP, fishing effort is defined as the estimated number of fishing trips taken by individual
anglers. The number of individual fishing trips is estimated for each state, coastal county, mode,
and bimonthly wave. Total effort represents residents who are coastal, non-coastal, and out-of-
state. Data from the mail survey of households are used to calculate the mean number of trips per
household in each fishing mode during each wave.
The FES estimates fishing effort by residents of sampled states in number of angler-trips. The
basic approach uses a Horvitz-Thompson total estimator with sample weights that reflect sample
inclusion probabilities, a nonresponse adjustment, and a post-stratification adjustment to known
population totals. A final adjustment that accounts for non-resident (i.e. out of frame) fishing activity
is applied to estimate total effort by fishing mode. This adjustment is derived from the APAIS.
After the final effort estimates are generated, they are stratified into primary fishing areas to
produce effort estimates by state, mode, wave, and area. An area is defined by the distance
offshore where the fishing took place. The areas are inland, ocean <= 3 miles, and ocean > 3
miles, although this can vary from state to state (see Appendix III.4 for complete definitions and
discussion). Within each state, wave, and mode, trips are allocated to a primary fishing area in
proportion to the number of interviewed anglers in that state, wave, and mode who made trips in
that area. The intent is to produce effort estimates at a level that is suitable for multiplication with
catch per angler trip estimates from the intercept survey.
Catch Estimates
The catch of each finfish species is estimated for each sub-region, state, fishing mode, primary
fishing area, and wave. The total number of fish caught in a particular fishing mode and area of
fishing is estimated from:
• the estimated number of fishing trips taken in that state, wave, mode, and area; and
• the mean number of fish caught per trip taken in that state, wave, mode, and area.
All fish that are caught by intercepted anglers are not available for the interviewer's inspection. The
intercept interview and the estimation procedures distinguish between those fish brought ashore in
whole form, and those not brought ashore in whole form:
• Fish that are available for identification, enumeration, weighing and measuring by the
interviewers are called landings or Type A catch.
• Fish not brought ashore in whole form but used as bait, filleted, or discarded dead are
called Type B1 catch (Type A and Type B1 together comprise harvest).

III-10
• Fish released alive are called Type B2 catch.
Catch per trip estimates and expanded catch estimates are made for these three types of catch.
Total Catch is the sum of Type A catch, Type B1 catch, and Type B2 catch. The purpose is to
distinguish between those species identified and measured by trained interviewers, and those
species reported to the interviewers by anglers. Anglers occasionally misidentify species;
therefore, their reported measurements are subject to several types of bias.
As noted above, only individual interviews are allowed for Type B catch, while for Type A catch
some amount of clustering is allowed and accounted for in the estimation. Self-weighting
estimators of catch per trip were used, meaning that the site selection methodology (giving sites
with more anglers a higher probability of being sampled) ensures all angler trips have an equal
probability of being included in the sample.
Lengths and weights are obtained by sampling the fish caught and brought ashore in whole form
by intercepted anglers. Therefore, estimated weights can only be calculated directly for Type A
catch fish. Since the size composition of the remainder of the total catch (Type B1 catch and Type
B2 catch) is unknown and may differ from that of the fish represented in Type A catch, estimating
the weight of the remainder of the catch is not possible without assumptions.
In estimating the weight of harvested fish (Type A and B1 catch), we assume that the mean weight
of the Type B1 catch is equal to that of the Type A catch for each sub-region, state, mode, primary
area, wave, and species.
Most of the trips sampled in the intercept survey are completed trips with anglers being interviewed
only at the end of the fishing trip. Some incomplete trips are sampled in the shore mode which are
converted into complete trips by multiplying the recorded catch per hour by the anticipated total trip
length. Once catch per trip estimates have been produced for each sub-region, state, wave, mode,
area, species, and catch type, they can be multiplied by the appropriate effort estimate to produce
estimates of total catch. For estimates of total harvest weight, these total catch estimates are in
turn multiplied by the average weight per measured fish in the appropriate mode and area.
Catch estimates are obtained using information from both the dockside interviews and
mail/telephone surveys using the following formula:
(Angler Trips) * (Average Catch Per Angler Trip) = Total Catch
where trips equal the total number of finfish trips by mode and area, average catch per trip is the
mean catch by species, mode, and area, and total catch is the total of each species by mode and
area.
Catch estimates calibrated using the FES are presented for the last 20 years. However, data back
to 1981 were also calibrated and are available upon request (see Contacts on page III-13).

III-11
Precision of Estimates
The numbers and pounds presented are estimates, not actual counts; therefore, the level of
precision varies. Precision refers to the estimate’s variability. Statistical comparison between
numbers must include this variability.
Precision refers to the dispersion of the sample measurements used to calculate an estimate and
the resultant variability in the estimate. The square root of the estimate of sampling variance is an
estimate of the standard error of the estimate and is almost universally used in sample surveys as
a measure of precision.
The standard error is necessary for calculating confidence intervals around an estimate. The width
of a confidence interval is a function of the probability level selected and is determined from the
Student's t-distribution or the normal distribution. Using the normal distribution, the most commonly
used confidence interval (a 95% confidence interval) is given by:
estimate +/- 1.96 X (estimate of standard error).
Confidence intervals provide another indication of the precision of the estimated total catch. At the
same confidence level, a broad interval relative to the estimate indicates a less precise estimate
than does a narrow interval. The 95 percent confidence interval indicates a 95% certainty that the
actual total catch is between the upper and lower confidence limits.
The standard error is also used to calculate the proportional standard error (PSE). The PSE
expresses the standard error as a percentage of the estimate (standard error/estimate). It provides
an alternative measure of precision and is useful in comparing the relative precision of two
estimates.
A small PSE indicates a more precise estimate than does a large PSE. A PSE of 20% or less is
generally considered acceptable in fisheries data. An alternative way of expressing a 95%
confidence interval, in terms of percentages, would be:
estimate +/- (1.96 X PSE) percent.
SURVEY LIMITATIONS
Rare Event and Pulse Species
Species that seldom occur in recreational catches are referred to as rare event species. They
include such species as Tripletail, Tarpon, Swordfish, Gulf Flounder, etc. Pulse fisheries target
species such as Cobia that are highly migratory and only occur seasonally in North Carolina
waters, as well as species such as Red Snapper which have a very limited recreational season.
For both rare event and pulse fishery species, samplers are unable to intercept enough anglers
with these species in their catch to produce precise estimates of catch.

III-12
Anadromous Species
The MRIP is only conducted in saltwater and brackish water areas, along with tidal portions of
sounds, bays, and rivers. Freshwater areas are not included in the survey. Alternative methods for
assessing recreational catch of freshwater resident species and anadromous species such as
American Shad, Hickory Shad, and Striped Bass must be considered. See chapter IV.
CONTACTS
The MRIP is administered by the NOAA Fisheries Office of Science & Technology, Fisheries
Statistics Division. Several states, including North Carolina, manage the dockside sampling
portion of the survey. Catch and effort estimates by year and species are available back to 1981.
For additional information regarding the survey or to request data not presented in this report,
please contact:
North Carolina Division of Marine Fisheries
Chris Wilson, Coastal Angling Program Manager
943 Washington Square Mall
Washington NC, 27889
800-338-7804
North Carolina Division of Marine Fisheries
Andrew Cathey, Coastal Angling Program Biologist
943 Washington Square Mall
Washington NC, 27889
800-338-7804
North Carolina Division of Marine Fisheries
Roz Camp, MRIP APAIS State Coordinator
943 Washington Square Mall
Washington NC, 27889
800-338-7804
In North Carolina, this project is supported, in part, by the U.S. Fish and Wildlife Service through the Sport Fish Restoration Program, Grant F-31. For additional information, contact Section Chief License and Statistics Section, P.O. Box 769, Morehead City, NC 28557,
(252) 726-7021.

III-13
INFOGRAPHIC

III-14
Table III.1 North Carolina marine recreational finfish harvest by species.
Number Harvested Pounds Harvested
Species 2019 2018 2019 2018
Amberjack 4,236 11,742 81,769 227,441
Barracudas 1,661 5,848 15,529 52,304
Bluefish 2,752,589 3,304,587 3,011,480 2,630,685
Bonito, Atlantic 35,874 12,576 122,931 42,879
Cobia 10,090 25,331 254,963 685,962
Croaker, Atlantic 651,268 472,917 224,337 164,644
Dolphinfish 458,086 495,435 3,147,384 3,318,532
Drum, Black 156,401 134,624 404,452 428,273
Drum, Red 97,186 299,577 436,219 1,452,358
Flounder, Southern 163,045 217,805 387,203 495,289
Flounder, Summer 34,895 57,913 52,872 92,032
Groupers 10,245 1,160 104,455 8,816
Grunts 89,057 11,913 91,273 16,762
Jacks 14,269 44,467 54,844 130,220
Kingfishes 3,370,636 1,731,340 881,104 479,739
Mackerel, King 184,962 102,675 1,446,939 1,018,459
Mackerel, Spanish 1,478,890 1,012,889 1,694,247 1,156,702
Perch, Silver 32,444 6,595 7,520 1,594
Pigfish 432,005 418,174 146,570 163,686
Pinfish 955,550 886,712 217,718 188,046
Pompano 1,734,862 318,702 769,603 245,670
Porgies 8,975 4,045 9,311 7,592
Puffers 2,501,094 330,237 1,016,972 148,220
Sea Basses 151,999 86,153 220,377 116,825
Seatrout, Spotted 1,937,250 449,473 3,334,163 658,555
Sharks 15,660 4,123 110,510 169,486
Sharks, Dogfishes 8,962 7,514 50,477 43,732
Sheepshead 221,419 343,772 590,150 735,738
Snappers 33,055 20,475 50,678 29,407
Spot 2,822,884 2,068,865 851,998 597,511
Striped Bass1 25 26 366
Tuna, Bluefin2 9 35 23,922 11,918
Tuna, Yellowfin 44864 61,171 1,190,484 1,977,741
Wahoo 17,098 10,690 454,391 280,644
Weakfish 39,061 30,935 43,252 29,924
1 Striped Bass landings reflect Atlantic Ocean catches only. 2 Landings for Atlantic Bluefin Tuna reflect the Highly Migratory Species fishing year (January 1 through December 31).
NOTE: The number and pounds of finfish listed represent estimated harvest; finfish released alive are not included. Recreational finfish catches from headboats are not included in this table. The National Marine Fisheries Service collected headboat data separately in 2017.
III-15
Table III.2 North Carolina marine recreational finfish overall harvest and released finfish.
Year Number Harvested Pounds Harvested Number Released
2019 22,991,602 23,819,357 58,780,769
2018 16,167,035 20,064,976 62,467,785
2017 24,992,736 27,434,020 73,343,486
2016 29,612,819 28,782,892 79,311,111
2015 32,029,176 29,382,094 76,359,197
2014 35,266,582 26,160,399 79,350,225
2013 37,097,386 28,539,154 71,387,944
2012 24,849,139 24,382,691 59,475,261
2011 28,913,465 31,138,553 61,538,383
2010 28,339,722 28,827,120 66,210,770
2009 28,373,054 32,386,251 58,585,443
2008 24,399,920 24,230,177 51,181,826
2007 32,030,305 36,948,737 49,000,158
2006 32,644,303 35,932,215 54,354,928
2005 31,216,078 37,847,540 40,759,376
2004 29,896,721 39,832,941 40,866,383
2003 33,999,152 31,081,963 37,896,160
2002 33,091,963 31,317,369 40,029,463
2001 29,434,712 35,002,246 41,169,692
2000 22,583,867 29,606,819 37,480,759
1999 18,797,344 24,025,603 30,867,860
1998 21,495,066 20,632,560 27,618,324
1997 17,611,273 25,667,654 24,463,398
1996 17,648,228 21,388,190 21,126,385
1995 20,285,155 21,318,710 21,402,764
1994 27,207,985 22,721,036 26,574,243
1993 19,959,266 18,892,022 18,868,785
1992 22,047,490 20,659,018 23,975,805
1991 25,513,630 23,226,188 21,896,152
1990 30,547,188 28,083,671 17,794,105
1989 31,860,381 29,324,818 14,661,067
1988 32,122,713 10,851,835 18,927,988
1987 27,869,954 32,592,416 12,701,702
1986 32,471,202 36,719,837 13,379,969
1985 43,539,768 31,751,840 12,912,223
1984 29,159,941 31,647,052 10,715,507
1983 33,420,274 36,416,585 8,248,603
1982 24,255,664 17,222,968 7,843,562

III-16
Table III.3 North Carolina marine recreational fishing trip estimates by mode (numbers).
Year Beach/Bank Charter Boat Manmade Private Boat Total
2019 6,711,048 160,692 6,021,580 4,646,520 17,539,840
2018 6,879,419 148,004 5,317,495 4,279,389 16,624,306
2017 7,745,619 149,438 9,512,489 5,044,731 22,452,276
2016 10,187,550 140,575 5,970,329 4,860,391 21,158,845
2015 6,699,488 114,043 8,516,390 4,992,920 20,322,840
2014 7,919,735 96,432 6,014,374 4,895,957 18,926,498
2013 6,028,869 111,366 7,097,673 4,847,955 18,085,862
2012 7,156,627 159,160 6,184,923 5,054,638 18,555,348
2011 8,086,490 129,380 6,040,312 5,212,669 19,468,850
2010 7,877,619 138,577 7,174,395 4,982,732 20,173,323
2009 7,751,222 129,412 6,642,257 4,822,295 19,345,187
2008 8,489,916 170,428 6,067,854 4,599,900 19,328,098
2007 6,183,367 185,618 7,105,305 4,671,856 18,146,146
2006 7,199,224 201,368 7,671,720 4,542,632 19,614,943
2005 5,206,759 214,826 7,369,215 4,359,576 17,150,375
2004 6,695,734 183,039 6,245,702 4,276,395 17,400,870
2003 5,353,909 131,566 6,243,796 3,746,771 15,476,042
2002 5,501,125 142,644 5,913,968 3,539,123 15,096,859
2001 5,479,658 160,791 6,105,185 3,363,853 15,109,488
2000 5,687,088 164,116 6,088,224 3,388,516 15,327,944
1999 4,215,059 200,350 5,113,589 3,153,794 12,682,792
1998 3,677,092 189,664 4,435,131 2,806,930 11,108,817
1997 3,618,411 242,043 4,552,528 2,742,087 11,155,069
1996 3,851,521 204,608 3,895,335 2,471,857 10,423,321
1995 3,643,176 167,321 3,958,161 2,222,995 9,991,653
1994 3,874,950 177,061 4,246,772 2,231,472 10,530,255
1993 4,404,924 117,536 4,105,818 2,233,903 10,862,180
1992 4,403,691 87,352 5,097,113 2,277,847 11,866,004
1991 4,497,351 81,065 4,406,694 2,240,961 11,226,071
1990 5,338,764 83,234 4,526,403 2,164,387 12,112,788
1989 4,485,729 94,199 3,955,450 2,137,255 10,672,633
1988 4,444,539 65,320 3,960,772 2,009,639 10,480,270
1987 4,566,175 89,642 2,510,303 1,867,135 9,033,255
1986 4,260,280 101,447 2,733,767 2,076,308 9,171,802
1985 3,569,600 226,397 3,323,582 1,753,973 8,873,553
1984 3,335,089 226,710 4,027,935 1,798,108 9,387,842
1983 4,057,922 248,825 4,219,017 1,746,350 10,272,113
1982 2,789,810 97,074 2,253,604 1,721,703 6,862,191

III-17
Table III.4 North Carolina Coastal Recreational Fishing Licenses3 issued by residency.
Year In-State Out-of-State Total
2019 301,847 156,759 458,606
2018 277,698 151,232 428,930
2017 305,422 164,149 469,571
2016 306,718 160,986 467,704
2015 314,557 166,287 480,844
2014 319,069 167,218 486,287
2013 316,514 163,486 480,000
2012 304,840 155,457 460,297
2011 287,914 151,332 439,246
2010 294,163 159,356 453,519
2009 281,471 153,617 435,088
2008 267,062 144,819 411,881
2007 314,569 154,952 469,521
3All lifetime inland state fishing licenses sold prior to 2007 were grandfathered into the new CRFL requirement on January 01, 2007. Lifetime CRFLs are not included in this table.

III-18
Table III.5 Directed trips for major species in North Carolina by year.
Atlantic Bonito Atlantic Croaker Black Drum Black Sea Bass Bluefish
Year Trips PSE Trips PSE Trips PSE Trips PSE Trips PSE
2019 25,061 38.1 1,213,097 8.0 584,856 13.2 596,924 9.3 2,699,198 9.7
2018 18,257 28.0 1,093,754 8.8 773,315 14.3 481,773 10.6 3,031,288 10.4
2017 30,543 59.9 1,569,130 8.5 978,376 18.0 1,001,694 9.3 3,392,266 13.3
2016 15,679 33.8 1,542,439 9.6 927,876 17.1 928,834 12.1 3,194,322 8.8
2015 19,542 52.9 2,219,202 8.5 895,352 25.3 781,023 9.4 3,126,972 10.3
2014 28,278 31.9 1,924,556 7.6 564,678 18.0 815,832 8.3 2,871,661 6.5
2013 15,718 52.4 1,731,001 6.7 624,438 11.3 641,876 7.8 2,769,469 6.3
2012 14,514 27.3 1,250,115 5.6 573,675 9.3 888,824 5.1 2,355,827 4.5
2011 31,149 31.9 1,674,758 6.7 776,683 10.4 663,994 7.5 3,264,390 5.1
2010 9,984 33.2 1,470,467 7.6 535,406 10.4 478,332 7.5 3,027,076 4.7
2009 2,205 58.4 1,572,087 7.9 493,868 13.9 542,005 15.3 2,760,641 6.9
2008 13,758 47.0 1,157,184 8.7 742,385 11.0 331,107 12.0 3,026,633 6.4
2007 20,837 30.5 1,180,041 9.3 675,686 15.6 425,856 9.0 2,931,252 6.5
2006 5,845 40.5 1,789,975 10.4 348,977 14.3 552,372 9.3 2,470,361 7.1
2005 18,319 31.8 1,042,080 11.6 516,299 21.6 575,805 11.7 2,458,978 7.5
2004 31,923 42.0 1,120,097 13.5 392,042 15.9 392,504 10.1 2,112,219 6.7
2003 22,592 31.7 845,302 7.1 616,688 14.9 275,489 10.3 1,682,375 6.3
2002 18,446 55.8 724,894 10.9 456,367 12.9 301,959 12.3 2,087,495 5.6
2001 12,664 43.7 846,118 9.8 295,179 16.6 309,948 8.4 2,301,022 6.2
2000 6,665 40.7 1,055,737 7.5 240,526 13.2 340,630 10.5 2,001,714 7.1
1999 8,070 38.4 889,129 7.6 331,070 10.6 337,942 10.6 1,474,837 6.7
1998 15,700 42.1 751,538 7.0 126,968 13.3 326,235 10.4 1,277,127 5.7
1997 30,651 37.2 713,407 7.0 114,109 13.6 265,191 9.0 1,555,442 5.2
1996 4,685 35.8 816,678 6.2 316,253 13.9 173,616 9.9 1,161,814 5.1
1995 9,535 29.0 870,643 6.2 324,720 12.8 241,714 10.0 1,173,475 5.4
1994 17,210 33.2 1,112,262 6.3 91,207 24.7 364,233 9.2 1,519,347 5.0
1993 16,241 54.7 842,458 8.3 70,018 21.0 217,874 10.9 2,027,758 5.8
1992 10,521 28.3 992,747 9.7 54,890 41.5 226,789 13.0 2,346,495 8.5
1991 13,448 29.1 801,289 10.2 27,941 30.8 263,291 18.1 2,284,363 6.6
1990 11,975 29.2 929,210 12.0 12,504 45.5 252,632 14.7 3,481,179 8.2
1989 16,780 29.6 1,193,791 8.8 1,498 61.7 323,702 17.3 3,213,455 7.7
1988 39,833 72.5 897,527 23.5 16,764 36.0 280,766 18.5 1,786,336 11.6
1987 4,739 36.0 584,488 17.3 62,899 39.2 268,246 32.9 2,321,227 9.6
1986 368 100.0 472,694 15.4 48,258 48.0 124,027 23.9 2,121,061 18.4
1985 1,555 100.0 719,467 14.5 46,425 59.6 376,187 18.5 2,573,654 10.6
1984 6,557 100.0 1,137,932 24.0 - - 252,290 30.5 3,480,359 12.9
1983 - - 704,418 19.2 - - 454,617 31.5 3,508,131 17.0
1982 11,272 41.0 432,806 17.3 16,880 68.2 234,874 41.0 1,628,351 12.1
NOTE: Directed trips are defined as trips that either targeted or caught one of the listed species.
III-19
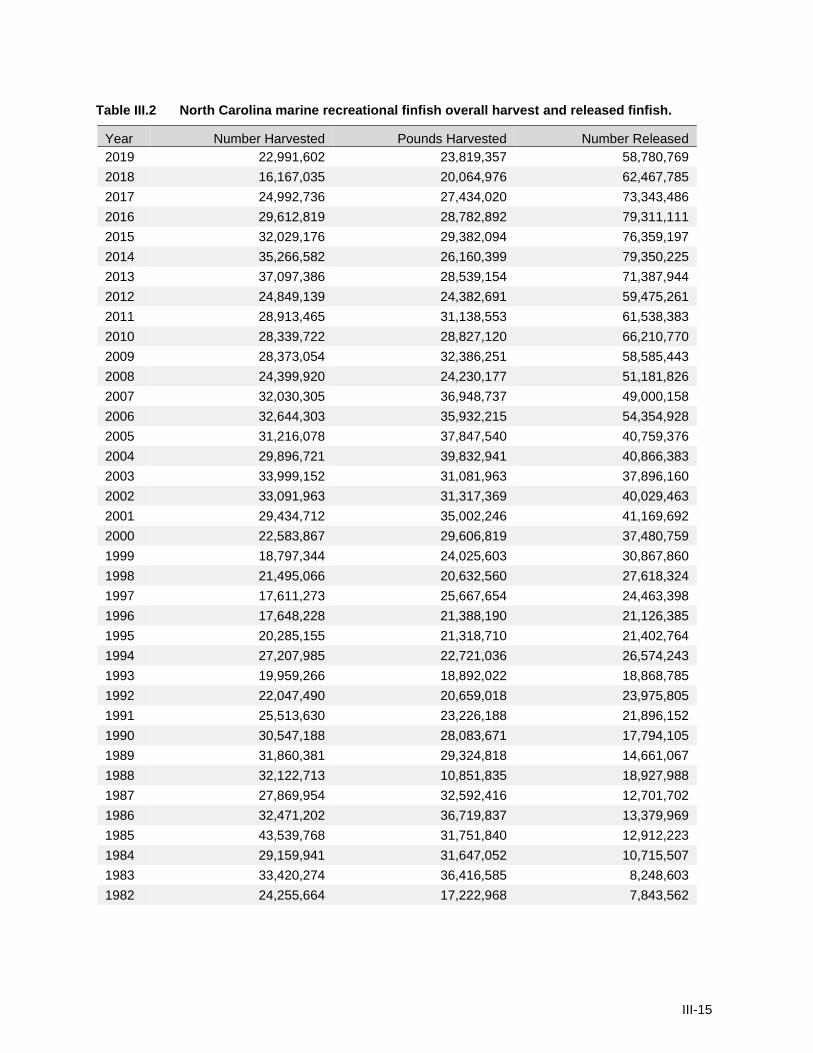
Table III.5 Directed trips for major species in North Carolina by year (continued).
Cobia Dogfish Sharks Dolphin Florida Pompano Flounder
Year Trips PSE Trips PSE Trips PSE Trips PSE Trips PSE
2019 187,494 20.5 175,593 43.8 173,192 13.5 688,384 17.8 1,830,553 8.0
2018 294,837 16.9 82,102 33.7 245,040 13.3 631,684 15.1 1,710,890 7.3
2017 302,607 18.6 64,930 32.6 197,686 15.0 713,133 17.9 2,107,301 6.9
2016 349,360 15.3 150,573 29.4 282,195 14.4 637,011 18.0 2,420,326 6.2
2015 326,752 15.8 178,189 39.6 313,062 13.8 782,738 17.6 2,536,854 7.3
2014 244,098 16.4 235,315 28.5 172,691 20.2 670,968 15.1 2,685,072 6.1
2013 204,560 18.0 257,897 36.9 191,701 16.6 1,011,337 12.9 2,623,195 5.7
2012 154,376 12.2 84,192 22.2 222,284 10.7 799,938 8.7 2,552,146 3.8
2011 148,917 15.4 225,852 18.3 235,775 13.1 941,780 10.5 2,519,959 4.5
2010 187,077 11.0 149,586 16.5 221,856 21.0 661,895 10.0 2,900,583 4.0
2009 164,221 18.0 59,569 39.7 350,015 13.6 571,454 11.5 2,577,363 5.9
2008 61,094 21.5 273,811 47.6 172,004 11.1 475,820 13.0 2,405,131 5.3
2007 118,012 16.8 105,601 29.9 290,229 10.9 443,393 14.6 2,221,405 6.1
2006 193,578 17.6 79,737 28.6 235,063 12.6 507,279 25.5 2,379,590 7.9
2005 124,143 18.0 159,265 56.1 272,904 12.2 489,171 19.1 1,911,063 7.4
2004 97,748 16.8 320,230 16.8 198,813 13.3 646,943 17.1 2,078,666 5.3
2003 99,879 15.9 44,501 38.1 140,721 11.8 480,255 17.4 1,729,028 5.3
2002 106,282 19.1 63,077 29.6 156,100 9.9 314,426 20.6 1,958,411 5.3
2001 74,602 19.6 97,601 22.5 123,279 10.1 348,006 17.3 1,861,792 4.8
2000 62,698 20.5 50,092 24.2 177,393 11.4 416,598 19.5 2,121,537 5.3
1999 49,309 23.2 29,834 35.8 122,660 10.4 196,917 14.0 1,158,885 5.6
1998 41,978 16.6 29,574 39.1 77,099 9.0 190,193 13.0 1,428,756 5.1
1997 77,757 15.8 20,978 26.2 137,464 8.4 171,752 11.8 1,426,854 4.7
1996 54,930 15.4 32,907 22.1 97,631 11.8 187,919 14.6 1,126,979 4.9
1995 100,572 18.0 50,972 23.3 135,226 7.7 227,195 13.7 1,230,301 5.1
1994 80,223 14.9 51,154 17.2 158,189 12.0 213,126 11.7 1,834,545 4.6
1993 45,510 21.6 39,754 24.4 126,273 12.1 408,236 13.3 1,745,979 5.4
1992 65,703 18.7 181,964 23.8 66,367 10.3 219,503 21.8 1,598,735 6.3
1991 80,530 19.7 153,145 20.1 103,066 12.4 348,669 12.7 1,604,122 6.6
1990 65,450 31.1 273,474 23.9 59,901 12.1 652,897 22.7 1,531,247 9.6
1989 51,379 31.1 137,176 22.9 89,052 14.9 364,538 24.9 1,033,473 10.0
1988 18,513 28.7 200,154 30.7 54,797 55.5 111,867 28.0 1,361,005 18.1
1987 42,484 26.7 246,125 43.6 50,311 21.7 343,262 30.2 1,090,007 16.0
1986 133,472 32.2 176,010 47.7 39,528 9.3 287,193 11.7 1,204,201 13.8
1985 104,499 48.7 145,998 31.1 43,556 51.9 349,226 28.4 1,799,421 13.7
1984 51,144 64.3 238,585 31.7 12,954 57.8 288,244 30.8 1,807,897 15.6
1983 9,464 100.0 57,410 37.0 20,697 47.1 145,619 67.8 1,678,640 15.1
1982 24,803 61.8 28,559 38.3 18,613 71.7 130,581 23.0 1,412,465 11.3
NOTE: Directed trips are defined as trips that either targeted or caught one of the listed species.

III-20
Table III.5 Directed trips for major species in North Carolina by year (continued).
Great Barracuda Greater
Amberjack Groupers Grunts Jacks
Year Trips PSE Trips PSE Trips PSE Trips PSE Trips PSE
2019 25,651 38.0 10,645 31.4 16,055 29.9 27,931 29.2 82,919 25.3
2018 21,941 32.2 18,103 36.4 6,475 28.1 20,808 41.2 74,771 21.9
2017 16,193 35.4 16,026 21.6 20,781 28.5 33,219 30.4 120,189 39.1
2016 10,188 35.2 35,587 27.9 37,721 29.1 47,810 44.4 217,866 18.4
2015 15,801 40.1 32,110 26.9 54,148 18.9 36,039 30.3 204,853 26.7
2014 5,961 39.4 11,311 34.8 37,348 28.0 16,808 37.7 118,156 27.9
2013 7,505 48.7 23,982 32.3 30,365 17.3 20,830 22.2 104,820 19.1
2012 7,125 24.9 18,101 21.2 64,985 19.4 29,517 19.6 137,269 21.6
2011 7,640 31.9 9,951 25.5 29,448 23.0 28,930 24.5 130,946 17.5
2010 10,976 23.4 24,796 41.4 44,583 17.2 24,308 24.6 55,491 26.8
2009 15,559 32.3 36,383 24.1 66,797 19.5 43,402 26.2 46,004 32.0
2008 21,258 27.7 34,312 27.5 70,685 16.1 23,929 25.2 156,608 35.5
2007 6,884 40.9 5,271 72.4 83,941 23.8 33,788 19.5 37,127 22.9
2006 6,711 34.8 10,889 50.1 40,651 21.2 32,203 27.1 22,983 33.7
2005 18,925 31.7 8,613 50.0 37,640 21.8 35,511 23.5 49,323 23.3
2004 10,565 40.7 7,860 34.8 33,386 23.2 30,995 25.0 14,489 31.1
2003 8,236 27.1 10,342 29.2 12,093 32.3 22,700 27.9 41,348 46.7
2002 12,916 21.2 11,290 24.1 12,477 37.3 15,726 26.3 41,353 24.1
2001 10,676 23.2 7,780 26.2 13,175 27.4 11,484 22.9 27,930 47.1
2000 3,586 37.9 11,144 40.8 10,723 46.6 12,243 46.3 29,057 55.1
1999 5,780 38.4 3,876 41.8 8,209 33.1 8,805 28.3 22,995 31.2
1998 7,301 28.9 6,087 33.0 13,725 33.8 13,161 31.5 15,315 33.6
1997 6,321 31.1 7,077 31.0 8,818 35.4 11,874 28.7 63,352 25.3
1996 11,842 31.3 15,233 20.3 14,768 35.8 16,037 28.2 14,258 37.8
1995 13,122 26.8 8,333 24.5 25,804 19.2 23,491 21.2 23,208 24.0
1994 10,705 21.0 15,226 28.3 49,759 21.6 70,363 14.8 13,088 24.3
1993 12,933 29.6 11,018 23.5 33,570 21.7 45,317 19.6 68,709 26.7
1992 7,817 28.6 8,064 25.4 18,182 23.3 31,180 18.5 36,892 40.7
1991 6,118 29.5 56,414 48.9 38,871 31.4 31,333 22.0 36,436 23.1
1990 12,276 36.2 12,660 27.4 60,090 32.3 49,428 43.9 78,219 54.8
1989 6,856 37.1 16,320 30.7 34,056 22.3 30,682 21.4 65,613 49.6
1988 14,908 68.1 7,635 30.3 19,914 21.5 22,183 19.8 73,835 80.4
1987 3,441 39.3 16,159 38.8 12,655 38.2 14,085 26.1 55,371 34.7
1986 268 54.1 24,415 38.8 1,651 81.6 350 100.0 231,679 27.6
1985 - - 9,069 35.7 21,132 37.1 2,392 67.4 51,813 39.9
1984 8,197 100.0 3,073 100.0 25,412 40.6 67,464 30.0 64,734 55.1
1983 1,878 0.0 4,161 15.8 8,984 100.0 41,734 100.0 15,449 43.0
1982 - - 412 100.0 12,343 64.7 521 100.0 23,770 49.7
NOTE: Directed trips are defined as trips that either targeted or caught one of the listed species.
III-21
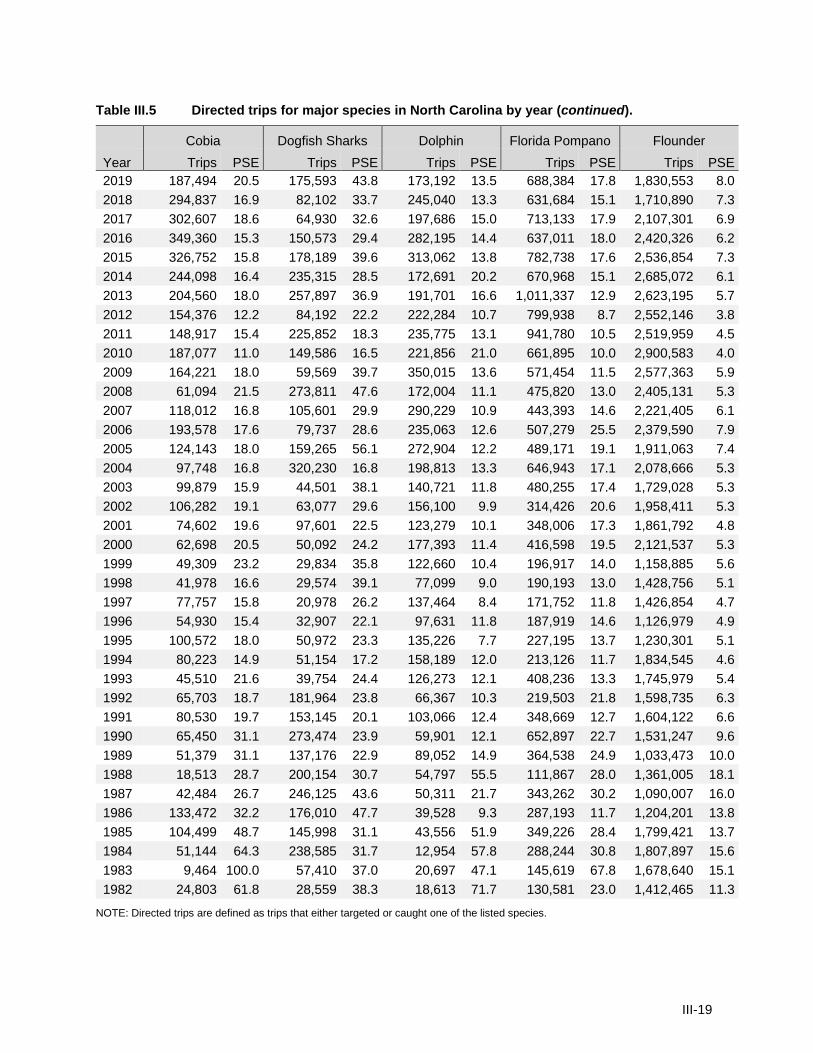
Table III.5 Directed trips for major species in North Carolina by year (continued).
King Mackerel Kingfish Pigfish Porgies Puffers
Year Trips PSE Trips PSE Trips PSE Trips PSE Trips PSE
2019 384.858 12.1 2,208,088 10.5 461,144 12.4 15,841 37.4 1,280,586 13.2
2018 417,690 14.9 1,660,341 12.1 492,024 10.9 5,225 42.8 490,330 28.4
2017 409,587 12.7 2,361,137 10.7 676,968 15.3 40,115 39.5 812,904 11.8
2016 271,754 14.3 2,741,476 12.0 848,240 10.8 37,693 55.1 1,427,536 14.8
2015 390,806 11.3 2,842,692 12.1 985,857 9.8 34,494 37.6 1,770,078 19.5
2014 375,929 13.0 2,538,697 9.8 902,261 10.3 16,996 48.9 395,524 16.8
2013 320,144 12.7 2,910,094 6.0 719,546 10.9 15,630 25.5 576,049 11.3
2012 325,194 10.4 2,443,663 5.1 743,921 6.4 25,548 20.3 1,261,061 7.0
2011 259,299 12.8 2,005,965 6.2 864,320 8.4 10,658 34.5 872,144 10.3
2010 287,082 9.7 2,614,698 5.8 728,441 7.5 11,989 30.4 839,916 13.2
2009 501,252 10.4 2,421,670 7.5 626,307 11.7 23,759 28.8 360,375 14.6
2008 340,646 10.7 1,742,848 8.5 700,737 16.2 26,882 26.9 562,782 15.8
2007 475,140 9.2 1,791,749 8.1 591,424 14.4 21,491 23.2 317,421 35.4
2006 386,012 12.5 1,605,005 9.4 443,494 15.0 11,129 37.0 287,797 23.7
2005 464,675 8.7 1,260,798 11.0 632,464 23.4 27,794 24.9 339,008 26.2
2004 395,324 10.9 1,513,388 9.6 738,709 12.5 112,539 38.3 413,765 13.3
2003 283,193 8.3 1,044,531 8.6 834,218 10.5 11,038 31.3 507,955 18.2
2002 353,673 12.5 843,478 10.9 596,590 12.1 8,557 28.3 538,354 14.9
2001 317,006 9.4 1,046,464 8.5 557,787 10.6 11,777 26.2 543,238 9.9
2000 296,502 11.7 1,310,049 9.1 651,759 9.8 29,190 45.1 513,484 10.3
1999 190,705 11.5 719,508 8.5 651,697 9.6 7,823 38.1 418,583 12.0
1998 195,413 14.7 653,069 8.5 645,435 8.6 12,108 32.7 178,079 13.2
1997 256,783 8.4 622,487 7.1 730,699 7.4 19,903 23.2 298,694 12.1
1996 223,974 10.2 699,179 8.4 738,252 7.4 12,181 30.9 384,447 12.6
1995 356,003 7.8 783,545 7.2 588,935 8.2 22,499 19.7 225,761 12.4
1994 385,404 8.7 1,027,407 7.9 591,972 8.7 70,481 19.9 375,140 10.0
1993 362,612 8.5 871,255 10.0 494,231 9.8 33,920 21.3 439,314 14.3
1992 355,767 8.0 987,809 16.3 581,256 12.5 30,629 19.0 1,053,038 14.2
1991 413,152 7.6 1,073,637 11.2 444,929 14.3 44,751 18.0 353,515 13.8
1990 418,747 11.9 1,008,142 13.8 487,082 20.1 58,652 37.0 498,454 19.1
1989 394,667 11.6 558,414 14.8 666,410 12.6 38,329 26.0 500,525 16.5
1988 248,979 14.8 1,109,114 17.3 659,073 15.6 32,995 20.0 422,304 23.5
1987 371,986 14.2 688,396 18.4 643,854 23.7 20,878 23.0 227,546 40.4
1986 333,622 31.1 721,770 40.5 297,118 24.3 9,137 61.8 403,119 43.9
1985 377,973 24.5 419,946 17.3 460,697 20.2 22,099 67.7 140,717 35.9
1984 231,800 23.7 542,411 20.8 581,449 30.8 78,651 28.2 118,171 50.4
1983 291,067 24.3 476,653 25.8 589,457 23.5 138,433 53.2 88,165 40.9
1982 202,767 15.9 563,925 19.4 363,663 43.2 66,862 62.0 237,109 56.5
NOTE: Directed trips are defined as trips that either targeted or caught one of the listed species.

III-22
Table III.5 Directed trips for major species in North Carolina by year (continued).
Red Drum Sheepshead Snappers Spanish Mackerel Spot
Year Trips PSE Trips PSE Trips PSE Trips PSE Trips PSE
2019 2,687,752 9.9 311,630 14.3 23,442 30.9 1,320,690 11.1 1,062,156 10.1
2018 3,478,377 13.8 350,785 14.2 6,474 36.4 1,072,569 10 948,789 10.1
2017 3,675,064 12.6 486,805 16.0 39,089 39.1 1,065,266 13.6 1,333,257 12.6
2016 3,693,885 11.9 266,617 17.9 29,989 58.1 984,307 10.2 892,716 11.0
2015 2,762,521 18.2 321,035 14.6 21,563 45.0 915,635 8.2 1,788,190 10.7
2014 2,995,433 9.0 255,414 17.0 15,585 43.3 1,073,559 8.5 2,125,494 8.6
2013 2,542,714 6.4 371,139 10.5 6,860 31.8 781,315 7.8 2,385,900 7.1
2012 2,557,094 4.9 405,546 8.8 22,615 22.7 832,918 6.3 1,636,385 5.9
2011 1,089,325 6.7 308,075 12.5 9,117 33.6 875,873 8.4 2,343,254 7.3
2010 1,755,179 7.0 285,820 12.9 9,729 24.8 858,946 8.0 1,978,044 7.0
2009 1,702,448 15.6 317,796 13.7 21,756 28.7 953,259 10.7 2,334,320 7.6
2008 1,491,162 14.2 281,738 13.7 22,634 31.7 721,131 7.7 1,860,288 8.5
2007 1,053,326 8.7 340,505 19.9 13,744 27.5 583,273 9.2 1,920,093 10.6
2006 916,020 8.9 215,691 23.6 5,630 41.2 592,208 11.1 3,190,948 11.5
2005 706,486 8.7 147,013 19.2 18,910 28.6 562,428 11.9 2,504,785 12.4
2004 522,126 9.6 160,973 25.8 18,795 29.7 693,660 16.7 2,308,073 8.3
2003 476,674 9.2 210,037 11.8 6,257 44.5 557,305 11.4 2,096,846 8.6
2002 902,697 8.4 174,010 13.1 9,934 34.3 652,877 11.1 1,575,172 10.9
2001 536,851 8.9 169,511 13.7 10,556 33.4 573,249 12.4 1,873,118 9.9
2000 711,051 7.6 243,234 15.2 4,230 37.7 668,735 12.5 1,565,541 8.4
1999 662,625 7.7 176,898 12.7 7,356 34.1 490,881 10.7 1,418,188 8.2
1998 521,028 8.4 122,528 15.9 3,772 53.5 361,670 10.9 1,551,639 8.5
1997 314,360 8.4 112,257 16.6 14,520 27.5 553,133 7.9 1,155,445 6.7
1996 364,726 9.9 66,671 15.2 15,439 34.8 398,041 8.6 1,621,884 6.6
1995 674,269 7.3 112,359 12.7 23,673 19.7 390,306 7.8 1,428,803 6.3
1994 621,918 8.2 126,838 14.4 31,616 22.0 569,538 7.3 1,912,005 6.7
1993 906,950 7.8 164,875 17.7 17,726 25.8 624,360 8.6 1,687,428 7.4
1992 716,307 12.8 139,232 21.6 17,846 19.8 750,273 8.9 1,766,448 10.8
1991 661,450 12.2 102,231 14.7 17,883 22.9 718,947 6.3 2,128,269 8.3
1990 538,581 19.1 94,796 19.0 27,746 46.2 702,445 10.9 1,856,343 10.3
1989 915,055 13.7 104,468 21.6 27,194 33.5 784,182 14.5 1,709,410 8.9
1988 409,391 35.0 66,494 23.2 15,648 24.6 301,053 10.6 1,582,830 16.8
1987 681,645 23.9 53,816 36.4 14,843 34.4 360,764 13.0 1,250,216 13.6
1986 216,931 18.0 46,832 38.3 4,272 84.9 601,408 33.2 1,207,328 12.2
1985 398,397 28.1 13,672 76.6 29,306 78.1 151,263 28.2 2,320,914 14.2
1984 513,880 23.2 52,395 42.4 41,603 20.8 153,734 37.0 1,851,069 15.5
1983 775,248 18.4 8,770 75.9 53,003 85.8 39,648 81.4 1,893,659 12.0
1982 181,019 34.3 42,268 40.5 - - 146,127 26.6 1,393,111 11.8
NOTE: Directed trips are defined as trips that either targeted or caught one of the listed species.

III-23
Table III.5 Directed trips for major species in North Carolina by year (continued).
Spotted Seatrout Striped Bass1 Wahoo Weakfish Yellowfin Tuna
Year Trips PSE Trips PSE Trips PSE Trips PSE Trips PSE
2019 2,867,512 6.5 28,365 25.7 43,329 19.4 112,100 18.0 48,751 23.3
2018 1,606,853 10.9 28,388 41.7 47,725 20.3 97,928 23.7 54,138 27.0
2017 2,851,053 11.9 32,116 35.9 74,721 19.3 147,138 16.8 89,469 17.0
2016 2,322,627 7.5 158,610 45.7 83,613 22.6 275,045 15.6 120,076 20.1
2015 2,537,677 7.1 4,586 93.9 99,224 24.3 449,929 21.8 40,563 25.3
2014 2,154,879 8.1 134,105 81.0 70,998 26.2 226,756 15.2 42,991 22.2
2013 2,233,881 6.6 50,006 40.7 47,999 24.2 164,120 13.5 45,804 26.7
2012 2,365,291 5.2 126,230 28.3 62,680 15.0 198,691 12.1 52,846 20.0
2011 1,689,106 5.7 228,198 18.6 51,715 21.4 122,784 14.5 45,558 28.5
2010 1,716,486 7.3 180,151 19.9 43,944 18.0 231,359 12.9 38,146 27.3
2009 1,873,557 8.5 316,463 21.9 51,309 24.0 187,203 15.7 63,104 48.7
2008 1,444,238 11.2 604,391 19.9 50,932 18.2 151,787 15.6 32,264 23.0
2007 1,116,323 8.8 736,232 18.2 56,232 19.9 211,544 13.9 155,576 15.5
2006 1,077,306 9.1 846,769 24.6 64,976 25.9 385,571 14.9 163,653 15.3
2005 967,636 13.3 540,379 17.7 58,120 25.8 297,007 12.0 154,860 17.3
2004 537,440 8.8 884,229 12.5 40,833 20.2 368,146 12.6 138,284 17.4
2003 400,109 12.0 185,658 13.6 35,915 27.1 246,707 12.3 105,434 13.0
2002 548,358 17.2 351,816 13.5 53,204 18.2 249,751 13.4 115,054 26.6
2001 374,519 11.4 328,790 11.5 32,951 19.2 387,690 15.5 106,870 10.8
2000 534,790 13.5 320,439 12.7 55,387 20.5 290,012 12.5 97,501 10.2
1999 615,015 9.9 201,568 10.5 36,787 17.0 323,706 10.4 100,951 8.1
1998 461,677 10.0 418,479 8.1 19,552 12.2 325,912 13.2 57,984 7.4
1997 545,032 10.4 401,702 8.6 46,756 15.4 284,957 9.6 105,601 12.8
1996 530,593 10.7 287,069 10.3 41,899 15.9 215,012 10.3 123,884 14.3
1995 760,843 7.8 135,019 13.6 46,288 11.3 199,328 11.1 67,313 10.2
1994 728,875 9.6 100,767 14.4 35,247 13.5 297,732 10.6 76,311 10.4
1993 676,541 10.5 41,223 30.1 22,211 16.9 247,237 14.2 44,841 9.7
1992 874,396 11.0 18,165 46.4 21,221 18.5 156,607 18.1 36,731 16.0
1991 838,924 9.6 74,635 40.4 16,358 17.5 193,545 20.1 38,878 22.8
1990 638,272 10.1 - - 17,041 18.7 118,139 18.2 14,489 19.7
1989 979,095 14.0 - - 20,862 18.9 214,618 17.0 64,830 22.0
1988 489,668 16.4 1,265 100.0 5,366 22.7 238,449 27.0 38,024 41.3
1987 1,078,367 18.8 - - 14,075 26.9 417,768 31.1 48,460 26.4
1986 709,774 11.3 - - 35,658 26.5 538,707 30.1 82,895 21.9
1985 728,712 20.4 - - 6,322 97.2 207,516 29.5 24,825 53.8
1984 584,669 24.6 284 0.0 1,637 100.0 321,962 21.3 1,011 100.0
1983 512,877 24.7 - - 11,083 64.2 172,911 34.6 11,435 45.0
1982 444,128 23.6 - - 577 100.0 87,418 33.4 - -
1 Atlantic Ocean Striped Bass only.
NOTE: Directed trips are defined as trips that either targeted or caught one of the listed species.

III-24
Table III.6 Atlantic Bonito recreational catch in North Carolina by year.
Year Harvest Number
PSE (num)
Harvest Pounds
PSE (lb)
Mean Length
(inches)
Mean Weight
(lb) Released
Number PSE
(release)
2019 35,874 66.6 122,931 48.6 17.1 3.4 24,033 66.1
2018 12,576 42.5 42,879 49.7 18.1 3.4 11,745 66.4
2017 1,999 45.6 9,578 53.0 18.8 4.8 40,094 75.6
2016 3,411 64.7 22,127 60.3 21.5 6.5 10,196 45.2
2015 16,973 44.8 102,408 42.8 21.6 6.0 1,325 60.8
2014 18,380 49.3 91,228 53.6 20.1 5.0 59,925 62.7
2013 19,182 59.9 99,252 55.4 20.4 5.2 4,609 41.3
2012 6,913 37.1 95,947 49.3 27.1 13.9 7,858 35.6
2011 21,235 73.1 287,458 66.4 27.1 13.5 28,618 42.1
2010 447 42.4 8,019 47.1 30.2 17.9 16,583 41.6
2009 1,379 71.8 13,799 85.4 24.4 10.0 2,561 92.2
2008 5,230 56.8 39,093 61.8 22.2 7.5 23,411 61.1
2007 7,685 48.1 34,693 46.3 20.4 4.5 4,523 41.8
2006 1,037 102.4 4,457 102.4 21.0 4.3 2,755 51.4
2005 2,102 76.6 9,388 73.8 21.5 4.5 42,363 98.6
2004 10,273 56.6 48,251 57.3 21.6 4.7 19,082 39.3
2003 2,275 58.8 6,685 51.2 16.6 2.9 12,968 50.9
2002 28,728 64.0 97,115 66.1 19.3 3.4 30,165 65.7
2001 7,722 48.2 23,602 50.7 17.4 3.1 5,001 56.1
2000 13,617 93.4 69,579 89.9 22.2 5.1 9,257 58.4
Figure III.1 Atlantic Bonito recreational catch in North Carolina by year.
0
50
100
150
200
250
300
350
0
10
20
30
40
50
60
70
Ha
rve
st (th
ou
san
ds o
f pou
nd
s)
Nu
mb
er
(th
ou
san
ds)
Year
Harvest Number
Released Number
Harvest Pounds
III-25
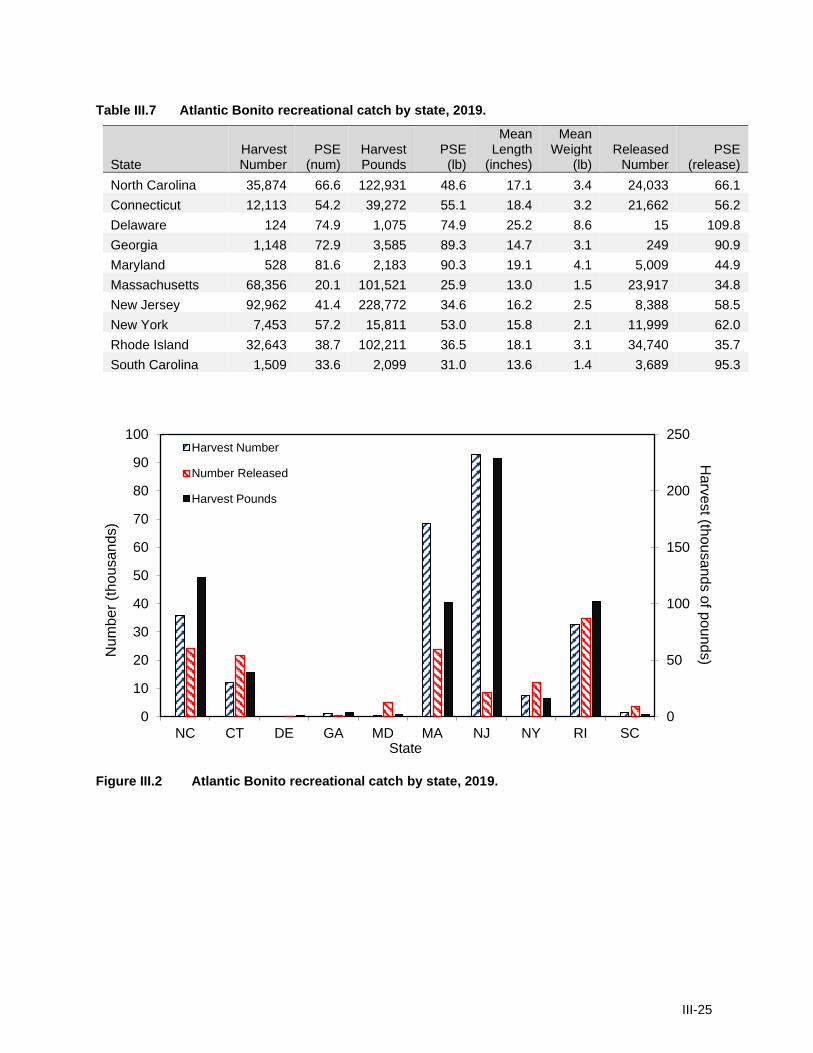
Table III.7 Atlantic Bonito recreational catch by state, 2019.
State Harvest Number
PSE (num)
Harvest Pounds
PSE (lb)
Mean Length
(inches)
Mean Weight
(lb) Released
Number
PSE
(release)
North Carolina 35,874 66.6 122,931 48.6 17.1 3.4 24,033 66.1
Connecticut 12,113 54.2 39,272 55.1 18.4 3.2 21,662 56.2
Delaware 124 74.9 1,075 74.9 25.2 8.6 15 109.8
Georgia 1,148 72.9 3,585 89.3 14.7 3.1 249 90.9
Maryland 528 81.6 2,183 90.3 19.1 4.1 5,009 44.9
Massachusetts 68,356 20.1 101,521 25.9 13.0 1.5 23,917 34.8
New Jersey 92,962 41.4 228,772 34.6 16.2 2.5 8,388 58.5
New York 7,453 57.2 15,811 53.0 15.8 2.1 11,999 62.0
Rhode Island 32,643 38.7 102,211 36.5 18.1 3.1 34,740 35.7
South Carolina 1,509 33.6 2,099 31.0 13.6 1.4 3,689 95.3
Figure III.2 Atlantic Bonito recreational catch by state, 2019.
0
50
100
150
200
250
0
10
20
30
40
50
60
70
80
90
100
NC CT DE GA MD MA NJ NY RI SC
Ha
rve
st (th
ou
san
ds o
f pou
nd
s)N
um
be
r (t
hou
san
ds)
State
Harvest Number
Number Released
Harvest Pounds

III-26
Table III.8 Atlantic Croaker recreational catch in North Carolina by year.
Year Harvest Number
PSE (num)
Harvest Pounds
PSE (lb)
Mean Length
(inches)
Mean Weight
(lb) Released
Number PSE
(release)
2019 651,268 20.7 224,337 22.8 9.0 0.3 3,634,211 11.5
2018 472,917 16.0 164,644 16.1 8.9 0.3 4,311,368 13.2
2017 666,930 16.7 237,160 16.9 9.0 0.4 4,631,445 13.0
2016 1,109,570 16.2 443,728 16.8 9.3 0.4 7,254,382 14.9
2015 1,437,019 14.7 557,735 16.3 9.2 0.4 9,632,560 11.1
2014 1,935,961 21.6 758,751 16.9 9.1 0.4 10,347,332 13.8
2013 1,300,804 15.7 453,881 15.8 9.1 0.3 6,729,556 10.5
2012 848,495 12.1 307,338 12.6 9.2 0.4 3,878,710 8.7
2011 873,659 15.2 360,390 15.6 9.6 0.4 7,005,152 13.6
2010 1,280,446 16.0 638,817 15.7 9.8 0.5 4,571,287 9.8
2009 958,128 16.1 359,703 16.2 8.9 0.4 5,623,278 11.1
2008 678,638 14.8 275,052 15.4 9.5 0.4 3,274,873 11.6
2007 1,058,663 20.7 336,486 21.5 8.4 0.3 3,933,603 12.4
2006 1,376,403 23.9 498,741 23.3 8.8 0.4 6,381,434 11.9
2005 672,437 22.4 323,380 22.0 9.6 0.5 3,038,472 12.4
2004 1,218,206 26.1 683,113 24.1 10.1 0.6 3,407,280 14.0
2003 1,127,298 18.8 708,487 23.2 10.4 0.6 2,765,303 12.5
2002 1,265,031 18.8 651,611 17.3 9.7 0.5 2,218,039 23.8
2001 1,285,029 15.7 647,119 15.1 10.0 0.5 2,387,491 11.8
2000 860,246 14.5 394,037 14.8 9.6 0.5 3,475,554 12.5
Figure III.3 Atlantic Croaker recreational catch in North Carolina by year.
0
100
200
300
400
500
600
700
800
0
2,000
4,000
6,000
8,000
10,000
12,000
Ha
rve
st (th
ou
san
ds o
f pou
nd
s)
Nu
mb
er
(th
ou
san
ds)
Year
Harvest Number
Released Number
Harvest Pounds

III-27
Table III.9 Atlantic Croaker recreational catch by state, 2019.
State Harvest Number
PSE (num)
Harvest Pounds
PSE (lb)
Mean Length
(inches)
Mean Weight
(lb) Released
Number
PSE
(release)
North Carolina 651,268 20.7 224,337 22.8 9.0 0.3 3,634,211 11.5
Delaware 53,048 19.2 23,973 25.2 9.8 0.5 101,526 26.0
Florida 801,751 59.0 358,941 57.7 10.1 0.4 2,259,705 41.2
Georgia 332,073 33.9 97,791 32.1 8.5 0.3 1,893,287 17.4
Maryland 69,771 74.7 38,895 71.9 10.7 0.6 1,243,785 26.4
New Jersey 3,031 105.7 973 105.7 9.0 0.3 33,333 59.2
South Carolina 595,044 24.1 133,776 21.6 7.6 0.2 3,778,170 27.2
Virginia 3,055,510 16.0 995,491 16.2 9.0 0.3 6,642,685 18.9
Figure III.4 Atlantic Croaker recreational catch by state, 2019.
0
200
400
600
800
1,000
1,200
0
1,000
2,000
3,000
4,000
5,000
6,000
7,000
NC DE FL GA MD NJ SC VA
Ha
rve
st (th
ou
san
ds o
f pou
nd
s)
Nu
mb
er
(th
ou
san
ds)
State
Harvest Number
Number Released
Harvest Pounds

III-28
Table III.10 Black Drum recreational catch in North Carolina by year.
Year Harvest Number
PSE (num)
Harvest Pounds
PSE (lb)
Mean Length
(inches)
Mean Weight
(lb) Released
Number PSE
(release)
2019 165.401 19.9 404,452 20.1 15.7 2.6 756,749 16.6
2018 134,624 27.2 428,273 28.3 16.5 3.2 1,450,855 21.6
2017 355,544 47.8 856,081 46.9 16.1 2.4 2,336,352 22.1
2016 276,126 20.1 780,876 18.6 16.9 2.8 1,791,758 21.9
2015 109,307 38.5 230,834 32.9 15.0 2.1 1,964,749 27.2
2014 1,511,995 17.6 2,709,269 25.8 12.9 1.8 497,334 27.7
2013 556,482 20.9 879,401 20.4 12.7 1.6 397,155 18.7
2012 1,259,216 20.9 823,423 18.3 10.0 0.7 711,755 23.1
2011 650,010 24.8 812,699 23.6 11.3 1.3 427,577 27.4
2010 449,901 26.5 421,788 21.2 10.6 0.9 411,358 28.3
2009 925,963 22.7 1,232,589 27.9 12.4 1.3 548,931 25.2
2008 876,178 24.9 697,822 19.7 10.7 0.8 832,132 25.6
2007 276,257 22.5 431,212 25.6 13.4 1.6 265,369 29.0
2006 465,076 29.4 509,328 30.8 10.5 1.1 376,363 25.6
2005 296,531 21.1 566,484 20.5 13.5 1.9 255,753 44.2
2004 1,265,995 42.6 1,926,671 32.3 11.1 1.5 481,742 21.2
2003 846,855 18.5 1,791,703 20.2 14.1 2.1 215,810 34.5
2002 400,983 29.5 446,202 24.8 11.2 1.1 325,234 32.2
2001 293,983 30.1 685,687 35.6 15.2 2.3 112,470 28.2
2000 374,245 16.7 561,678 18.4 12.9 1.5 267,723 25.4
Figure III.5 Black Drum recreational catch in North Carolina by year.
0
500
1,000
1,500
2,000
2,500
3,000
0
500
1,000
1,500
2,000
2,500
3,000
Ha
rve
st (th
ou
san
ds o
f pou
nd
s)
Nu
mb
er
(th
ou
san
ds)
Year
Harvest Number
Released Number
Harvest Pounds

III-29
Table III.11 Black Drum recreational catch by state, 2019.
State Harvest Number
PSE (num)
Harvest Pounds
PSE (lb)
Mean Length
(inches)
Mean Weight
(lb) Released
Number
PSE
(release)
North Carolina 156,401 19.9 404,452 20.1 15.7 2.6 756,749 16.6
Delaware 931 68.9 8,117 63.7 24.4 8.7 29,878 83.6
Florida 755,638 16.6 2,919,274 17.6 17.3 3.0 1,333,745 25.6
Georgia 157,584 32.1 321,406 25.5 14.8 2.0 179,872 41.9
Maryland 4,897 25.9 59,912 25.9 23.2 12.2 6,346 26.8
New Jersey 7,506 56.1 172,735 56.8 32.0 23.0 1,953 68.5
South Carolina 349,053 25.7 910,327 24.4 15.9 2.6 1,008,506 17.1
Virginia 6,600 40.4 101,535 57.3 26.1 15.4 152,074 46.5
Figure III.6 Black Drum recreational catch by state, 2019.
0
500
1,000
1,500
2,000
2,500
0
200
400
600
800
1,000
1,200
1,400
1,600
NC DE FL GA MD NJ SC VA
Ha
rve
st (th
ou
san
ds o
f pou
nd
s)
Nu
mb
er
(th
ou
san
ds)
State
Harvest Number
Number Released
Harvest Pounds

III-30
Table III.12 Black Sea Bass recreational catch in North Carolina by year.
Year Harvest Number
PSE (num)
Harvest Pounds
PSE (lb)
Mean Length
(inches)
Mean Weight
(lb) Released
Number PSE
(release)
2019 151,999 50.2 220,377 51.6 14.3 1.4 2,802,990 18.0
2018 86,153 32.9 116,825 32.1 13.6 1.4 2,223,800 17.0
2017 316,925 29.3 539,910 30.9 14.7 1.7 6,190,501 13.5
2016 194,512 31.4 302,925 31.9 14.5 1.6 5,536,050 13.7
2015 319,653 32.9 455,100 32.5 14.0 1.4 5,036,500 18.8
2014 332,594 32.2 563,662 31.6 14.7 1.7 5,022,908 15.6
2013 89,682 20.7 123,413 21.3 13.9 1.4 3,041,126 9.8
2012 134,124 18.2 228,090 19.8 14.4 1.7 4,650,495 8.4
2011 179,892 32.4 262,904 33.5 14.0 1.5 2,569,950 9.1
2010 184,479 26.1 231,236 26.5 13.3 1.3 2,223,822 16.9
2009 152,614 30.0 167,165 28.0 13.1 1.1 1,681,278 14.5
2008 91,097 30.8 119,530 30.4 13.6 1.3 1,056,171 14.0
2007 153,597 37.9 302,485 31.8 15.4 2.0 1,672,116 12.3
2006 190,962 27.6 201,508 30.4 12.3 1.1 2,162,091 11.9
2005 346,733 28.2 453,071 41.7 13.2 1.3 2,142,304 14.4
2004 547,651 33.1 509,890 30.4 11.7 0.9 1,942,630 15.7
2003 327,249 22.1 320,436 21.4 11.9 1.0 931,453 15.7
2002 153,335 22.6 202,496 21.2 13.1 1.3 1,023,629 13.5
2001 362,563 18.6 410,649 19.8 12.3 1.1 1,498,961 12.6
2000 327,651 30.9 386,856 39.6 12.8 1.2 1,652,835 19.8
Figure III.7 Black Sea Bass recreational catch in North Carolina by year.
0
100
200
300
400
500
600
0
1,000
2,000
3,000
4,000
5,000
6,000
7,000
Ha
rve
st (th
ou
san
ds o
f pou
nd
s)
Nu
mb
er
(th
ou
san
ds)
Year
Harvest Number
Released Number
Harvest Pounds

III-31
Table III.13 Black Sea Bass recreational catch by state, 2019.
State Harvest Number
PSE (num)
Harvest Pounds
PSE (lb)
Mean Length
(inches)
Mean Weight
(lb) Released
Number
PSE
(release)
North Carolina 151,999 50.2 220,377 51.6 14.3 1.4 2,802,990 18.0
Connecticut 515,601 17.9 1,180,400 18.4 17.1 2.3 2,624,762 15.2
Delaware 43,435 22.3 61,974 25.4 14.3 1.4 378,301 22.0
Florida 144,562 35.2 173,489 34.0 11.4 0.8 1,665,845 17.2
Georgia 44,648 42.9 51,684 45.2 13.0 1.2 1,181,069 40.1
Florida - - - - - - 1,684 98.3
Maryland 129,432 27.8 156,986 26.5 13.5 1.2 1,635,747 41.9
Massachusetts 526,594 20.0 1,361,110 21.5 18.1 2.6 2,728,800 18.8
New Jersey 831,241 17.1 1,117,658 18.6 13.9 1.3 5,352,818 14.8
New York 1,577,042 14.5 3,126,473 15.3 16.6 2.0 9,725,431 12.4
Rhode Island 517,033 15.7 1,225,058 16.0 17.8 2.4 3,436,223 17.0
South Carolina 76,019 24.2 105,633 25.3 13.6 1.4 2,246,856 15.2
Virginia 230,844 40.3 371,523 38.6 14.5 1.6 1,903,352 19.0
Figure III.8 Black Sea Bass recreational catch by state, 2019.
0
500
1,000
1,500
2,000
2,500
3,000
3,500
0
2,000
4,000
6,000
8,000
10,000
12,000
NC CT DE FL GA ME MD MA NJ NY RI SC VA
Ha
rve
st (th
ou
san
ds o
f pou
nd
s)
Nu
mb
er
(th
ou
san
ds)
State
Harvest Number
Number Released
Harvest Pounds
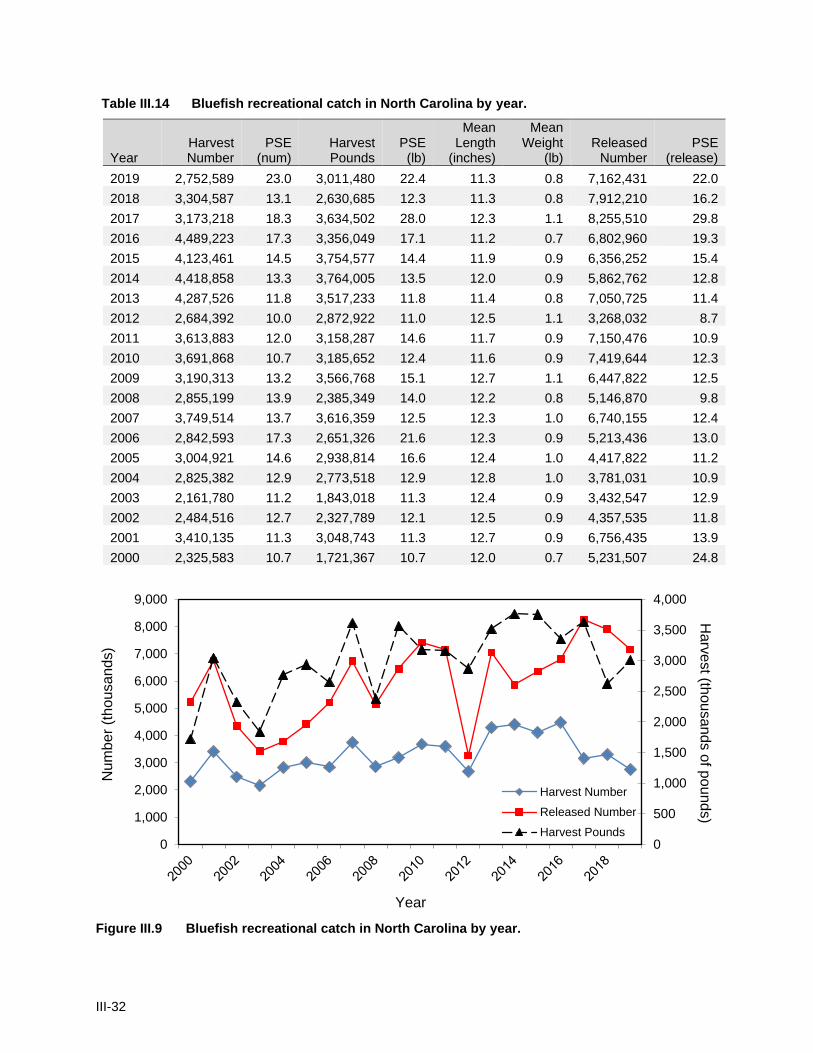
III-32
Table III.14 Bluefish recreational catch in North Carolina by year.
Year Harvest Number
PSE (num)
Harvest Pounds
PSE (lb)
Mean Length
(inches)
Mean Weight
(lb) Released
Number PSE
(release)
2019 2,752,589 23.0 3,011,480 22.4 11.3 0.8 7,162,431 22.0
2018 3,304,587 13.1 2,630,685 12.3 11.3 0.8 7,912,210 16.2
2017 3,173,218 18.3 3,634,502 28.0 12.3 1.1 8,255,510 29.8
2016 4,489,223 17.3 3,356,049 17.1 11.2 0.7 6,802,960 19.3
2015 4,123,461 14.5 3,754,577 14.4 11.9 0.9 6,356,252 15.4
2014 4,418,858 13.3 3,764,005 13.5 12.0 0.9 5,862,762 12.8
2013 4,287,526 11.8 3,517,233 11.8 11.4 0.8 7,050,725 11.4
2012 2,684,392 10.0 2,872,922 11.0 12.5 1.1 3,268,032 8.7
2011 3,613,883 12.0 3,158,287 14.6 11.7 0.9 7,150,476 10.9
2010 3,691,868 10.7 3,185,652 12.4 11.6 0.9 7,419,644 12.3
2009 3,190,313 13.2 3,566,768 15.1 12.7 1.1 6,447,822 12.5
2008 2,855,199 13.9 2,385,349 14.0 12.2 0.8 5,146,870 9.8
2007 3,749,514 13.7 3,616,359 12.5 12.3 1.0 6,740,155 12.4
2006 2,842,593 17.3 2,651,326 21.6 12.3 0.9 5,213,436 13.0
2005 3,004,921 14.6 2,938,814 16.6 12.4 1.0 4,417,822 11.2
2004 2,825,382 12.9 2,773,518 12.9 12.8 1.0 3,781,031 10.9
2003 2,161,780 11.2 1,843,018 11.3 12.4 0.9 3,432,547 12.9
2002 2,484,516 12.7 2,327,789 12.1 12.5 0.9 4,357,535 11.8
2001 3,410,135 11.3 3,048,743 11.3 12.7 0.9 6,756,435 13.9
2000 2,325,583 10.7 1,721,367 10.7 12.0 0.7 5,231,507 24.8
Figure III.9 Bluefish recreational catch in North Carolina by year.
0
500
1,000
1,500
2,000
2,500
3,000
3,500
4,000
0
1,000
2,000
3,000
4,000
5,000
6,000
7,000
8,000
9,000
Ha
rve
st (th
ou
san
ds o
f pou
nd
s)
Nu
mb
er
(th
ou
san
ds)
Year
Harvest Number
Released Number
Harvest Pounds

III-33
Table III.15 Bluefish recreational catch by state, 2019.
State Harvest Number
PSE (num)
Harvest Pounds
PSE (lb)
Mean Length
(inches)
Mean Weight
(lb) Released
Number
PSE
(release)
North Carolina 2,752,589 23.0 3,011,480 22.4 13.0 1.1 7,162,431 22.0
Connecticut 670,401 45.1 1,161,103 38.3 14.6 1.7 819,694 23.7
Delaware 151,469 33.8 415,267 47.0 16.9 2.7 430,371 35.8
Florida 2,366,165 22.7 2,874,785 23.0 14.4 1.3 3,920,450 20.2
Georgia 26,364 31.1 21,886 36.8 11.6 0.8 247,036 23.7
Maryland 111,769 24.7 154,451 23.8 13.2 1.4 226,968 29.4
Massachusetts 265,628 36.6 719,130 30.2 17.5 2.7 471,132 19.5
New Jersey 741,722 17.3 1,660,208 20.8 15.5 2.2 2,568,926 20.7
New York 3,037,380 19.5 3,521,431 18.1 10.9 1.2 3,339,052 21.5
Rhode Island 379,715 41.0 931,991 28.5 15.0 2.5 611,878 21.8
South Carolina 877,372 24.2 502,699 29.5 10.7 0.6 5,571,425 17.6
Virginia 756,717 31.6 581,458 27.4 11.4 0.8 1,125,283 35.6
Figure III.10 Bluefish recreational catch by state, 2019.
0
500
1,000
1,500
2,000
2,500
3,000
3,500
4,000
0
1,000
2,000
3,000
4,000
5,000
6,000
7,000
8,000
NC CT DE FL GA MD MA NJ NY RI SC VA
Ha
rve
st (th
ou
san
ds o
f pou
nd
s)
Nu
mb
er
(th
ou
san
ds)
State
Harvest Number
Number Released
Harvest Pounds

III-34
Table III.16 Cobia recreational catch in North Carolina by year.
Year Harvest Number
PSE (num)
Harvest Pounds
PSE (lb)
Mean Length
(inches)
Mean Weight
(lb) Released
Number PSE
(release)
2019 10,090 38.6 254,963 36.8 40.3 25.3 38,285 23.3
2018 25,331 33.2 685,962 29.1 40.7 27.1 68,219 23.4
2017 25,025 46.1 872,861 45.4 43.5 34.9 125,251 44.5
2016 26,421 44.9 838,363 44.6 42.7 31.7 39,237 26.6
2015 47,110 28.3 1,925,762 29.8 44.2 40.9 44,254 31.4
2014 24,601 35.8 645,427 35.8 39.3 26.2 32,184 29.3
2013 37,617 31.2 980,541 33.0 38.7 26.1 35,398 32.2
2012 3,805 33.9 102,077 35.2 39.0 26.8 66,567 30.1
2011 10,711 40.4 399,192 43.1 41.5 37.3 47,151 25.0
2010 24,030 26.8 808,227 27.8 43.2 33.6 48,590 29.7
2009 12,823 40.7 320,075 45.4 37.9 25.0 55,374 27.3
2008 3,972 54.9 167,463 68.5 45.3 42.2 24,028 39.2
2007 6,262 46.9 218,447 45.0 43.6 34.9 12,695 32.7
2006 5,154 39.4 196,330 45.6 42.6 38.1 11,425 30.1
2005 18,491 48.7 401,557 46.2 37.4 21.7 19,083 43.5
2004 12,522 39.9 420,684 41.4 43.0 33.6 11,079 42.1
2003 6,948 30.4 223,508 37.4 41.6 32.2 21,722 28.4
2002 7,196 46.1 319,178 54.6 48.1 44.4 14,036 38.4
2001 3,548 33.1 121,751 37.9 43.0 34.3 18,500 32.2
2000 2,473 59.6 91,143 54.3 41.0 36.9 4,734 39.8
Figure III.11 Cobia recreational catch in North Carolina by year.
0
500
1,000
1,500
2,000
2,500
0
20
40
60
80
100
120
140
Ha
rve
st (th
ou
san
ds o
f pou
nd
s)
Nu
mb
er
(th
ou
san
ds)
Year
Harvest Number
Released Number
Harvest Pounds

III-35
Table III.17 Cobia recreational catch by state, 2019.
State Harvest Number
PSE (num)
Harvest Pounds
PSE (lb)
Mean Length
(inches)
Mean Weight
(lb) Released
Number
PSE
(release)
North Carolina 10,090 38.6 254,963 36.8 40.3 25.3 38,285 23.3
Delaware - - - - - - 30 89.4
Florida 25,712 70.3 607,142 74.5 37.1 21.7 60,761 40.2
Georgia 72 56.9 1,632 56.8 37.6 22.7 9,080 55.5
Maryland - - - - - - 251 102.9
New Jersey - - - - - - 10,166 99.4
South Carolina 2,381 70.6 64,937 82.3 42.5 27.3 59,724 38.7
Virginia 55,770 22.6 1,573,485 22.0 39.7 28.2 184,716 25.5
Figure III.12 Cobia recreational catch by state, 2019.
0
200
400
600
800
1,000
1,200
1,400
1,600
1,800
0
20
40
60
80
100
120
140
160
180
200
NC DE FL GA MD NJ SC VA
Ha
rve
st (th
ou
san
ds o
f pou
nd
s)
Nu
mb
er
(th
ou
san
ds)
State
Harvest Number
Number Released
Harvest Pounds

III-36
Table III.18 Dolphinfish recreational catch in North Carolina by year.
Year Harvest Number
PSE (num)
Harvest Pounds
PSE (lb)
Mean Length
(inches)
Mean Weight
(lb) Released
Number PSE
(release)
2019 458,086 18.9 3,147,384 20.4 25.7 6.9 35,286 50.6
2018 495,435 15.6 3,318,532 14.8 25.6 6.7 27,959 42.1
2017 279,932 20.7 2,223,509 21.1 28.0 7.9 3,035 39.1
2016 480,860 17.2 5,099,647 18.9 31.1 10.6 2,520 61.4
2015 740,023 23.0 5,610,008 24.8 27.0 7.6 73,872 79.8
2014 403,203 26.9 2,933,166 25.9 27.0 7.3 6,731 55.9
2013 322,769 18.4 2,277,519 16.5 26.6 7.1 5,315 55.0
2012 426,877 13.0 3,335,644 13.5 28.4 7.8 4,800 37.5
2011 638,543 15.3 4,950,235 16.7 27.7 7.8 16,217 87.8
2010 615,081 17.8 3,754,430 15.9 25.2 6.1 5,759 50.4
2009 595,967 17.4 6,380,552 18.3 32.0 10.7 4,480 51.7
2008 362,023 15.4 3,227,899 17.3 29.2 8.9 2,393 56.7
2007 591,835 14.3 5,729,879 15.6 30.4 9.7 6,908 53.2
2006 551,924 13.4 4,300,459 13.4 27.8 7.8 32,911 39.8
2005 634,260 17.1 5,664,028 17.8 29.2 8.9 3,264 66.7
2004 323,140 16.3 2,445,482 15.8 27.6 7.6 6,905 58.6
2003 245,651 19.4 3,029,205 22.0 31.9 12.3 13,985 57.1
2002 400,736 13.1 4,853,768 14.6 30.5 12.1 3,699 45.3
2001 344,865 17.2 4,669,172 20.7 31.9 13.5 4,781 44.8
2000 516,491 15.6 4,631,849 16.5 28.4 9.0 17,396 32.0
Figure III.13 Dolphinfish recreational catch in North Carolina by year.
0
1,000
2,000
3,000
4,000
5,000
6,000
7,000
0
100
200
300
400
500
600
700
800
Ha
rve
st (th
ou
san
ds o
f pou
nd
s)
Nu
mb
er
(th
ou
san
ds)
Year
Harvest Number
Released Number
Harvest Pounds

III-37
Table III.19 Dolphinfish recreational catch by state, 2019.
State Harvest Number
PSE (num)
Harvest Pounds
PSE (lb)
Mean Length
(inches)
Mean Weight
(lb) Released
Number
PSE
(release)
North Carolina 458,086 18.9 3,147,384 20.4 25.7 6.9 35,286 50.6
Delaware 3,501 51.2 16,066 60.6 22.0 4.6 6,690 68.2
Florida 638,818 20.3 3,650,195 20.5 24.4 5.5 644,079 35.8
Georgia 16 112.1 70 112.1 23.8 4.3 - -
Maryland 35,990 37.0 242,662 38.1 26.7 6.7 11,262 56.9
New Jersey 188,403 30.6 805,023 34.5 21.9 4.3 19,069 47.6
New York 99,560 89.9 372,190 85.5 21.9 3.7 22,944 97.1
Rhode Island 8 91.1 65 91.1 29.1 8.2 - -
South Carolina 99,126 62.6 1,170,240 71.1 32.3 11.8 4,480 64.0
Virginia 9,082 35.0 82,671 37.0 30.0 9.1 15,429 76.2
Figure III.14 Dolphinfish recreational catch by state, 2019.
0
500
1,000
1,500
2,000
2,500
3,000
3,500
4,000
0
100
200
300
400
500
600
700
NC DE FL GA MD NJ NY RI SC VA
Ha
rve
st (th
ou
san
ds o
f pou
nd
s)
Nu
mb
er
(th
ou
san
ds)
State
Harvest Number
Number Released
Harvest Pounds

III-38
Table III.20 Florida Pompano recreational catch in North Carolina by year.
Year Harvest Number
PSE (num)
Harvest Pounds
PSE (lb)
Mean Length
(inches)
Mean Weight
(lb) Released
Number PSE
(release)
2019 1,734,862 50.3 769,603 46.1 7.8 0.4 1,668,678 35.0
2018 318,702 37.4 245,670 42.2 8.7 0.8 1,267,505 22.9
2017 730,412 54.4 290,660 54.5 7.4 0.4 1,681,692 31.7
2016 411,634 42.7 258,769 55.2 8.3 0.6 1,446,589 27.2
2015 722,558 36.0 306,213 42.8 7.1 0.4 883,312 25.9
2014 646,308 33.0 360,398 33.5 8.4 0.6 1,112,888 21.8
2013 1,978,916 25.3 735,833 21.4 7.3 0.4 2,967,947 20.8
2012 479,495 16.9 261,933 21.6 8.4 0.5 1,079,328 19.2
2011 698,273 18.4 275,846 17.6 7.5 0.4 1,421,287 17.1
2010 452,467 19.3 179,641 17.6 7.3 0.4 1,099,167 22.5
2009 580,096 20.6 257,813 20.9 8.0 0.4 755,251 18.8
2008 404,194 21.5 204,250 23.4 7.9 0.5 841,824 21.3
2007 259,331 27.4 121,883 23.8 8.2 0.5 757,063 22.9
2006 247,766 30.6 121,883 35.1 9.3 0.5 1,194,051 36.2
2005 407,705 26.5 211,710 32.8 7.9 0.5 719,238 26.7
2004 1,108,124 24.7 518,316 23.4 8.0 0.5 941,805 21.3
2003 770,738 24.9 483,289 21.6 8.3 0.6 946,984 31.7
2002 824,902 40.3 540,521 44.8 8.8 0.7 296,537 25.1
2001 684,843 38.2 236,463 39.7 7.6 0.3 611,086 35.0
2000 917,597 21.7 248,162 22.5 6.9 0.3 573,935 24.3
Figure III.15 Florida Pompano recreational catch in North Carolina by year.
0
100
200
300
400
500
600
700
800
900
0
500
1,000
1,500
2,000
2,500
3,000
3,500 Ha
rve
st (th
ou
san
ds o
f pou
nd
s)
Nu
mb
er
(th
ou
san
ds)
Year
Harvest Number
Released Number
Harvest Pounds

III-39
Table III.21 Florida Pompano recreational catch by state, 2019.
State Harvest Number
PSE (num)
Harvest Pounds
PSE (lb)
Mean Length
(inches)
Mean Weight
(lb) Released
Number
PSE
(release)
North Carolina 1,734,862 50.3 769,603 46.1 7.8 0.4 1,668,678 35.0
Delaware - - - - - - 503 103.8
Florida 1,886,409 20.3 2,806,880 19.5 12.3 1.5 1,737,312 33.3
Georgia 14,720 86.9 7,854 91.1 8.0 0.5 9,849 58.0
Maryland - - - - - - 222 100.7
South Carolina 400,652 46.7 208,712 46.3 7.7 0.5 1,858,148 28.4
Virginia 8,505 73.6 6,647 58.8 9.7 0.8 17,559 55.6
Figure III.16 Florida Pompano recreational catch by state, 2019.
0
500
1,000
1,500
2,000
2,500
3,000
0
200
400
600
800
1,000
1,200
1,400
1,600
1,800
2,000
NC DE FL GA MD SC VA
Ha
rve
st (th
ou
san
ds o
f pou
nd
s)
Nu
mb
er
(th
ou
san
ds)
State
Harvest Number
Number Released
Harvest Pounds

III-40
Table III.22 Gag Grouper recreational catch in North Carolina by year.
Year Harvest Number
PSE (num)
Harvest Pounds
PSE (lb)
Mean Length
(inches)
Mean Weight
(lb) Released
Number PSE
(release)
2019 7,569 56.9 81,372 59.5 26.8 10.8 9,684 57.5
2018 171 53.5 1,326 54.0 25.4 7.8 1,070 75.1
2017 3,688 96.0 48,086 96.2 29.5 13.0 17,832 33.8
2016 3,890 62.1 52,660 72.8 29.9 13.5 27,599 39.0
2015 3,447 66.5 47,547 74.6 30.2 13.8 73,193 33.9
2014 1,484 59.8 14,596 55.2 27.3 9.8 23,751 42.5
2013 4,703 39.8 40,921 41.9 26.4 8.7 16,738 24.7
2012 13,194 27.3 155,017 27.6 27.9 11.7 45,047 29.1
2011 5,837 49.7 75,069 49.5 28.8 12.9 33,292 48.2
2010 6,183 42.0 80,042 43.3 29.1 12.9 39,103 39.4
2009 21,879 40.6 336,547 48.3 30.3 15.4 18,275 53.2
2008 12,483 41.2 172,429 39.4 30.2 13.8 45,233 29.9
2007 23,966 32.0 277,250 31.8 28.2 11.6 113,880 61.1
2006 25,243 35.6 372,020 37.0 30.8 14.7 9,972 43.2
2005 19,354 36.1 227,171 37.6 29.3 11.7 33,837 39.1
2004 28,327 48.9 399,365 60.0 29.4 14.1 20,902 46.8
2003 12,089 45.3 163,552 48.0 29.2 13.5 8,354 79.6
2002 7,772 55.0 103,079 61.4 28.8 13.3 32,289 77.0
2001 7,642 34.8 68,797 37.6 26.5 9.0 3,866 55.0
2000 4,503 56.3 30,367 56.8 24.1 6.7 1,284 95.4
Figure III.17 Gag Grouper recreational catch in North Carolina by year.
0
50
100
150
200
250
300
350
400
450
0
20
40
60
80
100
120 Ha
rve
st (th
ou
san
ds o
f pou
nd
s)
Nu
mb
er
(th
ou
san
ds)
Year
Harvest Number
Released Number
Harvest Pounds

III-41
Table III.23 Gag Grouper recreational catch by state, 2019.
State Harvest Number
PSE (num)
Harvest Pounds
PSE (lb)
Mean Length
(inches)
Mean Weight
(lb) Released
Number
PSE
(release)
North Carolina 7,569 56.9 81,372 59.5 26.8 10.8 9,684 57.5
Florida 12,154 58.1 229,353 51.4 26.7 9.6 11,055 45.7
South Carolina 2,000 88.4 18,027 84.5 26.0 9.0 3,008 55.4
Figure III.18 Gag Grouper recreational catch by state, 2019.
0
50
100
150
200
250
0
2
4
6
8
10
12
14
NC FL SC
Ha
rve
st (th
ou
san
ds o
f pou
nd
s)
Nu
mb
er
(th
ou
san
ds)
State
Harvest Number
Number Released
Harvest Pounds

III-42
Table III.24 Greater Amberjack recreational catch in North Carolina by year.
Year Harvest Number
PSE (num)
Harvest Pounds
PSE (lb)
Mean Length
(inches)
Mean Weight
(lb) Released
Number PSE
(release)
2019 4,236 38.6 81,769 40.8 32.9 19.3 4,980 50.3
2018 11,742 43.1 227,441 40.4 34.2 19.4 2,243 55.6
2017 6,653 26.8 157,091 28.4 35.1 23.6 6,229 31.7
2016 18,608 32.8 305,372 32.9 32.0 16.4 31,318 42.5
2015 16,436 23.0 360,417 24.9 34.3 21.9 10,128 84.3
2014 5,004 35.5 94,629 32.8 33.3 18.9 1,935 56.3
2013 19,275 31.9 428,664 33.9 34.6 22.2 21,209 53.3
2012 12,412 23.8 216,938 24.1 32.2 17.5 3,379 50.1
2011 6,810 33.2 142,570 35.7 34.2 20.9 9,295 94.5
2010 20,377 31.2 455,278 29.4 35.7 22.3 4,773 55.3
2009 25,670 30.1 686,583 30.6 37.8 26.7 9,226 50.3
2008 18,446 27.4 422,220 29.5 35.5 22.9 17,393 54.7
2007 5,789 67.2 90,525 60.5 30.7 15.6 - -
2006 14,023 67.9 289,118 68.2 33.3 20.6 3,289 99.1
2005 2,956 70.0 78,610 55.7 34.8 26.6 4,612 77.3
2004 1,949 33.8 40,556 33.6 34.6 20.8 3,261 72.6
2003 6,198 43.3 139,546 43.2 34.5 22.5 6,676 58.8
2002 5,733 32.0 137,296 33.3 35.2 23.9 18,266 48.0
2001 4,274 31.0 110,990 33.6 36.1 26.0 3,186 46.9
2000 6,214 42.2 136,075 43.7 33.5 21.9 4,026 62.2
Figure III.19 Greater Amberjack recreational catch in North Carolina by year.
0
100
200
300
400
500
600
700
800
0
5
10
15
20
25
30
35
Ha
rve
st (th
ou
san
ds o
f pou
nd
s)
Nu
mb
er
(th
ou
san
ds)
Year
Harvest Number
Released Number
Harvest Pounds

III-43
Table III.25 Greater Amberjack recreational catch by state, 2019.
State Harvest Number
PSE (num)
Harvest Pounds
PSE (lb)
Mean Length
(inches)
Mean Weight
(lb) Released
Number
PSE
(release)
North Carolina 4,236 38.6 81,769 40.8 32.9 19.3 4,980 50.3
Florida 74,084 32.0 1,220,226 38.3 31.8 18.8 157,529 31.0
Georgia 3,623 72.8 64,090 77.6 32.6 17.7 29,515 97.6
South Carolina 1,963 68.0 24,018 74.9 28.2 12.2 2,036 67.2
Virginia - - - - - - 41 34.7
Figure III.20 Greater Amberjack recreational catch by state, 2019.
0
200
400
600
800
1,000
1,200
1,400
0
20
40
60
80
100
120
140
160
180
NC FL GA SC VA
Ha
rve
st (th
ou
san
ds o
f pou
nd
s)
Nu
mb
er
(th
ou
san
ds)
State
Harvest Number
Number Released
Harvest Pounds

III-44
Table III.26 Great Barracuda recreational catch in North Carolina by year.
Year Harvest Number
PSE (num)
Harvest Pounds
PSE (lb)
Mean Length
(inches)
Mean Weight
(lb) Released
Number PSE
(release)
2019 1,661 28.8 15,529 31.2 32.9 9.4 30,700 43.4
2018 5,848 37.2 52,304 34.8 33.0 8.9 19,937 55.0
2017 2,771 58.5 76,501 79.6 47.0 27.6 15,683 39.6
2016 2,420 55.0 27,950 53.7 35.7 11.6 5,599 42.3
2015 3,844 45.6 22,806 40.3 27.5 5.9 9,561 41.6
2014 2,564 80.5 36,960 83.6 41.3 14.4 2,358 58.4
2013 365 74.9 2,183 72.9 28.9 6.0 7,722 51.8
2012 972 44.5 11,601 40.0 36.6 11.9 5,781 38.1
2011 1,100 40.0 12,375 37.7 36.1 11.2 5,286 50.3
2010 2,127 38.9 17,803 40.0 32.2 8.4 6,152 36.0
2009 2,500 41.9 21,007 40.8 33.1 8.4 20,831 47.5
2008 10,877 59.7 103,655 57.3 33.8 9.5 17,468 36.6
2007 823 76.6 7,288 73.1 33.3 8.9 4,989 55.0
2006 158 54.6 1,446 51.9 32.8 9.1 8,240 50.9
2005 5,883 59.1 60,348 55.2 34.2 10.3 13,186 55.5
2004 9,691 62.2 103,666 67.7 35.5 10.7 8,522 83.4
2003 6,562 34.1 90,668 41.3 35.3 13.8 4,213 47.5
2002 7,887 33.8 88,024 32.7 33.1 11.2 8,573 33.1
2001 6,214 42.8 82,942 42.9 36.2 13.3 9,001 28.2
2000 423 54.6 6,597 60.6 39.9 15.6 3,231 42.8
Figure III.21 Great Barracuda recreational catch in North Carolina by year.
0
20
40
60
80
100
120
0
5
10
15
20
25
30
35
Ha
rve
st (th
ou
san
ds o
f pou
nd
s)
Nu
mb
er
(th
ou
san
ds)
Year
Harvest Number
Released Number
Harvest Pounds

III-45
Table III.27 Great Barracuda recreational catch by state, 2019.
State Harvest Number
PSE (num)
Harvest Pounds
PSE (lb)
Mean Length
(inches)
Mean Weight
(lb) Released
Number
PSE
(release)
North Carolina 1,661 28.8 15,529 31.2 32.9 9.4 30,700 43.4
Florida 178,498 32.7 1,277,744 36.0 30.3 7.3 634,571 23.0
Georgia 5,095 58.4 59,454 67.0 35.8 11.7 20,129 42.8
South Carolina 1,338 44.7 13,832 43.9 34.6 10.3 14,480 42.6
Figure III.22 Great Barracuda recreational catch by state, 2019.
0
200
400
600
800
1,000
1,200
1,400
0
100
200
300
400
500
600
700
NC FL GA SC
Ha
rve
st (th
ou
san
ds o
f pou
nd
s)
Nu
mb
er
(th
ou
san
ds)
State
Harvest Number
Number Released
Harvest Pounds

III-46
Table III.28 Gulf Kingfish recreational catch in North Carolina by year.
Year Harvest Number
PSE (num)
Harvest Pounds
PSE (lb)
Mean Length
(inches)
Mean Weight
(lb) Released Number1
PSE (release)4
2019 730,866 72.0 440,502 70.4 11.1 0.6 1,965,756 -
2018 247,241 39.1 161,101 38.2 11.6 0.7 854,041 -
2017 364,215 27.0 271,422 30.1 12.1 0.7 1,091,051 -
2016 504,926 37.3 262,512 35.2 10.8 0.5 1,448,848 -
2015 589,899 28.1 372,465 29.4 11.2 0.6 1,031,454 -
2014 852,684 27.7 550,685 32.7 11.4 0.6 2,348,027 -
2013 888,648 21.1 479,276 22.5 10.4 0.5 1,864,788 -
2012 1,025,099 15.2 541,883 15.2 10.4 0.5 1,947,002 -
2011 453,644 23.9 336,462 26.1 11.9 0.7 841,224 -
2010 863,479 17.0 493,400 18.2 10.8 0.6 1,485,368 -
2009 706,957 30.0 397,010 31.3 10.2 0.6 1,094,812 -
2008 580,344 18.2 290,414 18.8 10.4 0.5 866,656 -
2007 254,403 31.8 207,483 37.8 12.0 0.8 481,080 -
2006 125,527 45.7 78,755 51.5 11.2 0.6 207,277 -
2005 249,866 48.4 126,239 45.2 9.9 0.5 418,836 -
2004 717,508 35.0 463,847 41.3 11.2 0.6 973,597 -
2003 181,630 22.9 95,117 23.7 10.4 0.5 591,299 -
2002 182,540 31.9 74,139 32.3 9.7 0.4 223,538 -
2001 145,004 31.5 76,862 30.3 10.5 0.5 73,634 -
2000 69,305 39.1 40,405 41.2 10.1 0.6 54,619 -
4 Kingfish releases are not recorded to species; released number was calculated by assigning a ratio of observed kingfish by species to reported kingfish genus release estimates. PSEs are not available for this analysis.
Figure III.23 Gulf Kingfish recreational catch in North Carolina by year.
0
100
200
300
400
500
600
0
500
1,000
1,500
2,000
2,500
Ha
rve
st (th
ou
san
ds o
f pou
nd
s)
Nu
mb
er
(th
ou
san
ds)
Year
Harvest Number
Released Number
Harvest Pounds

III-47
Table III.29 Gulf Kingfish recreational catch by state, 2019.
State Harvest Number
PSE (num)
Harvest Pounds
PSE (lb)
Mean Length
(inches)
Mean Weight
(lb) Released Number1
PSE
(release)5
North Carolina 730,866 72.0 440,502 70.4 11.1 0.6 - -
Florida 2,055,068 38.6 1,483,674 40.2 11.9 0.7 - -
South Carolina 52,042 36.6 24,784 34.8 10.2 0.5 - -
5 Released kingfish are not always recorded to species level. Numbers released are not shown by state.
Figure III.24 Gulf Kingfish recreational catch by state, 2019.
0
200
400
600
800
1,000
1,200
1,400
1,600
0
500
1,000
1,500
2,000
2,500
NC FL SC
Ha
rve
st (th
ou
san
ds o
f pou
nd
s)Nu
mb
er
(th
ou
san
ds)
State
Harvest Number
Harvest Pounds

III-48
Table III.30 King Mackerel recreational catch in North Carolina by year.
Year Harvest Number
PSE (num)
Harvest Pounds
PSE (lb)
Mean Length
(inches)
Mean Weight
(lb) Released
Number PSE
(release)
2019 184,962 23.7 1,446,939 24.8 29.7 7.8 115,350 42.1
2018 102,675 19.0 1,018,459 30.1 30.3 9.9 75,614 32.6
2017 110,339 22.6 1,261,775 31.8 31.9 11.4 94,655 28.6
2016 108,151 43.4 963,139 41.7 30.4 8.9 43,909 31.6
2015 95,705 37.2 1,168,255 52.5 33.3 12.2 16,877 52.4
2014 72,288 22.7 1,213,096 22.9 38.7 16.8 35,075 92.8
2013 48,000 23.3 521,153 25.2 32.6 10.9 8,868 54.2
2012 55,529 24.5 613,903 25.3 32.9 11.1 6,385 38.1
2011 31,589 36.3 367,896 31.3 34.0 11.6 851 72.9
2010 58,311 23.8 580,505 23.4 32.5 10.0 9,734 36.0
2009 168,558 17.5 1,822,673 18.4 32.7 10.8 23,639 33.2
2008 164,719 18.7 1,379,450 19.0 30.1 8.4 41,283 43.9
2007 339,278 15.2 3,099,801 15.5 31.1 9.1 53,549 29.4
2006 177,369 17.9 1,805,814 22.3 32.0 10.2 45,568 29.1
2005 175,070 16.0 1,349,536 15.9 29.6 7.7 101,507 26.2
2004 191,584 17.7 2,276,035 22.9 32.2 11.9 184,384 38.7
2003 153,339 17.1 1,388,145 17.3 30.4 9.1 33,774 27.5
2002 104,631 40.7 1,242,058 42.4 33.0 11.9 20,811 49.1
2001 145,290 12.8 2,046,022 16.2 34.5 14.1 12,381 41.8
2000 196,979 20.8 2,250,512 17.9 32.0 11.4 26,009 41.1
Figure III.25 King Mackerel recreational catch in North Carolina by year.
0
500
1,000
1,500
2,000
2,500
3,000
3,500
0
50
100
150
200
250
300
350
400
Ha
rve
st (th
ou
san
ds o
f pou
nd
s)
Nu
mb
er
(th
ou
san
ds)
Year
Harvest Number
Released Number
Harvest Pounds

III-49
Table III.31 King Mackerel recreational catch by state, 2019.
State Harvest Number
PSE (num)
Harvest Pounds
PSE (lb)
Mean Length
(inches)
Mean Weight
(lb) Released
Number
PSE
(release)
North Carolina 184,962 23.7 1,446,939 24.8 29.7 7.8 115,350 42.1
Delaware 50 37.5 449 37.5 30.2 8.9 - -
Florida 531,351 17.4 4,809,074 16.6 31.6 9.3 109,550 27.5
Georgia 23,998 36.9 252,455 46.4 33.4 10.5 16,732 72.1
Maryland 2,233 51.8 9,213 47.5 24.1 4.1 4,652 35.8
New Jersey 637 85.0 8,269 98.8 28.6 13.0 - -
South Carolina 48,971 33.5 551,976 41.0 32.8 11.3 90,788 47.3
Virginia 1,000 72.8 5,726 70.7 27.7 5.7 188 103.2
Figure III.26 King Mackerel recreational catch by state, 2019.
0
1,000
2,000
3,000
4,000
5,000
6,000
0
100
200
300
400
500
600
NC DE FL GA MD NJ SC VA
Ha
rve
st (th
ou
san
ds o
f pou
nd
s)
Nu
mb
er
(th
ou
san
ds)
State
Harvest Number
Number Released
Harvest Pounds
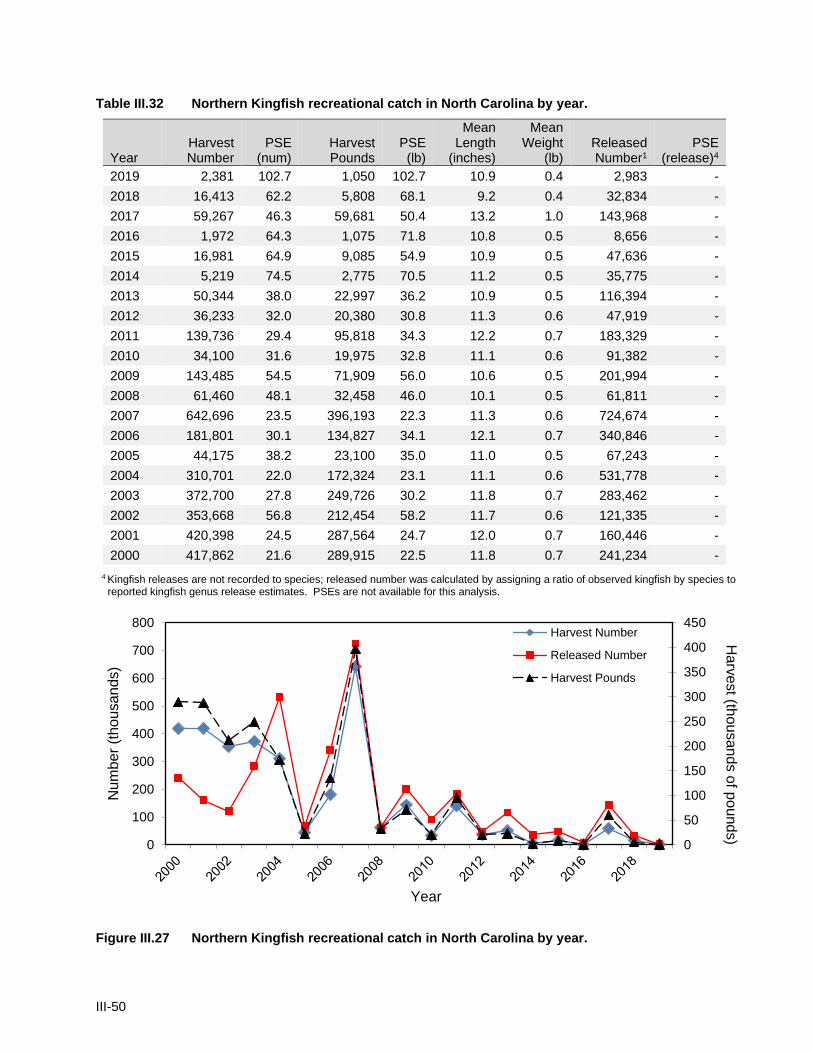
III-50
Table III.32 Northern Kingfish recreational catch in North Carolina by year.
Year Harvest Number
PSE (num)
Harvest Pounds
PSE (lb)
Mean Length
(inches)
Mean Weight
(lb) Released Number1
PSE (release)4
2019 2,381 102.7 1,050 102.7 10.9 0.4 2,983 -
2018 16,413 62.2 5,808 68.1 9.2 0.4 32,834 -
2017 59,267 46.3 59,681 50.4 13.2 1.0 143,968 -
2016 1,972 64.3 1,075 71.8 10.8 0.5 8,656 -
2015 16,981 64.9 9,085 54.9 10.9 0.5 47,636 -
2014 5,219 74.5 2,775 70.5 11.2 0.5 35,775 -
2013 50,344 38.0 22,997 36.2 10.9 0.5 116,394 -
2012 36,233 32.0 20,380 30.8 11.3 0.6 47,919 -
2011 139,736 29.4 95,818 34.3 12.2 0.7 183,329 -
2010 34,100 31.6 19,975 32.8 11.1 0.6 91,382 -
2009 143,485 54.5 71,909 56.0 10.6 0.5 201,994 -
2008 61,460 48.1 32,458 46.0 10.1 0.5 61,811 -
2007 642,696 23.5 396,193 22.3 11.3 0.6 724,674 -
2006 181,801 30.1 134,827 34.1 12.1 0.7 340,846 -
2005 44,175 38.2 23,100 35.0 11.0 0.5 67,243 -
2004 310,701 22.0 172,324 23.1 11.1 0.6 531,778 -
2003 372,700 27.8 249,726 30.2 11.8 0.7 283,462 -
2002 353,668 56.8 212,454 58.2 11.7 0.6 121,335 -
2001 420,398 24.5 287,564 24.7 12.0 0.7 160,446 -
2000 417,862 21.6 289,915 22.5 11.8 0.7 241,234 -
4 Kingfish releases are not recorded to species; released number was calculated by assigning a ratio of observed kingfish by species to reported kingfish genus release estimates. PSEs are not available for this analysis.
Figure III.27 Northern Kingfish recreational catch in North Carolina by year.
0
50
100
150
200
250
300
350
400
450
0
100
200
300
400
500
600
700
800
Ha
rve
st (th
ou
san
ds o
f pou
nd
s)
Nu
mb
er
(th
ou
san
ds)
Year
Harvest Number
Released Number
Harvest Pounds

III-51
Table III.33 Northern Kingfish recreational catch by state, 2019.
State Harvest Number
PSE (num)
Harvest Pounds
PSE (lb)
Mean Length
(inches)
Mean Weight
(lb) Released Number1
PSE
(release)5
North Carolina 2,381 102.7 1,050 102.7 10.9 0.4 - -
Delaware 36,430 41.6 15,515 42.2 10.0 0.4 - -
Florida 130,432 113.5 25,341 113.5 7.5 0.2 - -
Maryland 40,808 79.4 18,988 79.1 10.4 0.5 - -
New Jersey 39,422 66.3 23,797 67.3 11.5 0.6 - -
New York 53,758 85.3 21,465 85.2 9.5 0.4 - -
Rhode Island 853 101.3 564 101.3 11.3 0.7 - -
Virginia 98,749 64.0 49,768 62.1 10.5 0.5 - -
5Released kingfish are not always recorded to species level. Numbers released are not shown by state.
Figure III.28 Northern Kingfish recreational catch by state, 2019.
0
10
20
30
40
50
60
0
20
40
60
80
100
120
140
NC CT DE FL MD NJ NY RI VA
Ha
rve
st (th
ou
san
ds o
f pou
nd
s)
Nu
mb
er
(th
ou
san
ds)
State
Harvest Number
Harvest Pounds

III-52
Table III.34 Northern Puffer recreational catch in North Carolina by year.
Year Harvest Number
PSE (num)
Harvest Pounds
PSE (lb)
Mean Length
(inches)
Mean Weight
(lb) Released
Number PSE
(release)
2019 2,394,588 29.5 1,016,972 29.9 7.8 0.4 2,240,965 19.3
2018 325,810 56.7 148,220 59.7 7.8 0.5 407,924 23.5
2017 518,342 26.7 258,605 24.7 8.3 0.5 1,878,428 41.1
2016 1,627,063 21.9 782,983 22.1 8.2 0.5 1,927,787 17.6
2015 2,752,120 31.1 1,334,104 28.1 8.1 0.5 3,645,599 18.1
2014 490,259 38.9 248,174 40.4 9.0 0.5 419,798 31.4
2013 899,150 37.3 449,032 28.6 8.3 0.5 347,152 32.1
2012 1,074,685 23.5 613,493 24.7 8.5 0.6 1,571,047 11.0
2011 923,100 22.4 579,923 24.0 9.0 0.6 1,220,673 17.9
2010 1,491,844 35.6 816,436 34.8 8.7 0.5 711,264 23.8
2009 194,158 32.3 108,035 31.1 8.6 0.6 40,466 35.1
2008 311,487 33.2 117,706 30.0 7.5 0.4 23,158 60.5
2007 153,264 41.3 93,648 42.7 9.1 0.6 33,626 52.7
2006 162,012 78.3 104,601 81.5 9.2 0.6 34,587 47.6
2005 237,213 49.3 147,256 53.7 9.0 0.6 195,199 53.3
2004 254,184 31.7 160,160 30.6 8.9 0.6 127,519 25.1
2003 800,863 55.3 660,167 58.5 9.5 0.8 51,113 43.5
2002 677,253 32.9 388,883 35.2 9.2 0.6 148,184 36.0
2001 589,195 20.6 397,663 21.3 9.1 0.7 134,411 28.3
2000 357,127 21.6 214,219 23.8 8.9 0.6 145,073 47.0
Figure III.29 Northern Puffer recreational catch in North Carolina by year.
0
200
400
600
800
1,000
1,200
1,400
1,600
0
500
1,000
1,500
2,000
2,500
3,000
3,500
4,000
Ha
rve
st (th
ou
san
ds o
f pou
nd
s)
Nu
mb
er
(th
ou
san
ds)
Year
Harvest Number
Released Number
Harvest Pounds

III-53
Table III.35 Northern Puffer recreational catch by state, 2019.
State Harvest Number
PSE (num)
Harvest Pounds
PSE (lb)
Mean Length
(inches)
Mean Weight
(lb) Released
Number
PSE
(release)
North Carolina 2,394,588 29.5 1,016,972 29.9 7.8 0.4 2,240,965 19.3
Connecticut - - - - - - 165 78.3
Delaware 1,515 53.6 817 54.5 8.2 0.5 3,721 42.2
Georgia - - - - - - 2,193 65.4
Maryland 60 102.5 26 102.5 8.3 0.4 20,399 77.2
Massachusetts - - - - - - 204 100.4
New Jersey 492,507 50.3 228,098 50.1 8.0 0.5 757,578 49.3
New York 133,181 44.2 60,276 43.8 8.0 0.5 562,956 25.1
Rhode Island 139 101.6 108 101.6 9.6 0.8 4,426 79.8
South Carolina 5,275 65.8 2,253 61.8 7.8 0.4 76,227 57.6
Virginia 209,394 59.0 84,984 57.3 8.2 0.4 279,747 25.6
Figure III.30 Northern Puffer recreational catch by state, 2019.
0
200
400
600
800
1,000
1,200
0
500
1,000
1,500
2,000
2,500
3,000
NC CT DE GA MD MA NJ NY RI SC VA
Ha
rve
st (th
ou
san
ds o
f pou
nd
s)N
um
be
r (t
hou
san
ds)
State
Harvest Number
Number Released
Harvest Pounds

III-54
Table III.36 Pigfish recreational catch in North Carolina by year.
Year Harvest Number
PSE (num)
Harvest Pounds
PSE (lb)
Mean Length
(inches)
Mean Weight
(lb) Released
Number PSE
(release)
2019 432,005 21.9 146,570 21.0 8.0 0.3 1,639,294 30.6
2018 418,174 21.5 163,686 21.4 8.3 0.4 1,385,059 15.4
2017 656,096 27.6 218,003 27.8 8.0 0.3 2,025,949 20.3
2016 1,316,198 22.8 443,062 23.7 8.0 0.3 2,452,668 14.2
2015 1,593,393 24.6 567,572 24.5 8.2 0.4 3,332,936 13.6
2014 1,278,934 26.7 354,667 24.1 7.2 0.3 2,764,971 16.8
2013 905,659 16.1 293,508 15.2 7.9 0.3 1,914,017 13.1
2012 1,098,940 18.8 417,432 18.3 7.9 0.4 1,793,064 9.8
2011 853,482 18.4 268,432 19.2 7.8 0.3 2,316,470 11.7
2010 552,530 17.8 180,599 18.2 7.8 0.3 2,394,225 13.3
2009 1,074,061 61.2 443,288 64.8 8.3 0.4 1,857,462 15.9
2008 478,273 21.6 141,247 24.0 7.8 0.3 1,502,518 23.5
2007 719,365 25.6 230,770 26.6 8.1 0.3 1,430,793 18.5
2006 662,750 23.8 265,398 23.6 8.2 0.4 968,477 19.1
2005 1,160,195 42.0 576,835 48.1 8.8 0.5 1,161,855 20.6
2004 696,142 26.1 282,523 25.3 8.9 0.4 1,739,120 16.9
2003 1,537,595 20.2 602,742 20.5 8.4 0.4 1,638,238 12.7
2002 1,039,007 32.8 361,066 39.5 8.2 0.3 1,363,433 25.0
2001 975,513 27.3 337,779 23.5 8.1 0.3 1,273,575 16.9
2000 1,381,170 42.3 638,461 42.7 8.6 0.5 1,511,814 12.1
Figure III.31 Pigfish recreational catch in North Carolina by year.
0
100
200
300
400
500
600
700
0
500
1,000
1,500
2,000
2,500
3,000
3,500
Ha
rve
st (th
ou
san
ds o
f pou
nd
s)
Nu
mb
er
(th
ou
san
ds)
Year
Harvest Number
Released Number
Harvest Pounds

III-55
Table III.37 Pigfish recreational catch by state, 2019.
State Harvest Number
PSE (num)
Harvest Pounds
PSE (lb)
Mean Length
(inches)
Mean Weight
(lb) Released
Number
PSE
(release)
North Carolina 432,005 21.9 146,570 21.0 8.0 0.3 1,639,294 30.6
Florida 221,733 52.8 75,012 48.5 8.4 0.4 293,484 47.6
Georgia 41,270 56.2 13,303 54.6 7.8 0.3 21,008 50.4
Maryland 832 101.4 230 101.2 7.2 0.3 15 109.8
South Carolina 22,164 34.7 7,883 35.6 7.7 0.4 55,793 38.7
Virginia 74,598 56.1 21,147 62.3 7.4 0.3 394,170 38.9
Figure III.32 Pigfish recreational catch by state, 2019.
0
20
40
60
80
100
120
140
160
0
200
400
600
800
1,000
1,200
1,400
1,600
1,800
NC FL GA MD SC VA
Ha
rve
st (th
ou
san
ds o
f pou
nd
s)
Nu
mb
er
(th
ou
san
ds)
State
Harvest Number
Number Released
Harvest Pounds

III-56
Table III.38 Pinfish recreational catch in North Carolina by year.
Year Harvest Number
PSE (num)
Harvest Pounds
PSE (lb)
Mean Length
(inches)
Mean Weight
(lb) Released
Number PSE
(release)
2019 955,550 24.7 217,718 24.2 6.6 0.2 9,076,843 11.1
2018 886,712 18.7 188,046 18.6 6.4 0.2 9,646,310 10.7
2017 917,956 24.3 283,455 23.7 6.9 0.3 13,677,930 16.8
2016 1,236,741 19.9 246,720 19.7 6.4 0.2 16,905,448 13.6
2015 1,597,032 20.6 449,239 24.5 6.8 0.3 14,915,393 11.4
2014 1,453,062 17.2 281,547 15.8 6.1 0.2 19,323,896 10.7
2013 1,385,301 15.8 269,250 17.0 6.5 0.2 10,455,850 9.4
2012 1,015,905 14.6 165,384 13.9 5.7 0.2 11,864,052 8.7
2011 836,412 17.0 159,057 16.5 6.4 0.2 8,823,604 9.4
2010 757,425 14.8 122,854 14.3 6.0 0.2 10,754,559 8.6
2009 597,710 21.1 124,101 21.9 6.4 0.2 7,795,965 11.5
2008 640,886 22.5 142,016 21.2 6.6 0.2 6,799,842 10.6
2007 266,392 28.2 58,827 28.0 6.6 0.2 6,526,964 11.0
2006 435,252 28.2 94,334 25.1 7.0 0.2 9,116,690 15.1
2005 341,742 23.3 78,975 23.1 6.9 0.2 4,732,265 13.1
2004 593,170 51.9 140,151 53.1 6.3 0.2 7,921,980 11.3
2003 907,567 20.4 292,269 21.5 7.3 0.3 10,849,405 11.8
2002 935,556 20.6 208,331 20.5 6.9 0.2 11,286,432 11.5
2001 1,184,602 24.0 343,875 26.3 7.2 0.3 8,765,316 12.4
2000 1,538,661 23.7 507,292 25.6 7.1 0.3 8,768,301 9.8
Figure III.33 Pinfish recreational catch in North Carolina by year.
0
100
200
300
400
500
600
0
5,000
10,000
15,000
20,000
25,000
Ha
rve
st (th
ou
san
ds o
f pou
nd
s)
Nu
mb
er
(th
ou
san
ds)
Year
Harvest Number
Released Number
Harvest Pounds

III-57
Table III.39 Pinfish recreational catch by state, 2019.
State Harvest Number
PSE (num)
Harvest Pounds
PSE (lb)
Mean Length
(inches)
Mean Weight
(lb) Released
Number
PSE
(release)
North Carolina 955,550 24.7 217,718 24.2 6.6 0.2 9,076,843 11.1
Connecticut 103 97.4 - - - - - -
Florida 680,475 22.2 108,332 22.3 7.3 0.4 1,791,288 19.6
Georgia 17,561 88.0 4,374 85.8 6.7 0.2 74,320 62.0
Maryland 10 19.7 9 19.7 10.5 0.9 2,597 105.4
New Jersey 776 93.2 440 93.2 8.2 0.6 172 99.2
South Carolina 150,084 27.0 39,377 26.0 6.7 0.3 3,861,951 24.0
Virginia 7,682 80.8 1,719 79.8 6.5 0.2 21,784 48.2
Figure III.34 Pinfish recreational catch by state, 2019.
0
50
100
150
200
250
0
1,000
2,000
3,000
4,000
5,000
6,000
7,000
8,000
9,000
10,000
NC CT FL GA MD NJ SC VA
Ha
rve
st (th
ou
san
ds o
f pou
nd
s)
Nu
mb
er
(th
ou
san
ds)
State
Harvest Number
Number Released
Harvest Pounds

III-58
Table III.40 Red Drum recreational catch in North Carolina by year.
Year Harvest Number
PSE (num)
Harvest Pounds
PSE (lb)
Mean Length
(inches)
Mean Weight
(lb) Released
Number PSE
(release)
2019 97,186 22.8 436,219 24.2 21.5 4.5 2,976,601 17.4
2018 299,577 19.1 1,452,358 18.6 22.7 4.8 1,729,260 15.3
2017 353,716 17.0 1,475,852 18.0 21.4 4.2 2,165,656 13.0
2016 169,195 22.1 633,496 18.4 20.1 3.7 3,203,452 30.5
2015 143,876 24.5 567,730 26.1 20.7 3.9 1,308,072 27.2
2014 324,303 18.8 1,674,595 18.2 22.9 5.2 1,086,967 13.3
2013 520,758 13.3 2,214,045 13.9 21.7 4.3 1,892,171 11.6
2012 152,005 13.1 648,342 12.6 21.1 4.3 4,939,534 11.4
2011 156,484 16.7 737,853 18.1 21.9 4.7 587,369 13.4
2010 179,828 12.2 835,143 12.8 22.0 4.6 1,670,693 10.1
2009 214,317 18.8 1,028,339 18.6 22.5 4.8 1,238,158 16.0
2008 112,938 17.4 523,607 18.6 22.0 4.6 1,510,133 14.4
2007 157,577 15.2 789,430 14.8 22.6 5.0 818,037 13.9
2006 127,412 17.5 569,699 18.9 21.2 4.5 1,042,564 15.2
2005 103,275 19.9 470,914 22.1 21.8 4.6 967,892 37.5
2004 58,543 26.0 245,163 29.7 21.1 4.2 369,326 13.3
2003 73,202 18.9 359,181 19.1 21.8 4.9 215,277 18.1
2002 127,559 19.6 571,102 21.0 21.4 4.5 1,515,679 17.2
2001 57,929 18.1 290,901 18.6 22.4 5.0 538,370 20.1
2000 127,165 16.1 655,251 16.9 22.4 5.2 443,747 18.6
Figure III.35 Red Drum recreational catch in North Carolina by year.
0
500
1,000
1,500
2,000
2,500
0
1,000
2,000
3,000
4,000
5,000
6,000
Ha
rve
st (th
ou
san
ds o
f pou
nd
s)
Nu
mb
er
(th
ou
san
ds)
Year
Harvest Number
Released Number
Harvest Pounds

III-59
Table III.41 Red Drum recreational catch by state, 2019.
State Harvest Number
PSE (num)
Harvest Pounds
PSE (lb)
Mean Length
(inches)
Mean Weight
(lb) Released
Number
PSE
(release)
North Carolina 97,186 22.8 436,219 24.2 21.5 4.5 2,976,601 17.4
Delaware - - - - - - 474 68.9
Florida 599,348 14.0 2,372,773 14.6 21.0 3.9 3,688,884 14.4
Georgia 271,970 23.3 630,294 22.2 17.1 2.3 1,206,707 24.6
Maryland 1,258 73.6 2,113 88.4 15.4 1.7 5,740 63.5
New Jersey 1,331 103.5 4,107 103.5 19.0 3.1 - -
South Carolina 333,315 23.1 862,124 23.6 18.2 2.6 2,911,653 18.8
Virginia 205,824 36.9 470,940 36.3 16.1 2.3 865,957 38.3
Figure III.36 Red Drum recreational catch by state, 2019.
0
500
1,000
1,500
2,000
2,500
0
500
1,000
1,500
2,000
2,500
3,000
3,500
4,000
NC DE FL GA MD NJ SC VA
Ha
rve
st (th
ou
san
ds o
f pou
nd
s)
Nu
mb
er
(th
ou
san
ds)
State
Harvest Number
Number Released
Harvest Pounds

III-60
Table III.42 Sheepshead recreational catch in North Carolina by year.
Year Harvest Number
PSE (num)
Harvest Pounds
PSE (lb)
Mean Length
(inches)
Mean Weight
(lb) Released
Number PSE
(release)
2019 221,419 21.7 590,150 24.7 13.9 2.7 312,479 26.2
2018 343,772 22.5 735,738 20.1 12.8 2.1 524,967 17.7
2017 282,480 19.4 810,633 19.6 13.9 2.9 910,841 22.7
2016 149,085 26.2 375,328 25.3 13.8 2.5 212,471 23.2
2015 181,554 22.2 520,382 20.8 14.2 2.9 160,447 22.6
2014 185,267 20.4 389,583 20.8 12.6 2.1 224,062 20.4
2013 784,747 20.1 1,220,357 15.9 11.1 1.6 391,809 20.3
2012 346,609 15.8 797,963 19.3 12.7 2.3 269,226 23.2
2011 196,844 25.6 522,896 30.1 13.9 2.7 78,821 26.0
2010 327,223 17.6 966,467 19.5 14.4 3.0 190,823 22.3
2009 362,439 23.3 577,311 23.8 11.4 1.6 299,221 25.2
2008 503,666 30.2 1,007,914 33.8 11.9 2.0 172,604 22.4
2007 433,872 30.1 1,456,396 29.5 14.9 3.4 334,014 34.2
2006 137,312 32.8 445,182 33.4 14.8 3.2 90,502 45.3
2005 87,504 40.0 340,227 41.9 16.2 3.9 65,863 80.5
2004 86,554 23.8 453,372 26.4 16.9 5.2 40,263 44.6
2003 294,989 23.4 983,640 25.2 14.5 3.3 85,877 31.8
2002 181,197 23.2 781,567 25.0 16.0 4.3 68,317 24.4
2001 183,781 28.6 654,527 30.0 15.2 3.6 66,594 38.5
2000 355,192 21.0 780,622 20.6 13.1 2.2 94,963 28.2
Figure III.37 Sheepshead recreational catch in North Carolina by year.
0
200
400
600
800
1,000
1,200
1,400
1,600
0
100
200
300
400
500
600
700
800
900
1,000
Ha
rve
st (th
ou
san
ds o
f pou
nd
s)
Nu
mb
er
(th
ou
san
ds)
Year
Harvest Number
Released Number
Harvest Pounds

III-61
Table III.43 Sheepshead recreational catch by state, 2019.
State Harvest Number
PSE (num)
Harvest Pounds
PSE (lb)
Mean Length
(inches)
Mean Weight
(lb) Released
Number
PSE
(release)
North Carolina 221,419 21.7 590,150 24.7 13.9 2.7 312,479 26.2
Delaware 8,879 84.4 42,790 86.6 16.1 4.8 703 103.6
Florida 1,133,132 20.7 2,642,470 19.7 13.4 2.2 1,453,465 21.1
Georgia 151,913 30.0 319,260 33.1 12.9 2.1 212,307 56.2
Maryland 7,233 42.8 56,773 50.7 19.3 7.8 - -
South Carolina 164,298 27.7 615,724 28.9 15.7 3.7 532,766 35.1
Virginia 45,979 53.6 75,760 54.0 12.2 1.6 1,567 71.8
Figure III.38 Sheepshead recreational catch by state, 2019.
0
500
1,000
1,500
2,000
2,500
3,000
0
200
400
600
800
1,000
1,200
1,400
1,600
NC DE FL GA MD SC VA
Ha
rve
st (th
ou
san
ds o
f pou
nd
s)
Nu
mb
er
(th
ou
san
ds)
State
Harvest Number
Number Released
Harvest Pounds

III-62
Table III.44 Silver Perch recreational catch in North Carolina by year.
Year Harvest Number
PSE (num)
Harvest Pounds
PSE (lb)
Mean Length
(inches)
Mean Weight
(lb) Released
Number PSE
(release)
2019 32,444 49.2 7,520 39.9 6.9 0.2 244,868 29.6
2018 6,595 54.9 1,594 53.7 7.4 0.2 84,721 38.8
2017 133,676 44.2 24,532 45.1 7.3 0.2 441,052 36.7
2016 55,040 46.5 11,275 47.5 7.5 0.2 499,616 25.7
2015 41,707 64.7 8,832 64.9 7.6 0.2 98,138 36.2
2014 91,219 57.8 19,567 56.0 7.1 0.2 561,115 55.5
2013 60,246 39.7 10,662 37.1 6.7 0.2 227,334 32.2
2012 115,122 46.6 17,358 40.8 7.1 0.2 297,961 22.8
2011 112,595 45.3 25,729 53.3 7.2 0.2 219,913 24.8
2010 28,366 43.7 7,800 43.9 7.6 0.3 337,774 31.6
2009 92,414 52.1 28,241 55.5 8.0 0.3 479,403 61.3
2008 28,028 42.4 5,911 43.8 8.0 0.2 101,691 42.2
2007 372,042 58.9 64,738 60.3 6.5 0.2 1,288,217 26.3
2006 96,074 42.3 17,550 43.3 7.4 0.2 469,055 29.5
2005 80,394 74.8 25,698 71.1 8.7 0.3 158,168 45.2
2004 23,639 35.3 5,642 35.6 8.1 0.2 124,740 48.8
2003 182,504 59.9 43,470 58.7 8.0 0.2 87,483 34.4
2002 73,418 51.0 15,470 52.9 7.2 0.2 99,484 37.2
2001 51,060 40.1 14,117 41.0 7.8 0.3 107,180 34.5
2000 176,755 55.2 39,011 51.7 8.0 0.2 528,300 66.8
Figure III.39 Silver Perch recreational catch in North Carolina by year.
0
10
20
30
40
50
60
70
0
200
400
600
800
1,000
1,200
1,400
Ha
rve
st (th
ou
san
ds o
f pou
nd
s)
Nu
mb
er
(th
ou
san
ds)
Year
Harvest Number
Released Number
Harvest Pounds

III-63
Table III.45 Silver Perch recreational catch by state, 2019.
State Harvest Number
PSE (num)
Harvest Pounds
PSE (lb)
Mean Length
(inches)
Mean Weight
(lb) Released
Number PSE
(release)
North Carolina 32,444 49.2 7,520 39.9 6.9 0.2 244,868 29.6
Florida 188,200 93.5 38,592 92.5 7.9 0.2 4,612 101.5
Georgia 115,524 72.7 24,359 71.8 5.8 0.2 863,525 33.7
Maryland 60,759 79.7 21,008 81.0 6.5 0.3 634,533 28.5
New Jersey - - - - - - 18,978 95.9
South Carolina 290,706 28.3 57,110 26.6 6.9 0.2 388,391 30.0
Virginia 181,815 61.3 28,624 61.1 7.2 0.2 207,145 56.1
Figure III.40 Silver Perch recreational catch by state, 2019.
0
10
20
30
40
50
60
0
100
200
300
400
500
600
700
800
900
1,000
NC FL GA MD NJ SC VA
Ha
rve
st (th
ou
san
ds o
f pou
nd
s)
Num
ber
(thousands)
State
Harvest Number
Number Released
Harvest Pounds

III-64
Table III.46 Southern Flounder recreational catch in North Carolina by year.
Year Harvest Number
PSE (num)
Harvest Pounds
PSE (lb)
Mean Length
(inches)
Mean Weight
(lb) Released Number6
PSE (release)6
2019 163,045 19.1 387,203 23.3 17.6 2.4 1,353,286 -
2018 217,805 19.3 495,289 18.5 17.2 2.3 1,002,753 -
2017 221,321 18.7 451,126 16.8 16.0 2.0 1,988,000 -
2016 299,273 16.1 695,713 16.7 16.4 2.3 2,178,145 -
2015 249,166 18.5 558,303 17.7 15.8 2.2 1,709,189 -
2014 209,228 17.0 447,337 16.9 16.1 2.1 1,856,280 -
2013 374,215 23.7 869,223 22.1 16.6 2.3 2,357,529 -
2012 290,035 10.6 701,698 10.8 16.5 2.4 2,434,621 -
2011 388,647 13.1 942,373 13.2 17.6 2.4 2,087,604 -
2010 556,812 11.5 1,149,899 11.6 17.0 2.1 2,835,142 -
2009 329,117 15.9 692,704 14.7 16.4 2.1 1,889,921 -
2008 349,860 16.2 807,867 16.5 16.8 2.3 2,532,079 -
2007 279,916 18.2 572,064 16.9 17.2 2.0 1,075,735 -
2006 352,942 17.9 761,069 21.8 16.8 2.2 1,287,601 -
2005 298,307 16.2 675,856 17.3 16.7 2.3 997,132 -
2004 347,492 15.2 827,593 18.4 17.5 2.4 1,537,924 -
2003 293,793 15.4 621,985 15.7 17.5 2.1 860,052 -
2002 366,671 13.6 789,539 15.0 17.4 2.2 1,415,247 -
2001 304,791 13.5 567,568 13.7 17.0 1.9 990,335 -
2000 326,712 28.0 607,053 24.3 17.1 1.9 942,560 -
6 Flounder releases are not recorded to species; released number was calculated by assigning a ratio of observed flounder by species to reported flounder genus release estimates. PSEs are not available for this analysis.
Figure III.41 Southern Flounder recreational catch in North Carolina by year.
0
200
400
600
800
1,000
1,200
1,400
0
500
1,000
1,500
2,000
2,500
3,000
Ha
rve
st (th
ou
san
ds o
f pou
nd
s)
Nu
mb
er
(th
ou
san
ds)
Year
Harvest Number
Released Number
Harvest Pounds

III-65
Table III.47 Southern Flounder recreational catch by state, 2019.
State Harvest Number
PSE (num)
Harvest Pounds
PSE (lb)
Mean Length
(inches)
Mean Weight
(lb) Released Number7
PSE
(release)7
North Carolina 163,045 19.1 387,203 23.3 17.6 2.4 - -
Florida 1,294,158 26.7 2,202,748 27.0 15.5 1.7 - -
Georgia 96,651 22.4 148,327 24.9 14.9 1.5 - -
South Carolina 114,115 24.5 241,047 24.4 17.0 2.1 - -
Virginia 485 101.0 1,336 101.0 18.4 2.8 - -
7 Released flounder are not always recorded to species level. Numbers released are not shown by state.
Figure III.42 Southern Flounder recreational catch by state, 2019.
0
500
1,000
1,500
2,000
2,500
0
200
400
600
800
1,000
1,200
1,400
NC FL GA SC VA
Ha
rve
st (th
ou
san
ds o
f pou
nd
s)
Nu
mb
er
(th
ou
san
ds)
State
Harvest Number
Number Released
Harvest Pounds

III-66
Table III.48 Southern Kingfish recreational catch in North Carolina by year.
Year Harvest Number
PSE (num)
Harvest Pounds
PSE (lb)
Mean Length
(inches)
Mean Weight
(lb) Released Number1
PSE (release)4
2019 767,259 29.0 439,552 23.8 11.0 0.6 2,183,265 -
2018 497,134 19.8 312,829 20.0 11.5 0.6 1,293,857 -
2017 1,116,869 23.0 584,459 22.4 11.0 0.5 2,994,666 -
2016 1,422,584 26.8 771,534 26.5 11.2 0.5 2,765,072 -
2015 2,103,634 30.0 1,138,715 28.2 10.8 0.5 5,501,449 -
2014 2,477,383 44.1 1,544,862 46.3 11.7 0.6 4,003,170 -
2013 2,021,612 19.4 959,787 17.8 10.4 0.5 4,471,609 -
2012 1,255,035 14.6 695,368 15.4 10.9 0.6 1,670,729 -
2011 1,075,153 16.2 570,239 16.9 11.0 0.5 1,604,093 -
2010 1,660,599 15.1 1,003,198 16.2 11.2 0.6 2,888,773 -
2009 1,848,709 22.5 1,017,152 25.4 10.9 0.6 3,414,288 -
2008 1,127,632 17.6 623,055 17.9 10.9 0.6 1,416,166 -
2007 809,793 20.9 422,405 19.5 10.9 0.5 1,202,664 -
2006 1,110,253 28.8 511,690 27.2 10.8 0.5 1,960,933 -
2005 977,260 21.6 536,532 20.6 11.1 0.5 1,328,501 -
2004 969,985 23.2 625,932 22.5 11.4 0.6 1,023,307 -
2003 678,724 19.8 462,481 21.4 11.2 0.7 1,045,686 -
2002 913,852 21.0 595,860 21.5 11.6 0.7 623,815 -
2001 1,562,340 22.6 836,967 22.6 11.0 0.5 825,114 -
2000 1,961,242 17.8 1,287,295 19.7 11.4 0.7 1,648,043 -
4 Kingfish releases are not recorded to species; released number was calculated by assigning a ratio of observed kingfish by species to reported kingfish genus release estimates. PSEs are not available for this analysis.
Figure III.43 Southern Kingfish recreational catch in North Carolina by year.
0
200
400
600
800
1,000
1,200
1,400
1,600
1,800
0
1,000
2,000
3,000
4,000
5,000
6,000 Ha
rve
st (th
ou
san
ds o
f pou
nd
s)
Nu
mb
er
(th
ou
san
ds)
Year
Harvest Number
Released Number
Harvest Pounds

III-67
Table III.49 Southern Kingfish recreational catch by state, 2019.
State Harvest Number
PSE (num)
Harvest Pounds
PSE (lb)
Mean Length
(inches)
Mean Weight
(lb) Released Number5
PSE
(release)5
North Carolina 767,259 29.0 439,552 23.8 11.0 0.6 - -
Delaware 3,852 55.4 1,785 52.1 10.4 0.5 - -
Florida 911,999 34.9 619,630 27.7 11.8 0.7 - -
Georgia 2,507,027 16.8 1,094,839 15.7 10.2 0.4 - -
Maryland 5,017 54.9 2,663 68.9 11.0 0.5 - -
New Jersey 122,368 57.9 64,069 63.9 10.5 0.5 - -
New York 5,608 101.4 2,473 101.4 9.1 0.4 - -
South Carolina 895,889 18.2 514,300 19.6 11.0 0.6 - -
Virginia 862,128 30.9 509,176 34.7 11.1 0.6 - -
5 Released kingfish are not always recorded to species level. Numbers released are not shown by state.
Figure III.44 Southern Kingfish recreational catch by state, 2019.
0
200
400
600
800
1,000
1,200
0
500
1,000
1,500
2,000
2,500
3,000
NC DE FL GA MD NJ NY SC VA
Ha
rve
st (th
ou
san
ds o
f pou
nd
s)
Nu
mb
er
(th
ou
san
ds)
State
Harvest Number
Harvest Pounds

III-68
Table III.50 Spanish Mackerel recreational catch in North Carolina by year.
Year Harvest Number
PSE (num)
Harvest Pounds
PSE (lb)
Mean Length
(inches)
Mean Weight
(lb) Released
Number PSE
(release)
2019 1,478,890 19.6 1,694,247 22.4 15.0 1.1 1,340,366 21.8
2018 1,012,889 13.9 1,156,702 14.5 15.0 1.1 1,019,418 30.4
2017 995,706 18.0 1,094,778 18.3 14.8 1.1 688,062 21.4
2016 918,352 16.4 907,400 16.3 14.3 1.0 546,950 19.5
2015 835,011 14.3 981,867 15.6 14.7 1.2 514,714 17.7
2014 1,028,925 15.2 1,193,442 14.7 14.9 1.2 814,064 21.2
2013 994,599 15.2 1,242,029 16.5 15.1 1.2 685,692 26.1
2012 995,852 9.6 1,327,350 10.4 15.1 1.3 591,792 16.4
2011 854,554 15.0 1,100,110 20.0 15.0 1.3 479,586 15.5
2010 927,116 22.0 1,116,099 17.5 15.2 1.2 701,634 33.0
2009 1,480,931 13.5 2,155,692 19.4 15.8 1.5 752,806 20.7
2008 1,013,980 13.1 1,234,030 15.2 15.2 1.2 806,280 18.5
2007 604,518 15.2 799,263 16.5 15.4 1.3 340,027 16.5
2006 439,736 15.7 624,488 20.5 16.0 1.4 165,098 22.5
2005 561,073 16.1 526,054 16.6 14.6 0.9 303,641 19.9
2004 534,720 18.7 819,978 20.0 16.7 1.5 317,189 26.9
2003 540,399 15.3 641,024 14.5 14.8 1.2 266,887 17.1
2002 787,125 17.1 987,238 16.1 15.3 1.3 309,546 16.9
2001 942,500 25.0 1,155,788 24.7 15.5 1.2 338,918 37.0
2000 1,102,777 17.7 1,175,351 19.3 15.2 1.1 451,910 19.2
Figure III.45 Spanish Mackerel recreational catch in North Carolina by year.
0
500
1,000
1,500
2,000
2,500
0
200
400
600
800
1,000
1,200
1,400
1,600
Ha
rve
st (th
ou
san
ds o
f pou
nd
s)
Nu
mb
er
(th
ou
san
ds)
Year
Harvest Number
Released Number
Harvest Pounds
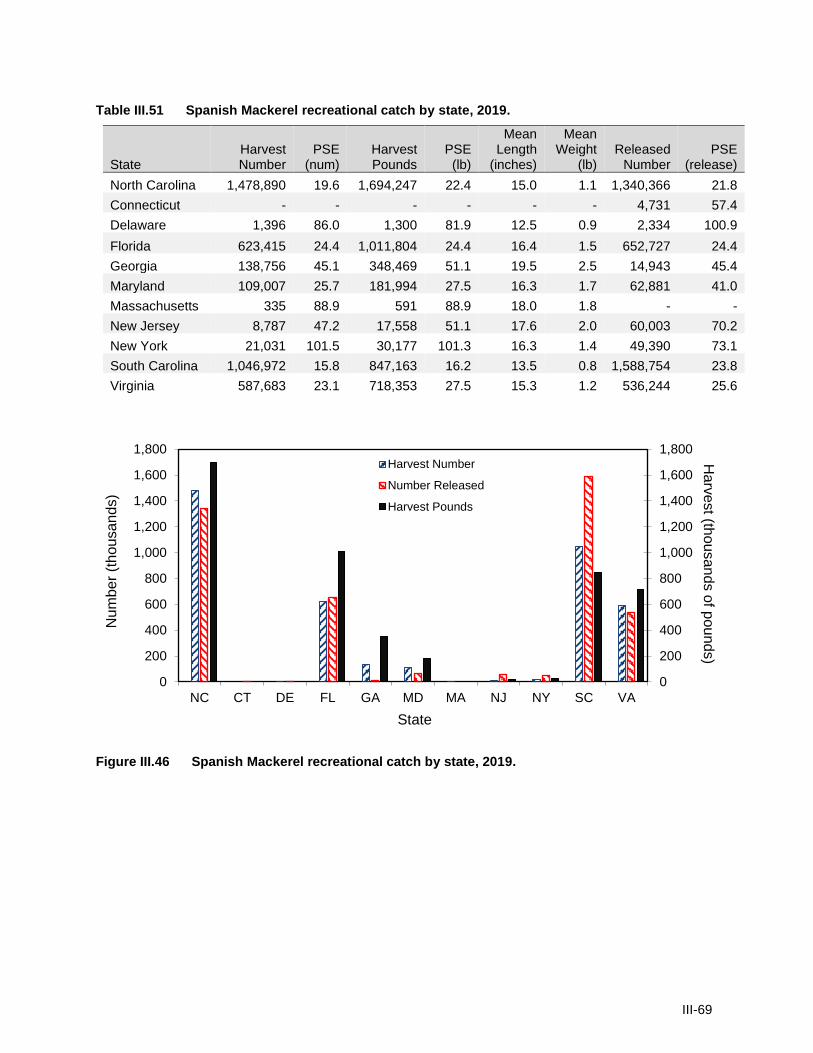
III-69
Table III.51 Spanish Mackerel recreational catch by state, 2019.
State Harvest Number
PSE (num)
Harvest Pounds
PSE (lb)
Mean Length
(inches)
Mean Weight
(lb) Released
Number
PSE
(release)
North Carolina 1,478,890 19.6 1,694,247 22.4 15.0 1.1 1,340,366 21.8
Connecticut - - - - - - 4,731 57.4
Delaware 1,396 86.0 1,300 81.9 12.5 0.9 2,334 100.9
Florida 623,415 24.4 1,011,804 24.4 16.4 1.5 652,727 24.4
Georgia 138,756 45.1 348,469 51.1 19.5 2.5 14,943 45.4
Maryland 109,007 25.7 181,994 27.5 16.3 1.7 62,881 41.0
Massachusetts 335 88.9 591 88.9 18.0 1.8 - -
New Jersey 8,787 47.2 17,558 51.1 17.6 2.0 60,003 70.2
New York 21,031 101.5 30,177 101.3 16.3 1.4 49,390 73.1
South Carolina 1,046,972 15.8 847,163 16.2 13.5 0.8 1,588,754 23.8
Virginia 587,683 23.1 718,353 27.5 15.3 1.2 536,244 25.6
Figure III.46 Spanish Mackerel recreational catch by state, 2019.
0
200
400
600
800
1,000
1,200
1,400
1,600
1,800
0
200
400
600
800
1,000
1,200
1,400
1,600
1,800
NC CT DE FL GA MD MA NJ NY SC VA
Ha
rve
st (th
ou
san
ds o
f pou
nd
s)
Nu
mb
er
(th
ou
san
ds)
State
Harvest Number
Number Released
Harvest Pounds

III-70
Table III.52 Spot recreational catch in North Carolina by year.
Year Harvest Number
PSE (num)
Harvest Pounds
PSE (lb)
Mean Length
(inches)
Mean Weight
(lb) Released
Number PSE
(release)
2019 2,822,884 27.6 851,998 27.7 7.7 0.3 2,356,120 27.3
2018 2,068,865 24.3 597,511 24.2 8.4 0.3 2,062,163 19.4
2017 2,418,331 44.8 909,796 50.8 8.1 0.4 1,902,281 28.2
2016 1,928,716 25.3 558,799 25.3 7.9 0.3 1,831,415 22.0
2015 2,572,738 19.6 833,390 20.6 8.1 0.3 2,984,629 15.3
2014 8,343,467 23.9 2,877,483 25.9 8.2 0.3 4,043,710 12.5
2013 6,120,985 15.7 1,789,251 17.5 7.9 0.3 5,513,732 12.1
2012 2,677,082 21.4 760,276 22.2 7.9 0.3 2,995,879 13.2
2011 6,480,714 19.5 2,201,947 20.7 8.2 0.3 4,993,544 11.5
2010 3,830,384 19.3 1,173,173 19.4 8.1 0.3 3,615,808 14.4
2009 4,197,640 20.3 1,427,956 20.1 8.4 0.3 4,847,202 12.6
2008 3,970,431 19.7 1,382,428 20.5 8.3 0.3 3,817,529 15.4
2007 8,728,295 21.3 2,737,144 20.9 9.1 0.3 4,049,250 17.3
2006 11,109,551 39.4 3,995,432 40.4 8.9 0.4 8,196,592 15.4
2005 10,105,205 19.2 3,652,186 19.8 8.4 0.4 4,407,100 16.2
2004 7,845,322 12.4 3,682,623 14.4 9.2 0.5 2,899,319 12.5
2003 9,717,824 17.7 4,220,534 17.3 8.7 0.4 2,970,990 13.0
2002 8,456,981 21.8 3,017,466 19.2 8.3 0.4 1,569,579 11.9
2001 10,043,845 15.1 4,519,545 15.9 8.8 0.4 2,804,349 16.2
2000 6,121,384 31.6 2,598,813 31.4 8.6 0.4 1,366,746 14.1
Figure III.47 Spot recreational catch in North Carolina by year.
0
500
1,000
1,500
2,000
2,500
3,000
3,500
4,000
4,500
5,000
0
2,000
4,000
6,000
8,000
10,000
12,000 Ha
rve
st (th
ou
san
ds o
f pou
nd
s)
Nu
mb
er
(th
ou
san
ds)
Year
Harvest Number
Released Number
Harvest Pounds
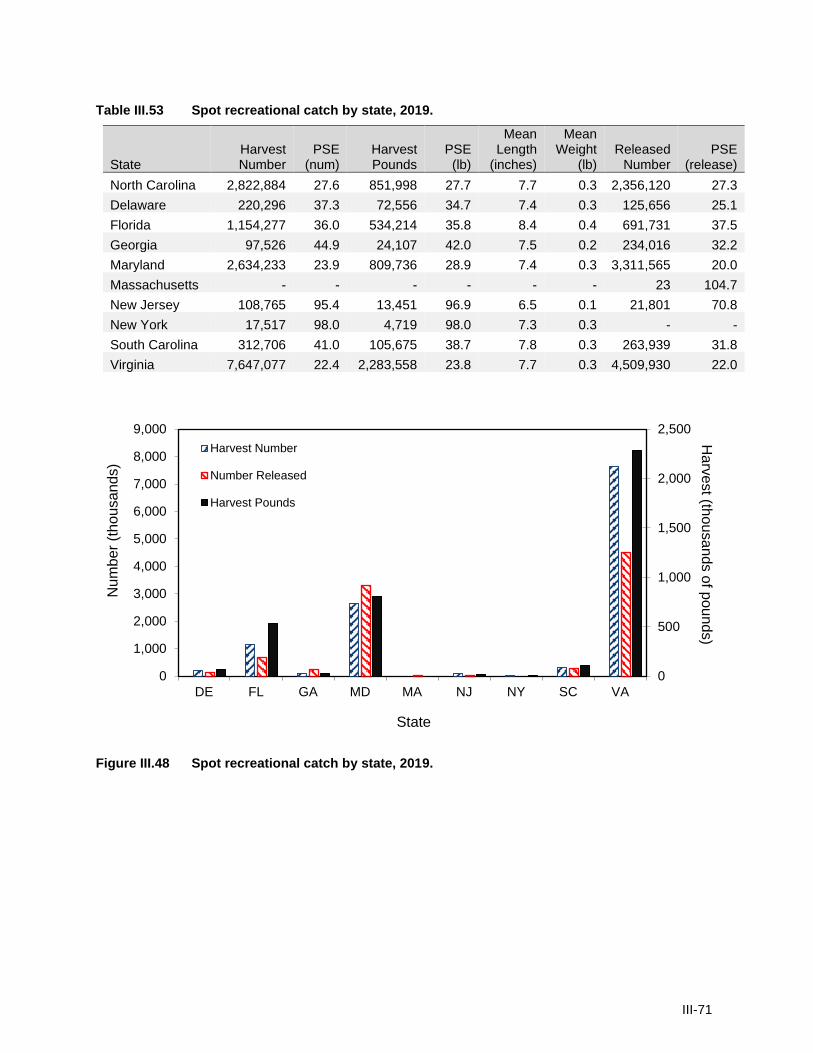
III-71
Table III.53 Spot recreational catch by state, 2019.
State Harvest Number
PSE (num)
Harvest Pounds
PSE (lb)
Mean Length
(inches)
Mean Weight
(lb) Released
Number
PSE
(release)
North Carolina 2,822,884 27.6 851,998 27.7 7.7 0.3 2,356,120 27.3
Delaware 220,296 37.3 72,556 34.7 7.4 0.3 125,656 25.1
Florida 1,154,277 36.0 534,214 35.8 8.4 0.4 691,731 37.5
Georgia 97,526 44.9 24,107 42.0 7.5 0.2 234,016 32.2
Maryland 2,634,233 23.9 809,736 28.9 7.4 0.3 3,311,565 20.0
Massachusetts - - - - - - 23 104.7
New Jersey 108,765 95.4 13,451 96.9 6.5 0.1 21,801 70.8
New York 17,517 98.0 4,719 98.0 7.3 0.3 - -
South Carolina 312,706 41.0 105,675 38.7 7.8 0.3 263,939 31.8
Virginia 7,647,077 22.4 2,283,558 23.8 7.7 0.3 4,509,930 22.0
Figure III.48 Spot recreational catch by state, 2019.
0
500
1,000
1,500
2,000
2,500
0
1,000
2,000
3,000
4,000
5,000
6,000
7,000
8,000
9,000
DE FL GA MD MA NJ NY SC VA
Ha
rve
st (th
ou
san
ds o
f pou
nd
s)
Nu
mb
er
(th
ou
san
ds)
State
Harvest Number
Number Released
Harvest Pounds
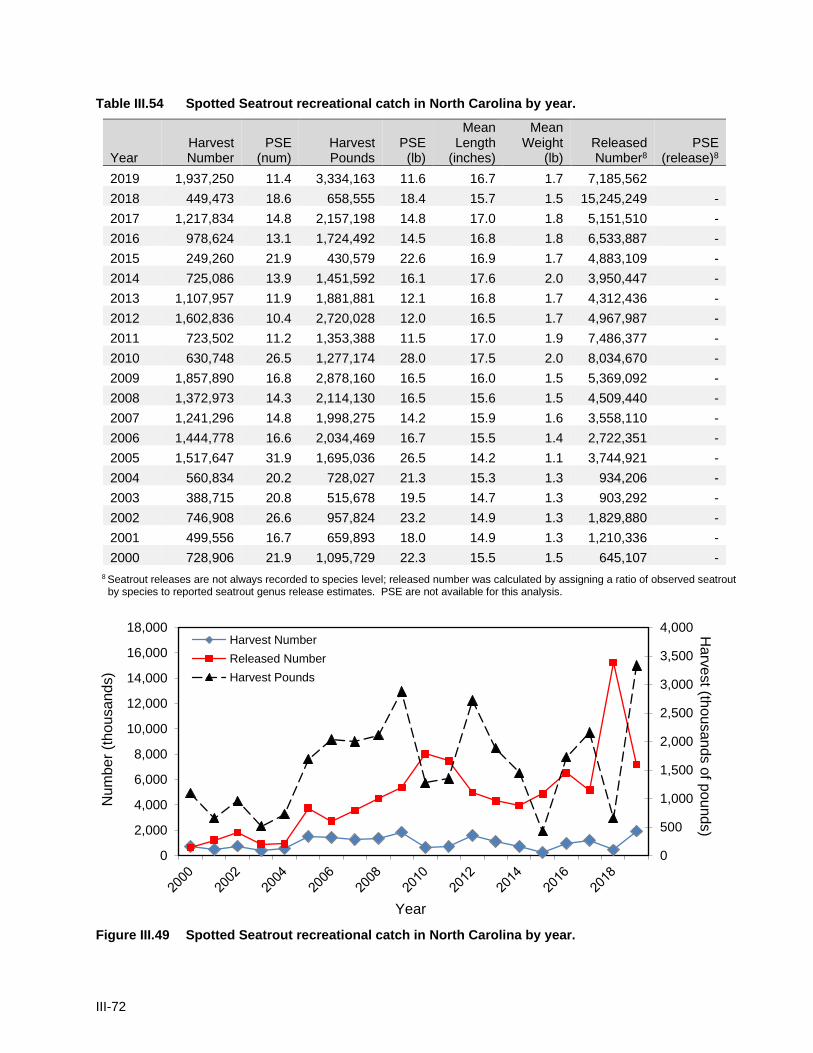
III-72
Table III.54 Spotted Seatrout recreational catch in North Carolina by year.
Year Harvest Number
PSE (num)
Harvest Pounds
PSE (lb)
Mean Length
(inches)
Mean Weight
(lb) Released Number8
PSE (release)8
2019 1,937,250 11.4 3,334,163 11.6 16.7 1.7 7,185,562
2018 449,473 18.6 658,555 18.4 15.7 1.5 15,245,249 -
2017 1,217,834 14.8 2,157,198 14.8 17.0 1.8 5,151,510 -
2016 978,624 13.1 1,724,492 14.5 16.8 1.8 6,533,887 -
2015 249,260 21.9 430,579 22.6 16.9 1.7 4,883,109 -
2014 725,086 13.9 1,451,592 16.1 17.6 2.0 3,950,447 -
2013 1,107,957 11.9 1,881,881 12.1 16.8 1.7 4,312,436 -
2012 1,602,836 10.4 2,720,028 12.0 16.5 1.7 4,967,987 -
2011 723,502 11.2 1,353,388 11.5 17.0 1.9 7,486,377 -
2010 630,748 26.5 1,277,174 28.0 17.5 2.0 8,034,670 -
2009 1,857,890 16.8 2,878,160 16.5 16.0 1.5 5,369,092 -
2008 1,372,973 14.3 2,114,130 16.5 15.6 1.5 4,509,440 -
2007 1,241,296 14.8 1,998,275 14.2 15.9 1.6 3,558,110 -
2006 1,444,778 16.6 2,034,469 16.7 15.5 1.4 2,722,351 -
2005 1,517,647 31.9 1,695,036 26.5 14.2 1.1 3,744,921 -
2004 560,834 20.2 728,027 21.3 15.3 1.3 934,206 -
2003 388,715 20.8 515,678 19.5 14.7 1.3 903,292 -
2002 746,908 26.6 957,824 23.2 14.9 1.3 1,829,880 -
2001 499,556 16.7 659,893 18.0 14.9 1.3 1,210,336 -
2000 728,906 21.9 1,095,729 22.3 15.5 1.5 645,107 -
8 Seatrout releases are not always recorded to species level; released number was calculated by assigning a ratio of observed seatrout by species to reported seatrout genus release estimates. PSE are not available for this analysis.
Figure III.49 Spotted Seatrout recreational catch in North Carolina by year.
0
500
1,000
1,500
2,000
2,500
3,000
3,500
4,000
0
2,000
4,000
6,000
8,000
10,000
12,000
14,000
16,000
18,000 Ha
rve
st (th
ou
san
ds o
f pou
nd
s)
Nu
mb
er
(th
ou
san
ds)
Year
Harvest Number
Released Number
Harvest Pounds

III-73
Table III.55 Spotted Seatrout recreational catch by state, 2019.
State Harvest Number
PSE (num)
Harvest Pounds
PSE (lb)
Mean Length
(inches)
Mean Weight
(lb) Released Number9
PSE
(release)9
North Carolina 1,937,250 11.4 3,334,163 11.6 16.7 1.7 - -
Delaware 4,644 106.2 10,878 106.2 18.3 2.3
Florida 620,337 18.7 1,033,847 18.0 16.7 1.6 - -
Georgia 1,008,284 22.6 1,440,368 23.0 15.4 1.4 - -
Maryland 36,314 50.8 61,935 51.1 16.5 1.7 - -
South Carolina 813,548 27.2 1,238,834 30.0 16.1 1.5 - -
Virginia 596,428 24.8 1,256,916 26.4 17.9 2.1 - -
9 Released seatrout are not always recorded to species level. Numbers released are not shown by state.
Figure III.50 Spotted Seatrout recreational catch by state, 2019.
0
500
1,000
1,500
2,000
2,500
3,000
3,500
4,000
0
500
1,000
1,500
2,000
2,500
NC DE FL GA MD SC VA
Ha
rve
st (th
ou
san
ds o
f pou
nd
s)
Nu
mb
er
(th
ou
san
ds)
State
Harvest Number
Harvest Pounds

III-74
Table III.56 Striped Bass10 recreational catch in North Carolina by year.
Year Harvest Number
PSE (num)
Harvest Pounds
PSE (lb)
Mean Length
(inches)
Mean Weight
(lb) Released
Number PSE
(release)
2019 - - - - - - 4,521 52.6
2018 25 99.1 366 99.1 15,850 47.6
2017 - - - - - - 48,410 43.1
2016 4,177 102.0 15,961 102.0 - - 84,545 41.0
2015 - - - - - - - -
2014 - - - - - - 2,122 100.5
2013 - - - - - - 5,840 63.6
2012 - - - - - - 7,301 78.1
2011 207,610 20.1 4,467,159 19.9 35.9 21.5 234,250 27.7
2010 72,941 38.5 1,294,743 36.7 33.9 17.8 58,858 41.3
2009 6,548 46.8 186,729 45.6 39.6 28.5 16,857 66.7
2008 36,750 36.9 746,511 36.1 35.5 20.3 27,512 52.3
2007 79,668 33.9 1,921,009 34.3 38.3 24.4 28,088 40.4
2006 131,300 43.9 2,914,151 44.4 36.2 22.2 44,907 36.4
2005 200,468 23.0 4,112,555 23.9 35.8 20.3 210,903 37.3
2004 378,498 19.5 7,845,228 20.1 35.6 20.6 387,810 25.3
2003 53,733 38.5 1,004,754 42.6 36.0 19.2 59,799 35.2
2002 60,773 24.9 1,047,529 25.3 33.0 17.7 86,417 24.1
2001 104,177 32.0 1,762,856 36.5 34.0 17.9 77,728 39.5
2000 22,833 32.1 319,604 37.4 32.1 15.3 165,167 22.2
10 Includes Striped Bass harvested from the Atlantic Ocean during Waves 1 and 6 only.
Figure III.51 Striped Bass recreational catch in North Carolina from the Atlantic Ocean by year.
0
1,000
2,000
3,000
4,000
5,000
6,000
7,000
8,000
9,000
0
50
100
150
200
250
300
350
400
450 Ha
rve
st (th
ou
san
ds o
f pou
nd
s)
Nu
mb
er
(th
ou
san
ds)
Year
Harvest Number
Released Number
Harvest Pounds

III-75
Table III.57 Striped Bass10 recreational catch by state, 2019.
State Harvest Number
PSE (num)
Harvest Pounds
PSE (lb)
Mean Length
(inches)
Mean Weight
(lb) Released
Number
PSE
(release)
North Carolina - - - - - - 4,521 52.6
Connecticut 3,431 48.9 48,724 51.2 - - 205,474 42.2
Delaware 5,185 96.0 20,450 96.0 21.3 3.9 37,454 38.8
Maine 21,370 63.4 258,996 55.9 - - 360,694 27.5
Maryland 1,033 74.6 7,322 62.6 24.5 7.1 3,286 84.1
Massachusetts 35,140 26.9 527,138 26.8 - - 1,072,386 16.6
New Hampshire 13,798 33.4 282,184 35.8 - - 142,165 31.7
New Jersey 121,398 25.9 2,316,316 27.1 33.3 17.2 926,178 28.4
New York 183,675 42.5 3,457,256 44.4 34.1 17.6 3,503,435 25.2
Rhode Island 25,530 37.0 370,237 29.4 - - 1,537,781 22.2
10 Includes Striped Bass harvested from the Atlantic Ocean during Waves 1 and 6 only.
Figure III.52 Striped Bass recreational catch from the Atlantic Ocean by state, 2019.
0
500
1,000
1,500
2,000
2,500
3,000
3,500
4,000
0
500
1,000
1,500
2,000
2,500
3,000
3,500
4,000
NC CT DE ME MD MA NH NJ NY RI
Ha
rve
st (th
ou
san
ds o
f pou
nd
s)N
um
be
r (t
hou
san
ds)
State
Harvest Number
Number Released
Harvest Pounds

III-76
Table III.58 Summer Flounder recreational catch in North Carolina by year.
Year Harvest Number
PSE (num)
Harvest Pounds
PSE (lb)
Mean Length
(inches)
Mean Weight
(lb) Released Number11
PSE (release)11
2019 34,895 31.7 52,872 31.2 15.9 1.5 467,942
2018 57,913 25.6 92,032 25.4 15.9 1.6 300,195 -
2017 91,193 28.2 147,426 28.7 16.2 1.6 977,285 -
2016 65,494 27.2 110,392 27.1 16.2 1.7 664,388 -
2015 99,263 23.3 157,437 23.6 16.0 1.6 856,849 -
2014 150,201 21.3 215,294 21.6 15.7 1.4 1,478,527 -
2013 123,742 18.9 196,002 19.1 16.0 1.6 1,359,319 -
2012 176,553 16.5 287,522 16.4 16.3 1.6 1,452,828 -
2011 186,877 15.9 311,573 15.9 16.2 1.7 1,009,389 -
2010 245,839 14.8 341,310 14.2 15.5 1.4 1,486,980 -
2009 219,321 23.7 307,692 23.2 15.7 1.4 1,894,409 -
2008 88,501 17.5 132,743 18.0 15.7 1.5 939,708 -
2007 251,068 18.5 379,387 19.9 15.6 1.5 1,299,735 -
2006 254,653 18.3 326,684 17.5 15.3 1.3 977,039 -
2005 202,797 22.6 289,495 23.2 15.5 1.4 734,860 -
2004 318,632 22.2 467,869 26.0 15.7 1.5 1,283,788 -
2003 177,360 19.2 273,895 19.3 15.3 1.5 763,794 -
2002 366,467 14.4 435,113 14.1 14.7 1.2 1,376,069 -
2001 424,615 11.2 577,139 11.5 15.1 1.4 1,836,338 -
2000 611,081 13.2 780,211 13.0 15.2 1.3 2,007,411 -
11 Flounder releases are not recorded to species; released number was calculated by assigning a ratio of observed flounder by species to reported flounder genus release estimates. PSEs are not available for this analysis.
Figure III.53 Summer Flounder recreational catch in North Carolina by year.
0
100
200
300
400
500
600
700
800
900
0
500
1,000
1,500
2,000
2,500 Ha
rve
st (th
ou
san
ds o
f pou
nd
s)
Nu
mb
er
(th
ou
san
ds)
Year
Harvest Number
Released Number
Harvest Pounds

III-77
Table III.59 Summer Flounder recreational catch by state, 2019.
State Harvest Number
PSE (num)
Harvest Pounds
PSE (lb)
Mean Length
(inches)
Mean Weight
(lb) Released Number12
PSE
(release)12
North Carolina 57,913 25.6 92,032 25.4 15.9 1.6 - -
Connecticut 153,091 24.3 549,268 23.0 20.8 3.6 - -
Delaware 85,239 17.2 205,380 16.8 18.3 2.4 - -
Florida 530 100.1 2,096 100.1 16.5 1.7 - -
Georgia 9,943 80.7 19,637 73.2 16.1 2.0 - -
Maryland 48,279 31.3 121,760 35.7 17.5 2.5 - -
Massachusetts 67,302 31.0 142,540 26.3 17.1 2.1 - -
New Jersey 1,045,198 13.4 3,154,540 15.7 19.7 3.0 - -
New York 641,186 13.8 2,385,310 14.2 21.2 3.7 - -
Rhode Island 168,580 25.1 603,752 23.3 20.9 3.6 - -
South Carolina 4,197 48.9 6,149 47.9 14.8 1.5 - -
Virginia 145,726 23.1 345,064 26.0 18.6 2.4 - -
12 Released flounder are not always recorded to species level. Numbers released are not shown by state.
Figure III.54 Summer Flounder recreational catch by state, 2019.
0
500
1,000
1,500
2,000
2,500
3,000
3,500
0
200
400
600
800
1,000
1,200
NC CT DE FL GA MD MA NJ NY RI SC VA
Ha
rve
st (th
ou
san
ds o
f pou
nd
s)
Nu
mb
er
(th
ou
san
ds)
State
Harvest Number
Harvest Pounds

III-78
Table III.60 Wahoo recreational catch in North Carolina by year.
Year Harvest Number
PSE (num)
Harvest Pounds
PSE (lb)
Mean Length
(inches)
Mean Weight
(lb) Released
Number PSE
(release)
2019 17,098 17.6 454,391 17.2 47.1 26.6 23 100.3
2018 10,690 26.3 280,644 25.3 47.7 26.3 182 94.2
2017 30,305 29.1 842,604 31.0 48.8 27.8 - -
2016 39,565 21.9 1,056,969 22.8 48.1 26.7 5 110.2
2015 36,920 25.2 983,232 23.2 47.9 26.6 608 101.3
2014 29,362 26.9 804,473 27.5 48.2 27.4 22 103.4
2013 11,951 26.7 319,866 25.9 48.4 26.8 337 97.9
2012 37,423 14.9 994,195 15.0 48.2 26.6 12 99.7
2011 21,501 27.9 611,319 32.0 49.0 28.4 40 99.7
2010 19,703 23.1 571,575 26.4 49.0 29.0 2,532 69.6
2009 42,129 57.9 1,696,717 67.5 53.6 40.3 48 97.9
2008 21,777 26.4 527,736 25.5 46.1 24.2 - -
2007 47,890 43.2 1,495,127 56.1 50.4 31.2 - -
2006 21,834 21.8 490,904 23.1 45.0 22.5 594 63.8
2005 41,364 45.8 1,249,160 47.6 48.1 30.2 - -
2004 61,153 51.0 2,220,765 55.8 52.3 36.3 - -
2003 21,274 37.6 662,567 34.6 48.2 31.1 - -
2002 32,783 20.6 1,056,010 25.0 48.0 32.2 398 99.9
2001 17,889 28.9 473,926 30.6 46.1 26.5 - -
2000 18,183 24.7 412,824 25.6 44.9 22.7 1,126 97.4
Figure III.55 Wahoo recreational catch in North Carolina by year.
0
500
1,000
1,500
2,000
2,500
0
10
20
30
40
50
60
70
Ha
rve
st (th
ou
san
ds o
f pou
nd
s)
Nu
mb
er
(th
ou
san
ds)
Year
Harvest Number
Released Number
Harvest Pounds

III-79
Table III.61 Wahoo recreational catch by state, 2019.
State Harvest Number
PSE (num)
Harvest Pounds
PSE (lb)
Mean Length
(inches)
Mean Weight
(lb) Released
Number
PSE
(release)
North Carolina 17,098 17.6 454,391 17.2 47.1 26.6 23 100.3
Florida 31,379 42.0 1,154,555 43.7 52.9 34.8 - -
New Jersey 633 102.8 32,944 102.8 58.5 52.0 - -
South Carolina 8,206 91.7 331,040 91.7 56.0 40.3 - -
Virginia 3,359 74.5 110,770 75.6 51.5 33.0 - -
Figure III.56 Wahoo recreational catch by state, 2019.
0
200
400
600
800
1,000
1,200
1,400
0
5
10
15
20
25
30
35
NC FL NJ SC VA
Ha
rve
st (th
ou
san
ds o
f pou
nd
s)
Nu
mb
er
(th
ou
san
ds)
State
Harvest Number
Number Released
Harvest Pounds

III-80
Table III.62 Weakfish recreational catch in North Carolina by year.
Year Harvest Number
PSE (num)
Harvest Pounds
PSE (lb)
Mean Length
(inches)
Mean Weight
(lb) Released Number8
PSE (release)8
2019 39,061 21.4 43,252 22.0 14.5 1.1 269,146 -
2018 30,935 39.5 29,924 40.5 13.4 1.0 299,496 -
2017 51,795 23.6 55,944 26.5 14.2 1.1 351,613 -
2016 77,341 25.8 83,702 26.3 14.0 1.1 1,097,615 -
2015 143,543 26.6 157,269 26.5 14.0 1.1 1,652,582 -
2014 71,912 24.8 70,988 24.5 13.8 1.0 1,067,344 -
2013 63,090 24.2 66,720 23.2 14.2 1.1 257,367 -
2012 96,947 26.4 95,952 22.0 13.8 1.0 396,620 -
2011 48,727 24.9 62,543 26.6 14.7 1.3 380,366 -
2010 110,770 16.9 103,903 17.4 13.6 0.9 914,004 -
2009 204,814 23.5 245,358 28.8 14.8 1.2 626,742 -
2008 203,779 22.0 209,470 22.8 13.8 1.0 470,805 -
2007 191,192 19.7 202,583 19.8 14.2 1.1 600,987 -
2006 343,092 18.1 302,775 19.6 13.6 0.9 1,047,135 -
2005 297,605 19.5 281,710 20.0 14.0 0.9 702,685 -
2004 395,268 18.5 428,627 18.4 14.5 1.1 614,762 -
2003 291,168 18.4 309,412 17.6 14.1 1.1 422,294 -
2002 214,040 21.8 215,402 23.8 13.9 1.0 917,803 -
2001 317,974 19.0 325,447 20.1 14.1 1.0 2,831,044 -
2000 147,397 19.2 179,599 20.1 14.8 1.2 852,262 -
8 Seatrout releases are not recorded to species; released number was calculated by assigning a ratio of observed seatrout by species to reported seatrout genus release estimates. PSEs are not available for this analysis.
Figure III.57 Weakfish recreational catch in North Carolina by year.
0
50
100
150
200
250
300
350
400
450
500
0
500
1,000
1,500
2,000
2,500
3,000 Ha
rve
st (th
ou
san
ds o
f pou
nd
s)
Nu
mb
er
(th
ou
san
ds)
Year
Harvest Number
Released Number
Harvest Pounds

III-81
Table III.63 Weakfish recreational catch by state, 2019.
State Harvest Number
PSE (num)
Harvest Pounds
PSE (lb)
Mean Length
(inches)
Mean Weight
(lb) Released Number9
PSE
(release)9
North Carolina 39,061 21.4 43,252 22.0 14.5 1.1 - -
Connecticut 2,535 94.5 8,238 96.1 21.9 3.2 - -
Delaware 9,565 53.2 13,941 58.3 16.3 1.5 - -
Florida 53,494 97.0 47,249 96.8 13.1 0.9 - -
Georgia 3,961 57.4 4,538 61.0 13.8 1.1 - -
Maryland 7,191 57.1 9,602 59.2 14.5 1.3 - -
New Jersey 35,089 64.1 38,886 63.6 14.3 1.1 - -
New York 36,672 37.9 75,405 36.4 18.0 2.1 - -
South Carolina 57,772 30.0 72,949 34.2 14.8 1.3 - -
Virginia 38,292 32.3 30,573 30.0 13.1 0.8 - -
9 Released seatrout are not always recorded to species level. Numbers released are not shown by state.
Figure III.58 Weakfish recreational catch by state, 2019.
0
10
20
30
40
50
60
70
80
0
10
20
30
40
50
60
70
NC CT DE FL GA MD NJ NY SC VA
Ha
rve
st (th
ou
san
ds o
f pou
nd
s)
Num
ber
(thousands)
State
Harvest Number
Harvest Pounds
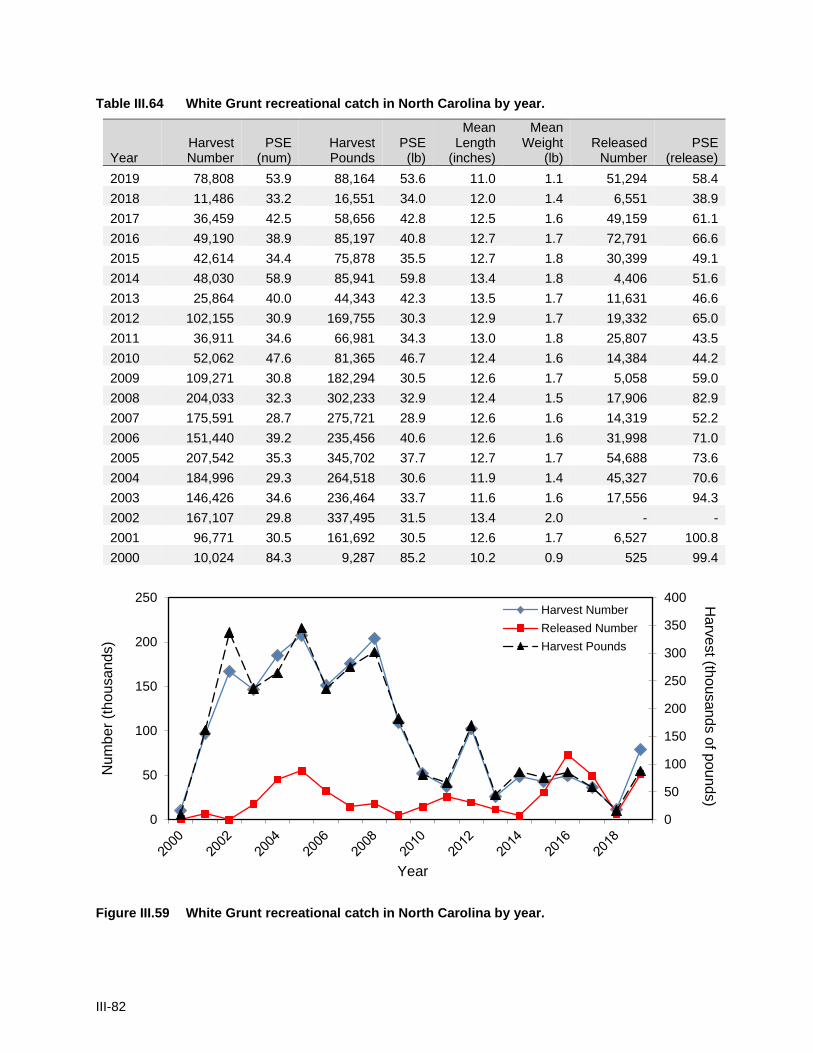
III-82
Table III.64 White Grunt recreational catch in North Carolina by year.
Year Harvest Number
PSE (num)
Harvest Pounds
PSE (lb)
Mean Length
(inches)
Mean Weight
(lb) Released
Number PSE
(release)
2019 78,808 53.9 88,164 53.6 11.0 1.1 51,294 58.4
2018 11,486 33.2 16,551 34.0 12.0 1.4 6,551 38.9
2017 36,459 42.5 58,656 42.8 12.5 1.6 49,159 61.1
2016 49,190 38.9 85,197 40.8 12.7 1.7 72,791 66.6
2015 42,614 34.4 75,878 35.5 12.7 1.8 30,399 49.1
2014 48,030 58.9 85,941 59.8 13.4 1.8 4,406 51.6
2013 25,864 40.0 44,343 42.3 13.5 1.7 11,631 46.6
2012 102,155 30.9 169,755 30.3 12.9 1.7 19,332 65.0
2011 36,911 34.6 66,981 34.3 13.0 1.8 25,807 43.5
2010 52,062 47.6 81,365 46.7 12.4 1.6 14,384 44.2
2009 109,271 30.8 182,294 30.5 12.6 1.7 5,058 59.0
2008 204,033 32.3 302,233 32.9 12.4 1.5 17,906 82.9
2007 175,591 28.7 275,721 28.9 12.6 1.6 14,319 52.2
2006 151,440 39.2 235,456 40.6 12.6 1.6 31,998 71.0
2005 207,542 35.3 345,702 37.7 12.7 1.7 54,688 73.6
2004 184,996 29.3 264,518 30.6 11.9 1.4 45,327 70.6
2003 146,426 34.6 236,464 33.7 11.6 1.6 17,556 94.3
2002 167,107 29.8 337,495 31.5 13.4 2.0 - -
2001 96,771 30.5 161,692 30.5 12.6 1.7 6,527 100.8
2000 10,024 84.3 9,287 85.2 10.2 0.9 525 99.4
Figure III.59 White Grunt recreational catch in North Carolina by year.
0
50
100
150
200
250
300
350
400
0
50
100
150
200
250 Ha
rve
st (th
ou
san
ds o
f pou
nd
s)
Nu
mb
er
(th
ou
san
ds)
Year
Harvest Number
Released Number
Harvest Pounds

III-83
Table III.65 White Grunt recreational catch by state, 2019.
State Harvest Number
PSE (num)
Harvest Pounds
PSE (lb)
Mean Length
(inches)
Mean Weight
(lb) Released
Number
PSE
(release)
North Carolina 78,808 53.9 88,164 53.6 11.0 1.1 51,294 58.4
Florida 337,076 32.6 194,853 30.9 10.3 0.8 298,981 26.2
Georgia 649 69.7 1,907 84.2 13.7 2.9 - -
South Carolina 55,322 51.0 51,819 37.2 10.1 0.9 55,896 44.3
Figure III.60 White Grunt recreational catch by state, 2019.
0
50
100
150
200
250
0
50
100
150
200
250
300
350
400
NC FL GA SC
Ha
rve
st (th
ou
san
ds o
f pou
nd
s)Nu
mb
er
(th
ou
san
ds)
State
Harvest Number
Number Released
Harvest Pounds

III-84
Table III.66 Yellowfin Tuna recreational catch in North Carolina by year.
Year Harvest Number
PSE (num)
Harvest Pounds
PSE (lb)
Mean Length
(inches)
Mean Weight
(lb) Released
Number PSE
(release)
2019 44,864 20.4 1,190,484 20.0 33.9 26.5 2,333 53.2
2018 61,171 31.3 1,977,741 27.1 36.2 32.3 3,739 46.0
2017 118,659 22.2 4,040,504 20.2 37.7 34.1 17,812 29.2
2016 80,458 23.2 3,164,911 24.1 39.3 39.3 28,643 63.7
2015 38,199 25.2 1,079,798 24.5 35.0 28.3 2,196 44.0
2014 44,151 24.8 1,392,966 24.8 36.5 31.6 7,460 36.7
2013 52,907 18.1 1,705,605 19.5 37.0 32.2 1,229 51.4
2012 70,288 24.2 1,929,343 23.8 34.8 27.4 8,975 49.5
2011 33,360 26.2 1,066,616 25.0 37.0 32.0 663 63.3
2010 41,652 28.4 1,521,261 29.5 39.6 36.5 767 56.8
2009 36,066 26.0 959,832 23.1 34.4 26.6 1,472 82.8
2008 21,824 31.9 610,660 31.1 34.5 28.0 65 74.1
2007 144,826 24.3 3,886,004 22.3 35.1 26.8 499 86.1
2006 244,825 18.2 7,182,919 18.3 35.6 29.3 16,727 33.8
2005 243,895 21.5 7,080,724 23.9 35.5 29.0 11,865 31.6
2004 209,747 22.0 5,379,213 19.5 33.8 25.6 10,183 29.0
2003 185,148 19.5 4,997,756 20.5 33.3 27.0 27,510 36.1
2002 149,407 27.0 3,396,466 25.5 32.2 22.7 8,926 67.8
2001 170,808 17.2 5,028,308 16.8 34.5 29.4 238 54.6
2000 175,812 17.5 5,110,592 17.7 35.2 29.1 4,245 40.8
Figure III.61 Yellowfin Tuna recreational catch in North Carolina by year.
0
1,000
2,000
3,000
4,000
5,000
6,000
7,000
8,000
0
50
100
150
200
250
300
Ha
rve
st (th
ou
san
ds o
f pou
nd
s)
Nu
mb
er
(th
ou
san
ds)
Year
Harvest Number
Released Number
Harvest Pounds

III-85
Table III.67 Yellowfin Tuna recreational catch by state, 2019.
State Harvest Number
PSE (num)
Harvest Pounds
PSE (lb)
Mean Length
(inches)
Mean Weight
(lb) Released
Number
PSE
(release)
North Carolina 44,864 20.4 1,190,484 20.0 33.9 26.5 2,333 53.2
Connecticut - - - - - - 8,768 84.4
Delaware 344 97.1 9,825 97.1 34.6 28.5 - -
Maryland 34,064 45.1 879,311 45.9 33.4 25.8 19,885 62.4
Massachusetts 93 49.7 2,880 49.7 32.3 30.9 275 57.1
New Jersey 19,275 49.7 633,782 46.0 36.4 32.9 6,466 62.4
New York 3,333 89.0 115,059 89.4 37.1 34.5 7,706 67.7
Rhode Island 16 91.1 493 91.1 32.3 30.9 8 91.1
Virginia 8,561 48.9 251,379 48.5 34.8 29.4 790 100.9
Figure III.62 Yellowfin Tuna recreational catch by state, 2019.
0
200
400
600
800
1,000
1,200
1,400
0
5
10
15
20
25
30
35
40
45
50
NC CT DE MD MA NJ NY RI VA
Ha
rve
st (th
ou
san
ds o
f pou
nd
s)
Nu
mb
er
(th
ou
san
ds)
State
Harvest Number
Number Released
Harvest Pounds

III-86
Table III.68 Large coastal shark recreational catch in North Carolina by year.
Year Harvest Number
PSE (num)
Harvest Pounds
PSE (lb)
Mean Length
(inches)13
Mean Weight
(lb)13
Released Number
PSE (release)
2019 60 72.1 3,745 72.1 - - 26,010 44.0
2018 7 95.8 235 95.8 - - 3,845 70.4
2017 910 79.6 27,367 83.4 - - 43,041 43.7
2016 12 101.0 1,100 101.0 - - 27,885 54.3
2015 25 72.8 2,667 101.3 - - 139,486 66.1
2014 556 89.4 10,194 91.4 - - 16,306 42.2
2013 59 113.4 11,128 113.4 - - 7,976 39.7
2012 1,283 99.7 1,997 70.7 - - 18,205 77.8
2011 474 100.0 732 100.0 - - 14,797 88.8
2010 120 102.8 211 102.8 - - 24,902 56.9
2009 - - - - - - 5,837 96.3
2008 51 103.6 794 103.6 - - - -
2007 2,543 68.0 30,985 69.7 - - 32,680 45.0
2006 187 101.3 10,744 101.3 - - 13,825 66.2
2005 859 95.6 50,494 95.6 - - 10,540 50.2
2004 - - - - - - 411 99.9
2003 863 67.0 8,931 65.3 - - 1,177 70.2
2002 442 98.7 1,837 98.7 - - 1,134 69.3
2001 2,166 87.6 28,312 56.8 - - 163 87.2
2000 1,764 50.1 46,249 63.2 - - - -
13 Multiple species of sharks are reported for this category, mean length and weight by individual species of shark are available upon request.
Figure III.63 Large coastal shark recreational catch in North Carolina by year.
0
20
40
60
80
100
120
0
20
40
60
80
100
120
140
160
Ha
rve
st (th
ou
san
ds o
f pou
nd
s)
Nu
mb
er
(th
ou
san
ds)
Year
Harvest Number
Released Number
Harvest Pounds

III-87
Table III.69 Large coastal shark recreational catch by state, 2019.
State Harvest Number
PSE (num)
Harvest Pounds
PSE (lb)
Mean Length
(inches)13
Mean Weight
(lb)13
Released Number
PSE
(release)
North Carolina 60 72.1 3,745 72.1 - - 26,010 44.0
Connecticut - - - - - - 300 105.2
Delaware - - - - - - 7,464 36.2
Florida - - - - - - 115,387 27.2
Georgia - - - - - - 206,370 35.3
Maryland - - - - - - 8,393 60.8
Massachusetts - - - - - - 1,074 90.9
New Jersey - - - - - - 60,689 45.4
New York - - - - - - 4,788 66.7
Rhode Island - - - - - - 28 107.2
South Carolina 157 95.5 1,730 95.5 - - 121,404 30.2
Virginia 792 73.9 - - - - 65,187 53.4
13 Multiple species of sharks are reported for this category, mean length and weight by individual species of shark are available upon request.
Figure III.64 Large coastal shark recreational catch by state, 2019.
0
1
1
2
2
3
3
4
4
0
50
100
150
200
250
NC CT DE FL GA MD MA NJ NY RI SC VA
Ha
rve
st (th
ou
san
ds o
f pou
nd
s)
Nu
mb
er
(th
ou
san
ds)
State
Harvest Number
Number Released
Harvest Pounds

III-88
Table III.70 Small coastal shark recreational catch in North Carolina by year.
Year Harvest Number
PSE (num)
Harvest Pounds
PSE (lb)
Mean Length
(inches)13
Mean Weight
(lb)13
Released Number
PSE (release)
2019 13,736 70.8 106,765 75.8 - - 34,952 36.1
2018 1,678 38.9 9,097 40.9 - - 4,496 39.5
2017 5,768 56.5 19,256 42.3 - - 58,440 60.5
2016 514 66.6 2,545 63.4 - - 133,214 57.0
2015 6,656 41.3 38,499 44.3 - - 15,866 70.4
2014 7,420 56.7 24,060 43.9 - - 2,043 57.5
2013 2,171 45.9 13,474 48.0 - - 16,772 42.1
2012 2,082 47.5 11,804 48.4 - - 7,733 43.5
2011 1,209 42.5 7,659 44.0 - - 37,276 33.1
2010 4,654 46.5 21,878 37.1 - - 107,135 66.6
2009 5,532 41.1 51,183 48.7 - - 5,334 62.7
2008 5,421 62.9 30,675 60.8 - - - -
2007 6,784 50.9 47,902 48.9 - - 5,631 72.2
2006 7,640 69.9 51,377 68.8 - - 58,571 38.8
2005 1,682 90.4 15,014 92.5 - - 3,519 81.2
2004 3,291 58.0 24,421 59.8 - - - -
2003 12,658 72.7 85,339 67.2 - - - -
2002 2,184 46.7 16,620 48.9 - - - -
2001 4,285 43.8 30,301 44.8 - - - -
2000 2,428 73.8 9,193 65.6 - - - -
13 Multiple species of sharks are reported for this category, mean length and weight by individual species of shark are available upon request.
Figure III.65 Small coastal shark recreational catch in North Carolina by year.
0
20
40
60
80
100
120
0
20
40
60
80
100
120
140
Ha
rve
st (th
ou
san
ds o
f pou
nd
s)
Nu
mb
er
(th
ou
san
ds)
Year
Harvest Number
Released Number
Harvest Pounds

III-89
Table III.71 Small coastal shark recreational catch by state, 2019.
State Harvest Number
PSE (num)
Harvest Pounds
PSE (lb)
Mean Length
(inches)13
Mean Weight
(lb)13
Released Number
PSE
(release)
North Carolina 13,736 70.8 106,765 75.8 - - 34,952 36.1
Florida 15,359 58.6 168,987 73.2 - - 672,569 40.8
Georgia 13,753 43.2 73,923 50.7 - - 347,683 17.0
Maryland 686 79.9 5,546 79.7 - - 2,380 98.8
Massachusetts - - - - - - 6,290 95.9
South Carolina 22,315 29.1 95,826 31.6 - - 198,312 15.5
Virginia 559 99.3 4,311 99.3 - - 226 73.7
13 Multiple species of sharks are reported for this category, mean length and weight by individual species of shark are available upon request.
Figure III.66 Small coastal shark recreational catch by state, 2019.
0
20
40
60
80
100
120
140
160
180
0
100
200
300
400
500
600
700
800
NC FL GA MD MA SC VA
Ha
rve
st (th
ou
san
ds o
f pou
nd
s)N
um
be
r (t
hou
san
ds)
State
Harvest Number
Number Released
Harvest Pounds

III-90
Table III.72 Pelagic shark recreational catch in North Carolina by year.
Year Harvest Number
PSE (num)
Harvest Pounds
PSE (lb)
Mean Length
(inches)13
Mean Weight
(lb)13
Released Number
PSE (release)
2019 - - - - - - 888 65.7
2018 2,043 73.1 160,155 73.1 - - 38 63.0
2017 66 64.1 4,917 62.2 - - 33 86.2
2016 - - - - - - 3,512 79.0
2015 5,097 76.1 479,443 75.9 - - 987 91.8
2014 26 54.6 2,082 51.5 - - 296 110.5
2013 28 100.8 1,219 100.8 - - 1,865 97.1
2012 291 76.7 17,323 73.6 - - 13 98.3
2011 78 76.4 4,803 68.0 - - - -
2010 77 83.2 12,324 88.1 - - 96 99.2
2009 91 58.8 8,123 57.5 - - - -
2008 28 81.4 2,536 81.4 - - - -
2007 78 74.3 7,223 74.9 - - 151 109.9
2006 93 55.2 9,605 64.6 - - 1,103 94.7
2005 3,052 97.6 231,185 96.9 - - 1,049 89.1
2004 452 88.8 66,257 91.5 - - - -
2003 31 101.3 2,418 101.3 - - - -
2002 40 76.6 12,764 90.9 - - - -
2001 182 44.0 27,610 43.0 - - 107 100.4
2000 173 47.9 22,234 61.0 - - - -
13 Multiple species of sharks are reported for this category, mean length and weight by individual species of shark are available upon request.
Figure III.67 Pelagic shark recreational catch in North Carolina by year.
0
100
200
300
400
500
600
0
1
2
3
4
5
6 Ha
rve
st (th
ou
san
ds o
f pou
nd
s)
Nu
mb
er
(th
ou
san
ds)
Year
Harvest Number
Released Number
Harvest Pounds

III-91
Table III.73 Pelagic shark recreational catch by state, 2019.
State Harvest Number
PSE (num)
Harvest Pounds
PSE (lb)
Mean Length
(inches)13
Mean Weight
(lb)13
Released Number
PSE
(release)
North Carolina - - - - - - 888 65.7
Connecticut - - - - - - 1,474 80.5
Delaware - - - - - - 703 73.2
Maine - - - - - - 6,600 63.3
Massachusetts 52 58.7 - - - - 14,772 44.4
New Hampshire - - - - - - 1,121 63.3
New Jersey 5,462 85.9 1,599,761 75.6 - - 4,845 42.3
New York 6,022 48.6 2,045,883 43.5 - - 2,833 53.8
Rhode Island 1,006 93.8 - - - - 6,245 70.2
13 Multiple species of sharks are reported for this category, mean length and weight by individual species of shark are available upon request.
Figure III.68 Pelagic shark recreational catch by state, 2019.
0
500
1,000
1,500
2,000
2,500
0
2
4
6
8
10
12
14
16
NC CT DE ME MA NH NJ NY RI
Ha
rve
st (th
ou
san
ds o
f pou
nd
s)
Nu
mb
er
(th
ou
san
ds)
State
Harvest Number
Number Released
Harvest Pounds

III-92
Table III.74 Dogfish shark family recreational catch in North Carolina by year.
Year Harvest Number
PSE (num)
Harvest Pounds
PSE (lb)
Mean Length
(inches)
Mean Weight
(lb)
Released Number
PSE (release)
2019 8,962 56.3 50,477 60.3 - - 277,815 37.2
2018 7,514 74.1 43,732 80.5 - - 237,213 62.4
2017 683 84.5 5,616 87.0 - - 113,453 42.2
2016 33,490 63.0 359,844 64.0 - - 181,165 30.9
2015 8,314 61.7 38,340 76.7 - - 777,052 43.9
2014 1,992 88.2 11,978 90.4 - - 709,206 29.4
2013 52,026 77.6 88,216 71.4 - - 2,100,519 39.9
2012 1,600 75.7 10,522 82.4 - - 197,177 33.4
2011 28,719 43.1 108,348 43.5 - - 607,971 24.8
2010 8,859 46.0 26,626 45.5 - - 362,012 22.0
2009 2,000 81.1 43,216 81.1 - - 175,626 45.6
2008 20,340 69.2 17,414 66.5 - - 405,531 55.6
2007 5,405 100.9 36,342 100.9 - - 187,272 34.4
2006 5,775 56.6 71,369 65.1 - - 150,924 27.1
2005 37,180 64.9 275,611 64.5 - - 792,947 75.0
2004 2,574 78.8 31,524 75.2 - - 919,204 33.2
2003 3,105 88.8 2,958 98.3 - - 145,851 59.5
2002 8,675 87.3 22,922 83.4 - - 115,577 30.5
2001 6,843 99.8 5,374 99.8 - - 229,402 29.6
2000 1,151 88.2 9,693 87.6 - - 109,351 33.0
Figure III.69 Dogfish shark family recreational catch in North Carolina by year.
0
50
100
150
200
250
300
350
400
0
500
1,000
1,500
2,000
2,500 Ha
rve
st (th
ou
san
ds o
f pou
nd
s)
Nu
mb
er
(th
ou
san
ds)
Year
Harvest Number
Released Number
Harvest Pounds

III-93
Table III.75 Dogfish shark family recreational catch by state, 2019.
State Harvest Number
PSE (num)
Harvest Pounds
PSE (lb)
Mean Length
(inches)
Mean Weight
(lb)
Released Number
PSE
(release)
North Carolina 8,962 56.3 50,477 60.3 - - 277,815 37.2
Connecticut 2,888 42.5 6,195 60.8 - - 239,919 21.8
Delaware 695 58.2 2,146 79.5 - - 111,567 36.8
Florida - - - - - - 23,844 112.5
Georgia - - - - - - 5,272 103.0
Maine 864 114.7 4,073 114.7 - - 127,160 41.1
Maryland - - - - - - 24,174 81.9
Massachusetts 4,677 41.3 15,352 45.6 - - 131,110 34.8
New Hampshire - - - - - - 64,885 62.4
New Jersey 7,217 74.8 7,864 48.9 - - 1,956,304 19.5
New York 57,440 33.6 141,652 40.1 - - 1,651,428 17.4
Rhode Island 1,007 56.3 1,658 79.8 - - 98,844 24.1
South Carolina 361 98.9 874 98.9 - - 4,677 67.7
Virginia 19 59.8 61 51.7 - - 13,144 50.1
Figure III.70 Dogfish shark family recreational catch by state, 2019.
0
20
40
60
80
100
120
140
160
0
500
1,000
1,500
2,000
2,500
NC CT DE FL GA ME MD MA NH NJ NY RI SC VA
Ha
rve
st (th
ou
san
ds o
f pou
nd
s)
Nu
mb
er
(th
ou
san
ds)
State
Harvest Number
Number Released
Harvest Pounds

III-94
Table III.76 Reported North Carolina highly migratory species landings (numbers).
Year Blue Marlin White Marlin Sailfish Swordfish Total
2019 28 0 8 66 102
2018 28 1 9 10 48
2017 16 3 3 5 27
2016 23 0 4 6 33
2015 23 2 0 0 25
2014 15 0 0 0 15
2013 10 0 3 0 13
2012 20 0 0 1 21
2011 9 3 2 0 14
2010 14 2 1 0 17
2009 11 0 0 2 13
2008 24 1 0 0 25
2007 4 0 0 2 6
2006 12 0 0 0 12
2005 14 0 0 0 14
Table III.77 Reported North Carolina recreational Atlantic Bluefin Tuna landings14 (numbers).
Year
Manteo/ Oregon
Inlet Hatteras Ocracoke
Morehead City
Wilmington South
Call-In Total
2019 50 0 0 0 0 19 61
2018 32 0 0 0 0 1 33
2017 37 2 0 0 0 - 39
2016 62 10 0 0 0 2 74
2015 28 13 0 0 0 3 44
2014 62 3 0 2 0 2 69
2013 150 48 0 0 0 3 201
2012 143 40 1 0 2 3 189
2011 158 164 0 0 0 6 328
2010 378 193 0 0 0 8 579
2009 79 55 0 0 0 1 135
2008 72 51 0 8 0 1 132
2007 122 41 0 9 3 0 175
2006 0 13 0 13 5 0 31
2005 0 1 0 29 0 0 30
2004 0 0 0 19 0 1 20
2003 0 7 0 86 6 0 99
2002 1 10 4 64 3 0 82
2001 1 63 1 205 20 3 293
2000 0 339 8 147 87 9 590
14 Does not include trophy category.

III-95
Table III.78 Atlantic Coast saltwater fishing trips by state and mode, 2019.
Number of Trips
State Shore15
Private & Rental Charter Man Made15 Beach/Bank15 Total
Connecticut 2,272,146 1,452,664 13,383 - - 3,738,193
Delaware 1,490,673 595,707 7,283 - - 2,093,663
Florida 23,964,989 11,703,101 261,915 - - 35,930,005
Georgia 2,538,975 1,454,978 26,641 - - 4,020,594
Maine 1,086,950 562,040 15,333 - - 1,664,323
Maryland 3,857,179 2,755,601 164,847 - - 6,777,627
Massachusetts 4,712,501 2,510,764 114,702 - - 7,337,967
New Hampshire 259,526 301,098 17,760 - - 578,384
New Jersey 8,731,685 4,356,752 185,960 - - 13,274,397
New York 7,193,913 5,952,485 33,909 - - 13,180,307
North Carolina - 4,646,520 160,692 6,021,580 6,711,048 17,539,840
Rhode Island 2,320,516 1,384,014 18,053 - - 3,722,583
South Carolina 8,760,364 2,948,966 129,226 - - 11,838,556
Virginia 4,549,827 2,651,161 17,923 - - 7,218,911
15 Shore mode is separated into manmade and beach/bank in North Carolina only.
Figure III.71 Atlantic Coast saltwater fishing trips by state and mode, 2019.
0
5,000,000
10,000,000
15,000,000
20,000,000
25,000,000
30,000,000
35,000,000
40,000,000
Num
be
r o
f T
ips
Shore Private/Rental Charter Man-made Beach/Bank

III-96
Table III.79 Marine recreational fishing trips in North Carolina by mode.
Number of Trips
Year Charter PSE Private &
Rental PSE Man Made PSE Beach &
Bank PSE
Total
2019 160,692 5.4 4,646,520 4.4 6,021,580 7.8 6,711,048 10.0 17,539,840
2018 148,004 6.0 4,279,389 5.0 5,317,495 7.1 6,879,419 12.2 16,624,306
2017 149,438 6.3 5,044,731 7.9 9,512,489 7.8 7,745,619 11.2 22,452,276
2016 140,575 6.5 4,860,391 5.8 5,970,329 6.4 10,187,550 8.7 21,158,845
2015 114,043 11.6 4,992,920 5.7 8,516,390 6.4 6,699,488 15.4 20,322,840
2014 96,432 6.1 4,895,957 5.1 6,014,374 6.1 7,919,735 7.3 18,926,498
2013 111,366 5.6 4,847,955 4.4 7,097,673 5.3 6,028,869 6.2 18,085,863
2012 159,160 9.1 5,054,638 4.2 6,184,923 5.0 7,156,627 3.5 18,555,347
2011 129,380 9.0 5,212,669 4.3 6,040,312 4.6 8,086,490 4.3 19,468,851
2010 138,577 5.1 4,982,732 3.8 7,174,395 4.2 7,877,619 3.9 20,173,322
2009 129,412 6.0 4,822,295 4.1 6,642,257 6.0 7,751,222 7.6 19,345,187
2008 170,428 7.2 4,599,900 3.8 6,067,854 6.5 8,489,916 6.3 19,328,098
2007 185,618 6.4 4,671,856 3.9 7,105,305 7.0 6,183,367 6.6 18,146,146
2006 201,368 6.1 4,542,632 3.7 7,671,720 7.4 7,199,224 7.1 19,614,943
2005 214,826 10.1 4,359,576 4.2 7,369,215 8.6 5,206,759 9.4 17,150,375
2004 183,039 6.4 4,276,395 4.4 6,245,702 8.3 6,695,734 5.8 17,400,870
2003 131,566 14.6 3,746,771 3.6 6,243,796 5.6 5,353,909 5.3 15,476,042
2002 142,644 12.3 3,539,123 4.1 5,913,968 5.7 5,501,125 5.0 15,096,860
2001 160,791 12.9 3,363,853 3.4 6,105,185 6.2 5,479,658 4.6 15,109,487
2000 164,116 12.4 3,388,516 3.8 6,088,224 5.7 5,687,088 3.8 15,327,944
Figure III.72 Marine recreational fishing trips in North Carolina by mode.
0
5,000,000
10,000,000
15,000,000
20,000,000
25,000,000
Nu
mb
er
of T
rip
s
Charter Private &Rental Man Made Beach & Bank

III-97
Appendix III.1 NCDMF highly migratory species reporting stations.
Reporting Station Location Phone
Anchorage Marina Atlantic Beach 252-928-6661
Captain Stacy's Fishing Center Atlantic Beach 252-726-4675
Seawater Marina Atlantic Beach 252-726-1637
Olde Towne Yacht Club Beaufort 252-726-3066
Town Creek Marina Beaufort 252-728-6111
Hurricane Fishing Center Calabash 910-579-3660
Harker's Island Fishing Center Harker's Island 252-728-3907
Hatteras Harbor Marina Hatteras 252-986-2166
Oden's Dock Hatteras 252-986-2555
Teach's Lair Marina Hatteras 252-986-2460
Holden Beach Marina Holden Beach 910-842-5447
Oregon Inlet Fishing Center Manteo 252-441-6301
Pirates Cove Manteo 252-473-3906
Shallowbag Bay Marina Manteo 252-305-8726
Carolina Princess Morehead City 252-726-5479
Portside Marina Morehead City 252-726-7678
Ocean Isle Fishing Center Ocean Isle 910-575-3474
Anchorage Marina Ocracoke 252-726-4423
Southport Marina Southport 910-457-9900
Outer Banks Marina Wanchese 252-473-9991
Creekside Yacht Club Wilmington 910-350-0023
Bridge Tender Marina Wrightsville Beach 910-256-6550
DMF Technician Mobile N/A
DMF Call-in Mobile 800-682-2632

III-98
Appendix III.2 North Carolina APAIS Intercept Form.
Note: NCDMF stopped using paper surveys and transitioned to electronic methods in 2019.

III-99
Appendix III.2 North Carolina MRIP Intercept Form (continued).
Note: NCDMF stopped using paper surveys and transitioned to electronic methods in 2019.

III-100
Appendix III.3 North Carolina Fishing Effort Survey.

III-1
01
Appendix III.3 North Carolina Fishing Effort Survey (continued).

III-102
Appendix III.4 Glossary of terminology in MRIP survey.
Avidity: The frequency of fishing activity, measured as number of days on which fishing trips were made. Type A catch: Fish that were caught, were landed whole, and were available for identification and enumeration by the interviewers. In addition, the fish were potentially available for weighing and measuring. Type B catch: Fish that were caught but were either not kept or not available for identification. Type B1 catch: Fish that were caught and filleted, released dead, given away, or disposed of in some way other than Types A or B2. Type B2 catch: Fish that were caught and released alive. Total catch: The number of fish caught but not necessarily brought ashore, may be obtained by summing catch types A and B or by summing catch types A, B1, and B2. The total number of fish removed from the fishery resource may be obtained by summing catch types A and B1. Coastal counties: All counties in the coastal states of the United States with some portion within 25 miles of the coastline were included in the Fishing Effort Survey. This boundary was extended to 50 miles in the South Atlantic and Gulf of Mexico from May through October. The boundary was extended further in North Carolina to 50 miles November through April and 100 miles May through October. Coastal resident: An angler who lived in a coastal county included in the Fishing Effort Survey. Coastal state: A state bordering on the Atlantic or Pacific Ocean, the Gulf of Mexico or the Caribbean Sea. State also includes a Territory or Commonwealth. Congener: An organism of the same taxonomic genus as another. EEZ (U.S. Exclusive Economic Zone): The MFCMA defines this zone as contiguous to the Territorial Sea of all the United States and its possessions and extending seaward 200 nautical miles measured from the baseline from which the Territorial Sea is measured. Fishery Management Plan (FMP): A plan developed by a Regional Fishery Management Council and the Secretary of the Department of Commerce to manage a fishery resource pursuant to the Magnuson Fishery Conservation and Management Act of 1976. Fishing access site: Fishing access site refers to the name and location of the place where anglers were intercepted. Each intercept site was given a unique name and code number. The fishing access site did not define the mode of fishing since anglers may have used more than one mode at any given site. Fishing trip: Fishing during part or all of 1 day in one mode. An angler who fished from both a pier and a beach on the same day made one fishing trip since the pier and the beach are both in the shore mode. However, an angler who fished from a head boat in the morning and from a pier in the afternoon is counted as having made two fishing trips--a head boat trip and a shore trip.

III-103
Hours fished: The amount of time an angler actively fished in a mode with fishing gear in the water. If an angler spent time fishing at other sites on the same day, that time was also included provided the fishing was done in the same mode. Not included was the travel time in a boat or travel time between sites. Household: A household consisted of all persons who occupied a housing unit. The unit must have been intended for year-round use, not seasonal or migratory use. Intercept survey or creel census: Interviewing anglers and examining their catch upon completion of their fishing trip, or under certain circumstances, while they were still fishing. Length and weight of fish: Length and weight measurements were obtained from a sample of fish brought ashore in whole form by intercepted anglers. If more than 10 fish of the same species were brought ashore in whole form, 10 fish were randomly selected to be weighed and measured. If 10 or less fish of the same species were brought ashore in whole form, each fish was weighed and measured. For fish with a forked tail, fork length was measured from the tip of the longest jaw or the snout, whichever was terminal with the mouth closed, to the center of the fork. For fish with a non-forked tail, total length was measured from the tip of the longest jaw or the snout, whichever was terminal with the mouth closed, to the tip of the caudal lobe or fin. Weight was measured to the nearest tenth of a kilogram (1 kilogram is approximately 2.2 pounds). Length was measured to the nearest millimeter (1 millimeter is approximately 0.039 inches). Marine recreational anglers: Those people who fished in marine waters primarily for recreational purposes. Their catch was primarily for home consumption, although occasionally a part or all of their catch may have been sold and entered commercial channels. Specifically, for this survey, marine recreational anglers were defined as follows: In the telephone household survey, an angler was anyone who had been marine recreational fishing in the 12 months prior to telephone household contact, and an eligible angler was anyone who had been marine recreational fishing 2 months prior to the telephone household contact. In the intercept survey an eligible angler was anyone just completing a finfishing trip, or in certain cases, someone who was still fishing. Marine recreational fishing: Fishing primarily with hook and line for pleasure, amusement, relaxation, or home consumption. If part or all of the catch was sold, the monetary returns constituted an insignificant part of the person's income.
III-104
Mode of fishing: The type of place or platform from which marine recreational fishing occurs. There are four modes:
1. Shore: A shore may be:
Pier, dock: A structure built over the water and supported by pillars.
Jetty: A kind of wall, usually made of rocks, built out into the water or parallel to the shore to restrain currents or protect a harbor.
Breakwater: An offshore structure used to protect a harbor or breach from the forces of waves.
Bridge: An elevated or raised way across wet ground or water.
Causeway: A connecting channel.
Beach: A level stretch of pebbles or sand beside a body of water, often washed by high water.
Bank: A stretch of rising land at the edge of a body of water not washed by high water, which could be rocks or an overhanging cliff.
2. Private/Rental: A boat belonging to an individual or one that is rented. No crew is provided; operated by the owner/renter.
3. Headboat: A boat operated by licensed captain usually carrying greater than seven anglers. Fees are paid on a per head (angler) basis.
4. Charter Boat: A boat operating under charter for a price, time, etc. It is operated by a licensed captain and crew and the participants are part of a pre-formed group of anglers. Thus, charters are usually closed parties. Note: Charter boats may make all-day or half-day trips.
Non-coastal resident: An angler who lived in a county of a coastal state that was not included in the telephone household survey. Out-of-state resident: An angler who lived in a state other than the coastal state in which he fished. Ocean: For the purposes of the survey, ocean is divided into two categories: The ocean 3 miles or less from shore (Territorial Sea) and the ocean more than 3 miles from shore (Exclusive Economic Zone). However, the boundary for state and federal jurisdiction on the Gulf of Mexico coast of Florida is 3 marine leagues, or 10 miles, from shore. Not included are sounds, inlets, rivers, bays, etc. Inland: Other bodies of saltwater besides the oceans. Included are sounds, inlets, and tidal portions of rivers, bay, estuaries, and other areas of salt or brackish water.

III-105
State of fishing access (State of intercept): The state in which the fishing or intercept site was located. For boat fishing, it was the state from which the boat departed the shoreline for fishing. state of residence: The state in which the angler lived and maintained his permanent residence. U.S. Territorial Sea: A zone extending 3 nautical miles from shore for all states except the Gulf coast of Florida where the seaward boundary is 3 marine leagues (approximately 10 statute miles). Wave: A wave is one of the following 2-month intervals:
• January/February (Wave 1)
• March/April (Wave 2)
• May/June (Wave 3)
• July/August (Wave 4)
• September/October (Wave 5)
• November/December (Wave 6)
III-106
Appendix III.5 Data elements in MRIP survey.
Dockside Interviews
• State and county of residence
• Avidity level - trips per year
• Mode of fishing
• Primary area of fishing
• Number of anglers contributing to catch
• Number, weights, and lengths of fish caught by species
Fishing Effort Survey
• Gender
• Age
• Ethnicity
• Presence of marine recreational anglers in the household
• Number of anglers per household
• Fishing trips in 2-month period
• Fishing trips in 12-month period
• Mode of each trip Intercept Data
• Date, location, and site of interview
• Mode of fishing
• Tournament fishing status
• Fishing location
• Gear type
• Hours of fishing time
• Targeted species
• Number of days fished in last year
• State and county of residence
• Sex and age of angler
• Number and types of Type 2 fish (unavailable catch)
• Number of contributors and people in fishing party
• Length and weight of Type 3 fish (available catch) Expanded Data
• Estimated number of trips in a mode
• Percent of trips in a mode
• Number of trips in a specific mode and area
• Data on groups or types of fish caught in a mode or area
• Estimated numbers of Type A, B1, or B2 fishes caught or released (including variances)
• Estimated weights or lengths of specific types of fish (including variances)
• Number of interviews conducted in specific modes or sites by year, month, etc.
• Catch per trip (including variances)
• Mean weight and/or length of fish from a specific area, mode, etc.