Embed Size (px)
Citation preview
CHAPTER III
PROFILE OF THE TRADE UNIONS
3.1 INTRODUCTION.
3.2 PROFILE OF TRADE UNIONS AT MORMUGAO PORT
TRUST.
3.3 PROFILE OF TRADE UNIONS AT GOA SHIPYARD
LIMITED.
3.4 PROFILE OF TRADE UNIONS AT COLFAX PRIVATE
LI1VIITED.
3.5 PROFILE OF TRADE UNIONS AT CIBA SPECIALTY
CHEMICALS ( INDIA) LIMITED.
3.6 COMPARISON OF TRADE UNION PROFILE.
3.7 CONCLUSIONS.
54
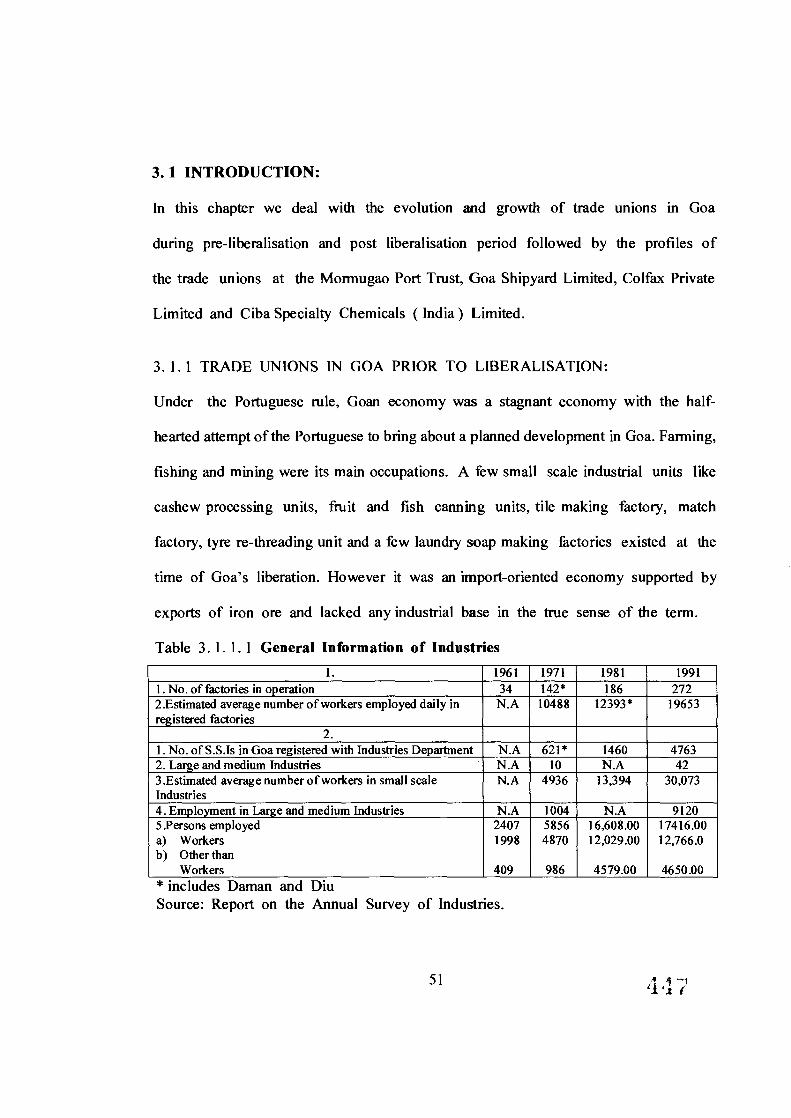
3.1 INTRODUCTION:
In this chapter we deal with the evolution and growth of trade unions in Goa
during pre-liberalisation and post liberalisation period followed by the profiles of
the trade unions at the Mormugao Port Trust, Goa Shipyard Limited, Colfax Private
Limited and Ciba Specialty Chemicals ( India ) Limited.
3. 1. 1 TRADE UNIONS IN GOA PRIOR TO LIBERALISATION:
Under the Portuguese rule, Goan economy was a stagnant economy with the half-
hearted attempt of the Portuguese to bring about a planned development in Goa. Farming,
fishing and mining were its main occupations. A few small scale industrial units like
cashew processing units, fruit and fish canning units, tile making factory, match
factory, tyre re-threading unit and a few laundry soap making factories existed at the
time of Goa's liberation. However it was an import-oriented economy supported by
exports of iron ore and lacked any industrial base in the true sense of the term.
Table 3. 1. 1. 1 General Information of Industries
1. 1961 1971 1981 1991 1. No. of factories in operation 34 142* 186 272 2.Estimated average number of workers employed daily in registered factories
N.A 10488 12393* 19653
2. 1.No. of S.S.Is in Goa registered with Industries Department N.A 621* 1460 4763 2. Large and medium Industries N.A 10 N.A 42 3.Estimated average number of workers in small scale Industries
N.A 4936 13,394 30,073
4. Employment in Large and medium Industries N.A 1004 N.A 9120 5.Persons employed a) Workers b) Other than
Workers
2407 1998
409
5856 4870
986
16,608.00 12,029.00
4579.00
17416.00 12,766.0
4650.00 * includes Daman and Diu Source: Report on the Annual Survey of Industries.
51
4 47
It is evident from Table 3. 1. 1. 1 that industrialisation at the time of Goa's
liberation ( 1961 ) was at its minimum with only 34 factories in operation which
increased to 272 in 1991 . Prior to the liberation of Goa from the Portuguese in
1961, most of the industries were small and some of them were household
industries. The number of people employed in these industries were comparatively
few and therefore there were no Trade Unions.
Desai, K ( 1993 ) in his Thesis titled " Trade Union Movement in Goa. 1936 —
1986 " also says that there were no trade unions during the Portuguese rule in Goa.
There were labourers employed from Goa and neighbouring States to construct the
Goa Railway and Mormugao harbour which functioned without any union but
witnessed an agitation that was taken up by about 250 employees working at the
Railway workshop at Baina, Vasco.
Like the railway and harbour industries, the mining industry in Goa too under the
Portuguese rule did not have any union, but experienced stoppage of work by seven
hundred workers at Sirigao mines in north Goa in 1952, which lasted for twelve
days. Liberation of Goa in 1961, initiated the birth and spread of trade unions in
Goa. On 13th January 1962, five thousand workers from the docks went on a
spontaneous forty-eight hours general strike which gave birth to the Mormugao Port,
Dock and Transport Workers Union ( M.P. D. T. W. U ). It was a Communist led
unrecognized and unregistered union, as the Trade Union Act and other laws were
not yet extended to Goa and so its actions were considered to be illegal.
52
In May 1962, The Indian National Trade Union Congress ( I. N. T. U. C) came
to Goa and organized mine workers and port and dock workers. They established
unions under the I. N. T. U. C in Goa, namely National Mine Workers Union
( N. M. W. U ), National Dock & Transport Workers Union ( N. D. & T. W. U ),
National Commercial Employees Sangh ( N. C. E. S) and National Cinema and
Hotel Workers Union ( N. C . & H. W. U ).
By September 1962, Hind Mazdoor Sabha ( H. M. S) established two unions in
Goa namely (a) The Transport and Dock Workers Union ( Goa ) ( T. D. W. U )
and (b) Steel Mazdoor Sabha at Bicholim.
On 13th November 1964, The Government of India set up a Wage Board for port
and dock workers at major ports.
In 1964, the Mormugao Port and Railway Workers Union ( M. P. R. W. U) was
formed and was affiliated to the All India Port and Dock Workers Federation
( A. I. P. D. W. F).
" Goa Sena ", a new organisation led by freedom fighter Shri Shabu Desai was
formed in 1969 to protect the Goan interests .
The bargemen formed the " United Bargemen Association " affiliated to H. M. S.
on 10th March, 1975.
The All India Trade Union Congress ( A. I. T. U. C) was established in Goa in 1962
and was recognized in 1964 under the leadership of Comrade George Vaz.
With initial resistance, the companies, mine owners and industrialists eventually
accepted the formation of unions in Goa.
53
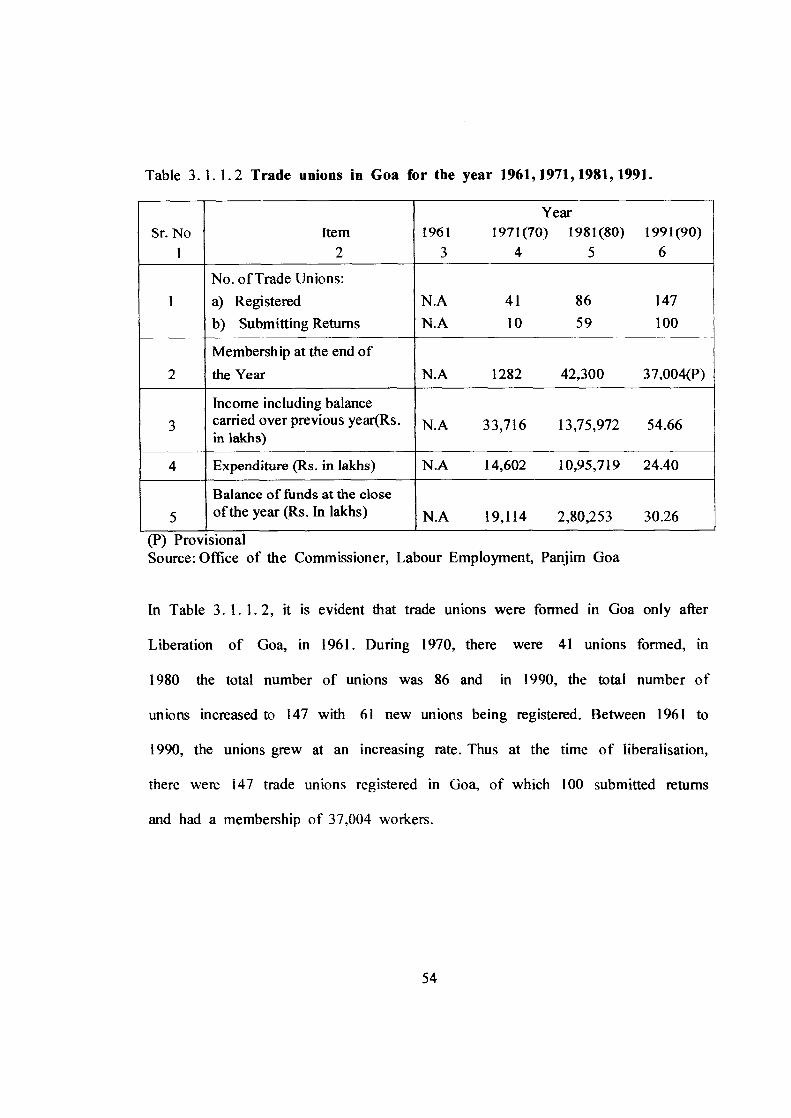
Table 3. 1. 1. 2 Trade unions in Goa for the year 1961,1971,1981,1991.
Sr. No
1 Item
2 1961
3
Year
1971(70) 1981(80)
4 5 1991(90)
6
1
No. of Trade Unions:
a) Registered
b) Submitting Returns
N.A
N.A
41
10
86
59
147
100
2
Membership at the end of
the Year N.A 1282 42,300 37,004(P)
3 Income including balance carried over previous year(Rs. in lakhs)
N.A 33,716 13,75,972 54.66
4 Expenditure (Rs. in lakhs) N.A 14,602 10,95,719 24.40
5 Balance of funds at the close of the year (Rs. In lakhs) N.A 19,114 2,80,253 30.26
(P) Provisional Source: Office of the Commissioner, Labour Employment, Panjim Goa
In Table 3. 1. 1. 2, it is evident that trade unions were formed in Goa only after
Liberation of Goa, in 1961. During 1970, there were 41 unions formed, in
1980 the total number of unions was 86 and in 1990, the total number of
unions increased to 147 with 61 new unions being registered. Between 1961 to
1990, the unions grew at an increasing rate. Thus at the time of liberalisation,
there were 147 trade unions registered in Goa, of which 100 submitted returns
and had a membership of 37,004 workers.
54
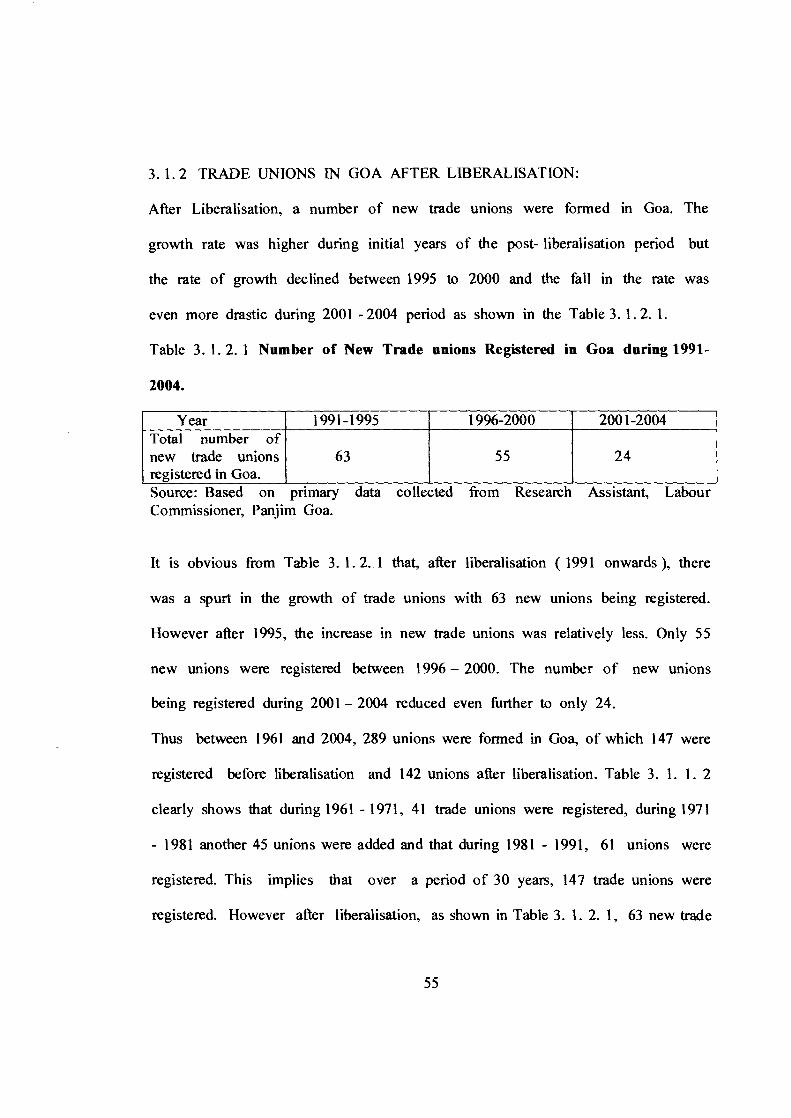
3. 1.2 TRADE UNIONS IN GOA AFTER LIBERALISATION:
After Liberalisation, a number of new trade unions were formed in Goa. The
growth rate was higher during initial years of the post- liberalisation period but
the rate of growth declined between 1995 to 2000 and the fall in the rate was
even more drastic during 2001 - 2004 period as shown in the Table 3. 1. 2. 1.
Table 3. 1. 2. 1 Number of New Trade unions Registered in Goa during 1991-
2004.
Year 1991-1995 1996-2000 2001-2004 Total number of new trade unions registered in Goa.
63 55 24
Source: Based on primary data collected from Research Assistant, Labour Commissioner, Panjim Goa.
It is obvious from Table 3. 1. 2. 1 that, after liberalisation ( 1991 onwards ), there
was a spurt in the growth of trade unions with 63 new unions being registered.
However after 1995, the increase in new trade unions was relatively less. Only 55
new unions were registered between 1996 — 2000. The number of new unions
being registered during 2001 — 2004 reduced even further to only 24.
Thus between 1961 and 2004, 289 unions were formed in Goa, of which 147 were
registered before liberalisation and 142 unions after liberalisation. Table 3. 1. 1. 2
clearly shows that during 1961 - 1971, 41 trade unions were registered, during 1971
- 1981 another 45 unions were added and that during 1981 - 1991, 61 unions were
registered. This implies that over a period of 30 years, 147 trade unions were
registered. However after liberalisation, as shown in Table 3. 1. 2. 1, 63 new trade
55
unions were registered during 1991 - 1995, 55 unions added in 1996 - 2000 and
another 24 unions registered in 2001 - 2004, which means 142 unions were
registered within a period of 15 years. Thus it was evident from Table 3. 1. 1. 2 and
Table 3. 1. 2. 1 that although there were more unions registered prior to
liberalisation, the rate of growth of trade unions in Goa was much greater during
the post liberalisation period.
In 2005, according to the Labour Commissioner's Office, Goa had 270 unions
registered with the Registrar of Trade Unions in Goa. ( refer Appendix VI )
Of these 270 registered unions, 114 trade unions were registered in the industrial
sector, 149 in the service sector, 3 related to agricultural activities, 3 were
employers unions and 1 federation.
According to Mr. Christopher Fonseca, the present General Secretary ( A. I. T. U. C)
during the post liberalisation period, A. I. T. U. C has been functioning in Goa
with total commitment and concern towards the workers, as it did since its
inception in 1962. It was both local and national in character and had
international affiliation to the World Federation of Trade Unions ( W. F. T. U).
The union had all types of workers - casual, daily, self-employed and contract
labour as its members. A number of trade unions in Goa are affiliated to this
union.
With regard to MPT, it is associated with spillage workers; at Goa Shipyard
Limited with Goa Shipyard Worker's Union which is not a recognized union, and
at Ciba it was associated earlier with the canteen workers and fabrication and
56
maintenance. It not only provides its services to the affiliated industries, but also to
workers from other industries to settle or ventilate their grievances individually.
3.2 PROFILE OF TRADE UNIONS AT MORMUGAO PORT TRUST:
India, with a coastline of 7,500 Km, has 12 major ports and Mormugao Port is
one of them situated on the west coast of India. It has become the first port in
the country and one among the few in the world to acquire the prestigious
quality certificate ISO 9002. Mormugao Port Trust is a service organization,
situated at Mormugao Harbour and is an Autonomous body under the Central
Government Ministry of Shipping, Road Transport & Highways, Delhi.
It is governed by The Major Port Trust Act, 1963 ( amended by Major Port
Trusts ( Amendment ) Act, 1974 extended w.e f. 1. 2. 1975 ).
3. 2. 1 GROWTH OF TRADE UNIONS AT MORMUGAO PORT TRUST
There were ten trade unions present at the Mormugao Port Trust namely:
1. Mormugao Port & Railway Workers Union.
2. Goa Port & Dock Employees Union.
3. Goa Port & Dock Workers Organisation.
4. Mormugao Port Trust Employees Union.
5. Mormugao Waterfront Workers Union.
57
6. Mechanical Ore Handling Project Technicians Association.
7. Transport & Dock Workers Union.
8. Goa Port & Dock Employees Union ( Workers ).
9. Goa Dock Labour Union.
10. MOHP ( MPT) Workers Union.
Of these ten unions, Mormugao Port & Railway Workers Union ( M. P. R. W. U.)
is a recognized union and Goa Port & Dock Employees Union (G. P. D. E. U) is
a deemed officially recognized union.
MORMUGAO PORT & RAILWAY WORKERS UNION (MPRWU):
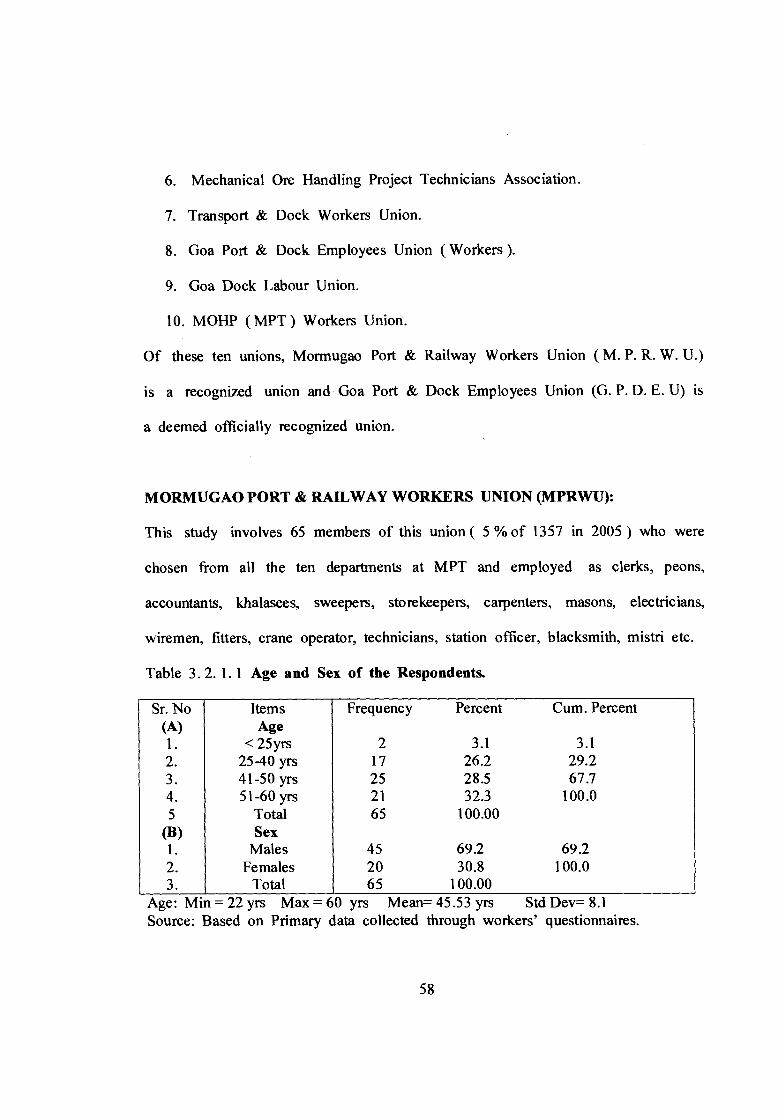
This study involves 65 members of this union ( 5 % of 1357 in 2005 ) who were
chosen from all the ten departments at MPT and employed as clerks, peons,
accountants, khalasees, sweepers, storekeepers, carpenters, masons, electricians,
wiremen, fitters, crane operator, technicians, station officer, blacksmith, mistri etc.
Table 3.2. 1. 1 Age and Sex of the Respondents.
Sr. No Items Frequency Percent Cum. Percent (A) Age 1. < 25yrs 2 3.1 3.1 2. 25-40 yrs 17 26.2 29.2 3. 41-50 yrs 25 28.5 67.7 4. 51-60 yrs 21 32.3 100.0 5 Total 65 100.00
(B) Sex 1. Males 45 69.2 69.2 2. Females 20 30.8 100.0 3. Total 65 100.00
Age: Min = 22 yrs Max = 60 yrs Mean= 45.53 yrs Std Dev= 8.1 Source: Based on Primary data collected through workers' questionnaires.
58
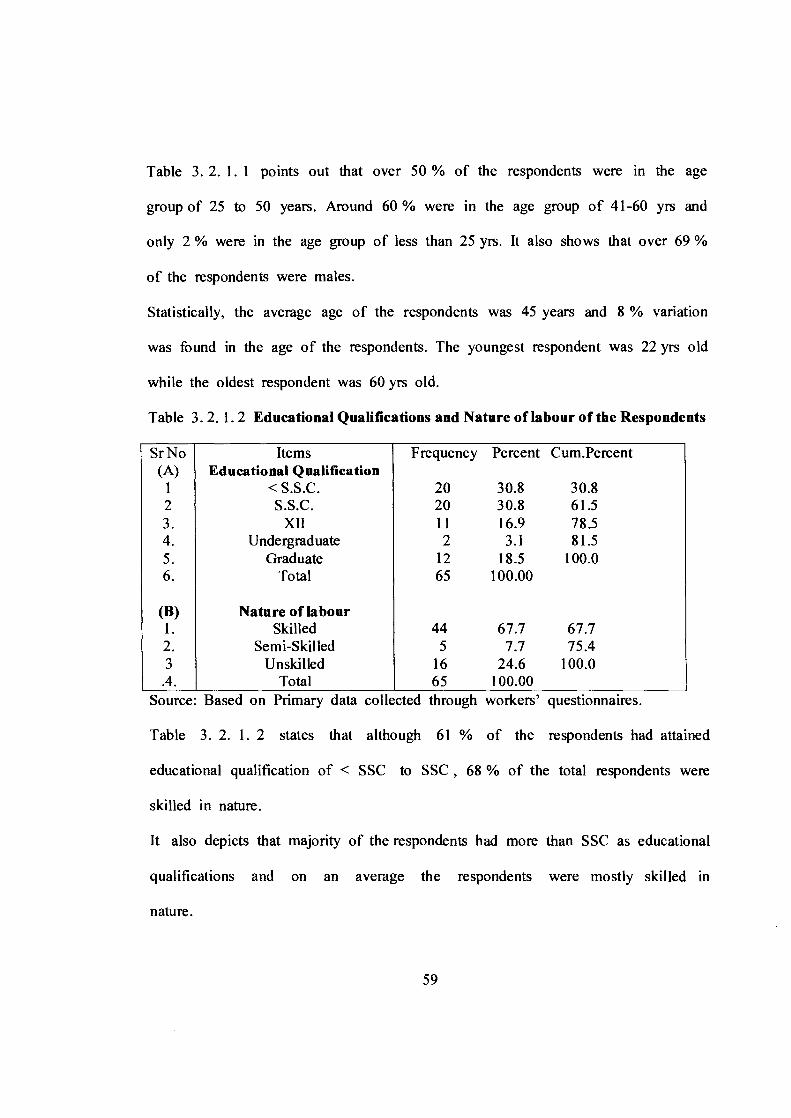
Table 3. 2. 1. 1 points out that over 50 % of the respondents were in the age
group of 25 to 50 years. Around 60 % were in the age group of 41-60 yrs and
only 2 % were in the age group of less than 25 yrs. It also shows that over 69 %
of the respondents were males.
Statistically, the average age of the respondents was 45 years and 8 % variation
was found in the age of the respondents. The youngest respondent was 22 yrs old
while the oldest respondent was 60 yrs old.
Table 3.2. 1.2 Educational Qualifications and Nature of labour of the Respondents
Sr No (A)
Items Educational Qualification
Frequency Percent Cum.Percent
1 < S.S.C. 20 30.8 30.8 2 S.S.C. 20 30.8 61.5 3. XII 11 16.9 78.5 4. Undergraduate 2 3.1 81.5 5. Graduate 12 18.5 100.0 6. Total 65 100.00
(B) Nature of labour 1. Skilled 44 67.7 67.7 2. Semi-Skilled 5 7.7 75.4 3 Unskilled 16 24.6 100.0
.4. Total 65 100.00 Source: Based on Primary data collected through workers' questionnaires.
Table 3. 2. 1. 2 states that although 61 % of the respondents had attained
educational qualification of < SSC to SSC , 68 % of the total respondents were
skilled in nature.
It also depicts that majority of the respondents had more than SSC as educational
qualifications and on an average the respondents were mostly skilled in
nature.
59
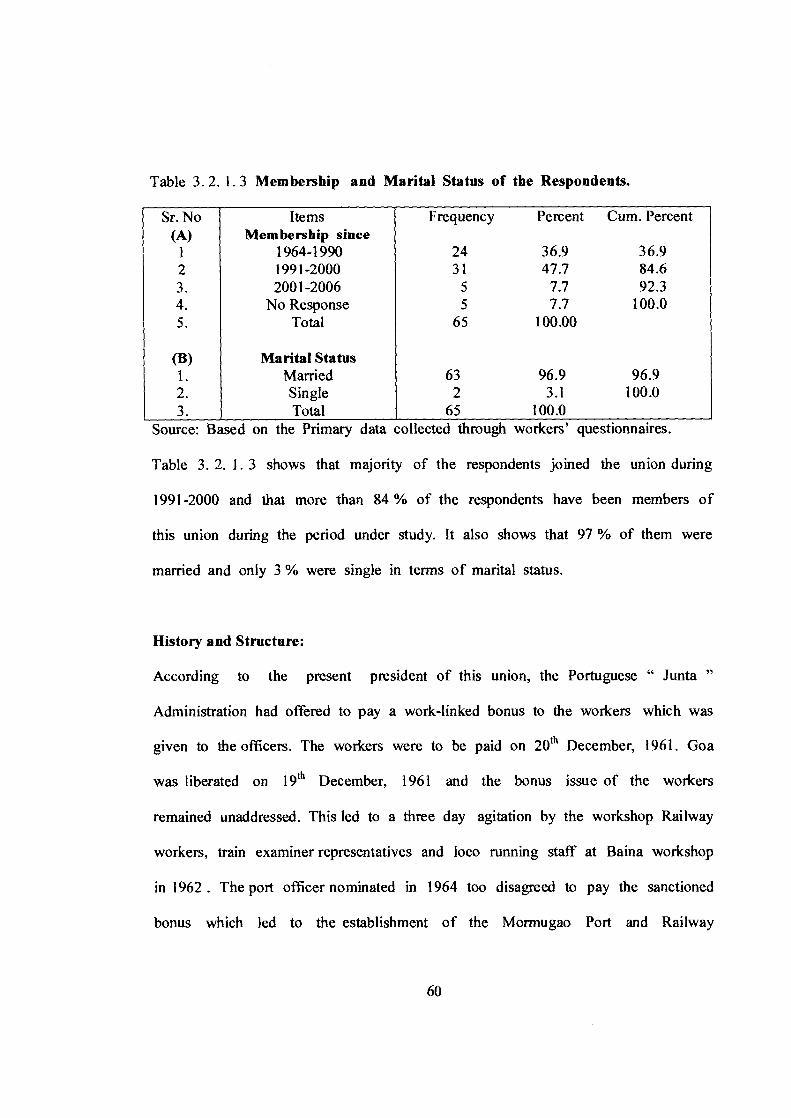
Table 3. 2. 1. 3 Membership and Marital Status of the Respondents.
Sr. No Items Frequency Percent Cum. Percent (A) Membership since
1 1964-1990 24 36.9 36.9 2 1991-2000 31 47.7 84.6 3. 2001-2006 5 7.7 92.3 4. No Response 5 7.7 100.0 5. Total 65 100.00
(B) Marital Status 1. Married 63 96.9 96.9 2. Single 2 3.1 100.0 3. Total 65 100.0
Source: Based on the Primary data collected through workers' questionnaires.
Table 3. 2. 1. 3 shows that majority of the respondents joined the union during
1991-2000 and that more than 84 % of the respondents have been members of
this union during the period under study. It also shows that 97 % of them were
married and only 3 % were single in terms of marital status.
History and Structure:
According to the present president of this union, the Portuguese " Junta "
Administration had offered to pay a work-linked bonus to the workers which was
given to the officers. The workers were to be paid on 20 th December, 1961. Goa
was liberated on 19 th December, 1961 and the bonus issue of the workers
remained unaddressed. This led to a three day agitation by the workshop Railway
workers, train examiner representatives and loco running staff at Baina workshop
in 1962. The port officer nominated in 1964 too disagreed to pay the sanctioned
bonus which led to the establishment of the Mormugao Port and Railway
60
Worker's Union on 4 th February, 1964 and was affiliated to the All India Port &
Dock Workers Federation led by HMS. The union conducted elections regularly
based on elaborate and well-defined election procedures.
The present ( upto 2005 ) Union Executive consisted of the President, two Vice
- Presidents; the Secretary; the General Secretary; three Joint Secretaries:
(Ministerial); two Joint Secretaries: ( Non-Ministerial); Treasurer and eight
Committee members.
Administration:
The frequency of the union executive meetings was medium, had good attendance
and active participation. Its functioning was democratic in nature and provided a
somewhat important role to its executive members with regard to decision making.
The President or the General Secretary negotiated with the management.
During 1990 to 1995, the union dealt with local issues and carried out local strikes,
gheraoes. Its functions were fighting against the Privatisation policy, wage revision,
filling up vacant regular posts and demanding with the management to fix labour
targets. After 1995, its main functions centered around negotiating unsettled
issues, pattern of manning scales, reduction in complement, elimination of wasteful
manpower, twelve-hour duty with existing staff after the ban in filling the
posts and improvement in medical facilities.
Between 2000 and 2005, it gave more importance to solving personal grievances,
educating workers to be more productive and to face globalisation. The union
61
leaders try to settle demands even without workers' involvement as they believe in
negotiating issues across the table. Only in sensitive issues that need agitation,
workers are involved.
Its priorities were to seek improvement in service conditions and fulfilling
production targets. The union was able to solve 99 % of the workers grievances
without deprivation to any employee.
Personnel, Membership and Degree of Unionisation:
The personnel at MPT is classified as Class I, Class II, Class III and Class IV
Workers. The Class I and Class II consist of Officers while the Class III and
Class IV consist of Non- cargo handling employees, Cargo-handling workers other
than shore workers, Cargo handling shore workers and Casual workers.
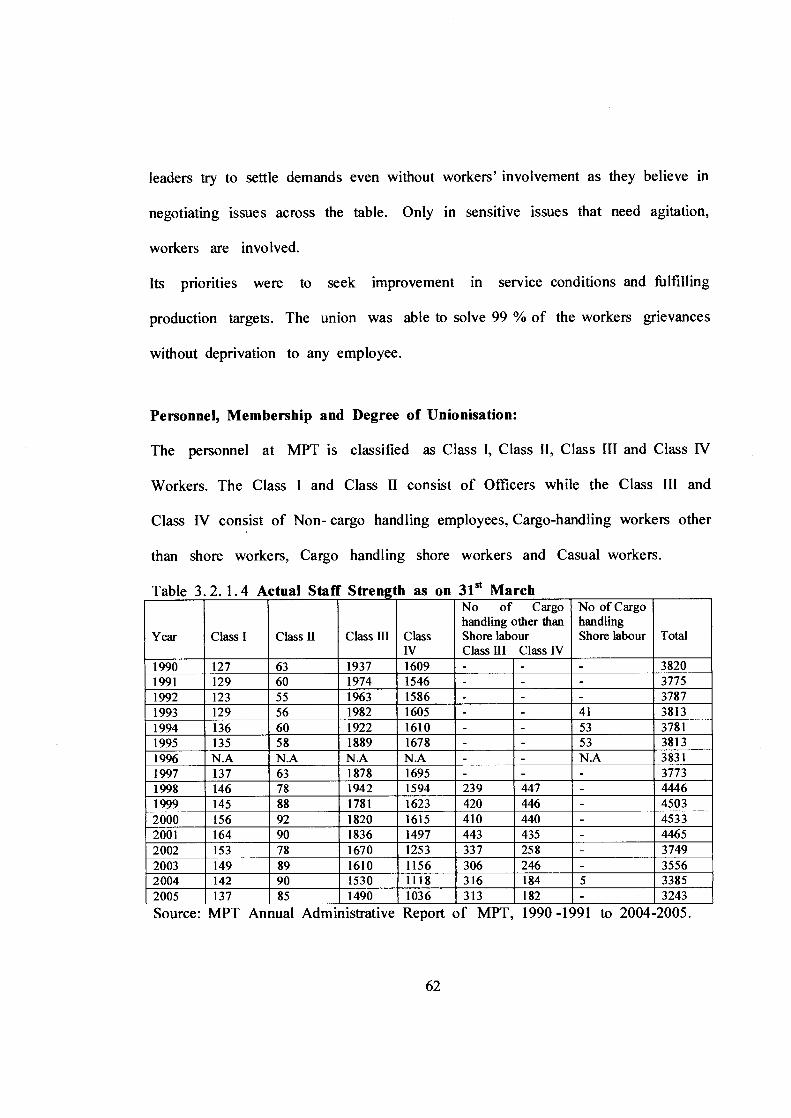
Table 3.2. 1.4 Actual Staff Strength as on 31' t March
Year Class I Class II Class III Class IV
No of Cargo handling other than Shore labour Class III Class IV
No of Cargo handling Shore labour Total
1990 127 63 1937 1609 - - - 3820 1991 129 60 1974 1546 - - - 3775 1992 123 55 1963 1586 - - - 3787 1993 129 56 1982 1605 - - 41 3813 1994 136 60 1922 1610 - - 53 3781 1995 135 58 1889 1678 - - 53 3813 1996 N.A N.A N.A N.A - - NA 3831 1997 137 63 1878 1695 - - - 3773 1998 146 78 1942 1594 239 447 - 4446 1999 145 88 1781 1623 420 446 - 4503 2000 156 92 1820 1615 410 440 - 4533 2001 164 90 1836 1497 443 435 - 4465 2002 153 78 1670 1253 337 258 - 3749 2003 149 89 1610 1156 306 246 - 3556 2004 142 90 1530 1118 316 184 5 3385 2005 l37 85 1490 1036 313 182 - 3243
Source: MPT Annual Administrative Report of MPT, 1990 -1991 to 2004-2005.
62
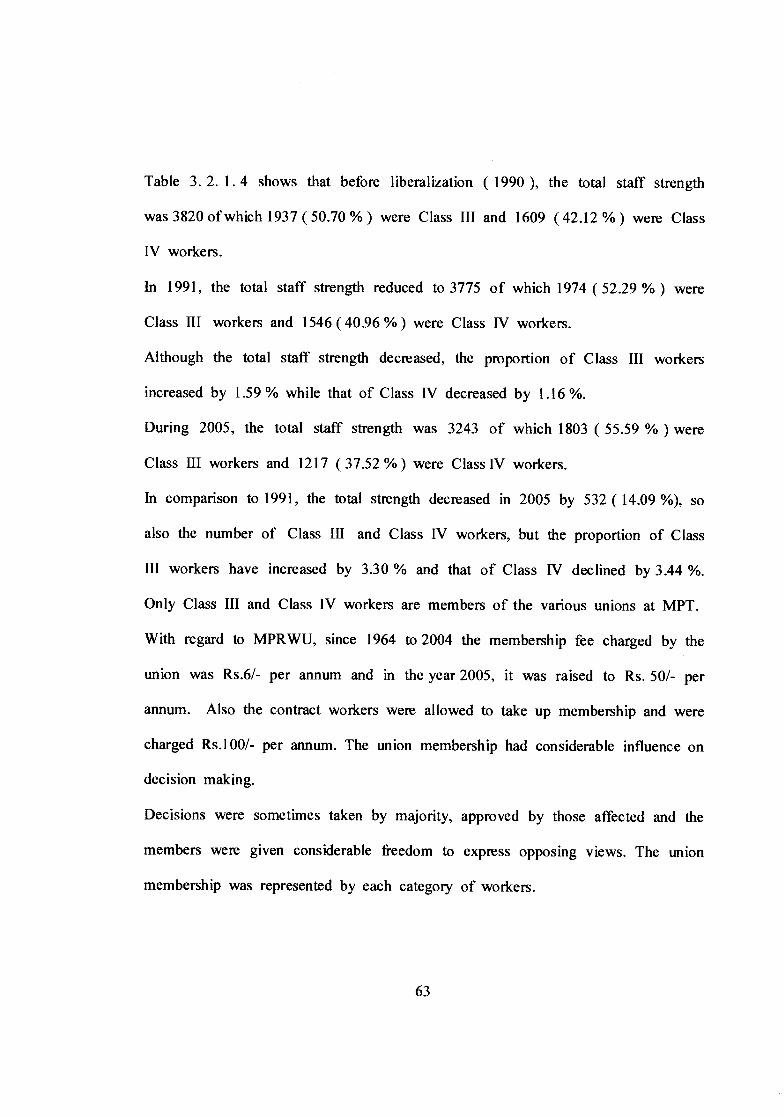
Table 3. 2. 1. 4 shows that before liberalization ( 1990 ), the total staff strength
was 3820 of which 1937 ( 50.70 %) were Class III and 1609 ( 42.12 %) were Class
IV workers.
In 1991, the total staff strength reduced to 3775 of which 1974 ( 52.29 %) were
Class III workers and 1546 ( 40.96 %) were Class IV workers.
Although the total staff strength decreased, the proportion of Class III workers
increased by 1.59 % while that of Class IV decreased by 1.16 %.
During 2005, the total staff strength was 3243 of which 1803 ( 55.59 ) were
Class III workers and 1217 ( 37.52 %) were Class IV workers.
In comparison to 1991, the total strength decreased in 2005 by 532 ( 14.09 %), so
also the number of Class III and Class IV workers, but the proportion of Class
III workers have increased by 3.30 % and that of Class IV declined by 3.44 %.
Only Class III and Class IV workers are members of the various unions at MPT.
With regard to MPRWU, since 1964 to 2004 the membership fee charged by the
union was Rs.6/- per annum and in the year 2005, it was raised to Rs. 50/- per
annum. Also the contract workers were allowed to take up membership and were
charged Rs.100/- per annum. The union membership had considerable influence on
decision making.
Decisions were sometimes taken by majority, approved by those affected and the
members were given considerable freedom to express opposing views. The union
membership was represented by each category of workers.
63
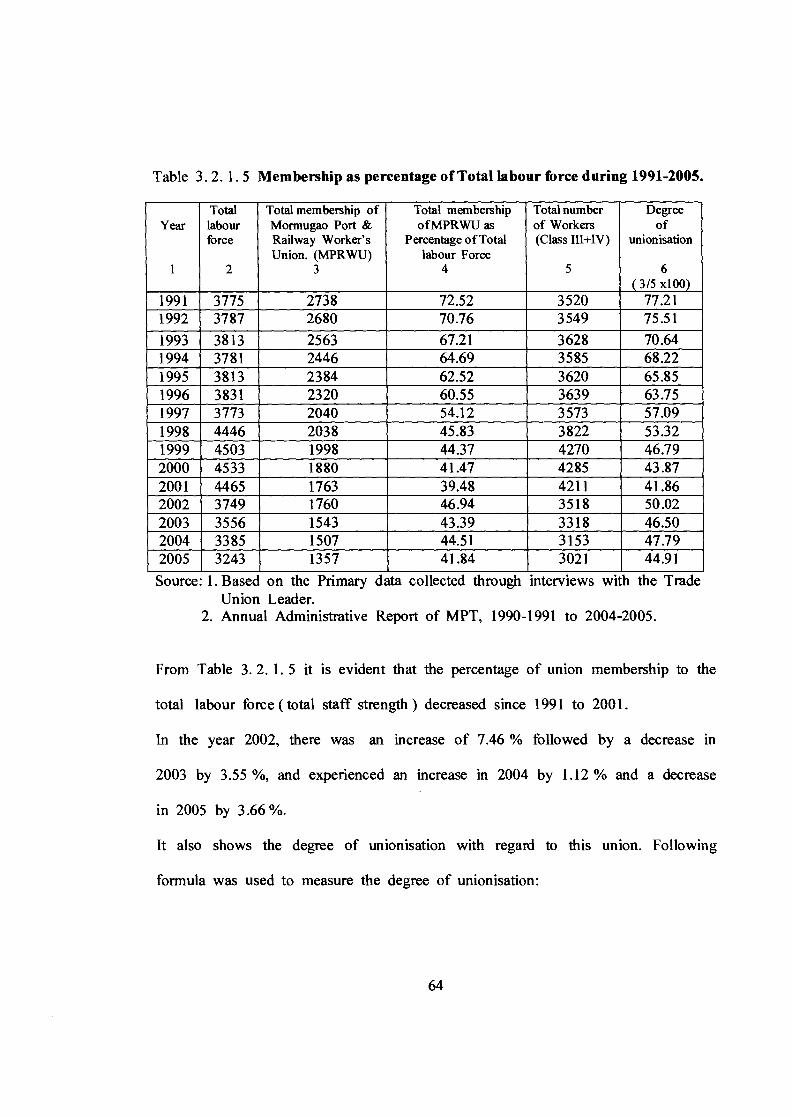
Table 3. 2. 1.5 Membership as percentage of Total labour force during 1991-2005.
Year
1
Total labour force
2
Total membership of Mormugao Port & Railway Worker's Union. (MPRWU)
3
Total membership of MPRWU as
Percentage of Total labour Force
4
Total number of Workers (Class IIII+IV)
5
Degree of
unionisation
6 ( 3/5 x100)
1991 3775 2738 72.52 3520 77.21 1992 3787 2680 70.76 3549 75.51
1993 3813 2563 67.21 3628 70.64 1994 3781 2446 64.69 3585 68.22 1995 3813 2384 62.52 3620 65.85 1996 3831 2320 60.55 3639 63.75 1997 3773 2040 54.12 3573 57.09 1998 4446 2038 45.83 3822 53.32 1999 4503 1998 44.37 4270 46.79 2000 4533 1880 41.47 4285 43.87 2001 4465 1763 39.48 4211 41.86 2002 3749 1760 46.94 3518 50.02 2003 3556 1543 43.39 3318 46.50 2004 3385 1507 44.51 3153 47.79 2005 3243 1357 41.84 3021 44.91
Source 1. Based on the Primary data collected through interviews with the Trade Union Leader.
2. Annual Administrative Report of MPT, 1990-1991 to 2004-2005.
From Table 3. 2. 1. 5 it is evident that the percentage of union membership to the
total labour force ( total staff strength ) decreased since 1991 to 2001.
In the year 2002, there was an increase of 7.46 % followed by a decrease in
2003 by 3.55 %, and experienced an increase in 2004 by 1.12 % and a decrease
in 2005 by 3.66 %.
It also shows the degree of unionisation with regard to this union. Following
formula was used to measure the degree of unionisation:
64
Union membership
Degree of unionisation = x 100
Total number of workers employed
The Table 3. 2. 1. 5 points out that the degree of unionisation was as high as
77.21 % in 1991 but had declined to around 45 % during 2005.
GOA PORT & DOCK EMPLOYEES UNION (GPDEU)
For purpose of this study, 63 members of this union ( 5 % of 1261 members in
2005 ) were selected by stratified sampling method from all the ten departments
and consisted of analyst, clerks, peons, accountants, office superintendent, wiremen,
nurses, hospital attendants, laboratory technicians, dresser, painter, mate, carpenters,
electricians, khalasees, junior engineers, etc.
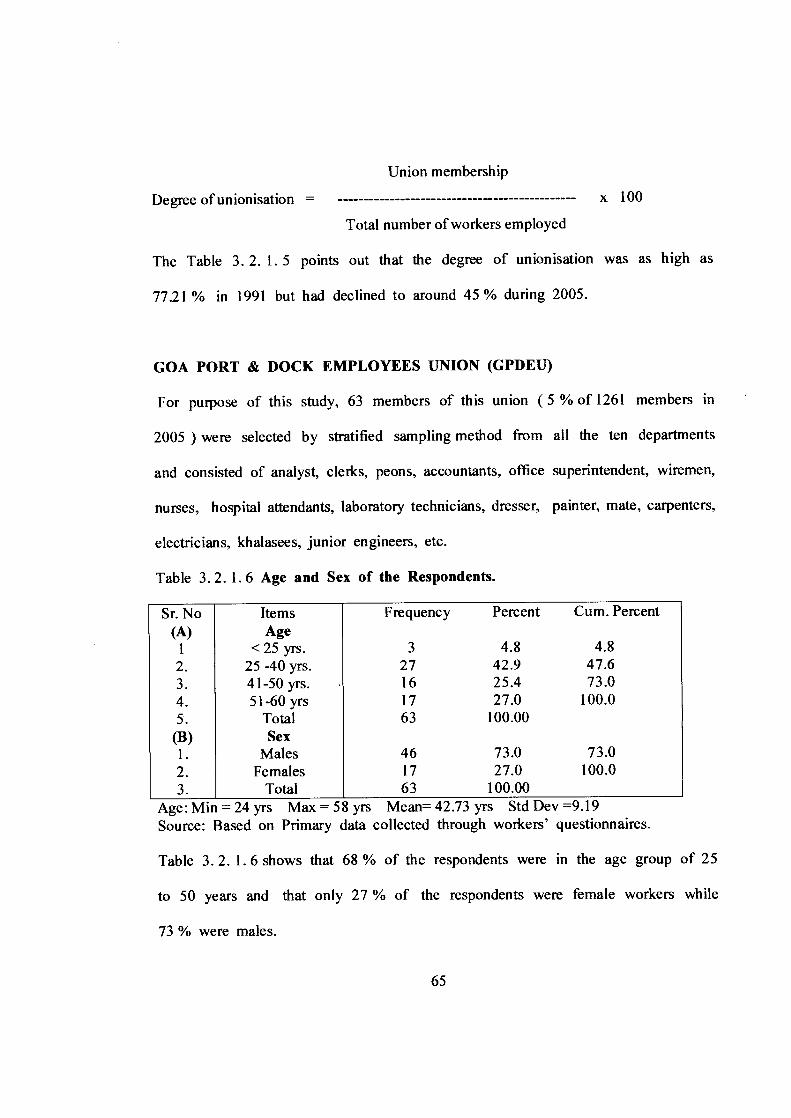
Table 3. 2. 1.6 Age and Sex of the Respondents.
Sr. No (A)
Items Age
Frequency Percent Cum. Percent
1 < 25 yrs. 3 4.8 4.8 2. 25 -40 yrs. 27 42.9 47.6 3. 41-50 yrs. 16 25.4 73.0 4. 51-60 yrs 17 27.0 100.0 5. Total 63 100.00
(B) Sex 1. Males 46 73.0 73.0 2. Females 17 27.0 100.0 3. Total 63 100.00
Age: Min = 24 yrs Max = 58 yrs Mean= 42.73 yrs Std Dev =9.19 Source: Based on Primary data collected through workers' questionnaires.
Table 3. 2. 1.6 shows that 68 % of the respondents were in the age group of 25
to 50 years and that only 27 % of the respondents were female workers while
73 % were males.
65
Statistically speaking, the minimum age of the respondent was 24 yrs while the
maximum age of the respondents was 58 yrs. Also the average age of the
respondents was found to be almost 43 yrs and there was variation found in the
age of the respondents.
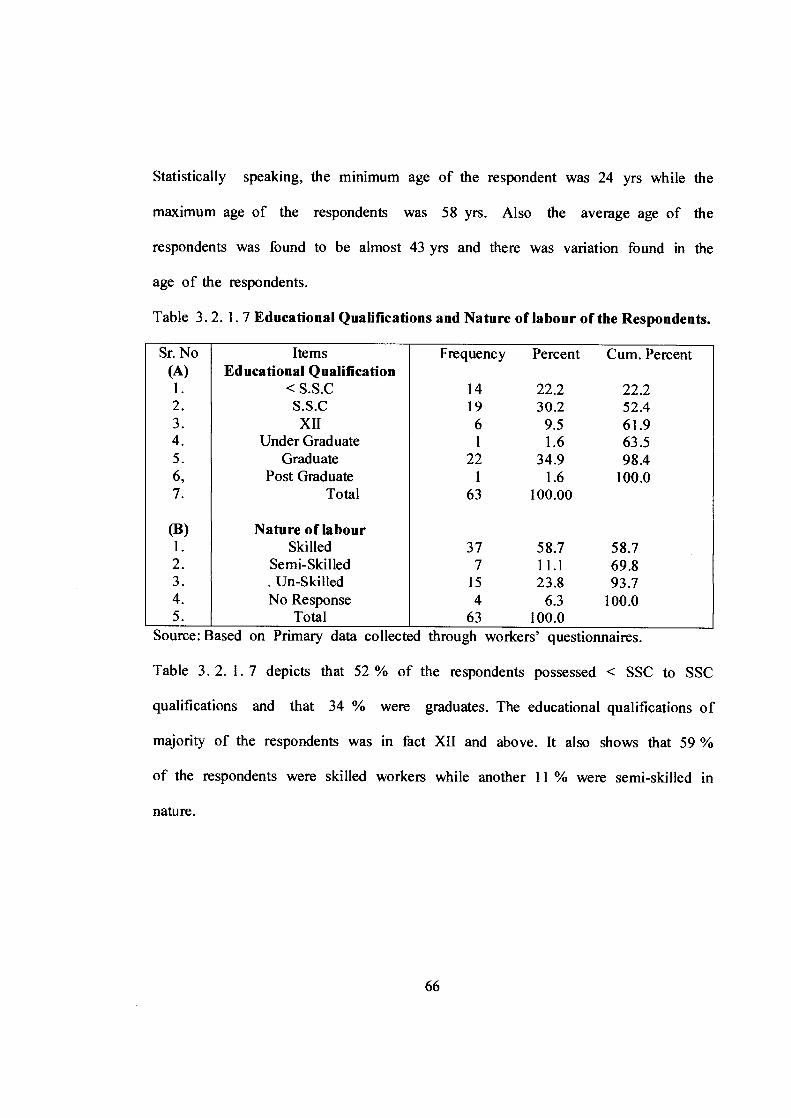
Table 3.2. 1.7 Educational Qualifications and Nature of labour of the Respondents.
Sr. No (A)
Items Educational Qualification
Frequency Percent Cum. Percent
1. < S.S.0 14 22.2 22.2 2. S.S.0 19 30.2 52.4 3. XII 6 9.5 61.9 4. Under Graduate 1 1.6 63.5 5- Graduate 22 34.9 98.4 6 , Post Graduate 1 1.6 100.0 7. Total 63 100.00
(B) Nature of labour 1. Skilled 37 58.7 58.7 2. Semi-Skilled 7 11.1 69.8 3. Un-Skilled 15 23.8 93.7 4. No Response 4 6.3 100.0 5. Total 63 100.0
Source: Based on Primary data collected through workers' questionnaires.
Table 3. 2. 1. 7 depicts that 52 % of the respondents possessed < SSC to SSC
qualifications and that 34 % were graduates. The educational qualifications of
majority of the respondents was in fact XII and above. It also shows that 59 %
of the respondents were skilled workers while another 11 % were semi-skilled in
nature.
66
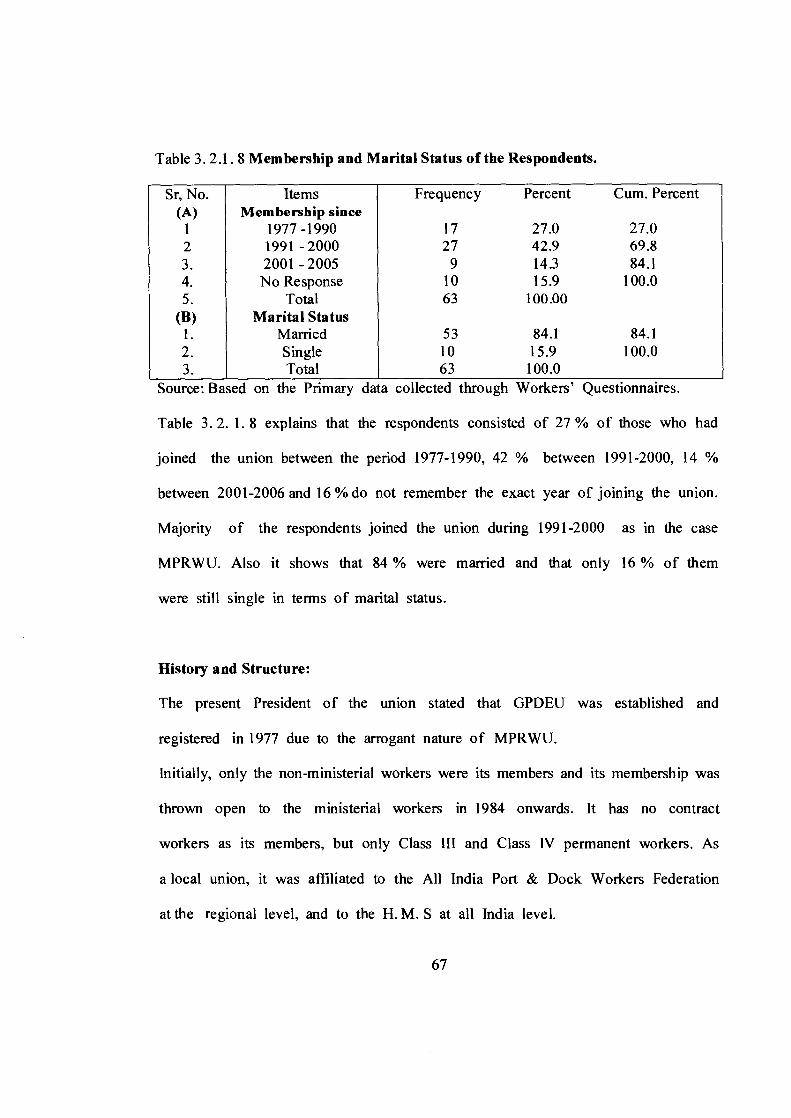
Table 3. 2.1. 8 Membership and Marital Status of the Respondents.
Sr, No. (A)
Items Membership since
Frequency Percent Cum. Percent
1 1977 -1990 17 27.0 27.0 2 1991 - 2000 27 42.9 69.8 3. 2001 - 2005 9 14.3 84.1 4. No Response 10 15.9 100.0 5. Total 63 100.00
(B) Marital Status 1. Married 53 84.1 84.1 2. Single 10 15.9 100.0 3. Total 63 100.0
Source: Based on the Primary data collected through Workers' Questionnaires.
Table 3. 2. 1. 8 explains that the respondents consisted of 27 % of those who had
joined the union between the period 1977-1990, 42 % between 1991-2000, 14 %
between 2001-2006 and 16 % do not remember the exact year of joining the union.
Majority of the respondents joined the union during 1991-2000 as in the case
MPRWU. Also it shows that 84 % were married and that only 16 % of them
were still single in terms of marital status.
History and Structure:
The present President of the union stated that GPDEU was established and
registered in 1977 due to the arrogant nature of MPRWU.
Initially, only the non-ministerial workers were its members and its membership was
thrown open to the ministerial workers in 1984 onwards. It has no contract
workers as its members, but only Class III and Class IV permanent workers. As
a local union, it was affiliated to the All India Port & Dock Workers Federation
at the regional level, and to the H. M. S at all India level.
67
During 1990-2005, biennial General Body meetings were held. Its executive
committee was elected regularly during such meetings, as it had a moderate
tenure. It faced a moderate contest between individuals rather than groups. The
union had high union solidarity and cordial relations with the management. Its
strike proneness was low and was indifferent to the management disposition
towards the union or union disposition towards the management.
In 2005, the Executive Committee consisted of the President, three Vice-
Presidents, the Secretary, two Assistant Secretaries, the Treasurer and had twenty-
two committee members.
Administration:
The union executive conducted its meetings regularly with a moderate attendance
but active participation and functioned in a democratic manner. The executive
body played an important role in decision making. All negotiations were carried
out by the President or the General Secretary. During 1990-1995 period, it
organised dharnas, morchas, strikes more frequently. During the later period, since
1995 onwards, it gave more importance to settling the issues through negotiations.
During 2000 onwards, the percentage of demonstrations was negligible. The union
aims at providing better facilities to the workers as well as their families.
The union's priorities are settling labour grievances especially regarding the
outdoor staff and taking immediate action with regard to accidental cases.
68
The union does not have any political affiliation or involvement and has sound
finances collected through membership fee.
Personnel, Membership and Degree of Unionisation:
A membership fee of Rs.25/- per annum was charged per member. Its membership
was restricted to permanent workers only. The union always believed in decision
by majority and need for approval of those affected. It bestowed on its members
the freedom to express opposing views.
According to its President, the members show a lot of interest in the union
affairs, as it encouraged self expression and freedom of action. It gave importance
to discipline and even issued notices to some of its members on account of
indiscipline, although on a very rare basis. To improve social soliciFity among
members it entertained all sorts of grievances including those of workers families
as well.
69
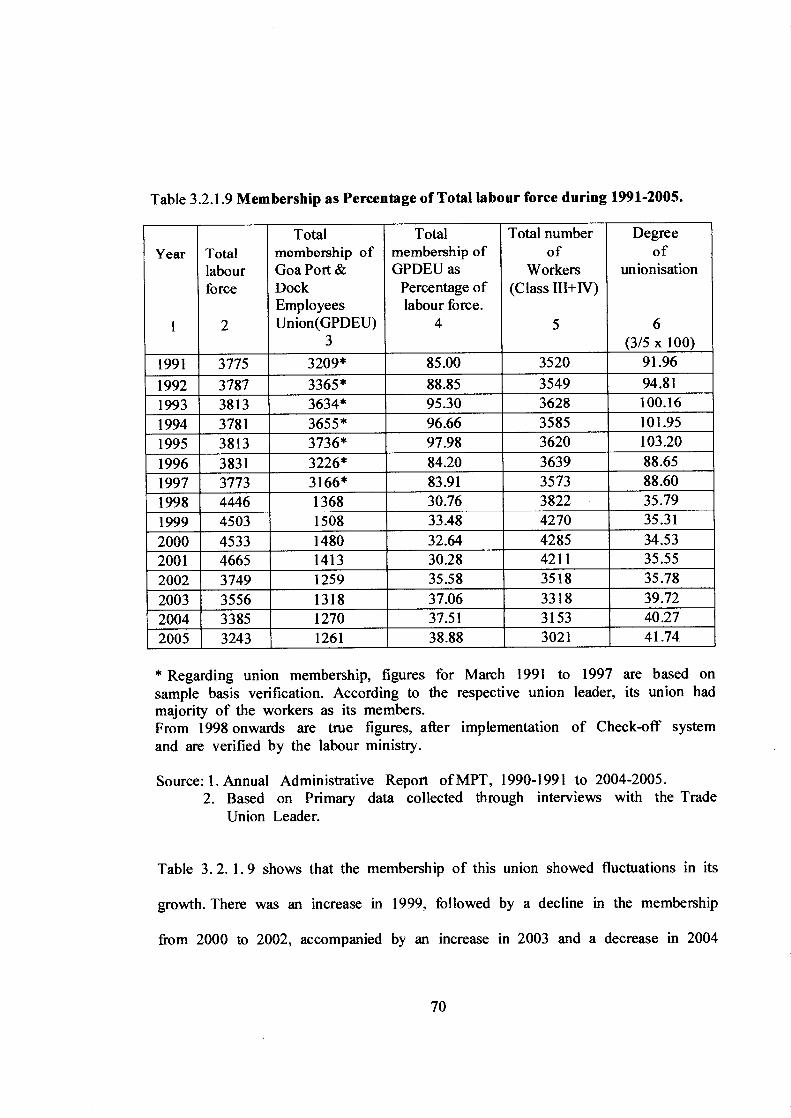
Table 3.2.1.9 Membership as Percentage of Total labour force during 1991-2005.
Year
1
Total labour force
2
Total membership of Goa Port & Dock Employees Union(GPDEU)
3
Total membership of GPDEU as
Percentage of labour force.
4
Total number of
Workers (Class III+IV)
5
Degree of
unionisation
6 (3/5 x 100)
1991 3775 3209* 85.00 3520 91.96
1992 3787 3365* 88.85 3549 94.81
1993 3813 3634* 95.30 3628 100.16
1994 3781 3655* 96.66 3585 101.95
1995 3813 3736* 97.98 3620 103.20
1996 3831 3226* 84.20 3639 88.65
1997 3773 3166* 83.91 3573 88.60
1998 4446 1368 30.76 3822 35.79
1999 4503 1508 33.48 4270 35.31
2000 4533 1480 32.64 4285 34.53 2001 4665 1413 30.28 4211 35.55 2002 3749 1259 35.58 3518 35.78
2003 3556 1318 37.06 3318 39.72
2004 3385 1270 37.51 3153 40.27 2005 3243 1261 38.88 3021 41.74
* Regarding union membership, figures for March 1991 to 1997 are based on sample basis verification. According to the respective union leader, its union had majority of the workers as its members. From 1998 onwards are true figures, after implementation of Check-off system and are verified by the labour ministry.
Source: 1. Annual Administrative Report of MPT, 1990-1991 to 2004-2005. 2. Based on Primary data collected through interviews with the Trade
Union Leader.
Table 3.2. 1.9 shows that the membership of this union showed fluctuations in its
growth. There was an increase in 1999, followed by a decline in the membership
from 2000 to 2002, accompanied by an increase in 2003 and a decrease in 2004
70
and 2005. In the year 2000, the increase in total labour force was greater than
the decrease in membership and this led to the decrease in the percentage of
union membership to the total labour force.
The increase in the percentage from 2002 to 2005 is caused by the decrease in
both the membership and total labour force .
Table 3. 2. 1.9 also shows that the degree of unionization declined from 1996 to
2000 and has increased from 2001 onwards.
3. 2. 2 MAIN FINDINGS:
The two recognized unions namely, The Mormugao Port & Railway Workers'
Union and The Goa Port & Dock Employees Union were established in the year
1964 and 1976 respectively. The unions were affiliated to an All India Federation
- Hind Mazdoor Sabha.
The Executive Committees were large in size, elected through democratic
procedures and were governed by the Code of Conduct. Inter-union rivalry existed
with no attempts for a merger although eighty percent of the respondents were of
the opinion that it undermined collective bargaining and sixty percent agreed that
it was more advantageous to the management. Unions provided its members an
easy accessibility to its top leadership. The union leadership was trained,
experienced, co-operative and sincere. The newly recruited workers showed
indifference to the union activities and its functioning. Very little time was
devoted by the members and also the attendance at the union meetings was
71
moderate. The Mormugao Port & Railway Workers' Union had a favourable
disposition towards the management while that of the Goa Port & Dock
Employees Union was indifferent in nature.
The Mormugao Port and Railway Worker's Union enjoyed majority in terms of
membership while the Goa Port & Dock Employees Union had a more stable
percentage of union membership to the total labour force. The degree of
unionisation of each of the two unions at Mormugao Port Trust was between 40
to 45 %. The unions had no political affiliation or involvement.
3.3 PROFILE OF TRADE UNIONS AT GOA SHIPYARD LIMITED:
Goa Shipyard Limited (GSL) is a Government of India Undertaking, under the
administrative control of the Department of Defense Production, Ministry of
Defence. It was established in 1957. It is specialized in the production of Sail
Training Ship, Fast Patrol Vessels, Offshore Patrol Vessels, Advanced Offshore
Patrol Vessels, Missile Craft, Extra Fast Attack Craft, Offshore Platform Supply
Cum Standby Vessel, 300 Passenger Vessel, 650 Ton Oil Tanker, and 35 Knots
Fast Patrol Vessel.
3.3.1 GROWTH OF TRADE UNIONS AT GOA SHIPYARD LIMITED:
There were four unions and three Associations functioning at Goa Shipyard
Limited namely:
72
1. Shipyard Employees Union - Goa .
2. Goa Shipyard Workers Union.
3. Goa Shipyard Kamgar Sangh.
4. Goa Shipyard Kamgar Ekvott.
The three Associations were:
1. Shipyard Technical Staff Association - Goa.
2. Goa Shipyard Administrative Staff Association.
3. Goa Shipyard Supervisors Association.
According to the Mohan Commission, the associations were not recognized as
unions although they were registered as trade unions with the Registrar of Trade
Unions. The association members opted for the non-unionised pay scales and
benefits and as a result, the Management considers only the organization of
worker class as unions.
The Shipyard Employees Union — Goa was set up in 1977 as the sole union
functioning at GSL until 1984 when the Goa Shipyard Workers Union was
established to safeguard workers who showed dissent with the main union from
being victimized and was affiliated to the A.I.T.U.0 Although these unions existed
even at present, they are not recognized by the management. In 1997, The
Shipyard Employees' Union — Goa suffered a split in the union which gave
rise to the forming of the Goa Shipyard Kamgar Sangh ( GSKS ) in 1998 and
Goa Shipyard Kamgar Ekvott ( GSKE ) in 2001, the two recognized unions at
Goa Shipyard Limited.
73
During 2001-2005 period, 891 workers ( i.e. 84.30 % of 1057 workers in 2005 )
were registered as members of these two unions.
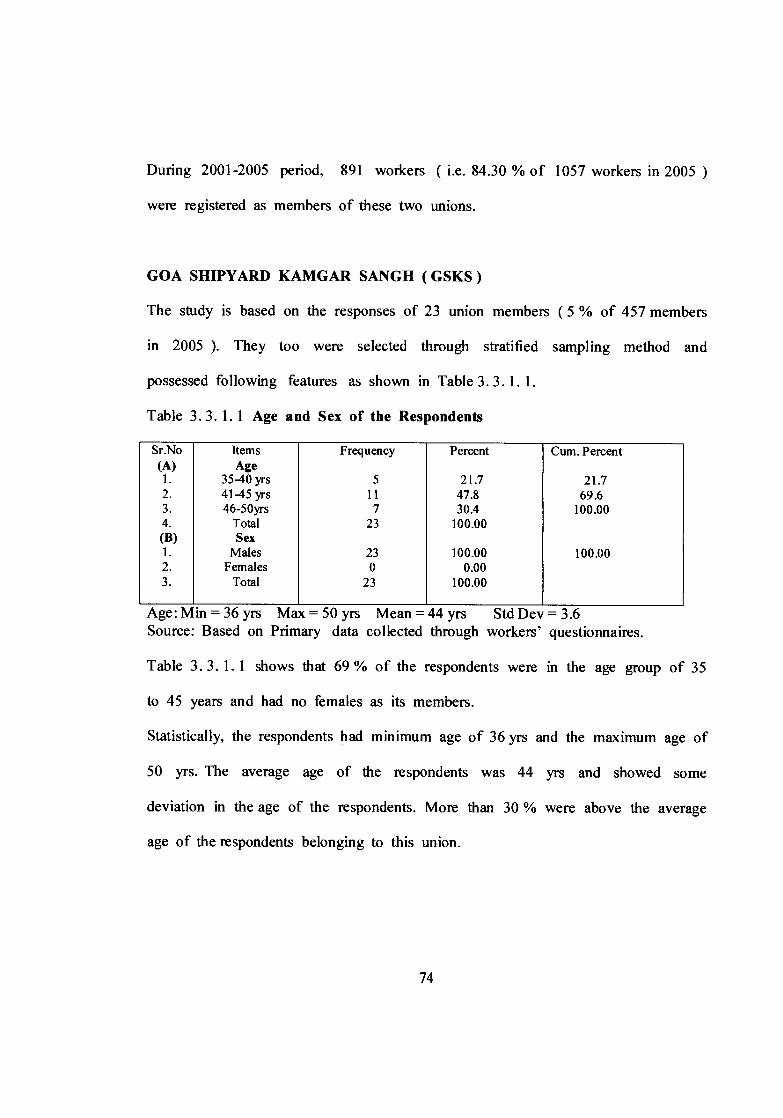
GOA SHIPYARD KAMGAR SANGH ( GSKS )
The study is based on the responses of 23 union members ( 5 % of 457 members
in 2005 ). They too were selected through stratified sampling method and
possessed following features as shown in Table 3. 3. 1. 1.
Table 3. 3. 1. 1 Age and Sex of the Respondents
Sr.No Items Frequency Percent Cum. Percent (A) Age 1. 35-40 yrs 5 21.7 21.7 2. 41-45 yrs 11 47.8 69.6 3. 46-50yrs 7 30.4 100.00 4. Total 23 100.00 (B) Sex 1. Males 23 100.00 100.00 2. Females 0 0.00 3. Total 23 100.00
Age: Min = 36 yrs Max = 50 yrs Mean = 44 yrs Std Dev = 3.6 Source: Based on Primary data collected through workers' questionnaires.
Table 3. 3. 1. 1 shows that 69 % of the respondents were in the age group of 35
to 45 years and had no females as its members.
Statistically, the respondents had minimum age of 36 yrs and the maximum age of
50 yrs. The average age of the respondents was 44 yrs and showed some
deviation in the age of the respondents. More than 30 % were above the average
age of the respondents belonging to this union.
74
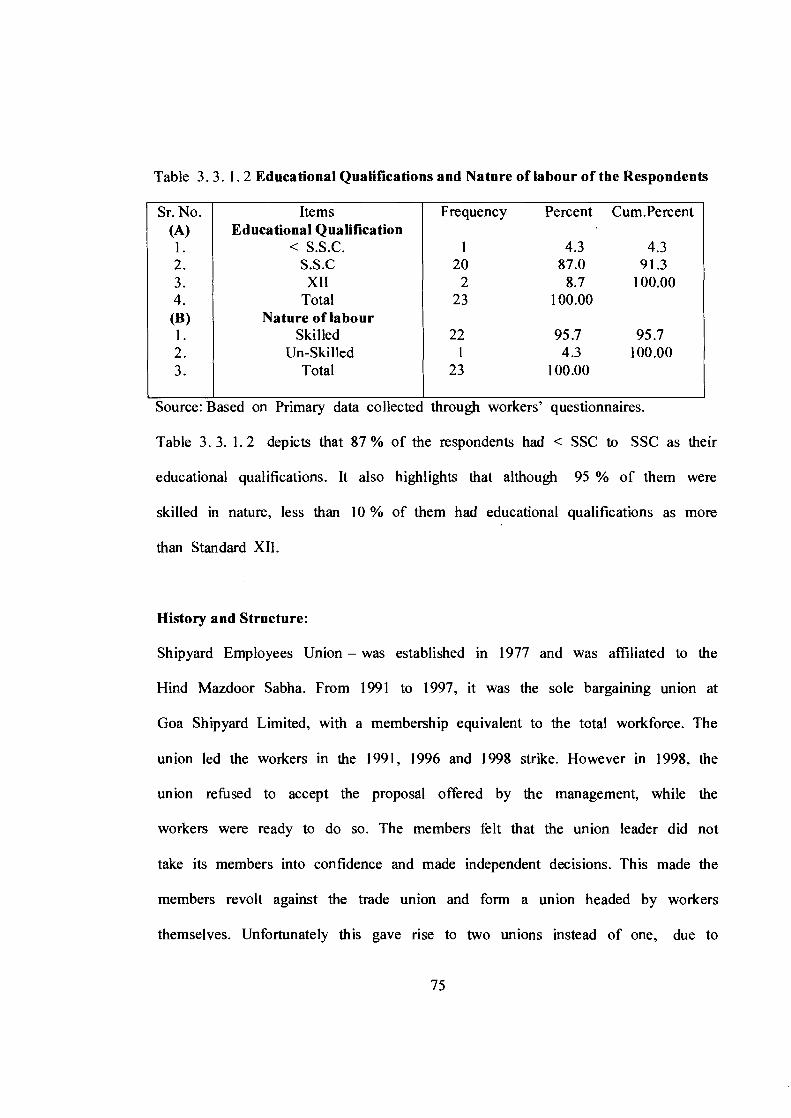
Table 3. 3. 1. 2 Educational Qualifications and Nature of labour of the Respondents
Sr. No. (A)
Items Educational Qualification
Frequency Percent Cum.Percent
1. < S.S.C. 1 4.3 4.3 2. S.S.0 20 87.0 91.3 3. XII 2 8.7 100.00 4. Total 23 100.00 (B) Nature of labour 1. Skilled 22 95.7 95.7 2. Un-Skilled 1 4.3 100.00 3. Total 23 100.00
Source: Based on Primary data collected through workers' questionnaires.
Table 3. 3. 1.2 depicts that 87 % of the respondents had < SSC to SSC as their
educational qualifications. It also highlights that although 95 % of them were
skilled in nature, less than 10 % of them had educational qualifications as more
than Standard XII.
History and Structure:
Shipyard Employees Union — was established in 1977 and was affiliated to the
Hind Mazdoor Sabha. From 1991 to 1997, it was the sole bargaining union at
Goa Shipyard Limited, with a membership equivalent to the total workforce. The
union led the workers in the 1991, 1996 and 1998 strike. However in 1998, the
union refused to accept the proposal offered by the management, while the
workers were ready to do so. The members felt that the union leader did not
take its members into confidence and made independent decisions. This made the
members revolt against the trade union and form a union headed by workers
themselves. Unfortunately this gave rise to two unions instead of one, due to
75
intra-union rivalry among the members. Goa Shipyard Kamgar Sangh was the first
union to be formed in 1998. It was affiliated to the Bharatiya Port and Shipyard
Mazdoor Maha Sangh, an Industrial Federation, and to the Bharatiya Mazdoor
Sangh, an All India Federation.
Its present Executive Committee consists of the President, two Vice-Presidents, the
General Secretary, two Assistant Secretaries and the Treasurer.
Administration:
The Executive body actively participated in the meetings as it played an important
role in the decision making process of the union.
Its primary functions were to increase its contact with its members, provision of
safety devices and safety training, check on absenteeism, to demand a favourable
promotion policy and also signed wage settlement in 2000.
The union organized workshops on Industrial Disputes Act and Domestic Inquiry
and also educated its members on topics like Aids and its prevention,
absenteeism, etc. The union's relation with the other union was cooperative in
nature.
76
Personnel, Membership and Degree of Unionisation:
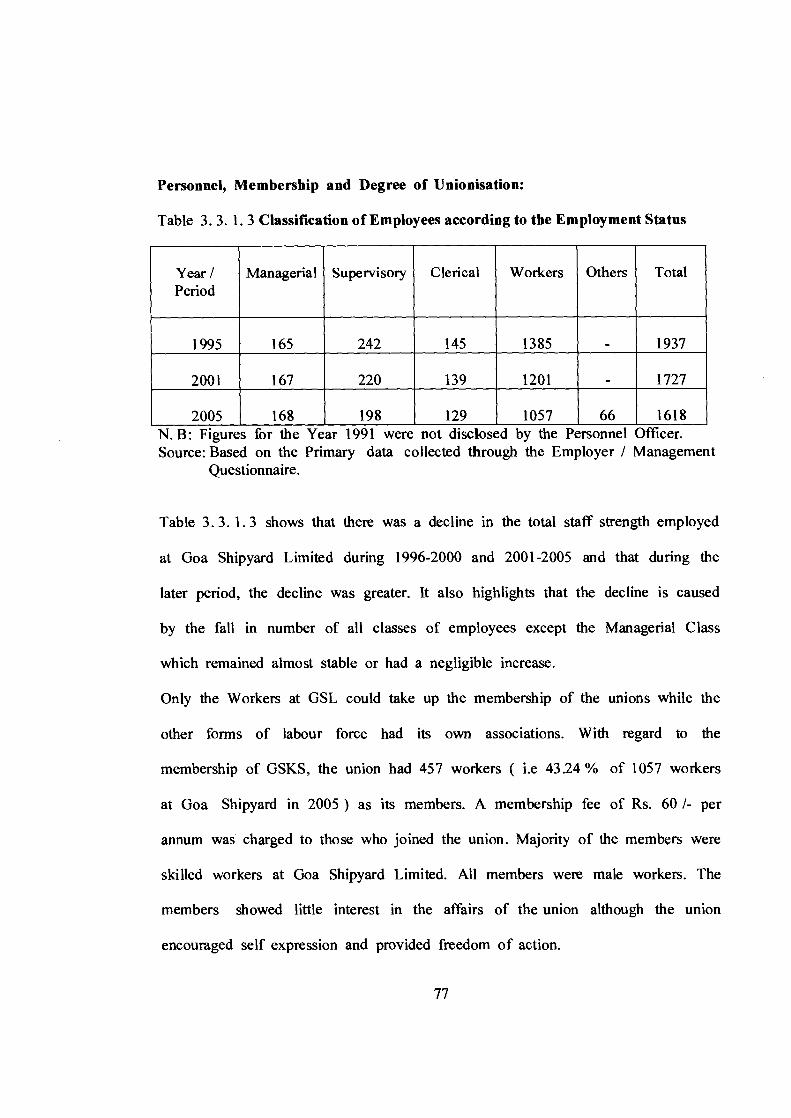
Table 3. 3. 1.3 Classification of Employees according to the Employment Status
Year / Period
Managerial Supervisory Clerical Workers Others Total
1995 165 242 145 1385 - 1937
2001 167 220 139 1201 - 1727
2005 168 198 129 1057 66 1618 N. B: Figures for the Year 1991 were not disclosed by the Personnel Officer. Source: Based on the Primary data collected through the Employer / Management
Questionnaire.
Table 3. 3. 1.3 shows that there was a decline in the total staff strength employed
at Goa Shipyard Limited during 1996-2000 and 2001-2005 and that during the
later period, the decline was greater. It also highlights that the decline is caused
by the fall in number of all classes of employees except the Managerial Class
which remained almost stable or had a negligible increase.
Only the Workers at GSL could take up the membership of the unions while the
other forms of labour force had its own associations. With regard to the
membership of GSKS, the union had 457 workers ( i.e 43.24 % of 1057 workers
at Goa Shipyard in 2005 ) as its members. A membership fee of Rs. 60 /- per
annum was charged to those who joined the union. Majority of the members were
skilled workers at Goa Shipyard Limited. All members were male workers. The
members showed little interest in the affairs of the union although the union
encouraged self expression and provided freedom of action.
77
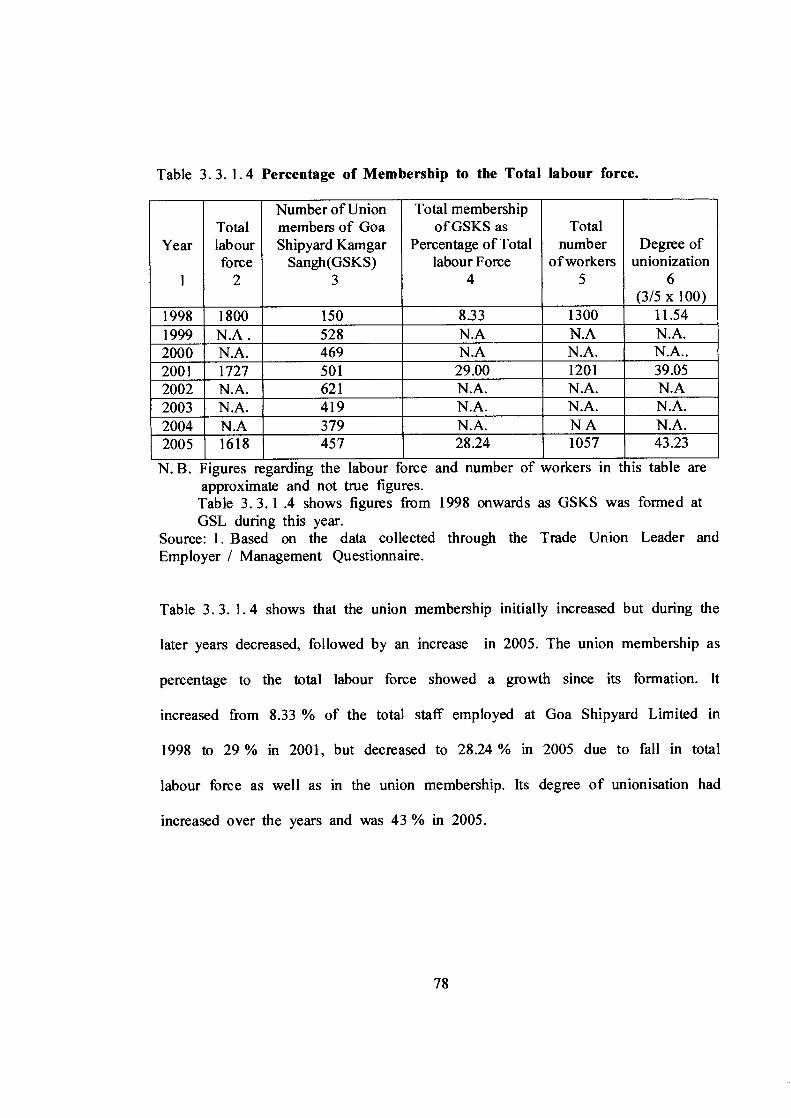
Table 3.3. 1.4 Percentage of Membership to the Total labour force.
Year
1
Total labour force
2
Number of Union members of Goa Shipyard Kamgar
Sangh(GSKS) 3
Total membership of GSKS as
Percentage of Total labour Force
4
Total number
of workers 5
Degree of unionization
6 (3/5 x 100)
1998 1800 150 8.33 1300 11.54 1999 N.A . 528 N.A N.A N.A. 2000 N.A. 469 N.A N.A. N.A.. 2001 1727 501 29.00 1201 39.05 2002 N.A. 621 N.A. N.A. N.A 2003 N.A. 419 N.A. N.A. N.A. 2004 N.A 379 N.A. N A N.A. 2005 1618 457 28.24 1057 43.23
N. B. Figures regarding the labour force and number of workers in this table are approximate and not true figures. Table 3. 3. 1 .4 shows figures from 1998 onwards as GSKS was formed at GSL during this year.
Source: 1. Based on the data collected through the Trade Union Leader and Employer / Management Questionnaire.
Table 3. 3. 1.4 shows that the union membership initially increased but during the
later years decreased, followed by an increase in 2005. The union membership as
percentage to the total labour force showed a growth since its formation. It
increased from 8.33 % of the total staff employed at Goa Shipyard Limited in
1998 to 29 % in 2001, but decreased to 28.24 % in 2005 due to fall in total
labour force as well as in the union membership. Its degree of unionisation had
increased over the years and was 43 % in 2005.
78
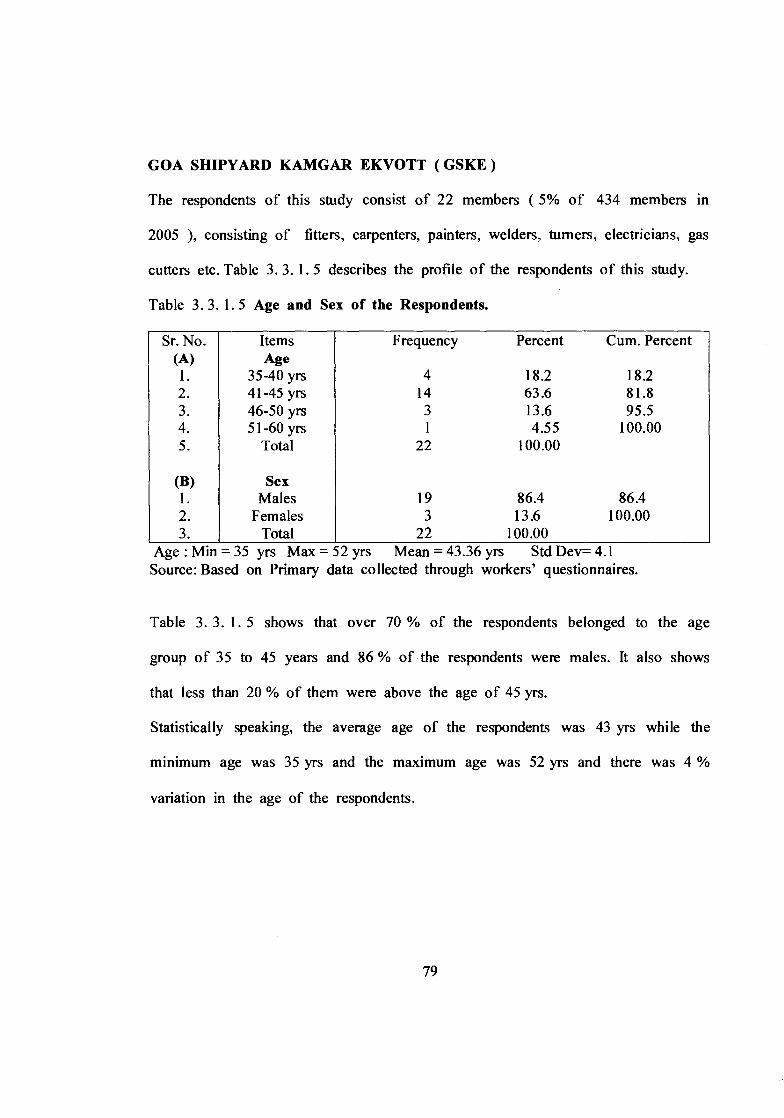
GOA SHIPYARD KAMGAR EKVOTT ( GSKE )
The respondents of this study consist of 22 members ( 5% of 434 members in
2005 ), consisting of fitters, carpenters, painters, welders, turners, electricians, gas
cutters etc. Table 3. 3. 1.5 describes the profile of the respondents of this study.
Table 3. 3. 1.5 Age and Sex of the Respondents.
Sr. No. Items Frequency Percent Cum. Percent (A) Age 1. 35-40 yrs 4 18.2 18.2 2. 41-45 yrs 14 63.6 81.8 3. 46-50 yrs 3 13.6 95.5 4. 51-60 yrs 1 4.55 100.00 5- Total 22 100.00
(B) Sex 1. Males 19 86.4 86.4 2. Females 3 13.6 100.00 3. Total 22 100.00
Age : Min = 35 yrs Max = 52 yrs Mean = 43.36 yrs Std Dev= 4.1 Source: Based on Primary data collected through workers' questionnaires.
Table 3. 3. 1. 5 shows that over 70 % of the respondents belonged to the age
group of 35 to 45 years and 86 % of the respondents were males. It also shows
that less than 20 % of them were above the age of 45 yrs.
Statistically speaking, the average age of the respondents was 43 yrs while the
minimum age was 35 yrs and the maximum age was 52 yrs and there was 4 %
variation in the age of the respondents.
79
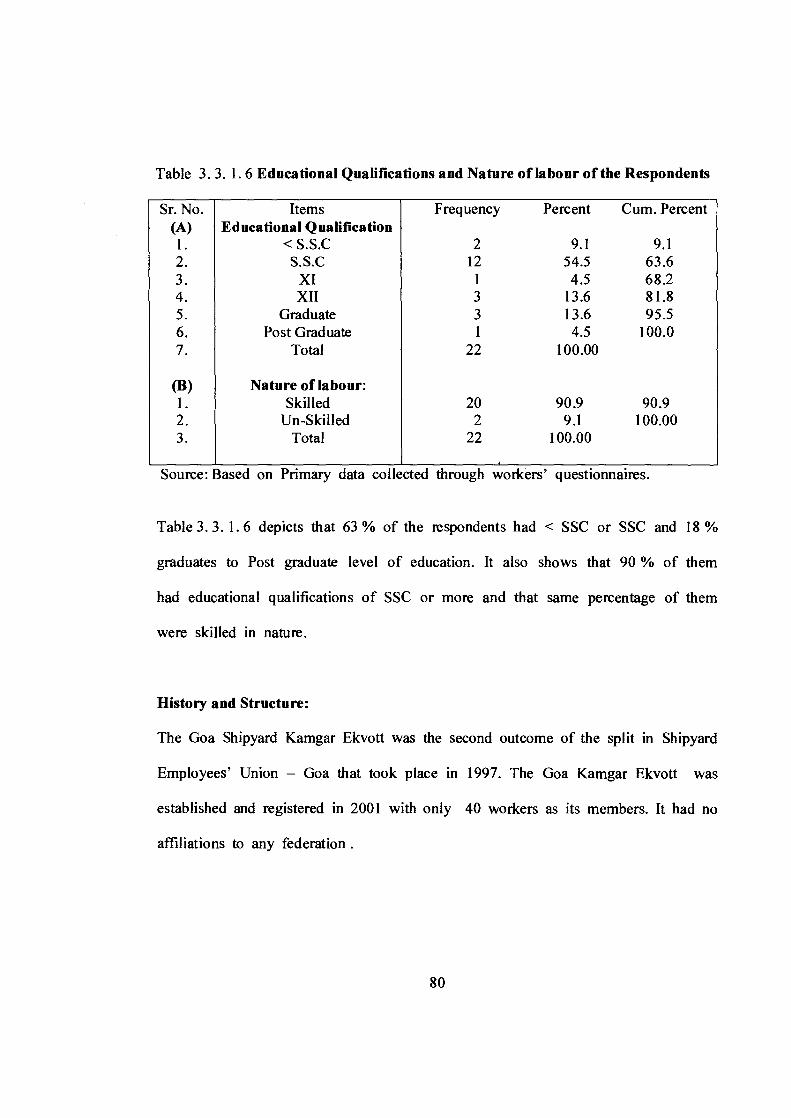
Table 3. 3. 1. 6 Educational Qualifications and Nature of labour of the Respondents
Sr. No. Items Frequency Percent Cum. Percent (A) Educational Qualification
1. < S.S.0 2 9.1 9.1 2. S.S.0 12 54.5 63.6 3. XI 1 4.5 68.2 4. XII 3 13.6 81.8 5- Graduate 3 13.6 95.5 6. Post Graduate 1 4.5 100.0 7. Total 22 100.00
(B) Nature of labour: 1. Skilled 20 90.9 90.9 2. Un-Skilled 2 9.1 100.00 3. Total 22 100.00
Source: Based on Primary data collected through workers' questionnaires.
Table 3.3. 1.6 depicts that 63 % of the respondents had < SSC or SSC and 18 %
graduates to Post graduate level of education. It also shows that 90 % of them
had educational qualifications of SSC or more and that same percentage of them
were skilled in nature.
History and Structure:
The Goa Shipyard Kamgar Ekvott was the second outcome of the split in Shipyard
Employees' Union - Goa that took place in 1997. The Goa Kamgar Ekvott was
established and registered in 2001 with only 40 workers as its members. It had no
affiliations to any federation .
80
The present Executive Committee consisted of the President, three Vice-Presidents,
the General Secretary, the Assistant Secretary and the Treasurer. The Executive
members were nominated and not elected to the respective posts.
Administration:
The Executive Committee conducted its meetings regularly and functioned
democratically. There were no elections held since its inception. The committee
members were nominated to the respective posts in the union. The union gave
preference to reinstating retrenched workers, job security, redressing individual
grievances and improving welfare measures for the workers. It had neither cordial
nor hostile but normal relations with the management. The union lacked a sound
financial condition and tried to generate funds through its members.
Since its formation, some of its main functions were: pursuing HRA / CCA issue
with the Central Government, getting the management to appoint promotion policy
review committee, participating in rallies of workers, helped local independent
unions to form local federation etc.
Personnel, Membership and Degree of Unionisation:
The GSKE, claimed to have had a membership consisting of 41.06 % of the total
number of workers employed in 2005 at Goa Shipyard Limited. Also ninety
percent of its present members, were earlier, members of the Shipyard Employees
Union - Goa. The membership was open to all workers and had 434 members
81
during 2005. It charged a membership fee of Rs. 50 /- per annum and also had
female workers as its members.
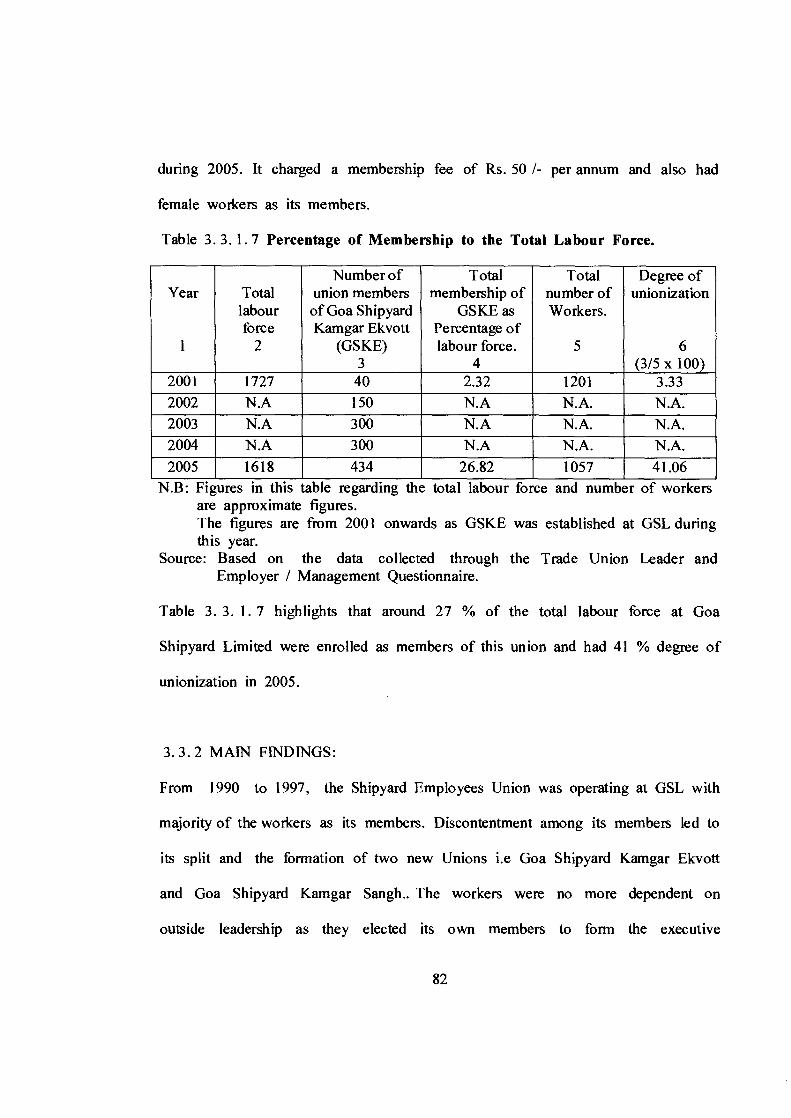
Table 3. 3. 1.7 Percentage of Membership to the Total Labour Force.
Year
1
Total labour force
2
Number of union members of Goa Shipyard Kamgar Ekvott
(GSKE) 3
Total membership of
GSKE as Percentage of labour force.
4
Total number of Workers.
5
Degree of unionization
6 (3/5 x 100)
2001 1727 40 2.32 1201 3.33 2002 N.A 150 N.A N.A. N.A. 2003 N.A 300 N.A N.A. N.A. 2004 NA 300 N.A N.A. N.A.
2005 1618 434 26.82 1057 41.06 N.B: Figures in this table regarding the total labour force and number of workers
are approximate figures. The figures are from 2001 onwards as GSKE was established at GSL during this year.
Source: Based on the data collected through the Trade Union Leader and Employer / Management Questionnaire.
Table 3. 3. 1. 7 highlights that around 27 % of the total labour force at Goa
Shipyard Limited were enrolled as members of this union and had 41 % degree of
unionization in 2005.
3. 3. 2 MAIN FINDINGS:
From 1990 to 1997, the Shipyard Employees Union was operating at GSL with
majority of the workers as its members. Discontentment among its members led to
its split and the formation of two new Unions i.e Goa Shipyard Kamgar Ekvott
and Goa Shipyard Kamgar Sangh.. The workers were no more dependent on
outside leadership as they elected its own members to form the executive
82
committee of the union. The unions were not affiliated to any political party nor
had any political involvement.
The unions conducted its meetings regularly with good attendance and active
participation. The unions lacked a sound financial base and the union disposition
towards the management and that of the management towards the union was
indifferent in nature. There was a rise in the union membership for both the
unions and the degree of unionisation for each of the two unions at Goa
Shipyard Limited was between 40 % to 45 % in 2005.
3.4. PROFILE OF TRADE UNIONS AT COLFAX COMPANY LIMITED:
The Colfax Private Limited was incorporated into the C. M. M. Group of
Companies in the year 1964 and was fully operational in 1968 and manufactured
shaving creams and after shave lotions. However in 1994, the C. M. M. Group of
Companies was split into autonomous units of which Colfax Private Limited was
one of them. It used to manufacture and distribute toiletries under the brand name
of " Old Spice " until 1992 but from 1993 onwards it was permitted to only
manufacture the products. It is a small scale unit of manufacturing.
83
3. 4. 1 GROWTH OF TRADE UNIONS AT COLFAX PRIVATE LIMITED:
At Colfax Private Limited, upto 1991, the workers were organized under the All
Goa General Employees' Union affiliated to the Central Indian Trade Union. And
since 1992 the Gomantak Mazdoor Sangh was the only recognized union at this
unit of study.
GOMANTAK MAZDOOR SANGH ( GMS )
This study is based on the 24 respondents ( 50 % of 48 members in 2005 )
selected on the basis of stratified sampling method. The respondents consist of
machine operators, helpers, packers, sweepers, store keeper, electrician and general
attendant.
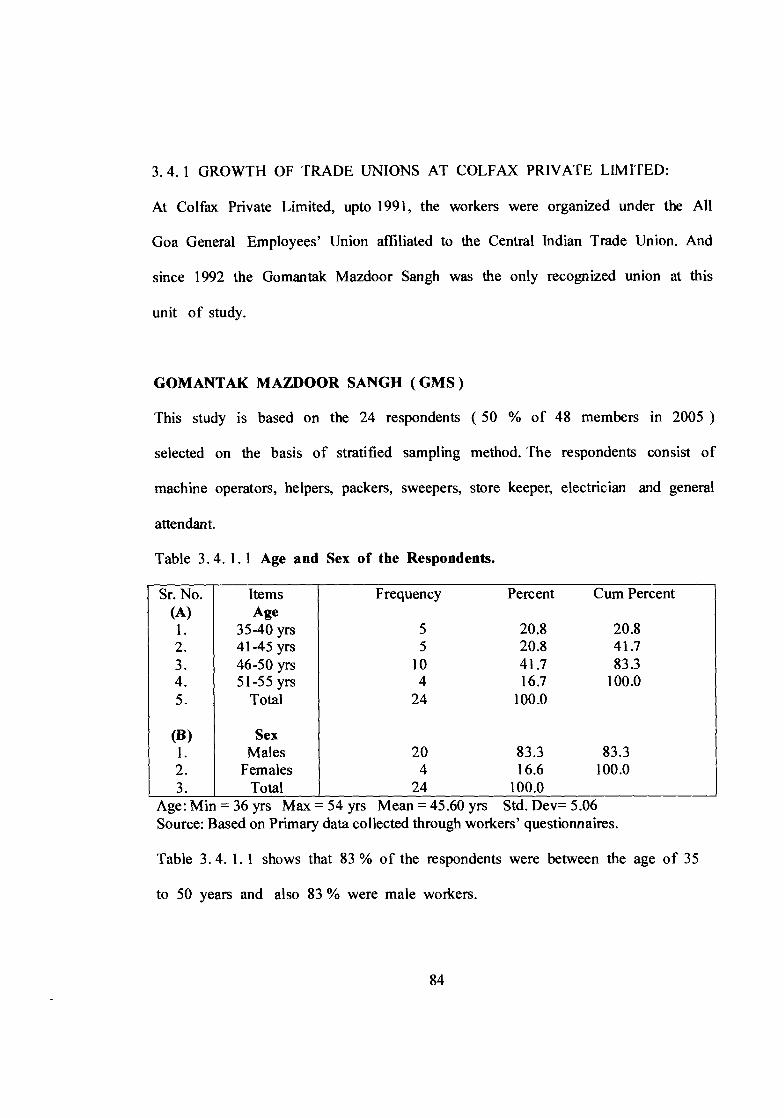
Table 3.4. 1. 1 Age and Sex of the Respondents.
Sr. No. Items Frequency Percent Cum Percent (A) Age 1. 35-40 yrs 5 20.8 20.8 2. 41-45 yrs 5 20.8 41.7 3. 46-50 yrs 10 41.7 83.3 4. 51-55 yrs 4 16.7 100.0 5. Total 24 100.0
(B) Sex 1. Males 20 83.3 83.3 2. Females 4 16.6 100.0 3. Total 24 100.0
Age: Min = 36 yrs Max = 54 yrs Mean = 45.60 yrs Std. Dev= 5.06 Source: Based on Primary data collected through workers' questionnaires.
Table 3. 4. 1. 1 shows that 83 % of the respondents were between the age of 35
to 50 years and also 83 % were male workers.
84
Statistically, the average age of the respondents was 45 yrs and there was
variation found in the age. Around 58 % of the respondents were above the
average age. The youngest respondent was 36 yrs of age and the eldest was 54
yrs old.
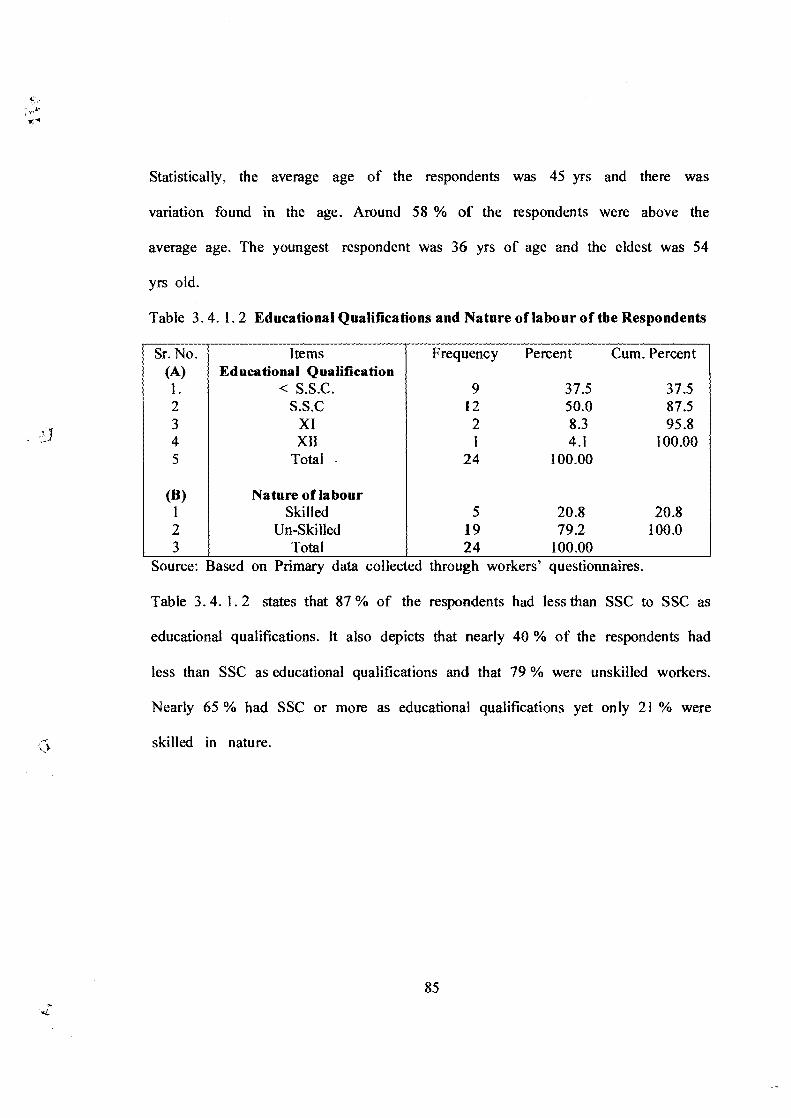
Table 3. 4. 1.2 Educational Qualifications and Nature of labour of the Respondents
Sr. No. Items Frequency Percent Cum. Percent (A) Educational Qualification 1. < S.S.C. 9 37.5 37.5 2 S.S.0 12 50.0 87.5 3 XI 2 8.3 95.8 4 XII 1 4.1 100.00 5 Total 24 100.00
(B) Nature of labour 1 Skilled 5 20.8 20.8 2 Un-Skilled 19 79.2 100.0 3 Total 24 100.00
Source: Based on Primary data collected through workers' questionnaires.
Table 3. 4. 1.2 states that 87 % of the respondents had less than SSC to SSC as
educational qualifications. It also depicts that nearly 40 % of the respondents had
less than SSC as educational qualifications and that 79 % were unskilled workers.
Nearly 65 % had SSC or more as educational qualifications yet only 21 % were
skilled in nature.
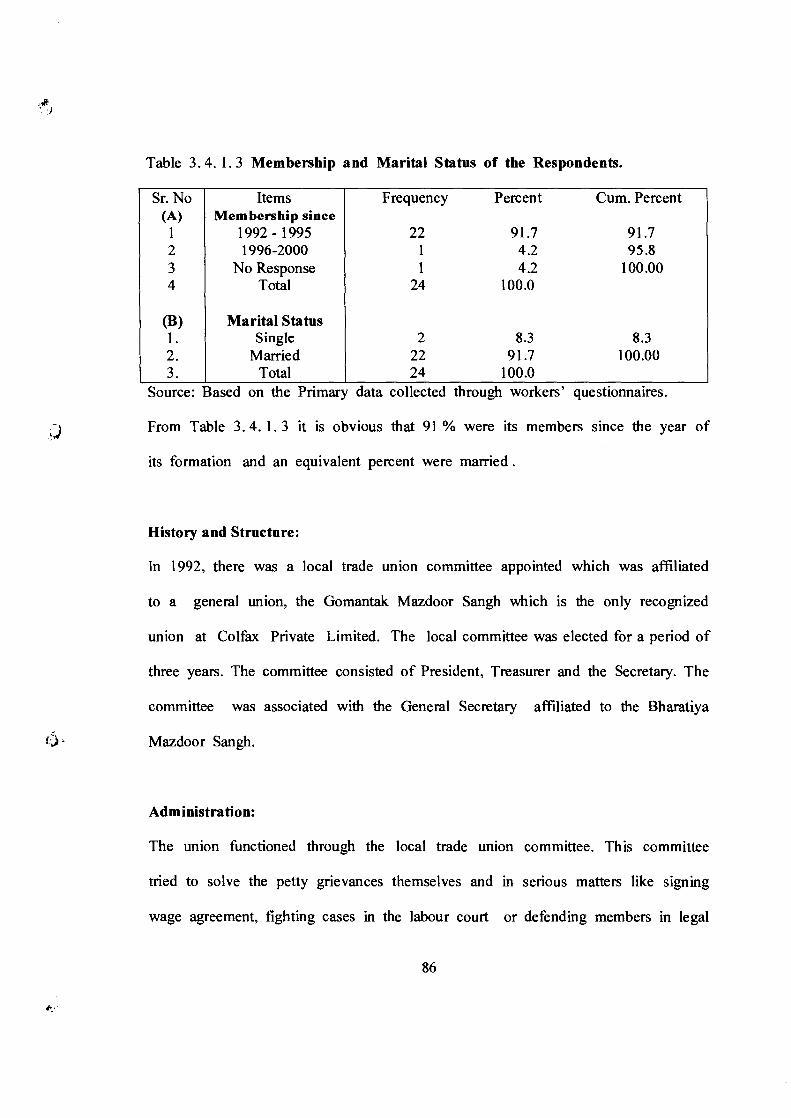
Table 3. 4. 1. 3 Membership and Marital Status of the Respondents.
Sr. No Items Frequency Percent Cum. Percent (A) Membership since
1 1992 - 1995 22 91.7 91.7 2 1996-2000 1 4.2 95.8 3 No Response 1 4.2 100.00 4 Total 24 100.0
(B) Marital Status 1. Single 2 8.3 8.3 2. Married 22 91.7 100.00 3. Total 24 100.0
Source: Based on the Primary data collected through workers' questionnaires.
From Table 3. 4. 1. 3 it is obvious that 91 % were its members since the year of
its formation and an equivalent percent were married .
History and Structure:
In 1992, there was a local trade union committee appointed which was affiliated
to a general union, the Gomantak Mazdoor Sangh which is the only recognized
union at Colfax Private Limited. The local committee was elected for a period of
three years. The committee consisted of President, Treasurer and the Secretary. The
committee was associated with the General Secretary affiliated to the Bharatiya
- Mazdoor Sangh.
Administration:
The union functioned through the local trade union committee. This committee
tried to solve the petty grievances themselves and in serious matters like signing
wage agreement, fighting cases in the labour court or defending members in legal
86
matters is where the General Secretary was involved. The committee kept the union
informed about the difficulties at the shop floor level so that it can act
immediately.
The union priorities consisted of the Charter of Demands which included basic
wage, grades, promotion, revision of scales, allowances, dearness allowance,
educational allowance etc.
The Executive committee was elected regularly every three years during the
general body meeting. The contest for union election was moderate. Inter union
rivalry was absent and the union management relations were cordial. The union
followed a democratic grievance handling procedure. Although the union executive
was very small, there was active participation of its members as it was of
importance for decision making at the meetings.
Personnel, Membership and Degree of Unionisation:
The worker class at Colfax Private Limited was classified as follows:
( i ) Machine operators as Special Grade, First Grade and Second Grade workers.
(ii) Helpers and packers as Third Grade workers.
(iii) Sweepers as Fourth Grade workers and
( iv) General Attendants.
The figures in Table 3. 4. 1. 4 show that even though the union membership
showed a decline, 100 % degree of unionisation was prevalent every year. It
87
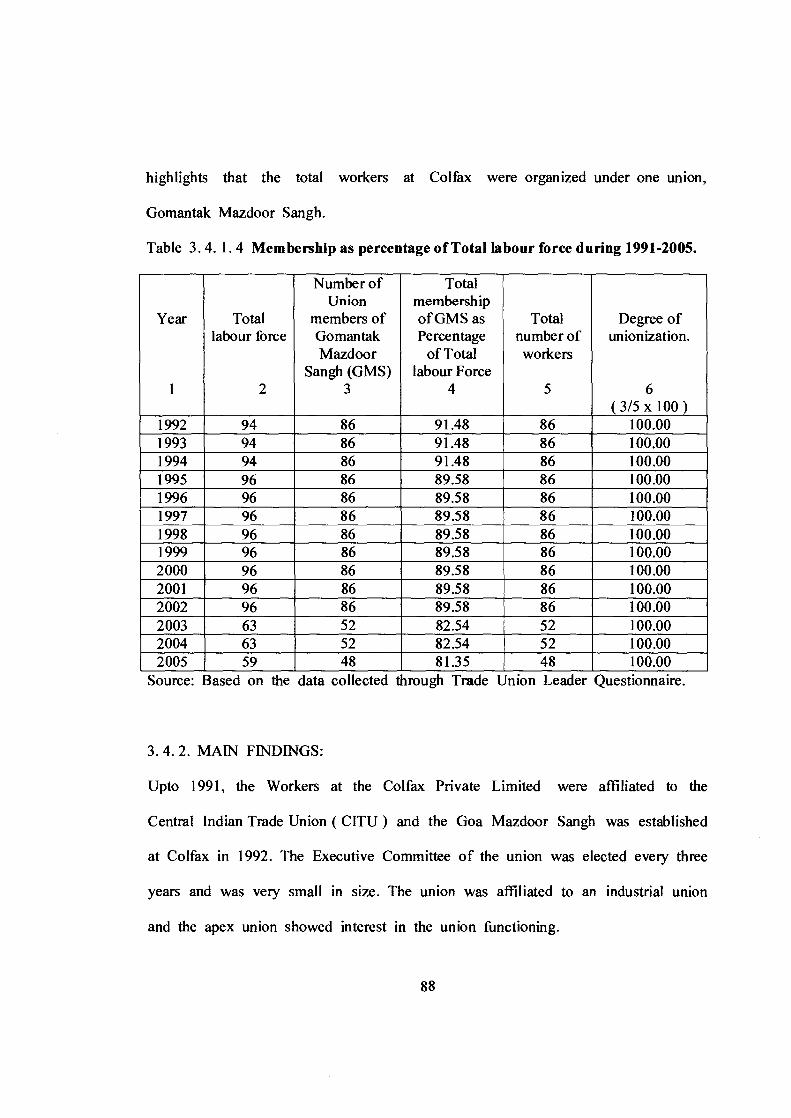
highlights that the total workers at Colfax were organized under one union,
Gomantak Mazdoor Sangh.
Table 3. 4. 1.4 Membership as percentage of Total labour force during 1991-2005.
Year
1
Total labour force
2
Number of Union
members of Gomantak Mazdoor
Sangh (GMS) 3
Total membership of GMS as Percentage
of Total labour Force
4
Total number of workers
5
Degree of unionization.
6 ( 3/5 x 100 )
1992 94 86 91.48 86 100.00 1993 94 86 91.48 86 100.00 1994 94 86 91.48 86 100.00 1995 96 86 89.58 86 100.00 1996 96 86 89.58 86 100.00 1997 96 86 89.58 86 100.00 1998 96 86 89.58 86 100.00 1999 96 86 89.58 86 100.00 2000 96 86 89.58 86 100.00 2001 96 86 89.58 86 100.00 2002 96 86 89.58 86 100.00 2003 63 52 82.54 52 100.00 2004 63 52 82.54 52 100.00 2005 59 48 81.35 48 100.00
Source: Based on the data collected through Trade Union Leader Questionnaire.
3. 4. 2. MAIN FINDINGS:
Upto 1991, the Workers at the Colfax Private Limited were affiliated to the
Central Indian Trade Union ( CITU ) and the Goa Mazdoor Sangh was established
at Colfax in 1992. The Executive Committee of the union was elected every three
years and was very small in size. The union was affiliated to an industrial union
and the apex union showed interest in the union functioning.
88
The union had cordial relations with the management. There was an absence of
inter-union rivalry due to workers unanimous decision to be members of a single
union. There was a decline in membership due to decline in the workers
employed during the later years. This was the only unit of study which had
100 % degree of unionization.
3.5 PROFILE OF TRADE UNIONS AT CIBA SPECIALTY CHEMICALS
( INDIA) LIMITED:
Hindustan Ciba Geigy Limited ( HCGL ) was established in Goa in 1971. It was
run by a Swiss Company Ciba. It had three divisions namely Agro, Pharma and
Specialty Chemicals. In 1997, HCGL merged with Sandoz to form Novartis
Pharma. In 2000, Specialty Chemicals ceased to be a part of it and functioned
as a new company and called itself Ciba Specialty Chemicals ( India ) Limited.
Its principal products consist of antioxidants, optical brightners and textile
chemicals.
89
3. 5. 1 GROWTH OF TRADE UNIONS AT CIBA SPECIALTY CHEMICALS
(INDIA) LIMITED:
Hindustan Ciba Geigy Employees' Union was the only union functioning at
HCGL until December 1992 when Kamgar Sangh took over. However after the
strike and formation of Ciba Specialty as a separate company, Kamgar Sangh was
no more recognized by the management and so majority of the workers formed
Kamgarancho Ekvott in 2000 and was the only recognized union .
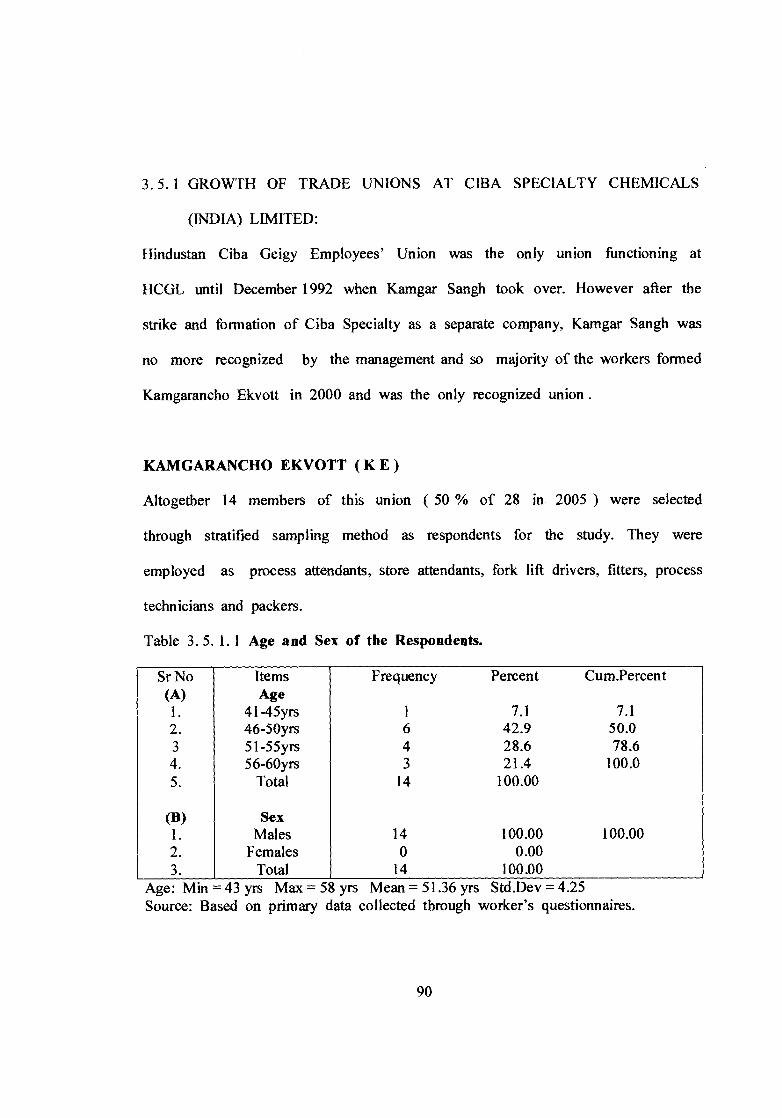
KAMGARANCHO EKVOTT ( K E )
Altogether 14 members of this union ( 50 % of 28 in 2005 ) were selected
through stratified sampling method as respondents for the study. They were
employed as process attendants, store attendants, fork lift drivers, fitters, process
technicians and packers.
Table 3. 5. 1. 1 Age and Sex of the Respondents.
Sr No Items Frequency Percent Cum.Percent (A) Age 1. 41 -45yrs 1 7.1 7.1 2. 46-50yrs 6 42.9 50.0 3 51-55yrs 4 28.6 78.6 4. 56-60yrs 3 21.4 100.0 5. Total 14 100.00
(B) Sex 1. Males 14 100.00 100.00 2. Females 0 0.00 3. Total 14 100.00
Age: Min = 43 yrs Max = 58 yrs Mean = 51.36 yrs Std.Dev = 4.25 Source: Based on primary data collected through worker's questionnaires.
90
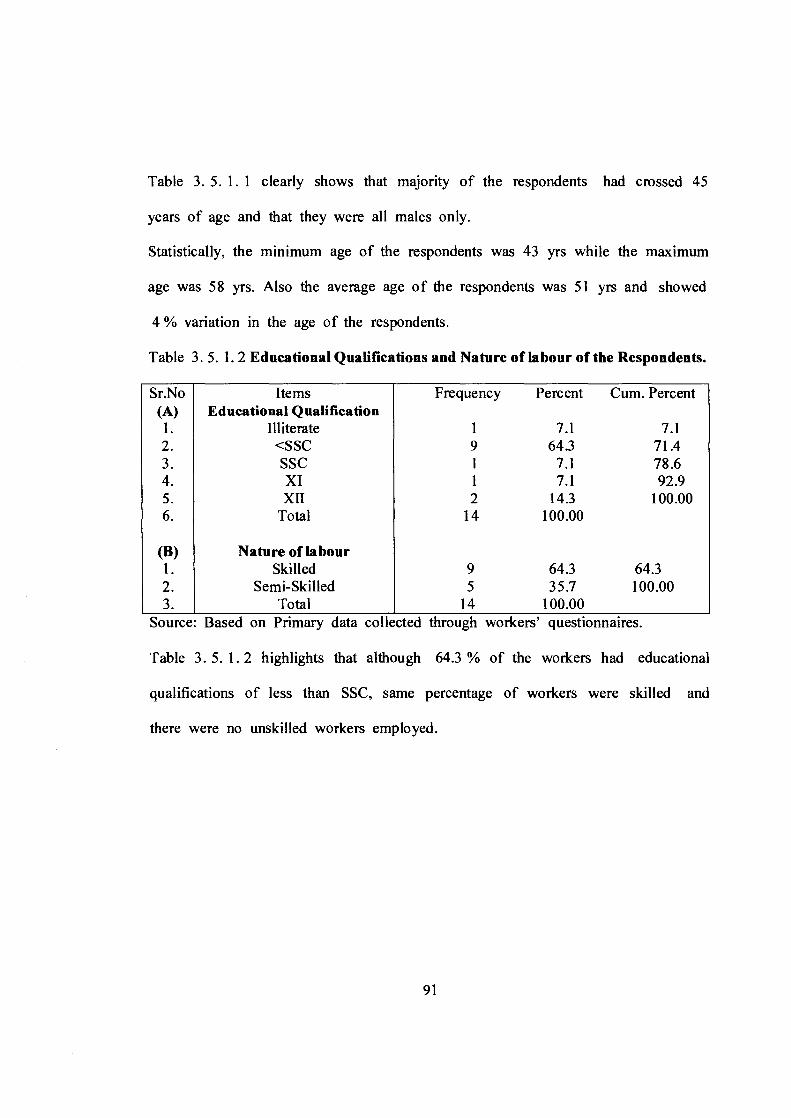
Table 3. 5. 1. 1 clearly shows that majority of the respondents had crossed 45
years of age and that they were all males only.
Statistically, the minimum age of the respondents was 43 yrs while the maximum
age was 58 yrs. Also the average age of the respondents was 51 yrs and showed
4 % variation in the age of the respondents.
Table 3. 5. 1. 2 Educational Qualifications and Nature of labour of the Respondents.
Sr.No Items Frequency Percent Cum. Percent (A) Educational Qualification
1. Illiterate 1 7.1 7.1 2. <SSC 9 643 71.4 3. SSC 1 7.1 78.6 4. XI 1 7.1 92.9 5. XII 2 14.3 100.00 6. Total 14 100.00
(B) Nature of labour 1. Skilled 9 64.3 64.3 2. Semi-Skilled 5 35.7 100.00 3. Total 14 100.00
Source Based on Primary data collected through workers' questionnaires.
Table 3. 5. 1. 2 highlights that although 64.3 % of the workers had educational
qualifications of less than SSC, same percentage of workers were skilled and
there were no unskilled workers employed.
91
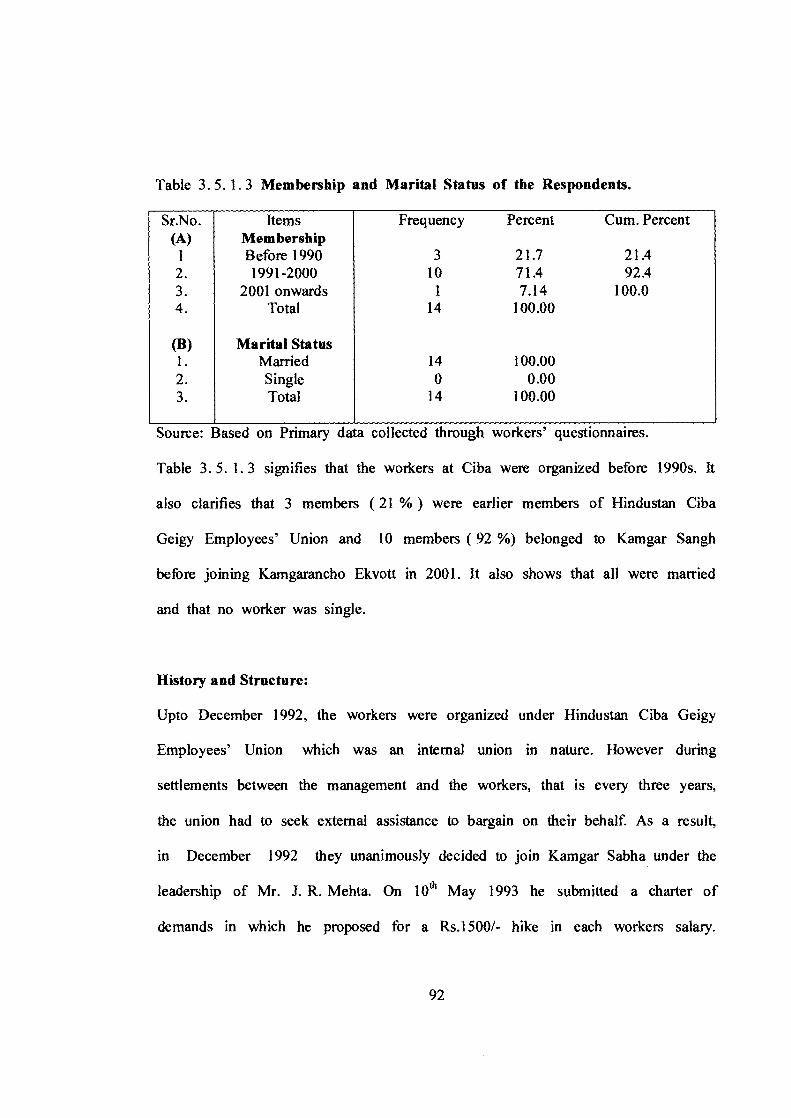
Table 3. 5. 1. 3 Membership and Marital Status of the Respondents.
Sr.No. Items Frequency Percent Cum. Percent (A) Membership
1 Before 1990 3 21.7 21.4 2. 1991-2000 10 71.4 92.4 3. 2001 onwards 1 7.14 100.0 4. Total 14 100.00
(B) Marital Status 1. Married 14 100.00 2. Single 0 0.00 3. Total 14 100.00
Source: Based on Primary data collected through workers' questionnaires.
Table 3. 5. 1.3 signifies that the workers at Ciba were organized before 1990s. It
also clarifies that 3 members ( 21 %) were earlier members of Hindustan Ciba
Geigy Employees' Union and 10 members ( 92 %) belonged to Kamgar Sangh
before joining Kamgarancho Ekvott in 2001. It also shows that all were married
and that no worker was single.
History and Structure:
Upto December 1992, the workers were organized under Hindustan Ciba Geigy
Employees' Union which was an internal union in nature. However during
settlements between the management and the workers, that is every three years,
the union had to seek external assistance to bargain on their behalf. As a result,
in December 1992 they unanimously decided to join Kamgar Sabha under the
leadership of Mr. J. R. Mehta. On 10 th May 1993 he submitted a charter of
demands in which he proposed for a Rs.1500/- hike in each workers salary.
92
However during its next meeting on 8 th October 1993, he modified his demand to
Rs. 2000/- while the management agreed to give Rs.900 increment per worker.
During the third meeting on 26 th October 1993, Mr. Mehta staged a walk-out as
both the parties maintained their earlier stands. This led to the beginning of the
agitation in the Company. As a result, the management offered to negotiate, but
when the union leader was not ready to compromise and the agitation continued
for two months the management finally called a lockout from 14 th January 1994
to 30th October 1994 followed by a strike from 31 October 1994 to 25 th October
1995. Inspite of the lockout, the company made profits as its parent company
sent the necessary aid in terms of raw materials and it outsourced its packaging.
Also the strike failed to bring any positive results and this increased the
frustration among workers. By the end of 1995, the workers gave up the union
and agreed to work at the old wage settlement. This forced calling off the strike.
The workers then formed its own union Kamgarancho Ekvott in 2000. Its
present executive committee consisted of the President, the Treasurer and the
Secretary. This local union was affiliated to the Industrial Union.
Administration:
The Union Executive was medium in size, met frequently and had good
attendance for its meetings. It functioned democratically, was actively involved in
decision making and possessed a somewhat flexible union constitution. Although
93
the union encouraged self expression and freedom among members, they showed
little personal interest in the affairs of the union .
The union always decided by majority and with the approval of those affected. It
also gave considerable freedom to its members to express opposing views if any.
Since its inception, its major functions consisted of settlement of Charter of
Demands, provision of guidance and advice on employment conditions, wage
negotiations and settlement.
The union is free from union rivalry and also does not have any political
affiliation.
Personnel, Membership and Degree of Unionisation:
The personnel consisted of Managerial, Supervisory and Working Class .
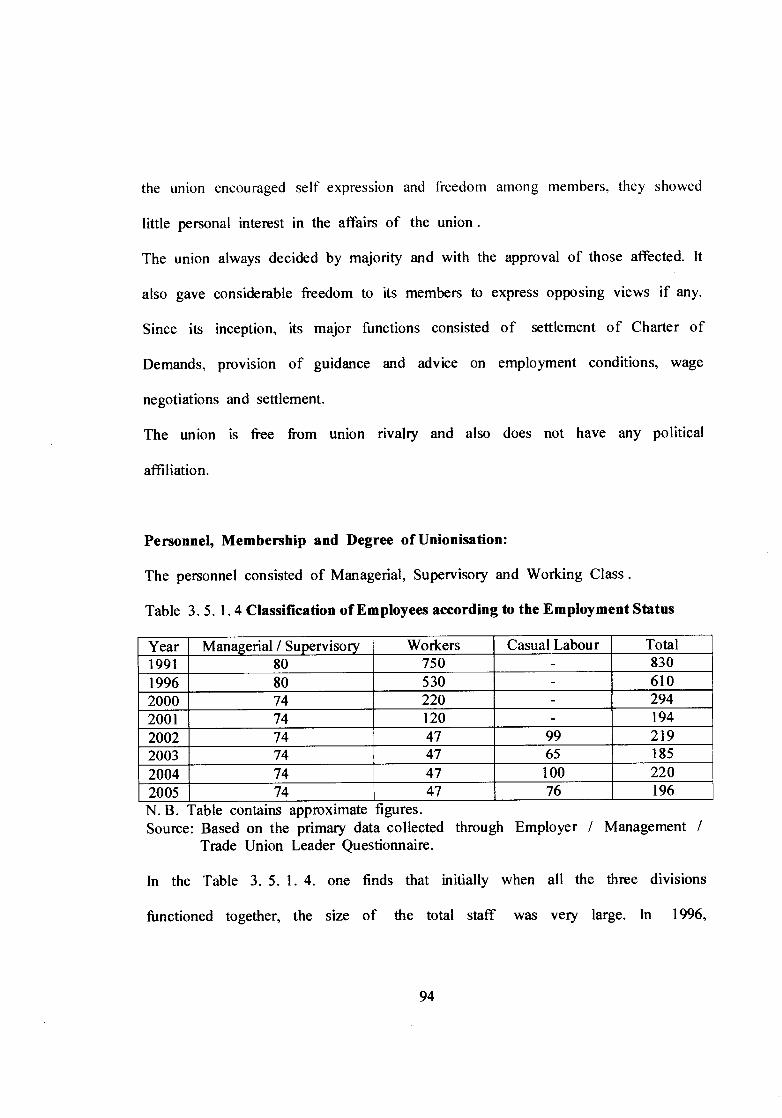
Table 3. 5. 1.4 Classification of Employees according to the Employment Status
Year Managerial / Supervisory Workers Casual Labour Total 1991 80 750 - 830 1996 80 530 - 610 2000 74 220 - 294 2001 74 120 - 194 2002 74 47 99 219 2003 74 47 65 185 2004 74 47 100 220 2005 74 47 76 196 N. B. Table contains approximate figures. Source: Based on the primary data collected through Employer / Management /
Trade Union Leader Questionnaire.
In the Table 3. 5. 1. 4. one finds that initially when all the three divisions
functioned together, the size of the total staff was very large. In 1996,
94
Voluntary Retirement Scheme ( VRS) was introduced as a result of which around
110 workers opted for the same. Since 2000 onwards, the figures stand for the
total staff strength of Ciba Specialty Chemicals only. Heavy job cuts after the
strike reduced the employment further, followed by introduction of VRS for the
second time in 2001. The fluctuations in the total staff strength from 2002 was
mainly due to the increase or decrease in the size of contract labour employed by
the company.
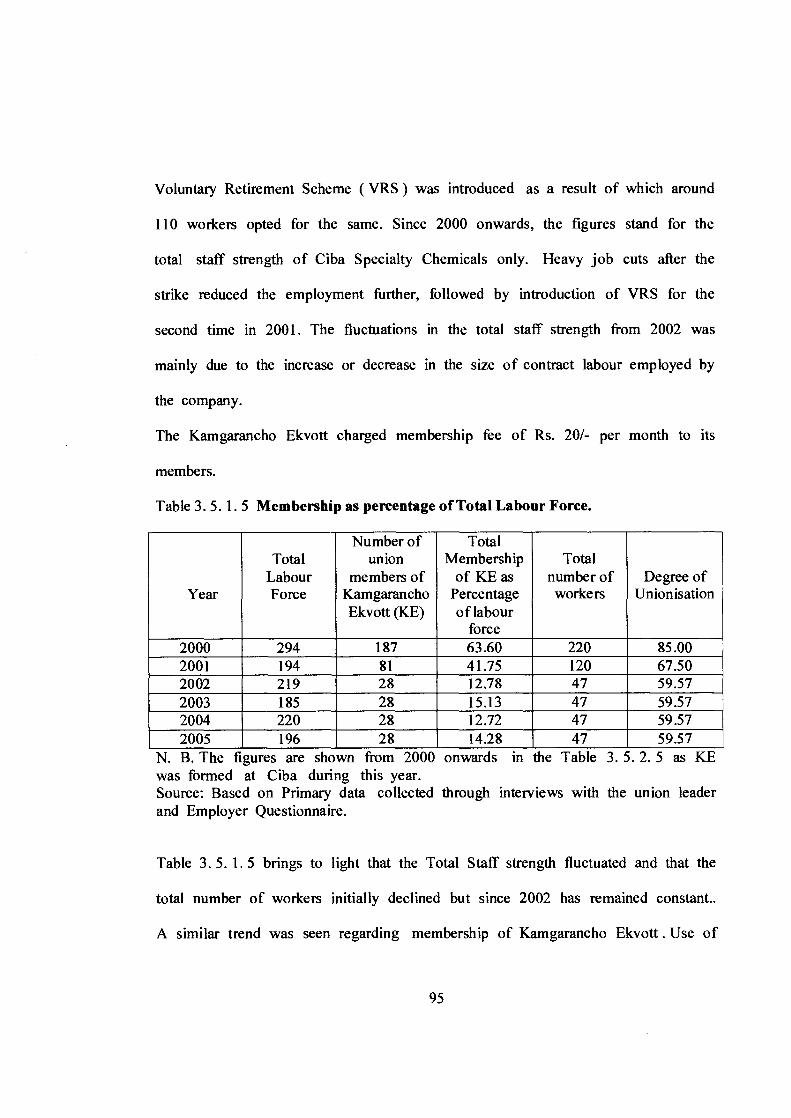
The Kamgarancho Ekvott charged membership fee of Rs. 20/- per month to its
members.
Table 3. 5. 1.5 Membership as percentage of Total Labour Force.
Year
Total Labour Force
Number of union
members of Kamgarancho Ekvott (KE)
Total Membership
of KE as Percentage of labour
force
Total number of workers
Degree of Unionisation
2000 294 187 63.60 220 85.00 2001 194 81 41.75 120 67.50 2002 219 28 12.78 47 59.57 2003 185 28 15.13 47 59.57 2004 220 28 12.72 47 59.57 2005 196 28 14.28 47 59.57
N. B. The figures are shown from 2000 onwards in the Table 3. 5. 2. 5 as KE was formed at Ciba during this year. Source: Based on Primary data collected through interviews with the union leader and Employer Questionnaire.
Table 3. 5. 1. 5 brings to light that the Total Staff strength fluctuated and that the
total number of workers initially declined but since 2002 has remained constant..
A similar trend was seen regarding membership of Kamgarancho Ekvott . Use of
95
Casual labour led to the drastic decline in number of permanent workers and in
the membership of the union.
It was also noticed that the degree of unionisation dropped from over 80 % to
around 60 % during the later years .
3. 5. 2 MAIN FINDINGS:
Upto December 1992, the workers were organized under Hindustan Ciba Geigy
Employees' Union which was an internal union in nature. By the end of
December 1992 the workers joined Kamgar Sangh. However the workers were
dissatisfied and so they left the union in 1995 to join the presently recognized
union in 2000. The Kamgarancho Ekvott was the only recognized union after the
major dispute at Ciba. It was a union with internal leadership along with external
assistance. The leadership changed during settlement every four years. It had a
high degree of unionization compared to the unrecognized union .
3.6 COMPARISON OF TRADE UNION PROFILE:
(i) The recognized unions at MPT, were established between 1960 and 1980,
while those at GSL and Ciba between 1995 and 2005 and at Colfax between
1990 to 1995.
(ii) Unions at MPT were affiliated to Hind Mazdoor Sabha, there was absence of
affiliation of one of the unions at GSL and that at Colfax was affiliated to Bharatiya
96
Mazdoor Sangh. The local union at Ciba was also affiliated to an Industrial
union.
(iii) At MPT, one of the unions was headed by its Trustees, who were workers
earlier; while at GSL, workers themselves were the leaders and at Colfax and
Ciba, their General Secretary belonged to a general union.
(iv) Members of all the unions except Ciba agreed that the most important reason
for joining the union was to ventilate individual grievances. However the next
important reason was job security for the members at MPT, to obtain better
welfare facilities at GSL and high wages and job security at Colfax. However at
Ciba, the main reason was to ventilate grievances along with job security as
shown in Table 3. 6. 1
97
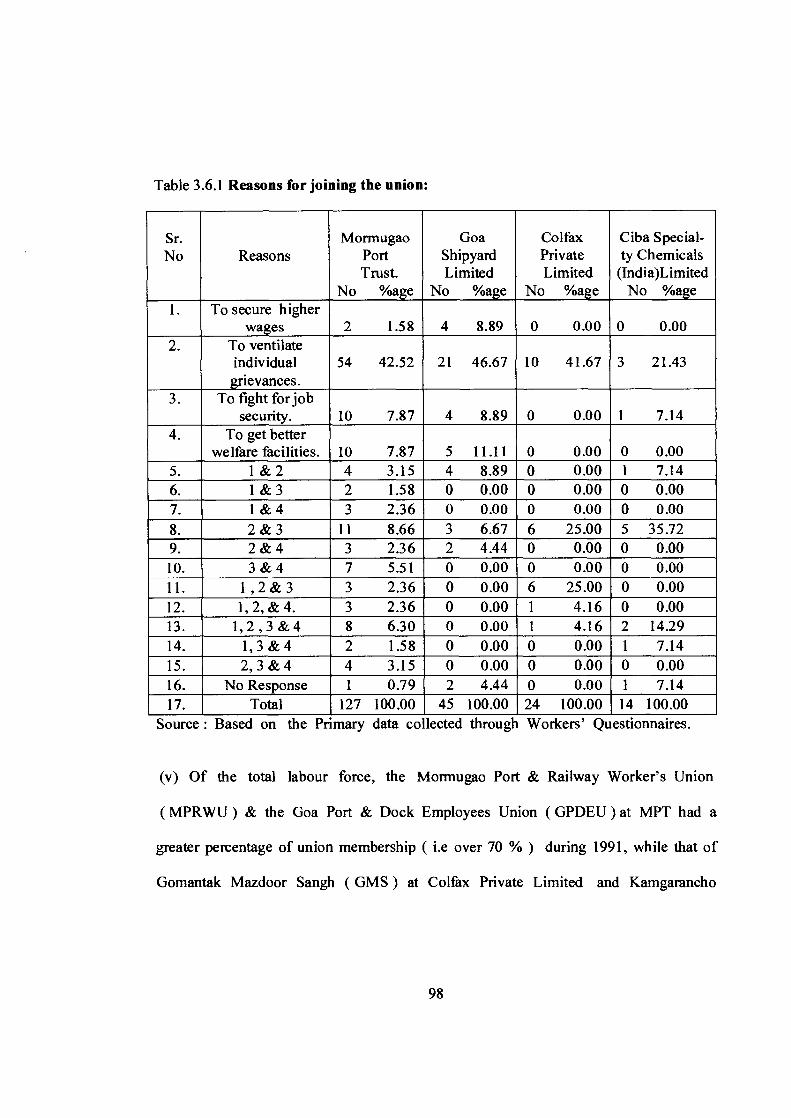
Table 3.6.1 Reasons for joining the union:
Sr. No Reasons
Mormugao Port Trust.
No %age
Goa Shipyard Limited
No %age No
Colfax Private Limited
%age
Ciba Special- ty Chemicals
(India)Limited No %age
1. To secure higher wages 2 1.58 4 8.89 0 0.00 0 0.00
2. To ventilate individual grievances.
54 42.52 21 46.67 10 41.67 3 21.43
3. To fight for job security. 10 7.87 4 8.89 0 0.00 1 7.14
4. To get better welfare facilities. 10 7.87 5 11.11 0 0.00 0 0.00
5. 1& 2 4 3.15 4 8.89 0 0.00 1 7.14 6. 1& 3 2 1.58 0 0.00 0 0.00 0 0.00 7. 1& 4 3 2.36 0 0.00 0 0.00 0 0.00 8. 2 & 3 11 8.66 3 6.67 6 25.00 5 35.72 9. 2& 4 3 2.36 2 4.44 0 0.00 0 0.00 10. 3& 4 7 5.51 0 0.00 0 0.00 0 0.00 11. 1 , 2 & 3 3 2.36 0 0.00 6 25.00 0 0.00 12. 1, 2, & 4. 3 2.36 0 0.00 1 4.16 0 0.00 13. 1, 2 , 3 & 4 8 6.30 0 0.00 1 4.16 2 14.29 14. 1, 3& 4 2 1.58 0 0.00 0 0.00 1 7.14 15. 2, 3& 4 4 3.15 0 0.00 0 0.00 0 0.00 16. No Response 1 0.79 2 4.44 0 0.00 1 7.14 17. Total 127 100.00 45 100.00 24 100.00 14 100.00
Source : Based on the Pnmary data collected through Workers' Questionnaires.
(v) Of the total labour force, the Mormugao Port & Railway Worker's Union
( MPRWU ) & the Goa Port & Dock Employees Union ( GPDEU ) at MPT had a
greater percentage of union membership ( i.e over 70 %) during 1991, while that of
Gomantak Mazdoor Sangh ( GMS ) at Colfax Private Limited and Kamgarancho
98
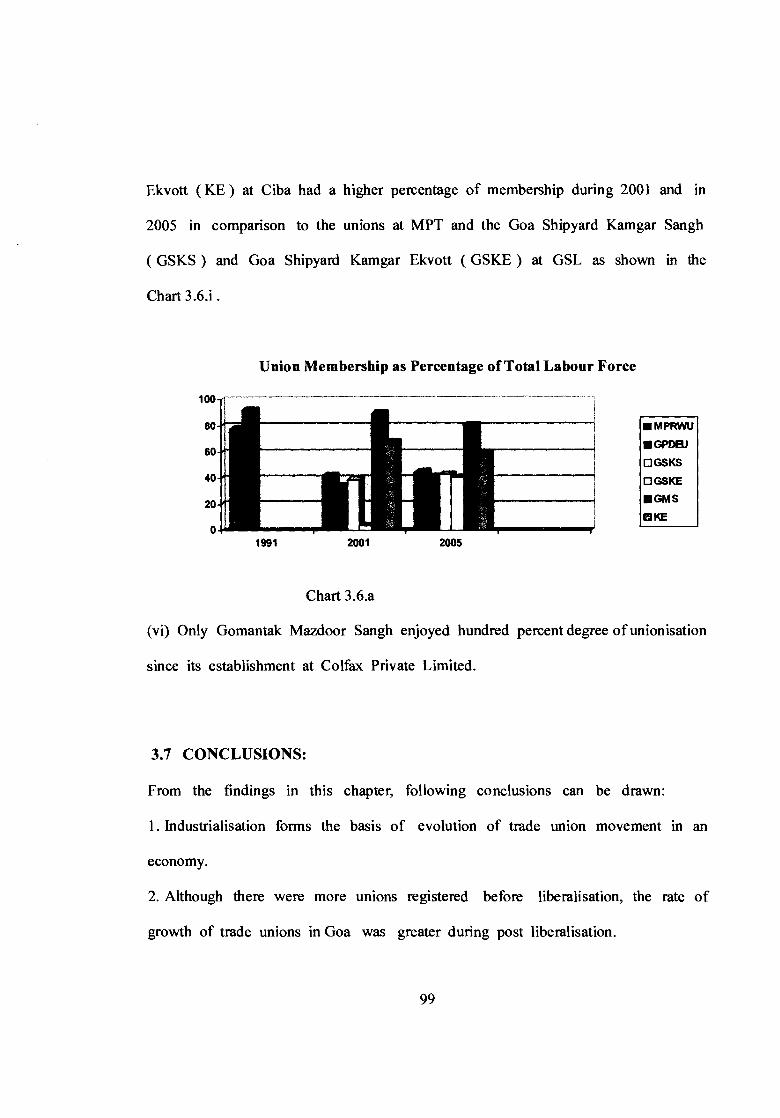
Ekvott ( KE ) at Ciba had a higher percentage of membership during 2001 and in
2005 in comparison to the unions at MPT and the Goa Shipyard Kamgar Sangh
( GSKS ) and Goa Shipyard Kamgar Ekvott ( GSKE ) at GSL as shown in the
Chart 3.6.i .
Union Membership as Percentage of Total Labour Force
100
80
60
40
20
■ MPRWU
■ GPDEU
O GSKS
GSKE
• GM S
▪ KE
1991
2001
2005
Chart 3.6.a
(vi) Only Gomantak Mazdoor Sangh enjoyed hundred percent degree of unionisation
since its establishment at Colfax Private Limited.
3.7 CONCLUSIONS:
From the findings in this chapter, following conclusions can be drawn:
1. Industrialisation forms the basis of evolution of trade union movement in an
economy.
2. Although there were more unions registered before liberalisation, the rate of
growth of trade unions in Goa was greater during post liberalisation.
99
3. Each union pursued a different set of priorities.
5. After liberalisation, there was a decline in the membership of Unions.
6. There was inter-union rivalry as there was more than one recognized union.
7. The unions differed in the degree of unionisation.
100