Embed Size (px)
Citation preview
38
CHAPTER III
RESEARCH METHOD
This chapter presents the methodology used in doing the research. It describes
about research design, population and sample, research instrument, data collection
technique, and data analysis technique.
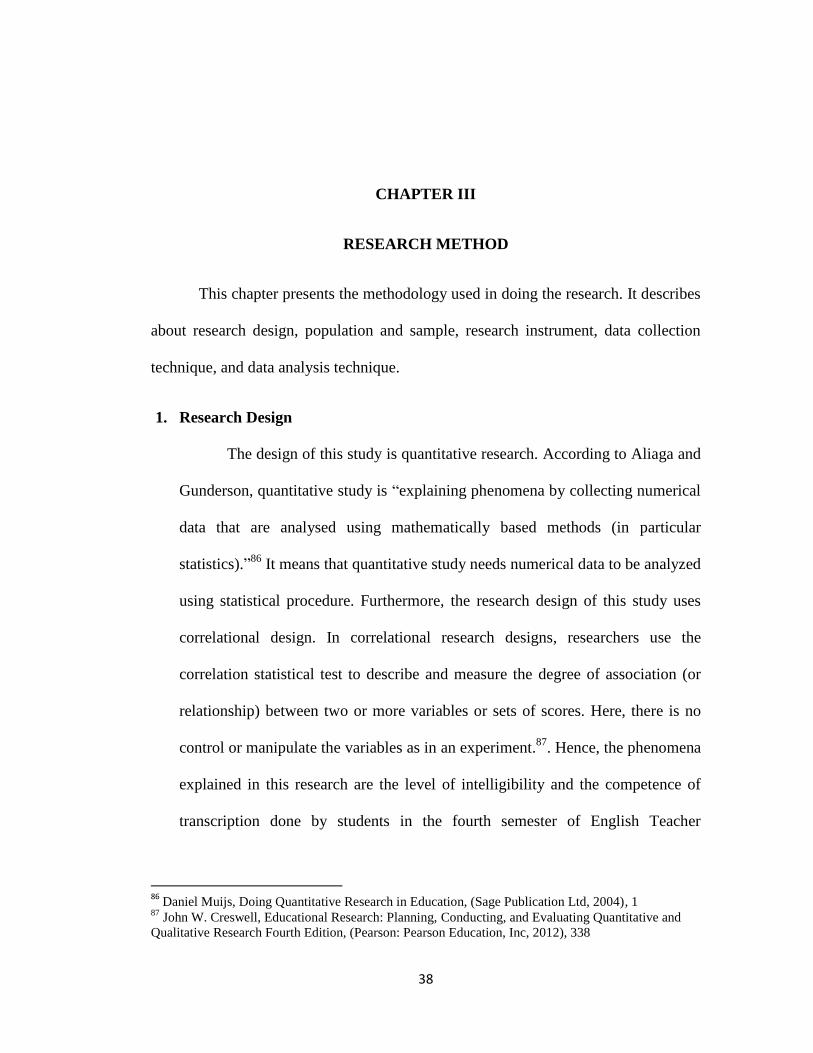
1. Research Design
The design of this study is quantitative research. According to Aliaga and
Gunderson, quantitative study is “explaining phenomena by collecting numerical
data that are analysed using mathematically based methods (in particular
statistics).”86
It means that quantitative study needs numerical data to be analyzed
using statistical procedure. Furthermore, the research design of this study uses
correlational design. In correlational research designs, researchers use the
correlation statistical test to describe and measure the degree of association (or
relationship) between two or more variables or sets of scores. Here, there is no
control or manipulate the variables as in an experiment.87
. Hence, the phenomena
explained in this research are the level of intelligibility and the competence of
transcription done by students in the fourth semester of English Teacher
86
Daniel Muijs, Doing Quantitative Research in Education, (Sage Publication Ltd, 2004), 1 87
John W. Creswell, Educational Research: Planning, Conducting, and Evaluating Quantitative and
Qualitative Research Fourth Edition, (Pearson: Pearson Education, Inc, 2012), 338
39
Education Department, especially who are in the speaking class 4. Then, the use
of correlational design is for knowing the relationship between both variable.
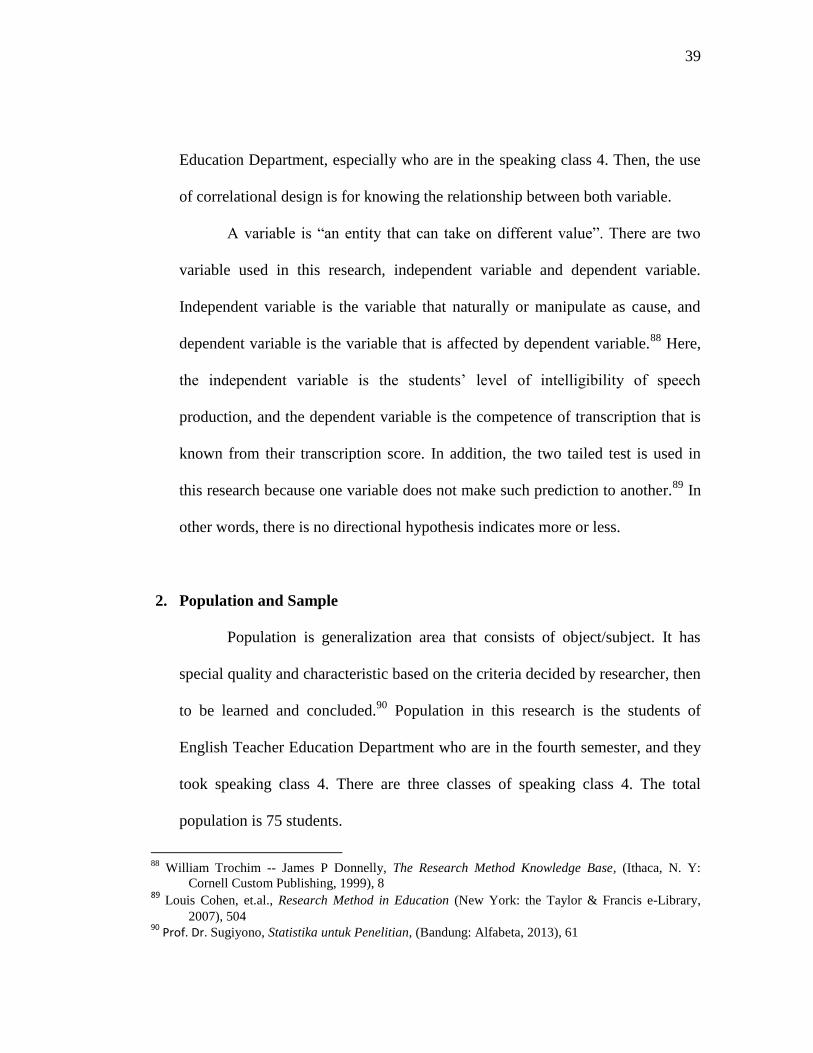
A variable is “an entity that can take on different value”. There are two
variable used in this research, independent variable and dependent variable.
Independent variable is the variable that naturally or manipulate as cause, and
dependent variable is the variable that is affected by dependent variable.88
Here,
the independent variable is the students‟ level of intelligibility of speech
production, and the dependent variable is the competence of transcription that is
known from their transcription score. In addition, the two tailed test is used in
this research because one variable does not make such prediction to another.89
In
other words, there is no directional hypothesis indicates more or less.
2. Population and Sample
Population is generalization area that consists of object/subject. It has
special quality and characteristic based on the criteria decided by researcher, then
to be learned and concluded.90
Population in this research is the students of
English Teacher Education Department who are in the fourth semester, and they
took speaking class 4. There are three classes of speaking class 4. The total
population is 75 students.
88
William Trochim -- James P Donnelly, The Research Method Knowledge Base, (Ithaca, N. Y:
Cornell Custom Publishing, 1999), 8 89
Louis Cohen, et.al., Research Method in Education (New York: the Taylor & Francis e-Library,
2007), 504 90
Prof. Dr. Sugiyono, Statistika untuk Penelitian, (Bandung: Alfabeta, 2013), 61
40
Sample is part of the total population that has similar characteristic with
the population.91
The technique used for taking the sample is convenience
sampling. “A convenience sample is a group of individuals who (conveniently)
are available for study”.92
It is included in non-probability sampling. In
nonprobability sampling, the researcher selects individuals because they are
available, convenient, and represent some characteristics which is investigated in
study. Further, the researcher may not be interested in generalizing findings to
population, but only in describing a small group of participants in a study. It may
only used for comparing the sample with the larger population to make
inferences from the sample to the population.93
Convenience sampling is chosen
because the researcher seeks individuals who agree to produce speech in a given
time as their goal of study. The researcher recorded the speech of 20 students.
Another participant of this research is native English speakers. The native
English speakers are chosen based on convenience sampling. There are 5 native
English speakers, 2 females and 3 males. They are American English, and they
are fresh graduate. They have stayed in Surabaya for about 3 weeks when they
are asking to rate the students‟ speech. They are chosen as convenience because
they agree and have time to rate the students‟ speech. Researcher chose five
native speakers as rater for the students‟ speech because it could reduce bias.
91
Prof. Dr. Sugiyono, Statistika …………, 62 92
Jack R. Fraenkel – Norman E. Wallen, How to Design and Evaluate Research in Education seventh
edition, (The New York: McGraw-Hill Companies, Inc., 2009), 98 93
John W. Creswell, Educational Research: Planning,………….. , 145
41
3. Research Instrument
The instruments used in this research are audio recording, rating scale,
and test.
a. Audio Recording
Audio recording was used for getting the data from the voice of
students‟ speech. The students were given at least two minutes to speak about
their idea based on the topic given from the researcher. All of the participants
were given the same topic. The speech was recorded using mobile phone and
laptop because researcher asked another person to help taking the voice, but
all of the speeches were collected in one file in laptop and presented to native
speakers by using laptop without the addition of loud speaker.
The native speech was also taken by using audio recording. The
native was American English. The voice was got by asking the native to read
the passage given in the normal pace. The voice was taken in quite room to
decrease the disturbance.
b. Rating Scale
Rating scale was used to measure the level of speech intelligibility.
The type of scale used in this research was Guttman scaling. The purpose of
Guttman scaling is to establish a one-dimensional continuum for a concept
you want to measure.94
There were six scales in one kind of measurement.
Five native speakers were used as a rater because it could reduce bias and
94
William Trochim, -- James P Donnelly, The Research Method……………, 147
42
ambiguity. This rating scale had been validated by one of lecture of English
Teacher Education Department.
c. Test
Test was used for measuring the competence in transcribing the
native speech. The test used was listening test. The test was adopted from
international journal, and had been used as the instrument of previous study.
The type of listening test was cloze-test, and it had been validated by one of
lecture of English Teacher Education Department.
4. Data Collection Technique
The first step to collect the data was choosing the participant. The
participant of this study was the fourth semester students in class speaking 4.
However, only 20 students were chosen as convenience sampling because they
were agree to be taken as sample of this research. In addition, they had learning
speech for semester 6 in speaking class 4 and it was appropriate with the
characteristic intended by the researcher.
The next step was choosing the instrument. The instruments used in this
research were audio recording, rating scale, and test. First, the researcher
recorded the students‟ voice then presented it to the native speakers. Meanwhile,
the researcher recorded the native‟s voice and presented to the students to
conduct listening test.
43
To answer the first research question, “What is the students‟ level
intelligibility of speech production in the fourth semester of English Teacher
Education Department based on native speakers‟ perception?”, it was required
the students‟ voice and native speakers as rater. First, the researcher recorded the
students‟ speech. They had to speak freely based on their opinion for about two
minutes, and they were given the same topic. The topic was “teaching English in
Indonesia”. This topic was chosen because it was appropriate with their study.
Then, the recording of students‟ speech was presented to five native speakers of
English, and they were asked to fill the rating scale. There were six scale, and
they were asked to rate the students‟ speech based on their perception.
To answer the second research question, “How is the students‟
competence of transcription?” it was required native voice and listening test. One
female native speaker with American English accent was asked to read the whole
passage in normal pace. She is an English teacher in MTs Banyuwangi. The
researcher recorded her voice in quite room to reduce the disturbance. Then, the
recording of her voice was presented to students to conduct listening test. The
listening test was in the form of fill in the blank, and it was done in different time
for each participant because of the available time of the participants.
Finally, after all of the data have been collected, for answering the third
research question “Is there any correlation between the student‟s level of
intelligibility and the student‟s competence of transcription?” the researcher used
the formula of Pearson Product Moment. It was required to seek the correlation
44
between variable 1 and variable 2. The first variable was the student‟s level of
speech intelligibility, and then it was called as independent variable. Another
variable was the student‟s competence in transcribing the speech, and then it was
called as dependent variable.
5. Data Analysis Technique
In the data analysis, each research question was analyzed using different
formula. Basically, the purpose of this research was for knowing the correlation
between level of intelligibility and transcription score that was state in the third
research question. However, in order to be able to find the correlation between
both items, it was required to answer the first and the second research question.
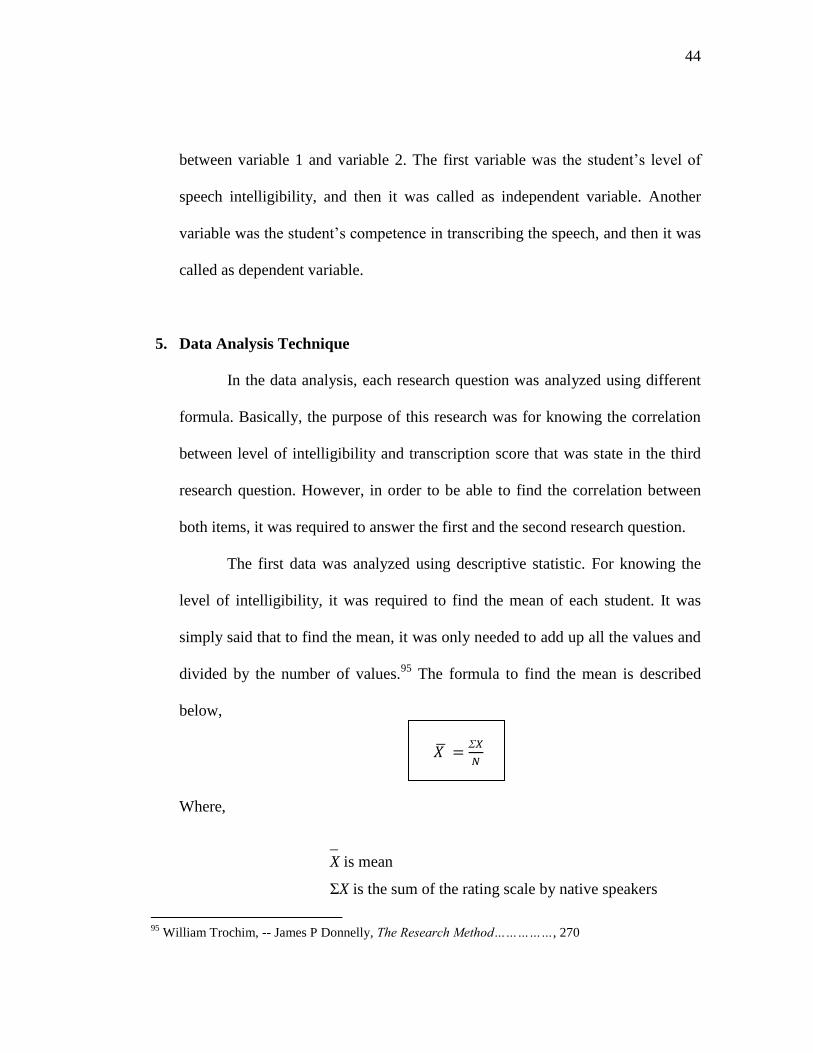
The first data was analyzed using descriptive statistic. For knowing the
level of intelligibility, it was required to find the mean of each student. It was
simply said that to find the mean, it was only needed to add up all the values and
divided by the number of values.95
The formula to find the mean is described
below,
Where,
_
X is mean
ƩX is the sum of the rating scale by native speakers
95
William Trochim, -- James P Donnelly, The Research Method……………, 270
45
N is the number of native speakers
Mean score was got from the total ratings from native speakers divided
by the total native speakers. However, some data are decimal. Hence, it is used
the rule such explains as follows.
a. If digit in the most left from the digit has to be removed is less than 5, so digit
in the most right from the digit preceding is unchanged.
(Jika angka terkiri dari angka yang harus dihilangkan kurang dari 5, maka
angka terkanan dari angka yang mendahuluinya tetap)
b. If digit in the most left from the digit has to be removed is 5 or more than 5
followed by other digits instead 0, so digit in the most right from the digit
preceding is get additional 1 digit.
(Jika angka terkiri dari angka yang harus dihilangkan lebih dari 5 atau angka
5 diikti oleh angka-angka bukan nol semua, maka angka terkanan dari angka
yang mendahuluinya bertambah dengan satu)
c. If digit in the most left from the digit has to be removed is 5 or more than five,
and followed by digit 0, so digit in the most right from the digit preceding is
unchanged for even number and get additional 1 digit for odd number.
(Jika angka terkiri dari angka yang harus dihilangkan lebih dari 5 atau angka
5 diikti oleh angka-angka nol semua, maka angka terkanan dari angka yang
mendahuluinya tetap jika angka tersebut genap, dan bertambah satu satu jika
angka tersebut ganjil)96
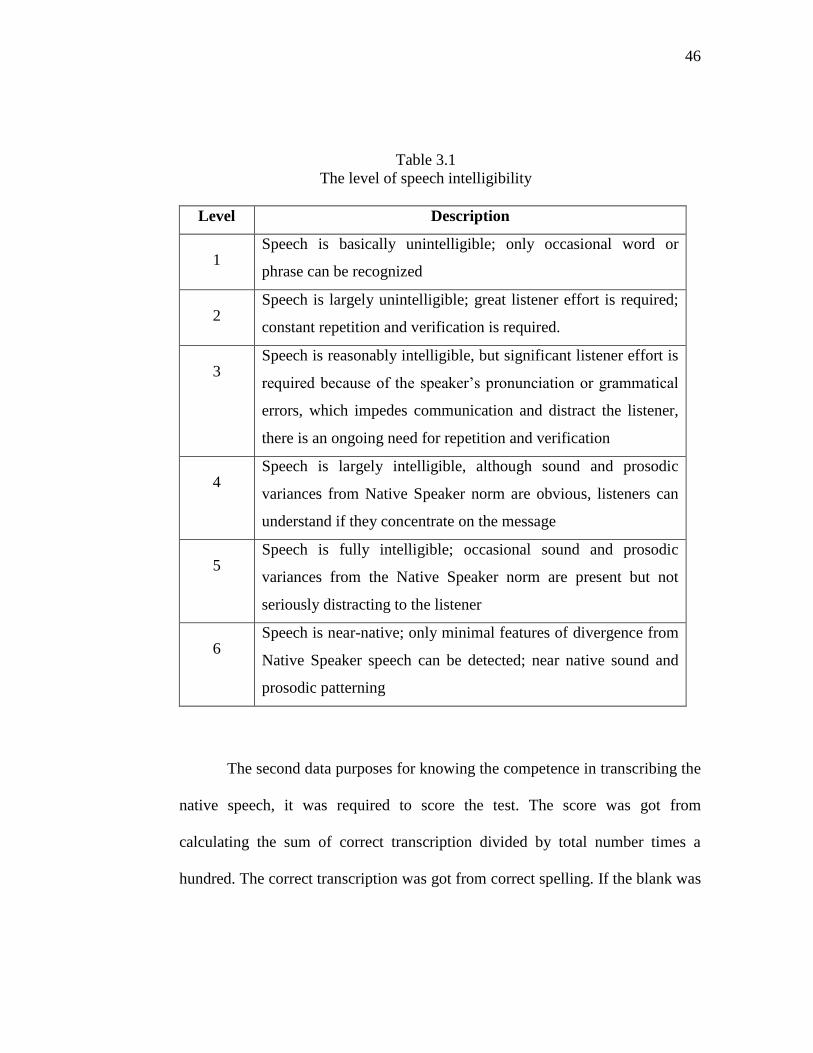
The level of speech intelligibility has characteristic for each. The
description of each level will be described such in the table as follows.
96
Mujono, “Analisis Data dan Peluang”, (http://file.upi.edu/Direktori/DUAL-
MODES/STATISTIK_DAN_PELUANG/BBM_1.pdf accessed on July 15th
2014)
46
Table 3.1
The level of speech intelligibility
Level Description
1 Speech is basically unintelligible; only occasional word or
phrase can be recognized
2 Speech is largely unintelligible; great listener effort is required;
constant repetition and verification is required.
3 Speech is reasonably intelligible, but significant listener effort is
required because of the speaker‟s pronunciation or grammatical
errors, which impedes communication and distract the listener,
there is an ongoing need for repetition and verification
4 Speech is largely intelligible, although sound and prosodic
variances from Native Speaker norm are obvious, listeners can
understand if they concentrate on the message
5 Speech is fully intelligible; occasional sound and prosodic
variances from the Native Speaker norm are present but not
seriously distracting to the listener
6 Speech is near-native; only minimal features of divergence from
Native Speaker speech can be detected; near native sound and
prosodic patterning
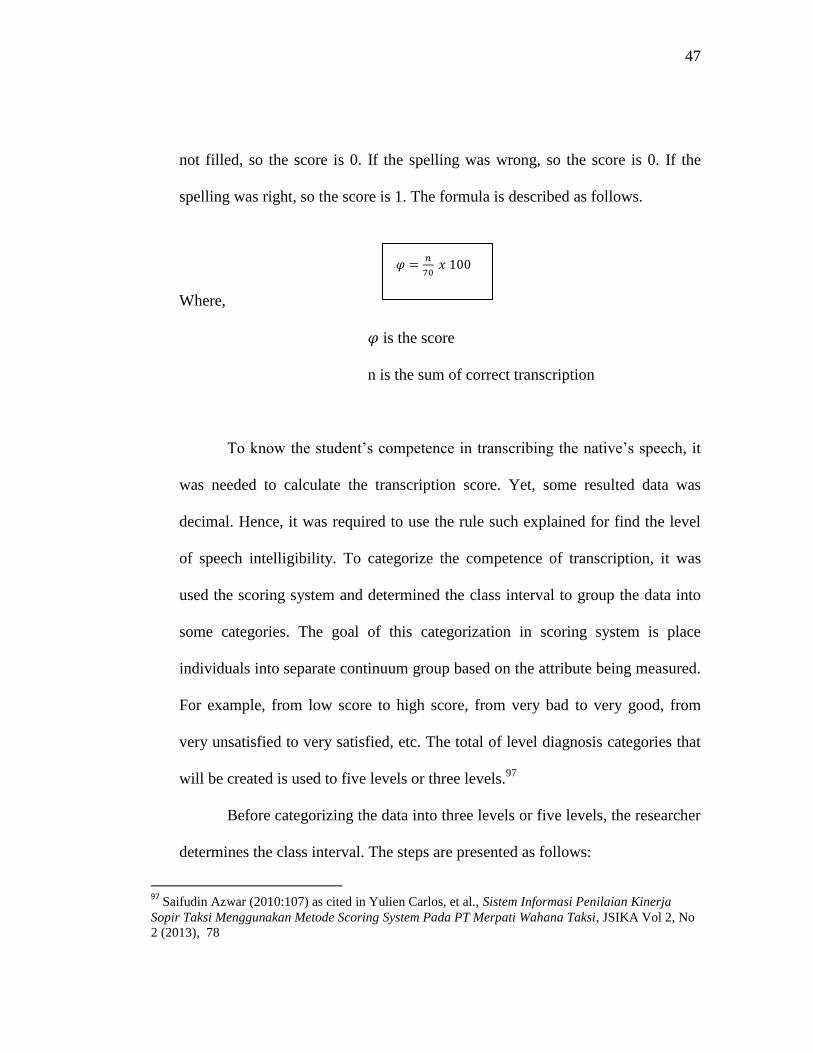
The second data purposes for knowing the competence in transcribing the
native speech, it was required to score the test. The score was got from
calculating the sum of correct transcription divided by total number times a
hundred. The correct transcription was got from correct spelling. If the blank was
47
not filled, so the score is 0. If the spelling was wrong, so the score is 0. If the
spelling was right, so the score is 1. The formula is described as follows.
Where,
is the score
n is the sum of correct transcription
To know the student‟s competence in transcribing the native‟s speech, it
was needed to calculate the transcription score. Yet, some resulted data was
decimal. Hence, it was required to use the rule such explained for find the level
of speech intelligibility. To categorize the competence of transcription, it was
used the scoring system and determined the class interval to group the data into
some categories. The goal of this categorization in scoring system is place
individuals into separate continuum group based on the attribute being measured.
For example, from low score to high score, from very bad to very good, from
very unsatisfied to very satisfied, etc. The total of level diagnosis categories that
will be created is used to five levels or three levels.97
Before categorizing the data into three levels or five levels, the researcher
determines the class interval. The steps are presented as follows:
97
Saifudin Azwar (2010:107) as cited in Yulien Carlos, et al., Sistem Informasi Penilaian Kinerja
Sopir Taksi Menggunakan Metode Scoring System Pada PT Merpati Wahana Taksi, JSIKA Vol 2, No
2 (2013), 78
48
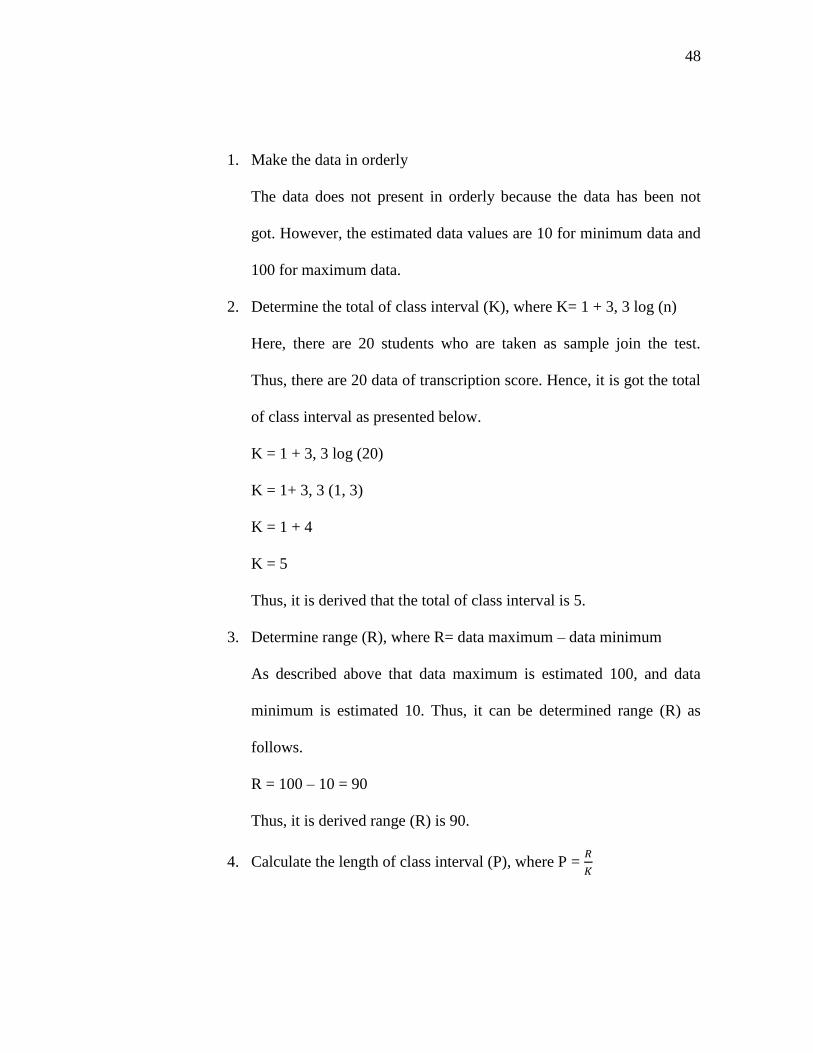
1. Make the data in orderly
The data does not present in orderly because the data has been not
got. However, the estimated data values are 10 for minimum data and
100 for maximum data.
2. Determine the total of class interval (K), where K= 1 + 3, 3 log (n)
Here, there are 20 students who are taken as sample join the test.
Thus, there are 20 data of transcription score. Hence, it is got the total
of class interval as presented below.
K = 1 + 3, 3 log (20)
K = 1+ 3, 3 (1, 3)
K = 1 + 4
K = 5
Thus, it is derived that the total of class interval is 5.
3. Determine range (R), where R= data maximum – data minimum
As described above that data maximum is estimated 100, and data
minimum is estimated 10. Thus, it can be determined range (R) as
follows.
R = 100 – 10 = 90
Thus, it is derived range (R) is 90.
4. Calculate the length of class interval (P), where P =
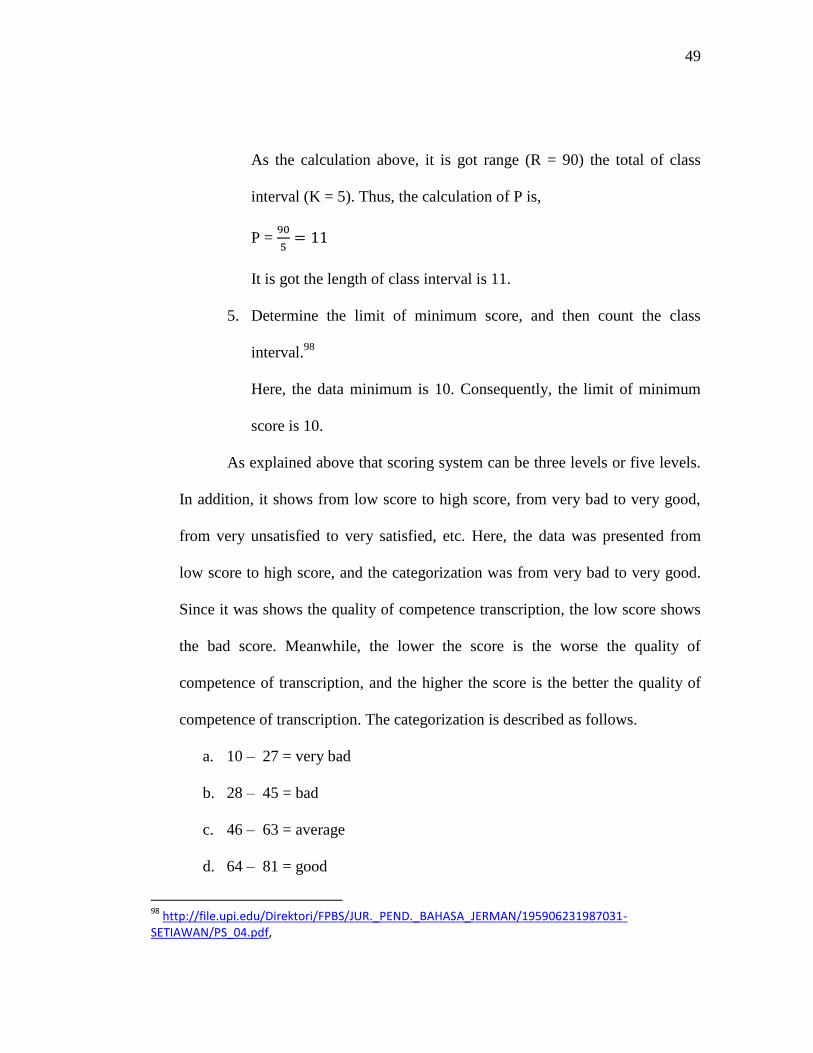
49
As the calculation above, it is got range (R = 90) the total of class
interval (K = 5). Thus, the calculation of P is,
P =
It is got the length of class interval is 11.
5. Determine the limit of minimum score, and then count the class
interval.98
Here, the data minimum is 10. Consequently, the limit of minimum
score is 10.
As explained above that scoring system can be three levels or five levels.
In addition, it shows from low score to high score, from very bad to very good,
from very unsatisfied to very satisfied, etc. Here, the data was presented from
low score to high score, and the categorization was from very bad to very good.
Since it was shows the quality of competence transcription, the low score shows
the bad score. Meanwhile, the lower the score is the worse the quality of
competence of transcription, and the higher the score is the better the quality of
competence of transcription. The categorization is described as follows.
a. 10 – 27 = very bad
b. 28 – 45 = bad
c. 46 – 63 = average
d. 64 – 81 = good
98
http://file.upi.edu/Direktori/FPBS/JUR._PEND._BAHASA_JERMAN/195906231987031-SETIAWAN/PS_04.pdf,
50
e. 82 – 99 = very good
Those categories above are based on the theory of calculation of class
interval and scoring system. It will be used to group the data in the next chapter.
Finally, to find the correlation between level of intelligibility and the
competence in transcription, there were some steps to be conducted. The
correlation was used correlation product-moment. Then, for conducting this test,
there were some steps to be conducted. The steps are described as follows.
1. Test of normality
Test of normality is used for whether the data distributed normally or not.
This research is using parametric statistic. Thus, it has assumption that the
data have to be distributed normally.99
The test of normality is using SPSS
20.
2. Drawing scatter-plot graph
The scatter-plot graph is used for knowing the linearity of the data, and the
types of correlation. For drawing the graph, it is used the SPSS 20.
3. Calculating coefficient of correlation (r)
In this case the researcher uses SPSS 20 for calculate the value of pearson
correlation, coefficient correlation (r), and significance two tailed. It uses
bivariate correlation, Pearson correlation coefficient, and two-tailed test of
significance. The variable is perfectly correlated if the value of pearson
99
Sugiyono, Metode Penelitian Pendidikan………., 79
51
correlation is between -1 to +1. The r value shows the strength of
correlation.
4. Developing hypothesis
Ha or H1: the level of speech intelligibility of the students in speaking 4
has correlation to the competence of transcription.
Ho or H0: the level of speech intelligibility of the students in speaking 4
does not has correlation to the competence of transcription.
5. Determining significance of correlation (α)
The significance of correlation used in this research is 0, 05 (α=0, 05)
which means the researcher is conducting a test where the odds that the
correlation occurred by chance are no more than 5 out of 100 (95%).100
6. Drawing conclusion
100
William Trochim, -- James P Donnelly, The Research Method……………, 277