Embed Size (px)
Citation preview

119
Chapter III. Securing Safe and Pleasant Traffic Section 1. Traffic Situation in 2009 1. Situation of Traffic Accidents (1) Overview
In 2009, the number of fatalities from traffic accidents was 4, 914, marking a decrease for the ninth consecutive year, as well as hitting the 4,000 mark for the first time in 57 years (since 1952). The number of
accidents and number of injured have also gone down for five consecutive years, and the number of injured has dropped further from last year when it was below one million, the first time in ten years.
Number of accidents in 2009 736,688 cases (down 29,459 from the previous year (3.8%)) Number of fatalities in 2009 4,914 persons (down 589 from the previous year (4.7 %)) Number of injured in 2009 910,115 persons (down 35,389 from the previous year
(3.7%)) Number of fatalities within 30 days from the time of accident in 2009
5,772 (down 251 from the previous year (4.2%))
Number of driver’s license holders at the end of 2009 80,811,945 (up 364,103 from the previous year (0.5%)) Number of automobiles owned at the end of 2009 90,464,031 vehicles (down 363,229 from the previous year
(0.4%)) Number of kilometers driven by the end of FY2008 (distance traveled by automobiles)
746.9 billion kilometers (up 16.8 billion kilometers from the previous year (2.2%))
Diagram 3-1 Trends in the number of Accidents, Fatalities, Injuries, Automobiles Owned, Driver’s License Holders,
and Distance Traveled
(2) Fatal Accidents Situation • Among fatalities while bicycle riding, the elderly1
occupy 37. 0 %. • Youths2 accounted for the highest number of fatalities
caused while riding on two-wheeled motor vehicles, amounting to 30.9% of two-wheeled motor vehicles fatalities).
• Those over 75 years of age accounted for the highest number of fatalities caused while riding bicycles, amounting to 37.3% of the total bicycle fatalities).
• Those of over 75 years of age accounted for the highest number of pedestrian fatalities, amounting to 49.1 % of the pedestrian fatalities).
Note: The number of automobiles owned and the distance traveled (100 million kilometers) are provided by the Ministry of Land, Infrastructure, Transport and Tourism
0
2,000
4,000
6,000
8,000
10,000
12,000
14,000
16,000
18,000
0
200,000
400,000
600,000
800,000
1,000,000
1,200,000
1,400,000
(cases/persons)(persons)
Num
ber o
f Tra
ffic A
ccid
ents
and
Inju
ries
Num
ber o
f Fat
aliti
es, A
utom
obile
s O
wne
d, D
river
's Li
senc
e H
olde
rs a
nd
Dis
tanc
e Tr
avel
led
Fatalities (persons)Injured
(10 thousand persons)
Accidents (10 thousand cases)
Automobiles Owned
Distance Traveled (100 million kilometers)
License Holders (10 thousand persons)
Fatalities within 30 days

120
Note 1: Indicates 65 years of age or over. 2: Between 16-24 years of age. Diagram 3-2 Fatalities by Situation and Age Group (2009)
2. Reasons for the Decrease in Fatalities
in Recent Years In recent years, the number of fatalities have
declined although the number of accidents and number of injured remain high. This is due to the following factors: a rise in the rate of seatbelt users bringing down the degree of injuries, a decrease in the number of vehicular accidents due to over speeding, a decrease in extreme and highly dangerous accidents; and a decrease in law violation. (1) Rise in the Rate of Seatbelt Users
In 2009, the rate of fatalities among non-seatbelt users was 13 times more than that of seatbelt users. Thus, wearing seatbelts can be recognized as contributing to reduce the number of accident fatalities. The rate of seatbelt-users has been steadily on the rise since 1993 and it is believed to be one of the factors in lowering the number of fatalities among automobile drivers/passengers.
Diagram 3-3 Trends in Seatbelt User Rates and Fatality Rates (while on board) (2000-2009)
Note 1: seatbelt user rate = number of fatalities wearing seatbelts (while on board) ÷ number of fatalities (while on board) ×100 2: fatality rate = number of fatalities (while on board) ÷ number of fatalities and injuries (while on board) ×100
0.0
0.2
0.4
0.6
0.8
1.0
50
60
70
80
90
100
2000 2001 2002 2003 2004 2005 2006 2007 2008 2009
(%)(%)
(year)
Fatality Rate
93.3%
0.28%
0.55%
84.1%
Seatbelt User Rate
Fatality Rate (while on board)
Seatbelt Users
(2) Decrease in the Pre-accident Speed of
Vehicles In 2009, the fatality rate in accidents involving high
speed over 80 km/h was 49.7 times higher than that below 80 km/h. The decrease in accidents while driving at high speed is thought to be a factor that contributes to the decrease in the number of fatalities.
0
100
200
300
400
500
600
700
800
900
28 1 5 36 41
0
222
163 75
29 30 0
91 53
7 10 22
1
153 116
21 25 57 0
155 94
21 30 81
1
211
39 42 71 159
1
148
16 31 49 125
2
270
24 71
186
359
4
322
21 86
259
843
7
( persons )N
umbe
r of F
atal
ities
121
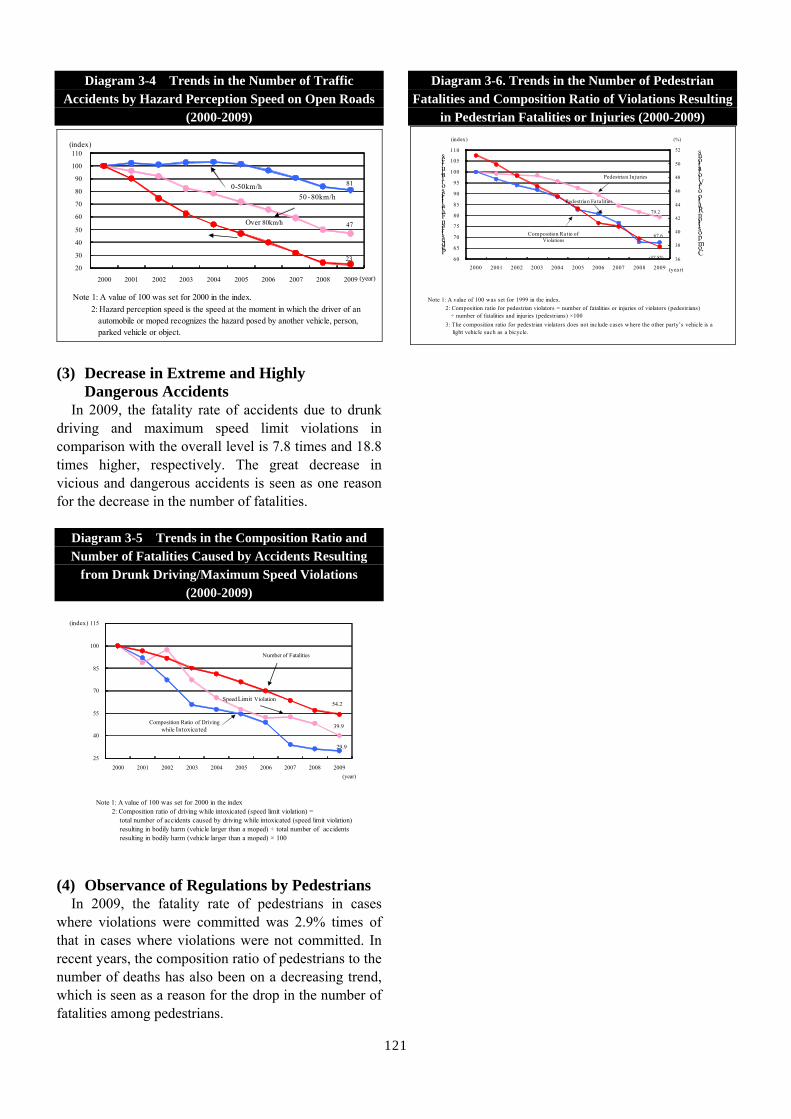
Diagram 3-4 Trends in the Number of Traffic Accidents by Hazard Perception Speed on Open Roads
(2000-2009)
Note 1: A value of 100 was set for 2000 in the index. 2: Hazard perception speed is the speed at the moment in which the driver of an automobile or moped recognizes the hazard posed by another vehicle, person, parked vehicle or object.
20
30
40
50
60
70
80
90
100
110
2000 2001 2002 2003 2004 2005 2006 2007 2008 2009
(index)
(year)
0-50km/h
23
81
47Over 80km/h
50-80km/h
(3) Decrease in Extreme and Highly
Dangerous Accidents In 2009, the fatality rate of accidents due to drunk
driving and maximum speed limit violations in comparison with the overall level is 7.8 times and 18.8 times higher, respectively. The great decrease in vicious and dangerous accidents is seen as one reason for the decrease in the number of fatalities.
Diagram 3-5 Trends in the Composition Ratio and Number of Fatalities Caused by Accidents Resulting
from Drunk Driving/Maximum Speed Violations (2000-2009)
Note 1: A value of 100 was set for 2000 in the index 2: Composition ratio of driving while intoxicated (speed limit violation) = total number of accidents caused by driving while intoxicated (speed limit violation) resulting in bodily harm (vehicle larger than a moped) ÷ total number of accidents resulting in bodily harm (vehicle larger than a moped) × 100
25
40
55
70
85
100
115
2000 2001 2002 2003 2004 2005 2006 2007 2008 2009
(index)
(year)
Number of Fatalities
Composition Ratio of Driving while Intoxicated
Speed Limit Violation54.2
39.9
29.9
(4) Observance of Regulations by Pedestrians
In 2009, the fatality rate of pedestrians in cases where violations were committed was 2.9% times of that in cases where violations were not committed. In recent years, the composition ratio of pedestrians to the number of deaths has also been on a decreasing trend, which is seen as a reason for the drop in the number of fatalities among pedestrians.
Diagram 3-6. Trends in the Number of Pedestrian Fatalities and Composition Ratio of Violations Resulting
in Pedestrian Fatalities or Injuries (2000-2009)
Note 1: A value of 100 was set for 1999 in the index. 2: Composition ratio for pedestrian violators = number of fatalities or injuries of violators (pedestrians) ÷ number of fatalities and injuries (pedestrians) ×100 3: The composition ratio for pedestrian violators does not include cases where the other party’s vehicle is a light vehicle such as a bicycle.
36
38
40
42
44
46
48
50
52
60
65
70
75
80
85
90
95
100
105
110
2000 2001 2002 2003 2004 2005 2006 2007 2008 2009
(%)(index)
(yea r)
Pedestrian Fatalities or Injuries
Composition Ratio of Violations
Composition Ra tio ofViolations
Pedestrian Fa ta lities
Pedestrian Injuries
79.2
67.6
37.8%

122
Section 2. Uplifting the National Traffic Safety Awareness 1. Police Efforts for Eradicating Drunk
Driving (1) Activities to “Foster a Social Environment
that does not Tolerate Drunk Driving” In June 2009, administrative punishment for the
drunken driving was enhanced, and thus traffic accidents by drunken driving decreased from the previous year.
The police actively publicize the reality of the dangers of drunk driving as well as of the accidents caused by drunk driving, and promote traffic safety education holding participation and experience type workshops by using driving simulators and drunk driving simulator goggles.
Additionally, they are requesting cooperation from relevant industries, including alcohol liquor manufacturers, retailers, and establishments that serve alcohol to deter drunk driving. The police also take
part in promoting activities to “Foster a Social Environment that does not tolerate Drunk Driving” in cooperation with the private sector, such as encouraging people to participate in the “Designated Driver Movement” (Handle Keeper Movement)1 which is being promoted by the Japan Traffic Safety Association. Note 1: A campaign to eradicate drunk driving in which a person
within a group of customers at an establishment serving alcohol is chosen (designated driver) to refrain from drinking and take the responsibility to drive the others safely back home, on visiting alcohol service establishments. This is done with the cooperation of the establishment serving alcohol.
Diagram 3-7 Trends in the Number of Drunk Driving Accidents and Fatalities (2000-2009)
(2) Promoting the Spread of Substitute
Driving Business as means to Eradicate Drunken Driving
From the viewpoint of drunken-driving extermination, sound development of substitute driving business is indispensable. From the point of view of eradicating drunk driving, wide promotion of substitute driving as the means for this is important. The police, in tandem with the Ministry of Land, Infrastructure,
Transport and Tourism, formulated the “Program for the Improvement of the Environment and Use of the Substitute Driving Services” to explore ways to improve customers’ convenience and safety as well as the sound operation of substitute driving businesses on February 2008, and advance measures to improve the safety and quality for the usage of these services.
1,2761,191
997
780710 707
611
430
305 292
26,28025,400
20,328
16,374
15,17813,875
11,625
7,5586,219 5,725
0
5,000
10,000
15,000
20,000
25,000
30,000
0
200
400
600
800
1,000
1,200
1,400
1,600
1,800
2,000
2000 2001 2002 2003 2004 2005 2006 2007 2008 2009
Number of Drunk Driving Accidents
Number of Drunk Driving Accidents that led to DeathN
umbe
r of D
runk
Driv
ing
Acc
iden
ts th
at le
d to
Dea
th
(cases)(cases)
Num
ber o
f Dru
nk D
rivin
g A
ccid
ents
(year)

123
Table 3-1 Trends in the Number of Authorized Substitute Driving Businesses (2005-2009)
Category Year 2005 2006 2007 2008 2009
No. of Authorized Businesses (businesses) 6,010 6,447 7,253 7,763 8,324
No. of Employees at Substitute Businesses(persons)
64,570 69,762 77,944 81,274 84,859
No. of Escort Car (cars) 23,817 25,332 28,002 28,347 29,531
(3) Strengthening Drunk Driving Regulations
Toward eradicating drunken driving, the police continue to promote a strict crackdown on the provision of vehicles and liquor, and applying punishment regulations on sharing rides by solicitation and request.
Table 3-2 Trends in the Number of Cases Cleared for Drunk Driving (2009)
CategoryDrunk
DrivingDriving whileIntoxicated
Crime ofProviding a
Vehicle
Crime ofProvidingAlcohol
Crime ofDemanding /
Requesting a RideNumber of Crackdowns 954 40,847 200 70 854
2. Promotion of the Safe Use of Bicycles (1) Situation of Traffic Accidents involving
Bicycles Bicycles are a beloved method of transportation for
the people of Japan; they are used by a wide-range of people for a variety of purposes. In 2009, there were 156,373 cases of traffic accidents involving bicycles, accounting for 21.2% of all traffic accidents.
Diagram 3-8 Trends in the Number of Traffic Accidents and the Number of Accidents related to Bicycles (2000-2009)
(2) Preparing Environments to Handle Bicycle
Traffic The police are promoting the preparation of a traffic
environment for bicycles by partnering with road administrators, establishing bicycle zones and modifying car roads to ensure that pedestrians and bicyclists can safely use and appropriately share roads, as well as promoting efforts to establish the networking of bicycle zones. (3) Promotion of Bicycle Safety Education
The police are partnering with local public entities, schools and bicycle-related organizations to promote “Rules relating to Traffic Routines” and “The Five Principles of Bicycle Safety.” The police are working to spread knowledge of bicycle traffic rules for such
broad types of users as children, students, the elderly and housewives.
In addition, the police are creating a wealth of educational content by partnering with schools through participatory, practical bicycle training to children and students, by utilizing reenactments of accidents by stunt men, or bicycle simulators. In 2009, approximately 3.37 million people participated in the 31,000 bicycle education courses targeted at children/students and the elderly across the nation. (4) Strengthening of Guidance and Crackdown
on Traffic Law Infringements by Bicyclists Focusing on bicycle guidance/enlightenment priority
areas/roads1, the police are strengthening guidance measures against bicycle riders that ride without
2000 2001 2002 2003 2004 2005 2006 2007 2008 2009
931,934 947,169 936,721 947,993 952,191 933,828 886,864 832,454 766,147 736,688Number of Accidentsrelated to Bicycles 173,876 175,223 178,289 181,845 187,980 183,653 174,262 171,018 162,525 156,373
Category Year
Total Number of TrafficAccidents
0
100,000
200,000
300,000
400,000
500,000
600,000
700,000
800,000
900,000
1,000,000
2000 2001 2002 2003 2004 2005 2006 2007 2008 2009
Total Number of Traffic Accidents Number of Accidents related to Bicycles(cases)

124
headlamps, ride a bicycle together with another person, ignore traffic lights, and loiter. Additionally, the police are taking strict measures on those who dangerously and viciously violate the traffic law and cause real danger to vehicles and pedestrians, and those who continue to break the law, despite warnings, by utilizing traffic tickets which threaten arrest.
Diagram 3-9 The Five Principles of Bicycle Safety
Five Principles for Safe Bike Ride
1. Bicycle must, in principle, passes on road except sidewalk
2. Lefthand rides on road
3. Pedestrians have right of way on sidewalks and bicycles must be ridden slowly on the road side
4. Abide by safety rules
・ Do not drive under influence. No ride double.No ride side by side
・ Lights up after dark・ Follow traffic lights on intersection, stop
temporary before confirming safe to cross
5. Make sure children always wear helmets
Note 1: Based on the state of traffic accidents involving
pedestrians and bicycles, local resident complaints and requests, 1,827 locations nationwide (as of May 1, 2008) have been specified as bicycle guidance/enlightenment priority areas/roads. The police are promoting guidance and enlightenment regarding bicycle use in these areas.
3. Traffic Safety Education and Traffic
Safety Activities (1) Traffic Safety Education 1) Guidelines to Traffic Safety Education
The National Public Safety Commission (NPSC) has drawn up and made public the Traffic Safety Education Guidelines to ensure that local public entities and private entities can carry out effective and appropriate traffic safety education, and to establish a common standard for the traffic safety education carried out by the Prefectural Public Safety Commissions (PPSC). The police implement the guidelines that specify the
basic preparedness required of those engaged in traffic safety education, as well as the contents and methods of systematic traffic safety education that are suited to the mental and physical development and traffic modes of each age group.
Diagram 3-10 Traffic Safety Education by Age
・ Education to learn the ability and knowledge necessary for pedestrians and bicycle users
・Education related to safe driving of mopeds and two-wheeled motor vehicles・Education to give deep understanding about characteristics of bicycle and responsibilities of drivers
Elementary School Students
Junior High School Students
High School Students
Adults
・Traffic safety education which is essential to get driver's license or after getting the license・Traffic safety education for pedestrian and bicycle riders who do not hold driver's license
Elderly people
・Traffic safety education with actual participation, experience and practice including the experience about the effects of reflective materials・Traffic safety guidance by visiting the house of elderly people with the cooperation of concerned organizations and entities
2) Traffic Safety Education in Business
Establishments and Other Places Business establishments using more than a specified
number of vehicles are obliged, under the stipulations of the Road Traffic Act, to carry out traffic safety education in accordance with the Guidelines by appointing a safe driving supervisor. The police provide the necessary instruction such as lessons for safe driving supervisors in order to ensure that traffic safety education is implemented appropriately. (2) Traffic Safety Activities
The police are trying to uplift the national traffic safety awareness in cooperation with concerned organizations/groups and traffic volunteers (traffic safety campaign promotion committees, traffic counselors, etc.) in various ways. 1) National Traffic Safety Campaign
The police conduct National Traffic Safety Campaigns in spring and fall every year aiming for the thorough prevention of traffic accidents by widely spreading and implementing the idea of traffic safety and to encourage people to comply with traffic rules and uphold good standards in traffic manners. During campaign periods, national and local public entities and private entities work together to carry out large-scale, nationwide campaigns.

125
2) Thorough Wearing and Use of Seatbelts and Child Seats
The police have mandated the wearing of seatbelts for backseat passengers from June 2008, and an administrative punishment of traffic violation points will be incurred on offenders on the expressway. In a national survey conducted in October 2009 (joint survey by the NPA and Japan Automobile Federation (JAF)), the rate of backseat passengers wearing seatbelts stands at 33.5% on general roads and 63.4% on expressways. The police promote participatory, experiment-based, and practical traffic safety education by utilizing images of collision experiments or “seatbelt convincers” that enable people to feel the effects of wearing a seatbelt, thus facilitating the thorough wearing of seatbelts in all seats including the backseats.
In addition, for child seats of which the rate of use remains at 56.8%, as shown in a survey in April 2010, the thoroughness of proper use is being facilitated by providing parents with publications or instructions on proper installation at kindergarten or nursery schools.
3) Other Traffic Safety Activities To raise national traffic safety awareness, the police
provide various assistances. These include cooperation in announcing public activities such as traffic safety campaigns that are conducted by local public entities and other entities, workshops for the leaders of local volunteers who takes initiatives in traffic safety activities to ensure efficiency, and provision of information on the actual state of traffic accidents.
Other than the above, various entities listed in Diagram 3-11 are developing activities to aim for traffic safety.
Diagram 3-11 Activities of Various Institutions
Prefectural Traffic Safety Association
Japan Safe Driving Center
Japan Traffic Safety Association
Public announcement enlightenment activities
Training regarding operations of (Prefectural Traffic Safety Activity Promotion Center
Consultation on traffic accitdents
Central role of citizens about traffic safety activities
Accumulated point notification
Traffic accident proof
Driving career proof
Institute for Traffic Accident Research and Data Analysis (Traffic Accident Research and Analysis Center under the Road Traffic
Act)
(National Traffic Safety Activity Promotion Center under the Road Traffic (Prefectural Traffic Safety Activity Promotion Center under the Road Traffic Act)
Macro statisticalanalysis Micro survey
Investigation of accident example in which detailed inspection about reason of accident is carried out by going to actual place of accident
Multi-lateral analysis by integrating various data related to person, vehicle, road received from the police or traffic administration
Research study, etc. Safe driving training
(Legal person based on Japan Safe Driving Center Act)

126
Section 3. Measures for Drivers 1. Driver’s Education (1) System for Driver’s Education
Opportunities for driver’s education are systematically established at various stages in the
license-obtaining process and after licenses are issued. The flow of this setup is as follows.
Diagram 3-12 Driver's Education System
(2) Enhancement of Education for Those Who
Wish to Acquire a Driver’s License Individuals who wish to acquire a driver’s license
must take the driver’s license examination given by PPSC. However, those who have graduated from designated driving schools1 are exempt from the skills test.
As designated driving schools play a central role in driver education for beginners, the police are striving to enhance the instruction given at driving schools through such means as improving the quality of instructors. • Designated driving schools: 1,392 places nationwide
(as of the end of 2009) • Number of graduates who passed the driver’s license
examination during the same year: 1,564,841 persons (95.9% of all passed persons).
Additionally, applicants for driver’s licenses are obligated to take lectures (courses to be given at the time the license is acquired) in order to learn the necessary skills and knowledge for safe driving according to the type of license sought. However, graduates of designated driving schools and specified driving schools2 do not need to take these courses as they have received instruction on the same contents. Note 1: Driving schools designated by the PPSC as meeting set
standards for staff, facilities, and teaching methods. 2: Specified driving schools that provide training courses
specified by PPSC as meeting set standards for staff, facilities, training methods, and so forth.
Renew
al
Persons responsiblefor an accident or infringement
School education
Designated driving schoolSpecified driving school
Personstrying to obtain a driver’s license
Driver’s license exam
ination
Driver’s license issuance
Courses at the tim
e of obtaining licenses
Courses for suspended driversCourses for offendersCourses for novice drivers
Persons who have had their
license revoked
Courses for persons
Notified driving schoolOther driving school
Courses at the time of Renewal 1
Courses for elderly persons 2
Note 1: Persons trying to renew a driver’s license are required to take courses at the time of renewal.2: Persons who are 70 years old or over on the day of driver’s license expiration are required to take courses for senior citizens. In addition, for those who are 75 years old or over are required to take
preliminary inspection training (Cognitive Impairment Screening Test for Senior Drivers, and courses for elderly persons are held based on the result.3: As part of driver’s license education which has been approved by the Prefectural Public Safety Commission (PPSC), persons who have completed the equivalent process of training as the courses for
elderly drivers and the courses at the time of renewal are exempt from taking courses.
Specific education 3, other courses

127
Table 3-3 Situation of Provision of Lectures for License Acquisition (2009)
Type ofLicense
Course Name ContentsNumber ofAttendees(persons)
Large-sizedVehicles
430
Medium-sizedVehicle 302
Ordinary VehicleCourse
15,858
Large-sizedTwo-wheel MotorVehicle Course
508
Ordinary Two-wheelVehicle Course
2,425
Large-sized Passenger-carryingVehicle Course
1,805
Medium-sizedPassenger-carryingVehicle Course
98
Ordinary Passenger-carryingVehicle Lecture
2,863
Emergency TreatmentCourse
Essential knowledge on emergencytreatment such as artificial respiration,CPR, etc.
20,914
MopedLicense
Moped Course
Essential knowledge forsafe driving such asmanipulating methods anddriving methods of mopeds
195,624
Note: Each course should include practical training sessions.
OrdinaryLicenses
etc.
Driving techniques and knowledgeessential for safe driving of respectivevehicles such asrisk assessment
(3) Improvement of Driver’s Education after Acquisition of a Driver’s License
1) Provision of Carefully-laid out Courses upon Renewing License
Courses that must be taken by those who apply for renewal of their driver’s license aim to increase the driver’s safety awareness by supplementing necessary knowledge for safety driving by periodically providing courses upon renewal of licenses.
The lectures are held by categorizing drivers by the degree of compliance with the law and other criteria; gold card (model) drivers, general drivers, drivers who have broken the law, and drivers of first time renewal.
In addition, special courses are compiled according to the condition of the drivers such as courses for senior drivers, young drivers, and motorcycle drivers. The courses are also enhanced by taking up the actual situation of accidents by those taking the courses.
Table 3-4 Situation of Provision of Lectures at the Time of Renewal (2009) 2) Education for Reeducating Reckless Drivers
Enhanced education is provided for dangerous drivers through the following scheme. An education program is held to decrease the dangers in driving of those who have accumulated a certain number of points due to violations of the Road Traffic Act. Courses are also held for those who have received administrative punishment, for novice drivers, those with revoked licenses or with suspended licenses, and traffic offenders.
In particular, as measures against habitual drunk drivers, drunk driving classes have been established for those whose licenses have been suspended due to drunken driving violations. Enriching the content of education is being facilitated through simulated experiences of drinking by using drunken driving goggles or simulators, or through lectures by the family of victims of drunk driving.
Courses for SafeDrivers
Courses for GeneralDrivers Courses for Offenders
Courses for DriversRenewing for the First Time
8,505,895 3,149,673 4,136,410 1,173,060
Drivers withexpired licenseswith specializedreasons
12,290 76,318 88,910 43,960
30 minutes 1 hour 2 hours 2 hoursAn explanation is given on thesituations of traffic accidents as wellas knowledge necessary for safedriving by using videos and otheraudio visual materials.
In addition to the contents of thecourses for safe drivers, aqualification test using "safe drivingself diagnosis" is offered andpractical guidance is given.
In addition to the contents of thecoursesfor general drivers,discussions are held and guidancerelated to knowledge essential fordriving automobiles is given.
In addition to the contents of thecourses for offenders , an exercise isgiven for the drivers to fully acquirethe fundamental knowledge relatedto driving of automobiles.
Category
Number ofattendants(persons)
Course Time
Course Contents
128
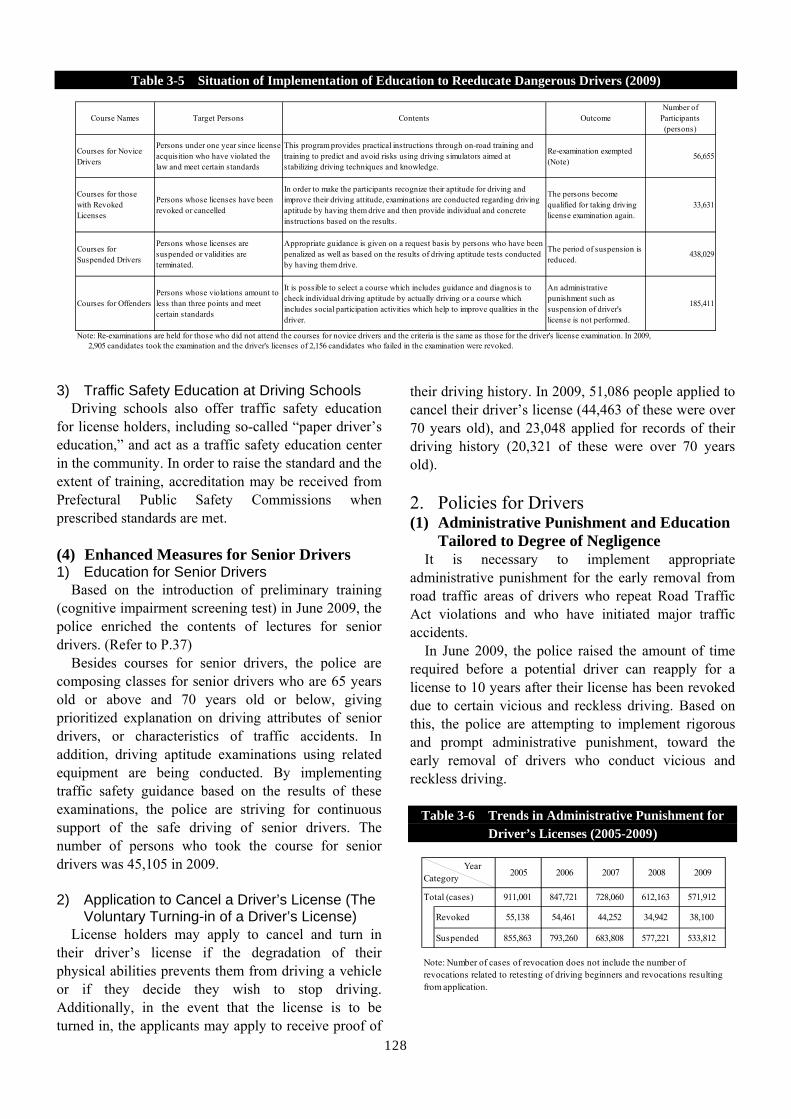
Table 3-5 Situation of Implementation of Education to Reeducate Dangerous Drivers (2009)
3) Traffic Safety Education at Driving Schools
Driving schools also offer traffic safety education for license holders, including so-called “paper driver’s education,” and act as a traffic safety education center in the community. In order to raise the standard and the extent of training, accreditation may be received from Prefectural Public Safety Commissions when prescribed standards are met. (4) Enhanced Measures for Senior Drivers 1) Education for Senior Drivers
Based on the introduction of preliminary training (cognitive impairment screening test) in June 2009, the police enriched the contents of lectures for senior drivers. (Refer to P.37)
Besides courses for senior drivers, the police are composing classes for senior drivers who are 65 years old or above and 70 years old or below, giving prioritized explanation on driving attributes of senior drivers, or characteristics of traffic accidents. In addition, driving aptitude examinations using related equipment are being conducted. By implementing traffic safety guidance based on the results of these examinations, the police are striving for continuous support of the safe driving of senior drivers. The number of persons who took the course for senior drivers was 45,105 in 2009. 2) Application to Cancel a Driver’s License (The
Voluntary Turning-in of a Driver’s License) License holders may apply to cancel and turn in
their driver’s license if the degradation of their physical abilities prevents them from driving a vehicle or if they decide they wish to stop driving. Additionally, in the event that the license is to be turned in, the applicants may apply to receive proof of
their driving history. In 2009, 51,086 people applied to cancel their driver’s license (44,463 of these were over 70 years old), and 23,048 applied for records of their driving history (20,321 of these were over 70 years old). 2. Policies for Drivers (1) Administrative Punishment and Education
Tailored to Degree of Negligence It is necessary to implement appropriate
administrative punishment for the early removal from road traffic areas of drivers who repeat Road Traffic Act violations and who have initiated major traffic accidents.
In June 2009, the police raised the amount of time required before a potential driver can reapply for a license to 10 years after their license has been revoked due to certain vicious and reckless driving. Based on this, the police are attempting to implement rigorous and prompt administrative punishment, toward the early removal of drivers who conduct vicious and reckless driving.
Table 3-6 Trends in Administrative Punishment for Driver’s Licenses (2005-2009)
2005 2006 2007 2008 2009
Total (cases) 911,001 847,721 728,060 612,163 571,912
Revoked 55,138 54,461 44,252 34,942 38,100
Suspended 855,863 793,260 683,808 577,221 533,812
YearCategory
Note: Number of cases of revocation does not include the number ofrevocations related to retesting of driving beginners and revocations resultingfrom application.
Course Names Target Persons Contents OutcomeNumber of
Participants(persons)
Courses for NoviceDrivers
Persons under one year since licenseacquisition who have violated thelaw and meet certain standards
This program provides practical instructions through on-road training andtraining to predict and avoid risks using driving simulators aimed atstabilizing driving techniques and knowledge.
Re-examination exempted(Note)
56,655
Courses for thosewith RevokedLicenses
Persons whose licenses have beenrevoked or cancelled
In order to make the participants recognize their aptitude for driving andimprove their driving attitude, examinations are conducted regarding drivingaptitude by having them drive and then provide individual and concreteinstructions based on the results.
The persons becomequalified for taking drivinglicense examination again.
33,631
Courses forSuspended Drivers
Persons whose licenses aresuspended or validities areterminated.
Appropriate guidance is given on a request basis by persons who have beenpenalized as well as based on the results of driving aptitude tests conductedby having them drive.
The period of suspension isreduced.
438,029
Courses for OffendersPersons whose violations amount toless than three points and meetcertain standards
It is possible to select a course which includes guidance and diagnosis tocheck individual driving aptitude by actually driving or a course whichincludes social participation activities which help to improve qualities in thedriver.
An administrativepunishment such assuspension of driver'slicense is not performed.
185,411
Note: Re-examinations are held for those who did not attend the courses for novice drivers and the criteria is the same as those for the driver's license examination. In 2009, 2,905 candidates took the examination and the driver's licenses of 2,156 candidates who failed in the examination were revoked.

129
(2) Improvement in Convenience of Procedures for Obtaining a Driver’s License
To mitigate the burden for citizens during the process of driver’s license renewal, policies and measures such as the following are being enforced: issuance of renewed licenses on the day of application; acceptance of applications on Sundays; setting up counters for renewing driver’s licenses at police stations; the omission of an ID photo from application forms; and the acceptance of renewal applications through Public Safety Commissions other than the area of the driver’s residence (limited to gold card (model) drivers).
In addition, for the benefit of disabled applicants/drivers, development and improvement of examination facilities, utilization of instructional video with subtitles, and implementation of academic examinations with hiragana readings for the kanji characters used in examination questions are among the measures being put into effect. Moreover, in order to individually assess whether persons with physical disabilities or chronic illnesses are capable of driving safely, the police assign staff with abundant expert knowledge and are working for the enhancement of counseling activities on proper driving. In particular, with the introduction of the preliminary examination, it is expected that consultation by examinees or their families on aptitude for driving or medical institutions where diagnoses of dementia can be given, will increase. As such, the police attempt to enhance the counseling system and secure counseling places. (3) License Administration Adapted to
Internationalization Individuals who possess driver’s licenses issued by
foreign administrative agencies are exempt from a portion of the driver’s license examination under certain conditions. The number of driver’s licenses issued under the same conditions in 2009 was 31,316. The police also produced a video for traffic safety education for foreign drivers, making it more available. As such, the police are striving to enrich traffic safety education based on local circumstances.
(4) Digitalizing Driver’s Licenses The issuance of IC card licenses began in January
2007, and was introduced in all prefectures in January 2010. IC card licenses have the advantages of the prevention of forgery, as well as the protection of the driver’s privacy by eliminating the inscription of legal domicile from the face of the license and making it an electromagnetic record.
IC Card License
130
Section 4. Development of Traffic Environment 1. Development of Safe and Secure
Traffic Environment (1) Promotion of Development of the Project
for Traffic Safety Facilities The police are promoting the development of traffic
safety facilities such as signals or road signs to secure traffic safety and smoothness. Since 1966, in order to prevent frequent traffic accidents promptly and effectively, efforts in line with the Long-term Project for Traffic Safety Facilities have been promoted, but in order to improve various social infrastructure maintenance projects more emphatically, effectively and efficiently, the Act on Priority Plan for Social Infrastructure Development was enacted on March 2003. In this Act, the “Priority Plan for Social Infrastructure Development” was to be formulated by integrating the past long-term plans by field of business on development of such social infrastructure as traffic safety facilities, roads and ports. Efforts were
made to further enhance cross-sectional efforts and collaboration between businesses.
In line with the Second Phase of the Priority Plan for Social Infrastructure Development with the planned period of 2008 through 2012, development of traffic safety facilities are being facilitated toward achieving the objectives listed in the plan.
Diagram 3-13 Implementation of Main Traffic Safety
Facilities
・ Signals : Approx.200,000 units・ Road Signs : Approx 6.60 million boards・ Inflared Beacon Devices: Approx 53,000 units・ Traffic Information Boards: Approx 3,600 boards・ Traffic Control Centers: Approx 163 locations (As of the end of FY2009)
Diagram 3-14 Second Phase Priority Plan for Social Infrastructure Development (Planned Period 2008-2012)
[Measures and Index of Development Projects by the Police such as Traffic Safety Facilities]
1. Improvement of traffic safetyFatality and Injury Rate in Traffic Accident (Reduce by approx. 10%)
2.Promoting measures for community roads and measures related to pedestrians and bicyclesControl rate over accidents causing death and injuries in safe pedestrian areas
(Control by approx.20% of the number of accidents causing death and injuries related to pedestrians and bicycles at placeswhere measures are taken)
Barrier-free type signals in major community-related roads (Approx.83%→100%)3. Promoting measures for trunk roads
Control rate over accidents causing death and injuries in accident risk prone places (Control by approx.30 at places where measures are taken)
Control over accidents causing death and injuries (Control by approx. 40,000 cases/year)4. Promoting smoothness in traffic by advanced signals
Reducing the intersection passing time by advanced signals (Reduce by approx. 220 million-persons/hour/year)Control over elimination of carbon dioxide by advanced signals (Control CO2 by 460,000t every year)
5. Promoting Intelligent Transport Systems
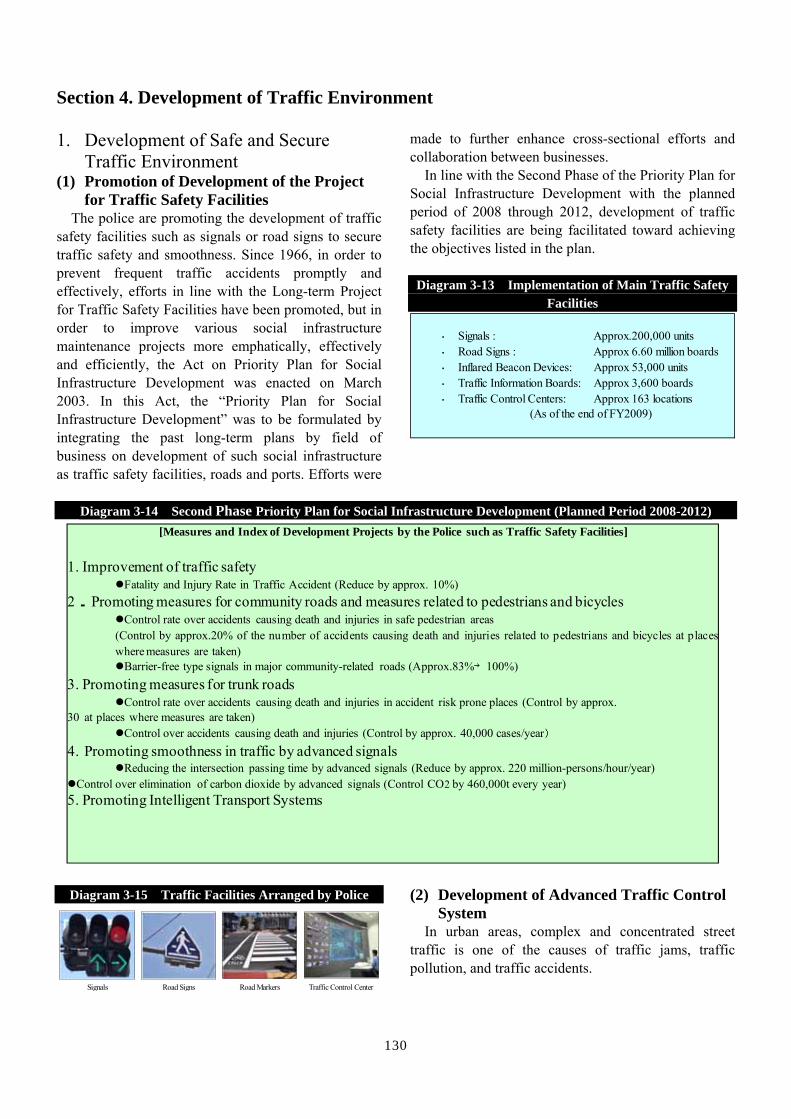
Diagram 3-15 Traffic Facilities Arranged by Police
Traffic Control CenterSignals Road Signs Road Markers
(2) Development of Advanced Traffic Control System
In urban areas, complex and concentrated street traffic is one of the causes of traffic jams, traffic pollution, and traffic accidents.

131
The police strive to make the flow of traffic smoother by analyzing data of the traffic volume and driving speed collected through vehicle recognition devices and other devices. Based on the analyzed information by traffic control systems, the police control traffic signals and provide traffic information.
The measures taken in concrete are as follows; • Smoothening of traffic by controlling traffic signals
in response to traffic conditions
• Guiding and dispersing the flow and volume of traffic by providing detailed traffic information
• Improving the convenience of public transportation by controlling signals to give buses priority and lowering the demand for individual vehicles
The measures described above and other measures are taken to effectively and safely control street traffic which has become highly complex and concentrated.
Diagram 3-16 Traffic Control Center On-board Unit
(3) Traffic Information Provision by the Police
The police are making efforts to enable drivers to precisely ascertain the level of traffic congestion and the amount of time required for safe transit and pleasant driving by providing traffic information data gathered and analyzed by traffic control systems to the public at large. Efforts are also being made to disperse traffic to reduce congestion and accidents.
VICS (Vehicle Information and Communication System)1 has been used as a means of information provisioning in addition to traffic information boards. VICS can display the real time situation of the road traffic which changes by the minute on the map screen with a system that provides traffic information through infrared beacons² to the car navigation devices installed in cars.
In addition, with the aid of concerned entities, the police are supporting private businesses that provide traffic information by means of mobile phones, the Internet, and car navigation systems through the construction of a system that provides real-time online traffic information. The police are also setting guidelines for the provision of traffic information so
that these businesses can smoothly contribute to safe traffic.
Diagram 3-17 Example of Display of VICS Car
Navigation Device
Approx.20 Minutes
Approx.40 Minutes
Traffic regulation
分析・制御 交通管制センター
On-board unit
Information collection/Information provision
Information provision
Informationcollection
Parking guidance system
Traffic information boardInfrared beacon device Signal
Roadside communication
Vehicle detector
TV camera
Analysis Traffic control center
Variable sign
・Traffic jam information・Travel time information, etc.

132
(4) Environmental Measures through Traffic Control
1) Traffic Control for Environmental Measures The police execute measures according to the
situation of the traffic noise and vibration by restricting maximum speed to reduce the engine sound and vibrations by reducing the speed of passing vehicles and by restricting vehicles to use lanes closer to the middle lane to keep away large-sized vehicles with large engine sounds and vibration from the roadside. 2) Promoting Eco-Driving
Since the “use of cars in which the reduction of the environmental burden is considered (eco-driving)” is effective for environmental preservation and is expected to contribute to a certain extent to the prevention of traffic accidents, the police are trying to
spread and promote eco-driving based on the “10 Tips for Eco-Driving” formulated in October 2006 by the Eco-Drive Spread Liaison Council.3
Note 1: Vehicle Information and Communication System 2: An infrared communication device which is installed on
roads to perceive passing cars, to measure traffic loads and mediate the information between the on-board unit and the Traffic Control Center.
3: Consists of the NPA, the Ministry of Economy, Trade and Industry, the Ministry of Land, Infrastructure, Transport and Tourism, and the Ministry of the Environment.
Diagram 3 - 18 Ten Tips for Eco-Driving
(5) Promotion of Effective Traffic Regulations
Based on the actual traffic conditions of an area, the police are constantly working to inspect and review traffic control, and traffic regulations such as speed and parking. And in response to traffic condition changes due to road development, local development, new commercial facilities, etc., the police are working to maintain safe and smooth traffic flow by accurately understanding these and implementing comprehensive measures in terms of both software and hardware.
For speed regulations, existing regulation standards were created in 1992. Thereafter, the environment involving road traffic changed due to road development progress and enhanced automotive functions. Considering this, starting in fiscal 2006, the
Survey Research Study Committee on How to Determine Speed Regulations (Chairman: Katsutoshi OTA, Professor, Toyo University) studied how to determine more rational speed regulations. In March 2009, this committee submitted its Survey Research Report on How to Determine Speed Regulations. In response to this report, the standards on maximum speed regulations for general roads were revised in October 2009. Based on these new standards, the police are actively inspecting the existing speed regulations.
1 “e-start” by putting foot on the gas pedal lightly
2 Driving with little acceleration or deceleration
3 Release the gas pedal early
4 Refrain from using air conditioner
5 Stop idling 10 Attention to where you park
9 Drive without unnecessary baggage loaded
8 Check outside air pressure in tires frequently
7 Utilize road traffic information
6 Warming up the engine properly

133
2. Introduction of IT into Road Traffic (1) Intelligent Transport Systems (ITS)1 by
Police The police are promoting the development and
installation of Universal Traffic Management Systems (UTMS)2 such as the following three systems, using infrared beacons devices that optimize traffic management using cutting edge information communication technologies in order to achieve a safe, smooth, and comfortable traffic society with low environmental load. 1) Public Transportation Priority Systems
(PTPS)3 This system aims to improve on-time transport and
user-friendliness, through traffic signal control prioritizing mass public transportation by bus, etc. (introduced in 40 prefectures as of the end of FY2009). 2) FAST Emergency Vehicle Preemption
Systems (FAST)4 This system allows traffic priority to vehicles used
for lifesaving and other emergency purposes by controlling traffic signals. The aim of this system is to shorten the travel time for these vehicles to reach their destinations and avoid any accidents en route to reach their destinations (introduced in 13 prefectures as of the end of 2009). 3) Driving Safety Support Systems (DSSS)5
This system aims to prevent traffic accidents by drawing attention to risk factors by offering peripheral traffic situations to drivers with the help of visual and audio information by creating an environment that enables driving with composure (introduced in 5 prefectures as of the end of FY2009). Note: 1 Intelligent Transport Systems
2: Universal Traffic Management Systems 3: Public Transportation Priority Systems 4: FAST emergency vehicle preemption systems 5: Driving Safety Support Systems
Column 1. How Speed Regulations are Determined under the New Standards
(1) General Roads For general roads, while complying with the
maximum speed standards set in accordance with the Standard Speed Table, speed regulations are adjusted according to each road’s traffic accident occurrence situation, road structure such as existence of sidewalks, roadside situation, etc. In principle, the actual speed regulation is determined within a range of 10km/hr above or below the standard speed.
Standard Speed Table
Category Area Lanes Centraldivider
Pedestrians Standardspeed
1 Many 40km/hr2 Few 50 km/hr3 Many 50 km/hr4 Few 60 km/hr5 Many 50 km/hr6 Few 50 km/hr7 Many 50 km/hr8 Few 60 km/hr9 Many 60 km/hr
10 Few 60 km/hr11 Many 50 km/hr12 Few 60 km/hr
Urban
2 lanes
4 or moreYes
None
Not urban
2 lanes
4 or moreYes
None
(2) Residential Roads
For residential roads, the priorities are the safety and peace of mind of local residents and ensuring pedestrian safety. Therefore, in order to maintain speeds which enable response to sudden running out into the street and the avoidance of major accidents, when implementing the speed regulation, the maximum speed shall in principle be 30 km/hr. The police will also study the implementation of zone regulation, and installation of physical devices which reduce vehicle speed such as humps and cranks in cooperation with related institutions. (3) Road Structures Emphasizing Vehicle
Traffic Functions Even for a general road, on a road which
emphasizes automobile drivability with an advanced structure and few danger factors, the maximum speed shall in principle be 70 or 80 km/hr if safety is maintained.

134
(2) Promotion of International Cooperation concerning ITS
Promotion of collaborative projects with other countries and the establishment of other such international cooperation is important since it is necessary to investigate from a broad view in the field of technological development. The NPA participated in the 16th ITS World Conference held in Stockholm, Sweden in November 2009 (approximately 8,500 concerned participants from governments, private sector and educational institutions from 64 countries). At the conference, the countries shared ITS information and further strengthened the cooperative relationship. In addition, based on a written agreement concerning the cooperation in traffic safety and ITS, and in response to emergency situations between the NPA and the US Department of Transportation’s National Highway Traffic Safety Administration, the police also sponsored a meeting in the United States in January 2010 to hold research presentations on measures and policies of bilateral promotions for ITS.
3. Ensuring the Safe Passage of Pedestrians and Others by Improving the Road Traffic Environment
Compared to the United States and various countries in Europe, the ratio of pedestrian and bicycle user deaths to overall traffic accident fatalities in Japan is remarkably high. Thus, creating measures to deter traffic accidents involving pedestrians and bicycle users has become a vital task.
(1) Development of Safe Pedestrian Areas
In cooperation with road administrators, the police designated 582 locations (as of March 2009) as “safe pedestrian areas” that require urgent measures for securing safe passage of pedestrians and bicycle riders. These include areas such as those used frequently by children and students who walk or take a bicycle to school, areas surrounding facilities used by the elderly or persons with disabilities, and areas with shopping streets crowded with pedestrians. In these areas, the police have been undertaking safety measures focused on the special characteristics of the given area including carrying out traffic regulations which aim to lessen the volume of traffic and decrease traveling speeds; making traffic signals, road markers, and signs user-friendly for the elderly and persons with disabilities.
Diagram 3-19 Development Design for Safe Pedestrian Area
Implement such measures dimensionally as adapting speed limit in the residential areas and road structures to restrict vehicle speed
<Legend>Name of Measure
:Measures of Road Administration
Name ofMeasure
:Measures of Public Safety Committee
Improving pedestrian road
Installing trafficsignal button
Ensuring the safe passage of pedestrians and bicycles by improving pedestrian road and installing signals
Installing humps Implementing maximum speed regulation
Restrict inflow of passing traffic into areas by smooth traffic
Installing right turn lane
Multiple display of signals

135
(2) Installation of Barrier-Free Type Traffic Signals and Other Equipment
The police are promoting various measures to ensure safety for the elderly and disabled persons when crossing streets, in line with the law relating to ease mobility of the elderly and the disabled persons. These include measures for the installation of barrier-free
traffic signals such as those that emit sound to indicate the state of the traffic signal and traffic signals which indicate how much time remains until the light changes color, measures to enlarge the display panels of road signs and markers, and using reflective material which is easily visible when illuminated by car headlights.
Diagram 3-20 Barrier Free Examples of Traffic Safety Facilities by the Police
Acoustic traffic signals Traffic signalsresponding
to the elderly
Traffic signals forpedestrians
to indicate passing time
Escort zone
4. Revitalizing Cities through the
Promotion of Comprehensive Measures against Illegal Parking
(1) Current Situation of Illegal Parking Illegal parking not only aggravates traffic congestion
on arterial roads but it also impedes the safe passage of pedestrians and vehicles, interferes with the work of emergency vehicles, damages the living environment of residents, and has a large effect on the lives of people in general.
Furthermore, illegal parking is also a cause of traffic accidents. During 2009 there were 1,513 collisions involving parked vehicles, with 45 people killed in these accidents. Among complaints, requests, and consultations made through “Dial 110” emergency number, 18.2% were related to parking issues, showing the public’s high concern. (2) Promotion of Measures against Illegal
Parking 1) Detailed Parking Regulations
In order to establish better parking conditions that adapt to factors such as change in the road environment, traffic conditions, and parking demand, the police are reviewing current regulations. In doing so, the police are considering matters both from a time-specific perspective of changes in the flow and volume of traffic depending on the time of day, day of the week, and season, and from a location-specific
perspective of the special features in the traffic situation and road structure of each road section. 2) Regulation of Illegal Parking
Under the new illegal parking regulations that were enacted on June 1, 2006, the confirmation task¹ of unattended parked vehicles² conducted by the monitors of designated corporations have been operating properly and smoothly, showing great effectiveness in assuring traffic safety and smoothness.
Crackdowns on illegal parking are conducted in accordance with guidelines based on the opinions and requests of local residents.
Note 1: Tasks related to attaching stickers after confirmation of
illegal parking. 2: Defined as an illegally parked vehicle whose driver is
away from the vehicle. Table 3-7 Trends in the Situation of Outsourcing of
Checking Work (2006-2009)
YearCategory 2006 2007 2008 2009
Number of Police StationsOutsourcing (stations)
270 310 347 378
Number of CompaniesCommissioned (legal persons)
74 73 73 70
Number of Parking ControlOfficers (persons)
1,580 1,766 1,966 2112

136
Table 3-8 Situation of Crackdowns on Illegal Parking (2009)
2,518,006
Order for payment of a fine for illegalparking 2,032,626
2,462,327
By Parking Control Officers 1,597,48921,647
Number of crackdownson illegal parking
Number of illegal parking stickers onunattended parked vehicles
Number of towed vehicles (vehicles)
3) Parking Measures Combining Hard and Soft
Methods Illegal parking is particularly striking in arterial
roads, and Prefectural Public Safety Commissions, road administrators, and others are cooperating to promote intensive parking measures that combine hard methods1 and soft methods2 against illegal parking. 4) Measures for Securing Parking Spaces
In order to stop the use of roads as vehicle parking spaces, the police issue parking space certificates, accept notifications concerning parking spaces for mini-vehicles based on the Act on Securing Vehicle Parking Spaces. Additionally, the police are cracking down on such acts called aozora chusha3 and, shako tobashi4.
Note 1: Off-road parking and spaces for freight-handling and others, use of colored pavement to clearly mark areas where parking is prohibited
2: Implementation of detailed parking regulations, crackdown on illegal parking and others
3: To park on the public road as if it were a parking space. 4: To obtain parking space certificates by giving false
information on the parking space and base location for using the vehicle.
5. Traffic Police Activities on
Expressways (1) Current Status of Expressway Networks
The number of expressways routes (national expressways and designated motorways) is increasing every year and in 2009 there were a total of 156 routes extending 10,295 kilometers.
In the future, appropriate traffic management corresponding to various situations such as safety measures in the sections where the lanes are not divided by a median showing the direction of travel and expressway toll reform is expected.
The number of fatalities on the expressway in 2009 is 178, a decline for six consecutive years since 2004.
Table 3-9 Trends in the Number of Expressway Accidents and Resulting Fatalities (2000-2009)
(2) Securing Safety and Smoothness of Traffic
on Expressways 1) Traffic Accident Measures based on Traffic
Accident Analysis Upon the detailed analysis of the occurrence
situation of traffic accidents, the police are implementing on-site inspection with the cooperation of road administrators on such serious accidents as fatal accidents and the spots where accidents frequently occur. They are also deliberating required measures and enhancing patrols.
2) Implementing Appropriate Traffic Regulations and Promoting Measures against Driving the Wrong Way
The police are taking into consideration factors such as road structure, weather conditions, traffic situation, and the state of traffic accident occurrences to ensure the propriety of traffic regulations and review them adequately if and when necessary.
In order to prevent the occurrence of driving in the wrong direction, the police have been promoting enlightenment campaigns to publicize the danger of driving in the wrong direction with the cooperation of concerned organizations and entities as well as carrying out participatory, experimental, and practical traffic safety education which allow drivers on the expressway to inspect the place of driving in the wrong direction and examine the causes of occurrence or preventive measures.
YearCategory 2000 2001 2002 2003 2004 2005 2006 2007 2008 2009
Number of Accident(cases)
14,325 14,726 14,083 13,992 13,797 13,775 13,803 12,674 10,965 11,112
Fatalities(persons) 367 389 338 351 329 285 262 244 193 178Injuries(persons) 23,181 23,888 22,875 22,661 22,119 21,931 22,007 21,005 18,123 19,271
137
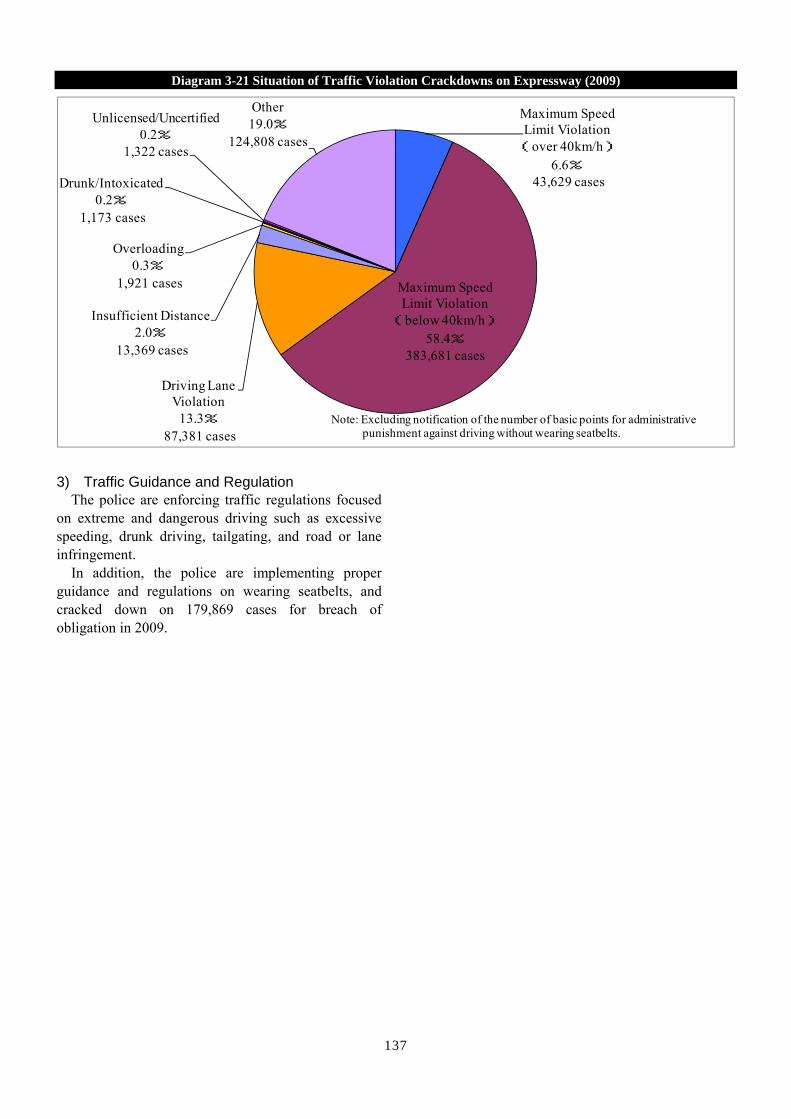
Diagram 3-21 Situation of Traffic Violation Crackdowns on Expressway (2009)
3) Traffic Guidance and Regulation
The police are enforcing traffic regulations focused on extreme and dangerous driving such as excessive speeding, drunk driving, tailgating, and road or lane infringement.
In addition, the police are implementing proper guidance and regulations on wearing seatbelts, and cracked down on 179,869 cases for breach of obligation in 2009.
Maximum Speed Limit Violation(over 40km/h)
6.6%43,629 cases
Maximum Speed Limit Violation(below 40km/h)
58.4%383,681 cases
Driving Lane Violation
13.3%87,381 cases
Insufficient Distance2.0%
13,369 cases
Overloading0.3%
1,921 cases
Drunk/Intoxicated0.2%
1,173 cases
Unlicensed/Uncertified0.2%
1,322 cases
Other19.0%
124,808 cases
Note: Excluding notification of the number of basic points for administrative punishment against driving without wearing seatbelts.

138
Section 5. Maintaining Road Traffic Order 1. Traffic Guidance and Regulation (1) Strengthening Measures against Vicious,
Dangerous, and Troublesome Driving The police are advancing traffic guidance and
control activities with mobility in the streets, working to prevent violations, and focusing their law enforcement activities on vicious, dangerous and troublesome driving such as driving without a license, driving while intoxicated, excessive speeding and ignoring traffic lights, etc., which directly leads to traffic accidents and for which regulations is highly requested by residents for their annoyance.
In 2009, the police crackdowns accounted for 8,345,760 cases of violations of the Road Traffic Act.
Diagram 3-22 Situation of Crackdowns on the Road Traffic Act Violations (2009)
Maximum speed limit viola tions
30.5%2,545,849
cases
Termpora ry stopping viola tions
14.3%1,194,391
casesTra ffic light viola tions
8.3%696,314 casesPedestrian
obstruction viola tions
0.8% 64,643 cases
Driving while intoxica ted/under the influence
0.5%41,801 cases
Driving without license0.4% 36,817
cases
Other45.1%
3,765,945 cases
(2) Pursuing Employer Responsibility
When enforcing regulations on driving under extreme fatigue, overloading, illegal parking, speeding, and other violations committed with vehicles used for a commercial purpose, as well as traffic accidents resulting from these violations, the police not only prosecute the driver, but also give the employer instructions or orders for the restricted use of the vehicle. Employers who have ordered or approved these violations1 are arrested and their involvement and responsibility are pursued.
Moreover, violations of regulations such as the Road Traffic Act committed by the drivers of vehicles used for commercial purposes such as taxi and trucking services are reported to the Transport Bureau and the
necessary administrative sanctions are advocated, in order to prevent accidents involving commercial vehicles.
Furthermore, the police are also enforcing regulations on crimes by companies which threaten traffic safety such as illegal vehicle remodeling by automobile manufacturers. Note 1: Includes users, safe driving supervisors and other persons
who directly manage the operation/driving of the vehicles. 2. Comprehensive Measures against
Motorcycle Gangs (Bosozoku) (1) Status and Trends in Bosozku Members
Although both the number of Bosozku members and the number of emergency 110 calls to the police related to Bosozku members have decreased compared with the previous year, the public’s demand for the improvement of measures against Bosozoku members remains strong.
There are two types of Bosozoku members: enthusiasts (who recklessly drive through the streets in groups making loud noises) and illegal racers (whose members compete in illegal driving skills such as rolling and drifting). As shown in Diagram 3-25, the illegal racers account for about 12.7% of the total and the most of Bosozoku members are categorized as enthusiasts. Moreover, up until now the majority of Bosozoku members consisted of minors but the ratio of adults has increased in the past few years to the point that they have now become the majority.
In addition, the Kyushakai was also formed, mainly composed of former and current Bosozoku members who amass old two-wheel motor vehicles refurbished in Bosozoku style and travel in large groups. They have been spotted traveling towards scenic areas and in a number of other areas.
Bosozoku members commit a wide range of crimes, from violating road traffic related regulations to Penal Code violations and drug abuse. There have been a number of cases of rivalry conflict between Bosozoku members and cases of attempted murder for citizens. Furthermore, some of these groups have been confirmed to be potential Boryokudan (yakuza syndicate) members.

139
Table 3-10 Trends in the Number of Bosozoku Members and Emergency Calls to the Police Related to
Bosozoku Members (2005-2009)
YearCategory
2005 2006 2007 2008 2009
Number of Motorcycle GangMembers1 (persons)
15,086 13,677 12,584 11,516 10,454
Number of Emergency Calls tothe Police related to MotorcycleGang (cases)
73,364 65,520 64,057 57,593 55,549
Note: Number of persons who are counted by police at the end of every year.
Diagram 3-23 Makeup of Bosozoku Members by Type (Enthusiasts/Illegal Racers) (2009)
Reckless group drivers / juveniles51.1%
Reckless group drivers / adults35.9%
Reckless group drivers / unclear0.3%
Illegal racers / juveniles
0.6%
Illegal racers / adults12.0%
Illegal racers / unclear0.1%
Table 3-11 Situation of Clearances by Law (2009)
Number of Arrests(persons)
29,534Joint Dangerous Act 2,405
2,165
Murder/burglary/arson, etc. 94
Obstruction of performance ofofficial duties
96
Violence/battery 309Unlawful Assembly with DangerousWeapons 6
Larceny 1,213Other 447
201270
32,170Arrests 2,931
OtherTotal
Category
Road Traffic Act
Penal Code
Road Trucking Vehicle Act
(2) Regulations on and other measures against Bosozoku Members in cooperation with related organizations
The traffic, juvenile and community police affairs divisions of the police are cooperating to dismantle Bosozoku groups and encouraging members to withdraw by advancing regulations by applying various laws, including arresting those involved in group risk activities at site.
Moreover, the police cooperate for the establishment and application of the Bosozoku Eradication Ordinance1 in local public entities. The police are also implementing comprehensive measures against Bosozoku members, such as sponsoring lectures to discourage memberships in Bosozoku members in junior high schools and high schools and encouraging withdrawal from these groups with the cooperation of families, schools and guardians. Note 1: Enacted in 24 prefectures and 155 cities and towns as of
the end of 2009, 3. Traffic Accident Investigation (1) Situation Regarding Traffic Accident
Investigations The number of cases cleared concerning traffic
accidents in 2009 is as follows.
Table 3-12 Situation of Cases Cleared of Occupational Negligence Resulting in Death or Injury(2009)
Category Driving negligenceresulting in injury
Drivingnegligence
resulting in death
Gross negligence andinjury by negligence
Gross negligenceresulting in death anddeath by negligence
Total
Cases 687,129 4,067 5,116 21 696,333
Note 1: Driving negligence resulting in injury indicates driving negligence resulting in injury or occupational negligence resulting in injury. 2: Driving negligence resulting in death indicates driving negligence resulting in death or occupational negligence resulting in death.
(2) Promotion of Appropriate Investigations of
Traffic Accidents Traffic Accident Investigation Instructors assigned
in Traffic Investigation Divisions at Tokyo Metropolitan Police Department and Prefectural Police Headquarters are providing on-the-spot guidance in cases including hit-and-run cases, or cases in which it is deemed a charge of dangerous driving resulting in death and injuries applicable, or it is difficult to acquire evidence other than the statements of the party involved one-sidedly among traffic accidents resulting in death and injuries. They are thus promoting systematic and focused investigation.
Furthermore, the police are working to ensure prompt initial investigation of hit-and-run cases and to

140
make prompt arrests of suspects by effectively employing traffic identification devices such as computer search systems for traces of evidence1. In 2009, the clearance rate for fatal hit-and-run accidents was 93.0%. Diagram 3-24 Trends in the Number of Offenses where
Dangerous Driving Resulting in Death and Injuries Apply (2002-2009)
268 237 232 227
319379
315 298
5471
38 52
60
55
3627
0
50
100
150
200
250
300
350
400
450
500
2002 2003 2004 2005 2006 2007 2008 2009
(cases)
(year)
Dangerous Driving Resulting in Death
Dangerous Driving Resulting in Injury
Diagram 3-25 Situation of Clearance of Cases of Charges of Dangerous Driving Resulting in Death or
Injuries (2009)
Ignoring Traffic46.8%Under the
Influence of Alcohol33.2%
Uncontrollable Speeding
7.1%
Under the Influence of
Drugs7.4%
Disturbance4.6%
Lack of Driving Skill0.9%
Note 1: A system which filters and identifies the model and other
information of a vehicle from pieces of a lens or from tire marks left behind at the scene of the hit-and-run.
(3) Scientific and Rational Traffic Accident
Investigations Taking up the opinions of citizens seeking precise,
scientific investigations of traffic accidents, the police are offering specialized education on the appraisal of traffic accidents that make use of crash experiment accident analysis in order to cultivate traffic investigators with sophisticated knowledge and skills.
Additionally in order to mitigate the burden of the involved parties and the early dissolution of traffic buildup by fast-tracking the handling of accidents, a
support system for each investigation, such as equipment that automatically records traffic accidents1, as well as a system which leaves out on-scene inspections of certain minor accidents, are being utilized. (4) Promotion of Assistance Considering the
Feelings of Traffic Accident Victims (Refer to P.177)
The police have been making continuous effort to ensure that appropriate victim support is carried out for victims and their bereaved families (herein after referred to as “victims”) under the “Basic Plan for the Victims of Crimes” formulated in December 2005. In addition to carrying out investigations while placing consideration to their requests and sentiments, the police inform the victims of hit-and-run cases and cases equivalent to dangerous driving resulting in death and injuries, fatal traffic accidents, or cases in which it takes three months or more after accidents for the recovery of such information as the outline of the accident, the progress of investigation, and the status of arrests of suspects in line with the “Guidelines for Contact with Victims”2 from early stages of investigation.
Several other efforts include the creation and distribution of different types of the “Booklet for Victims” in which detailed explanation was added on the operating procedure for liaison to the victims, criminal procedures and compensation systems to victims, differing in contents by characteristics of the accidents and needs, and “Leaflets to be handed out at accident sites” which introduces various consultation offices.
Moreover, since April 2008, other than assigning Traffic Accident Investigation Instructors in Traffic Investigation Divisions at Tokyo Metropolitan Police Headquarters and Prefectural Police Headquarters, as well as securing systematic and unified liaison measures with the victims, education and training to those traffic accident investigators are being strengthened so as to assert adequate responses by considering the feelings of the victims. Note 1: A device which reacts to collision sounds and slip sounds
of traffic accidents, and records the situation of the moment before and after the accident
2: In order to assure the positive implementation of reporting of the investigation situation to the victims of hit-and-run and other cases, it was enacted in 1996 and has set the incidents to be covered and the contents of reporting.