Embed Size (px)
Citation preview
CompRef8 / Applied SAP BI 7.0 Web Reports / Peter Jones / 026-6
9Integration of SAP
BusinessObjects Components into the BI Environment
This chapter discusses the current and future components of the BI reporting frontend. The current BI reporting tools have been around for 10–12 years in one shape or form. A significant leap in functionality occurred from the 2.x version to the 3.x version in
both the BEx Analyzer and the BEx Web Analyzer. Another significant jump in functionality occurred from the 3.x version to the 7.0 version, including improvements in documentation, Web reporting, formatted reporting, BI portal integration, Excel integration with the BEx Analyzer, the use of distribution methods for reports, and authorizations.
The next phase in SAP technology evolution is the integration of the BI NW Reporting components with the BusinessObjects (BOBJ) components. This is a similar process that we went through for the Planning and Consolidations process where we started out with SEM-BPS (Strategic Enterprise Management-Business Planning and Simulation) and moved to BI-IP (Business Intelligence-Integrated Planning), then we moved to BPC (Business Planning and Consolidation), which was an integration of the old OutlookSoft software. So, we are going through integration between the components of BI that are very familiar to us and the components of BOBJ that we need to get comfortable with and familiarize ourselves with as soon as possible. These components consist of the combination of Business Objects (BOBJ) and the SAP Business Intelligence and its platform (NetWeaver). If I look at the actual components we will be discussing they are the BusinessObjects Web Intelligence (WebI), Crystal Reports, BusinessObjects Xcelsius, and the BusinessObjects Explorer. These are the current official naming conventions for each. This integration has been going on for awhile now and we are definitely well into the integration of each of these components directly onto the NetWeaver platform that we are all very used to at this point. As with all new components we will be experiencing some growing pains on the way but shortly all of these frontend reporting options will be fully integrated into the SAP BW or BI platform.
463
CHAPTER
ch09.indd 463 2/24/10 5:08:50 PM
CompRef8 / Applied SAP BI 7.0 Web Reports / Peter Jones / 026-6
464 A p p l i e d S A P B I 7 . 0 W e b R e p o r t s 464 A p p l i e d S A P B I 7 . 0 W e b R e p o r t s
NOTE At the current time the SAP BusinessObjects components listed here are the SAP standard. In the near future the addition of the SAP BusinessObjects component Pioneer will be used for an Excel-based reporting component. At the time of this publication the recommendation from SAP is to use the BEx Analyzer for Excel-based reporting requirements.
This chapter is intended as an overview of the BOBJ components. It does not provide details about the configuration or design of reports or dashboards, but instead gives you a feel for the functionality, positioning, and features of each component. When you do decide to move forward with the BOBJ components, the overview provided in this chapter should make the detailed configuration easier.
Overview of the Integration and Positioning ProcessThe entire group of BusinessObjects frontend tools is currently called the SAP BusinessObjects portfolio (or BOBJ for short). This group includes the SAP BusinessObjects Explorer (formerly SAP BusinessObjects Polestar), SAP BusinessObjects Web Intelligence (WebI), SAP BusinessObjects Xcelsius, and Crystal Reports. These naming conventions are subject to change as SAP makes adjustments to the functionality or repositions certain tools.
With any new functionality in the SAP space, our first concern is how the changes affect our road map and strategies moving forward with the overall SAP process. With all the new frontend components, figuring out what component does what and where the overlaps in functionality exist is a bit of a challenge. But the big question in most shifts such as this, where an entire reporting frontend is shifted from the BEx approach to the BusinessObjects approach, is why? In this case, the question has a number of answers, and we will discuss a few from the system and business user point of view.
With the acquisition of Business Objects in 2007, SAP has made a shift that combines best-in-class business and industry applications with best-in-class solutions for business users. To integrate these two components, SAP Business Suite and the SAP BusinessObjects solutions, SAP has used the NetWeaver Business Warehouse (BW) Enterprise Data Warehouse (EDW) platform. For customers that have invested in BW, this has been considered the fundamental building block for their enterprise business intelligence (BI) capabilities. This gives the business users access to additional capabilities and tools that will allow them to extend and deliver business intelligence to almost any part of the organization. As in many cases with new functionality and toolsets, some companies have had little or no exposure to the new BOBJ components and need guidance and assistance for integrating the “new” products into their existing NetWeaver and BW landscape and also understanding of the going forward road map for SAP integration.
Two primary cases need to be addressed when planning an implementation of BusinessObjects solutions as an additional reporting component to the BW system. The first is the case where a new implementation of BW 7.0 is being deployed, or an older version of BW is being upgraded. At the simplest level, the migration of key business functionality from current systems and platforms to BW 7.0 makes maintaining the status quo with regard to BI capabilities a challenging process because current interfaces will begin to change as data moves over time from existing platforms to BW 7.0. Existing data extraction and loading processes, report templates, and most every other facet of the current reporting and analytical capabilities throughout the enterprise will likely require maintenance on functionality at some point during the rollout or migration. Beyond the simple “the
ch09.indd 464 2/24/10 5:08:50 PM
C h a p t e r 9 : I n t e g r a t i o n o f S A P B u s i n e s s O b j e c t s 465
CompRef8 / Applied SAP BI 7.0 Web Reports / Peter Jones / 026-6
C h a p t e r 9 : I n t e g r a t i o n o f S A P B u s i n e s s O b j e c t s 465
interfaces will change” argument, however, a widely accepted best practice for ECC (and by extension, BW) rollouts is that organizations should not simply re-create their respective existing collections of reports to accompany the new environment but instead—even taking risk and complexity factors into consideration—any ECC and BW implementations should be viewed as an opportunity to rationalize the end-to-end BI framework and adopt an updated approach to reporting and analytics; one guided by the increasing need for timely, actionable, high-value insights for decision making and in support of work processes and operational reporting.
In the case of a BW implementation, BW or BI typically provides the catalyst for the organization to review its BI process and build on and deploy a new generation of BI capabilities. In most cases, the implementation will touch all corners of the enterprise. Further, by design, BW is architected around multiple components to achieve the best possible balance between uniformity, consistency, and flexibility, with individual business units or functional areas given a certain degree of flexibility to tailor the information and system to their particular business needs. This multiple-component approach is widely recognized as a best practice to serve multiple business groups and users across a large, complex enterprise; not only in the transactional realm, but also in the informational and analytical realms and concepts. The point is that although there are always multiple approaches that could be implemented for customers, a key factor to defining the overall strategy is the need to support multiple business user groups across the company. As the saying goes, information, and therefore BI, is one of the most critical factors in the success of your company and growth in this economic environment.
Another closely related principle to the preceding ones is the necessity to follow sound migration practices as the current “as-is” state slowly evolves to the future “should-be” end state. Migration best practices often involve components such as interim bridges and “reverse bridges” between legacy and new components; the “sprucing up” of existing components that—even though they will eventually disappear—need to be enhanced for a short duration to support iterative migration; and thorough integration and interface testing. In many cases, this “short period of time for support” turns into years of effort and needs to be looked at in this light. The business needs to develop a road map and work to be as consistent and practical as possible, but there are some situations that come up that will not allow the business to follow that particular road map. A case in point is the current (2008–2010) economic environment, in which many companies have had to redirect their attention to other, more critical issues in terms of driving sales and growth simply to survive. So, the BI process and projects are then moved from six months to two years in scoping and if these bridges for the current/future view of the reporting strategy are not consistent throughout your company, you will be dealing with other survival issues including the ability to generate useable reports.
One of the points I made in the migration chapter (Chapter 8) is that you look at new functionality and components with an eye on how this will support our company and not jump from the frying pan into the fire by just adding an additional layer of reporting components to a system that may need some help and is possible broken. It looks great for a time but the issues are still there, just the reports look better and more dynamic. But the underlying data and consistency issues are still there. So, an enterprise’s pursuit of a new era of business intelligence and the resulting timely, actionable, high-value business insight should take advantage of leading-edge core technologies and products but at the same time, the mission-critical nature of what business intelligence should be necessitates being careful
ch09.indd 465 2/24/10 5:08:50 PM
CompRef8 / Applied SAP BI 7.0 Web Reports / Peter Jones / 026-6
466 A p p l i e d S A P B I 7 . 0 W e b R e p o r t s 466 A p p l i e d S A P B I 7 . 0 W e b R e p o r t s
and methodical when implementing leading-edge BI products, components, and capabilities, as well as their associated architectures.
BI strategy and architecture teams have a duty to look critically at selected core technologies, products, product families, and architectural frameworks to develop an overall BI architecture and BI road map that is heavily driven by existing, proven technologies and at the same time can support and architecturally evolve toward technologies that are in the pipeline. Most importantly, the teams should be looking to match technologies and products with the BI strategy and documented needs from the business users and community. For example, if it is found that most business processes and analytic needs can easily be satisfied now and in the future by batch-oriented data, the BI strategy and architecture teams should not recommend that real-time data flows dominate the BI architecture. Basically, the recommended solutions should be neither over-architected nor under-architected with regard to likely current and future business needs and requirements.
“Business intelligence” means different things to different people and in a very similar way the concept of a “dashboard” has evolved—locking down a definition of a dashboard is as difficult as getting one definition for business intelligence. All of us have come to understand it in different ways, and we have been witness to customers where we only discovered well into the meeting that when we used the phrase “BI,” one group was talking about a particular product, whereas another group was talking about it in terms of a concept or knowledge area. If such confused conversations are taking place even among business users or groups in the same company, implementers should be very aware of the likelihood that both our customers and other members of the project team have had no prior exposure to the SAP BusinessObjects solutions, and how we have conceptualized business intelligence.
Components of SAP BusinessObjects (BOBJ) for ReportingI have found that during the process of getting acquainted with the numerous components of BOBJ that I was having difficulty understanding where each one fits. I’m sure it was the same issues that I faced with BI before but I’m guessing that the confusion was so long ago that I forget that there was any. So I initially needed to understand where each one of the components fits into the landscape before we can start to understand the functionality, flexibility, and configuration of each. As we mentioned, we will be looking at each of these components at a very high level and even though the configuration of the required source of data to each of these is critical, we will not be looking at items such as Universes or Data Federator in SAP BusinessObjects. Yes, these are critical and in most cases required before we can build any of the reports from tools such as Web Intelligence or Xcelsius but the development and process of configuring a BusinessObjects Universe is for another book. As a matter of fact, and you are probably tired of me pointing this out, but the configuration and development of the full set of these BusinessObjects reporting components would definitely fill another book. So, we need to align each of these components based on their functionality and use, and then discuss some additional basic information around each component.
What we want to avoid, and what is the underlying point from the previous discussion, is that the implementers of the BOBJ project should be aware that they may be in a BI “green field,” and it can be useful to schedule a meeting with various stakeholders to discuss some common terms and approaches. The last thing anyone wants is to find out deep in the project
ch09.indd 466 2/24/10 5:08:51 PM
C h a p t e r 9 : I n t e g r a t i o n o f S A P B u s i n e s s O b j e c t s 467
CompRef8 / Applied SAP BI 7.0 Web Reports / Peter Jones / 026-6
C h a p t e r 9 : I n t e g r a t i o n o f S A P B u s i n e s s O b j e c t s 467
that the customer “didn’t know what they signed up for” or “didn’t understand what it was we were going to deliver.” These discussions should be a fact-finding process and a development of a practical BI approach. There are other aspects of the project that a meeting of this nature would benefit and allow everyone to flush out questions that may not have been considered by the stakeholders such as basic project type activities and milestones.
• Define report requirements Discuss the requirements gathering process. Instead of asking general questions such as “Which reports do you want, and what should be in them?” ask specific questions such as “What are you trying to achieve?” and “What are your business goals?”
• Explore ad hoc querying This may be an entirely new concept to some customers, and universes (semantic layer for the sources of data for the BOBJ-BI components) that are made available for such ad hoc activity should be designed with the end-users in mind. The universes should be easy to use and should cover a particular business process.
• Discuss security Many times the customer is only thinking about data security, which is governed by existing roles and security inside BW. However, none of that covers which universes and reports are visible to which users and groups, or which rights a user has in the InfoView portal (component used for business user viewing of reports, very similar to the BI portal) and what actions they can and cannot perform. This could mean ad hoc querying, as opposed to only viewing or refreshing reports, but would also include the ability to export report contents or schedule particular reports for their own business area or department.
• Plan scheduling and report distribution Most customers have not yet considered this in detail, so as the consultant, you need to be able to articulate what the options are and how scheduling may help reduce the load on BW during peak hours if a lot of users need to access the same report and information. Not every report has to be run interactively, which is a key point to make with customers.
• Discuss report design and visualization (including dashboards) Many things are possible, but the selected approach should be what is best for appropriate information delivery in the given use case. On the other hand, those who are most comfortable in BEx might need additional time with all the different possibilities and options available in BOBJ. You should have a comprehensive discussion about what makes sense in report design, which metrics comprise good items to display on dashboards, and which ones do not. Again, this means that dashboard and report design needs to line up with business goals—a novel idea but one that seems to escape many developers as they go through the process of developing these busy dashboards.
All of these points are still quite tactical. However, they will help to set the stage for the project, and in many cases the customers will not understand what they are getting until they see the first reports and dashboards, a point at which it is probably too late to make substantial changes. You can mitigate this risk with an upfront rapid scoping session and/or a pilot implementation. The advantage to this approach is that, fundamentally, it tends to be business focused rather than IT focused, and it aligns with a simpler implementation. Realize, though, that “fudged” demos on static data can leave customers with an impression
ch09.indd 467 2/24/10 5:08:51 PM
CompRef8 / Applied SAP BI 7.0 Web Reports / Peter Jones / 026-6
468 A p p l i e d S A P B I 7 . 0 W e b R e p o r t s 468 A p p l i e d S A P B I 7 . 0 W e b R e p o r t s
that the complete implemented solution will be more responsive and faster than is realistic. Nevertheless, it can certainly help to provide the customer with a hands-on visualization of what things will look like in a full implementation.
In all cases, there should be a point to doing business intelligence, just as there was a reason for a customer to invest substantially in products and services to put a BI framework in place. That is, BI should be part of a larger business strategy to enable more efficient, consistent, and targeted use of information assets captured in the SAP systems, legacy systems, and other relevant business data. A lot of reporting is very tactical, whether it is operational reporting or regulatory and from an industry perspective, that is not really considered “Business Intelligence,” but rather a simple representation of only its most basic components. We need to move the corporation to the next level, which is to encourage further analysis and provide ad hoc querying capabilities beyond a set of standard reports. Ideally, though, a BI strategy ties such analysis in with existing or new business processes, where BI plays a role both in discovery (Q&A) and monitoring the effect of policies and business initiatives.
Most customers will have some sort of BI strategy defined. Even exclusively operational reporting will have a thought behind it. In many cases it is directly related to a business initiative that is very specific, while in other cases it may be a desire to really change the organization and its business processes. It may not be always highly sophisticated, and if that is the case, you should help refine it further and propose a solution based on experience, as well as the customer’s business needs. Recognize that customer resources will usually have done their research, but may misrepresent certain product features or misunderstand concepts that are very familiar to experienced consultants, so always clarify what they mean with what they say.
Formulate the strategy and seek approval from the customer. Where possible, try to get buy-in for a Business Intelligence Competency Center (BICC) to make sure there is a group that functions as a guardian of the BI solutions and applications post-implementation. The BICC members should not only drive best practices and system governance, but also ensure that the actual implementation aligns with the BI strategy. The BICC over time should help refine the strategy and drive it to ever further sophistication. We have all seen this process go astray with all of the other system-specific activities around the go-live and the post-go-live processes including critical issues with performance, business user additional needs, or just running out of budget or time but please look to drive this effort so that the BW system and the BI concepts can continue to proactively impact the corporation. We have to keep in mind the critical position of information within our corporations.
It is very important that you educate the business user or your customer on using the right tool for the right job, as the wrong choice is more likely to lead to implementations that fall short of the initial success criteria. You will have to manage not only which tool is more appropriate, but also the expectations with the customer, and what current product capabilities need to be considered when guiding the tool choice. Even if the right choice is made, diverging expectations or lack of support for certain features may still lead to problematic implementations. It is also clear, and this is the normal process with all new products, that a number of product changes have been, or are in the process of being enhanced, so all of these elements need to be taken into account when deciding on the right tool for the job at hand. The SAP BusinessObjects components have some well-established guidelines on selecting tools based on both the existing customer landscape and business user information or what SAP calls a “use case scenario.” In the process of analyzing the various categories of issues reported by the companies and business users—apart from identified certain product issues—the analysis shows some classifications that clearly indicate incorrect tool choices, which lead to misaligned expectations of the solution.
ch09.indd 468 2/24/10 5:08:51 PM
C h a p t e r 9 : I n t e g r a t i o n o f S A P B u s i n e s s O b j e c t s 469
CompRef8 / Applied SAP BI 7.0 Web Reports / Peter Jones / 026-6
C h a p t e r 9 : I n t e g r a t i o n o f S A P B u s i n e s s O b j e c t s 469
Choosing the Right Tool for the Right JobNow we can look at the different tools within this set to see what works where, so that we can identify and recommend the appropriate tool for the job. With the SAP BusinessObjects suite of BI solutions, several options enable organizations to bring BI to all business users. With the current components available, we have a bit of a mix in toolsets—most with a significant background with BusinessObjects and one aligned with the SAP BI reporting component and this group of reporting components will be the best business practice approach until the development of SAP BusinessObjects Pioneer product is available. These reporting options are
• BusinessObjects Explorer
• BusinessObjects Web Intelligence
• BEx Analyzer (Web and Excel)/Voyager/Pioneer
• Crystal Reports
• Xcelsius
As mentioned in the last section, SAP takes a use case–driven approach to determine which products are best to use for each business requirement, and then recommends that other consultants and businesses take a similar approach. When looking at the existing BW footprint at SAP customers, the following are the general guidelines for what constitutes the right tool for the right job:
• For information exploration where BW is in place, SAP BusinessObjects Explorer NetWeaver Version (that is, SAP BusinessObjects Polestar + SAP BW Accelerator) is the tool of choice.
• For casual, ad hoc reporting and analysis and general interactive reporting where BW is in place, Web Intelligence with OLAP universes is the first choice.
• For OLAP analysis where BW is in place, the BEx Analyzer (Web and Excel) client remains the tool of choice until the availability of the SAP BusinessObjects Pioneer. Voyager was the BusinessObjects component that was similar to the BEx Analyzer but should really not be concerned as an alternative. In the future, the preferred solutions for OLAP analysis will be based on the Pioneer project as a replacement for BEx Analyzer and Voyager.
• For formatted or production reporting from either BW or directly from ERP (ECC), Crystal Reports is the tool of choice.
• For dashboarding and visualization where BW is in place, the choice would be a combination of Xcelsius with Query as a Web Service (QaaWS) or LiveOffice as a connection layer.
As part of the requirements gathering in project preparation, it is strongly recommended to apply use cases to each of the requirements. That is, by not only capturing what the business needs are and how we plan to address them (as part of the project), but also including how reports and dashboards are delivered and consumed, we discover how end users will use the information that is provided to them. With this process in place it will help us further understand the nature of the requirements and functionality each business user needs. This will also help us determine which tool to use, as well as help us with our
ch09.indd 469 2/24/10 5:08:52 PM
CompRef8 / Applied SAP BI 7.0 Web Reports / Peter Jones / 026-6
470 A p p l i e d S A P B I 7 . 0 W e b R e p o r t s 470 A p p l i e d S A P B I 7 . 0 W e b R e p o r t s
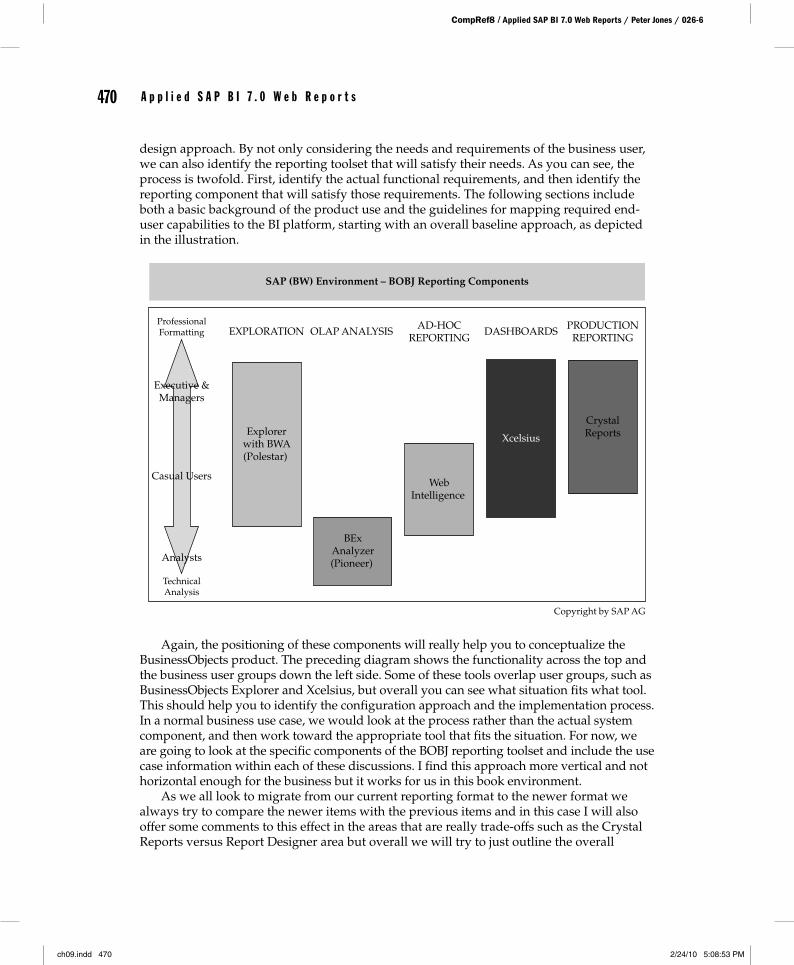
design approach. By not only considering the needs and requirements of the business user, we can also identify the reporting toolset that will satisfy their needs. As you can see, the process is twofold. First, identify the actual functional requirements, and then identify the reporting component that will satisfy those requirements. The following sections include both a basic background of the product use and the guidelines for mapping required end-user capabilities to the BI platform, starting with an overall baseline approach, as depicted in the illustration.
Again, the positioning of these components will really help you to conceptualize the BusinessObjects product. The preceding diagram shows the functionality across the top and the business user groups down the left side. Some of these tools overlap user groups, such as BusinessObjects Explorer and Xcelsius, but overall you can see what situation fits what tool. This should help you to identify the configuration approach and the implementation process. In a normal business use case, we would look at the process rather than the actual system component, and then work toward the appropriate tool that fits the situation. For now, we are going to look at the specific components of the BOBJ reporting toolset and include the use case information within each of these discussions. I find this approach more vertical and not horizontal enough for the business but it works for us in this book environment.
As we all look to migrate from our current reporting format to the newer format we always try to compare the newer items with the previous items and in this case I will also offer some comments to this effect in the areas that are really trade-offs such as the Crystal Reports versus Report Designer area but overall we will try to just outline the overall
Copyright by SAP AG
Analysts
Casual Users
Executive &Managers
PRODUCTIONREPORTING
DASHBOARDSAD-HOCREPORTING
OLAP ANALYSIS EXPLORATION
SAP (BW) Environment – BOBJ Reporting Components
Explorerwith BWA(Polestar)
WebIntelligence
Xcelsius
CrystalReports
BExAnalyzer(Pioneer)
ProfessionalFormatting
TechnicalAnalysis
ch09.indd 470 2/24/10 5:08:53 PM
C h a p t e r 9 : I n t e g r a t i o n o f S A P B u s i n e s s O b j e c t s 471
CompRef8 / Applied SAP BI 7.0 Web Reports / Peter Jones / 026-6
C h a p t e r 9 : I n t e g r a t i o n o f S A P B u s i n e s s O b j e c t s 471
functionality. Also, in this case attempting to match reporting component to reporting component would be inconsistent with the approach that the business should take in terms of identifying the correct reporting functionality. Each should be viewed on their own value and functionality to the business. Now you can see that getting into too much detail would take us into another completely different avenue and the chapter would end up being twice the size. Just the configuration alone of the WebI would take about 200 pages to describe in detail and we haven’t really even talked about the User Interface, which in this case is the InfoView. So the discussion will be high level and brushing over the functionality. As we always say, the devil is in the details, so using this section as an initial very general discussion of each component and then using other more detailed documentation to understand all of the complexities is a prudent approach.
Web Intelligence (WebI)The Web Intelligence reporting toolset is one of the more recognized components of the BOBJ group. This section highlights the features of the WebI reporting tool and also gets into some of the configuration details. Now, remember, having a new reporting component will not mean that we are going to reinvent the wheel but using another toolset—BOBJ—rather than the SAP BI, we will be able to offer all of the same functionality plus some additional bells and whistles. So, as we go through this process, we will see some very similar activities that we’ve seen with the WAD or the BEx Web Analyzer. Just that they will possibly use different terminology and access them in a different manner.
In this case, we’ll look at some additional details of the integration between the NetWeaver BW system and the BOBJ frontend toolsets, just to give you a general sense of how it works. In general, the Web Intelligence component has two main connectivity options for BW:
• OLAP universes
• Relational universes via SAP BusinessObjects Data Federator
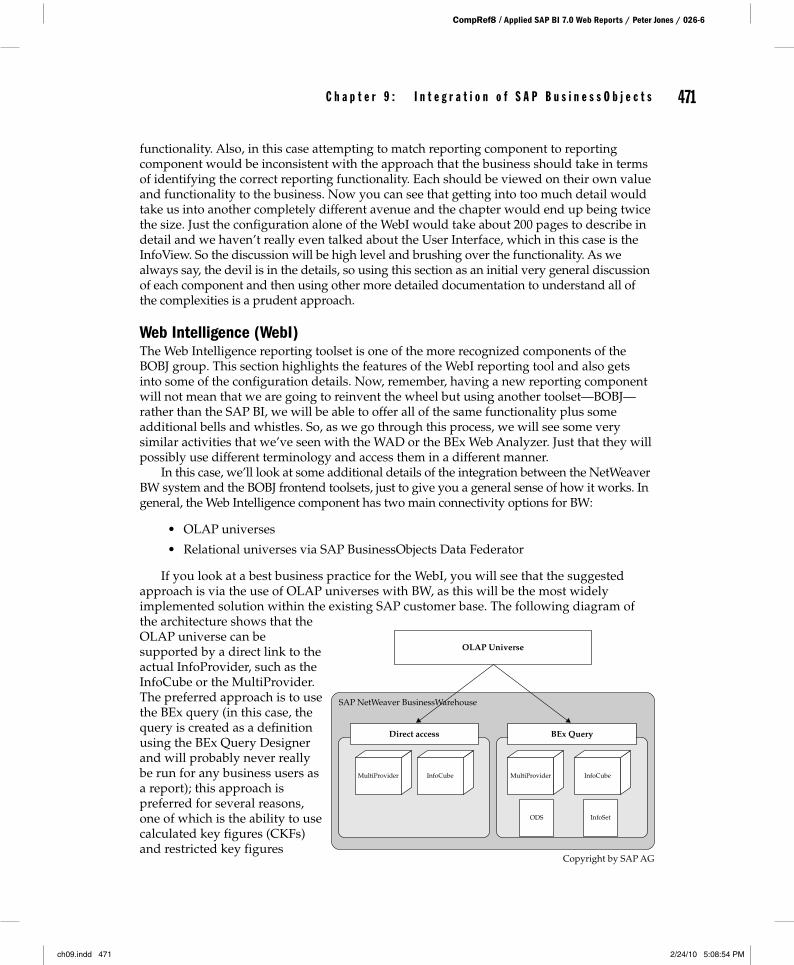
If you look at a best business practice for the WebI, you will see that the suggested approach is via the use of OLAP universes with BW, as this will be the most widely implemented solution within the existing SAP customer base. The following diagram of the architecture shows that the OLAP universe can be supported by a direct link to the actual InfoProvider, such as the InfoCube or the MultiProvider. The preferred approach is to use the BEx query (in this case, the query is created as a definition using the BEx Query Designer and will probably never really be run for any business users as a report); this approach is preferred for several reasons, one of which is the ability to use calculated key figures (CKFs) and restricted key figures
Copyright by SAP AG
SAP NetWeaver BusinessWarehouse
OLAP Universe
MultiProvider
ODS InfoSet
InfoCube
BEx Query
MultiProvider InfoCube
Direct access
ch09.indd 471 2/24/10 5:08:54 PM
CompRef8 / Applied SAP BI 7.0 Web Reports / Peter Jones / 026-6
472 A p p l i e d S A P B I 7 . 0 W e b R e p o r t s 472 A p p l i e d S A P B I 7 . 0 W e b R e p o r t s
(RKFs) that are created in the query definition. Since these are not found in the Infocube, the direct access method would not have access to these formulas.
Note the differences between the InfoProviders that can be directly linked to the OLAP universe and the ones that can be accessed via the BEx query. After the linkage between the two systems is complete, you need to understand what the mapping process is for the different objects within the BEx query. Table 9-1 shows a list of BW query elements and how they are used in an OLAP universe.
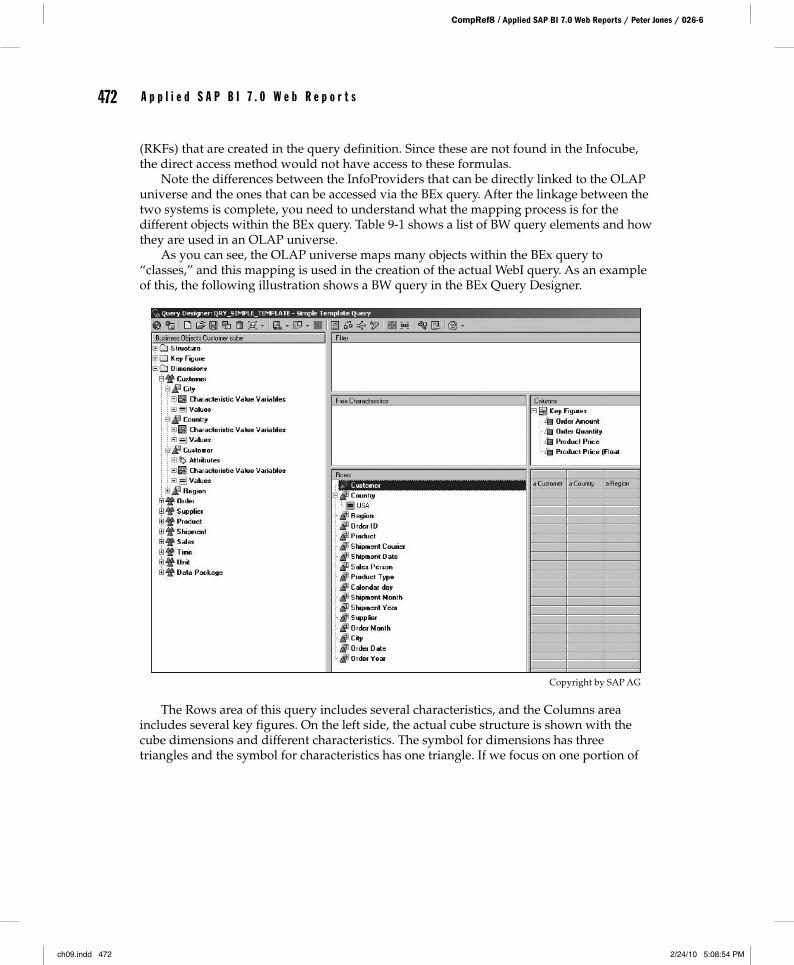
As you can see, the OLAP universe maps many objects within the BEx query to “classes,” and this mapping is used in the creation of the actual WebI query. As an example of this, the following illustration shows a BW query in the BEx Query Designer.
Copyright by SAP AG
The Rows area of this query includes several characteristics, and the Columns area includes several key figures. On the left side, the actual cube structure is shown with the cube dimensions and different characteristics. The symbol for dimensions has three triangles and the symbol for characteristics has one triangle. If we focus on one portion of
ch09.indd 472 2/24/10 5:08:54 PM
C h a p t e r 9 : I n t e g r a t i o n o f S A P B u s i n e s s O b j e c t s 473
CompRef8 / Applied SAP BI 7.0 Web Reports / Peter Jones / 026-6
C h a p t e r 9 : I n t e g r a t i o n o f S A P B u s i n e s s O b j e c t s 473
this query, we see the characteristics, dimensions, and variables for the customer dimension, shown in the following illustration.
Copyright by SAP AG
In the next illustration, you can see what happens to these objects when translated or mapped into the OLAP universe. The dimension is Customer (technical name Z_BOBJ1) and
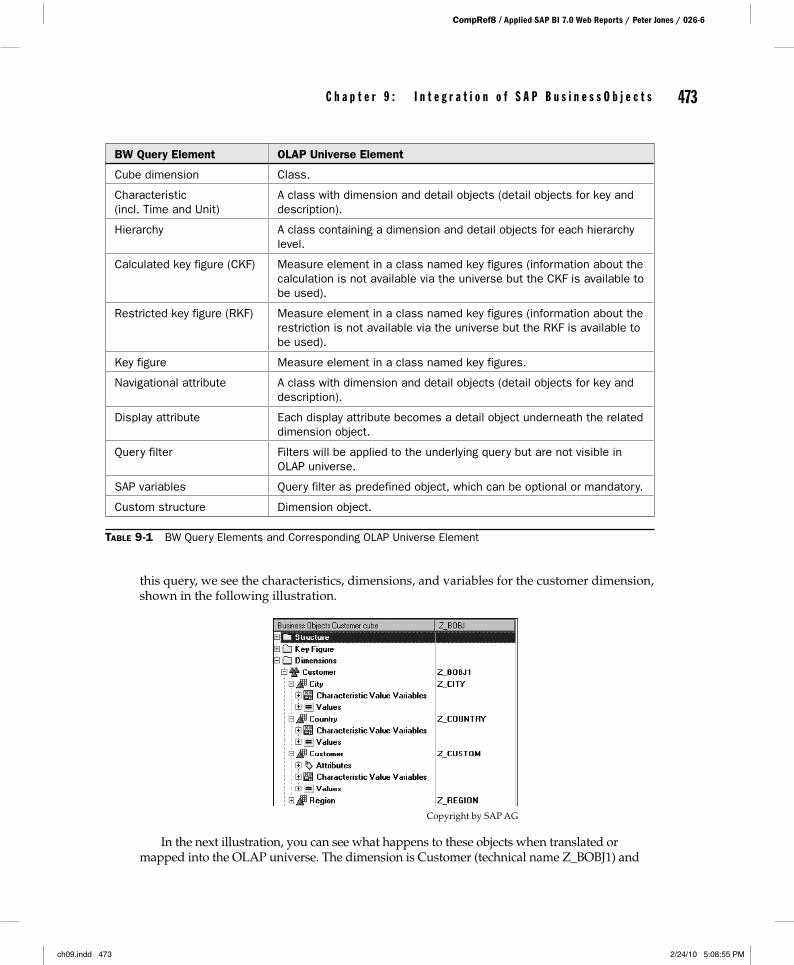
BW Query Element OLAP Universe Element
Cube dimension Class.
Characteristic (incl. Time and Unit)
A class with dimension and detail objects (detail objects for key and description).
Hierarchy A class containing a dimension and detail objects for each hierarchy level.
Calculated key figure (CKF) Measure element in a class named key figures (information about the calculation is not available via the universe but the CKF is available to be used).
Restricted key figure (RKF) Measure element in a class named key figures (information about the restriction is not available via the universe but the RKF is available to be used).
Key figure Measure element in a class named key figures.
Navigational attribute A class with dimension and detail objects (detail objects for key and description).
Display attribute Each display attribute becomes a detail object underneath the related dimension object.
Query filter Filters will be applied to the underlying query but are not visible in OLAP universe.
SAP variables Query filter as predefined object, which can be optional or mandatory.
Custom structure Dimension object.
TABLE 9-1 BW Query Elements and Corresponding OLAP Universe Element
ch09.indd 473 2/24/10 5:08:55 PM
CompRef8 / Applied SAP BI 7.0 Web Reports / Peter Jones / 026-6
474 A p p l i e d S A P B I 7 . 0 W e b R e p o r t s 474 A p p l i e d S A P B I 7 . 0 W e b R e p o r t s
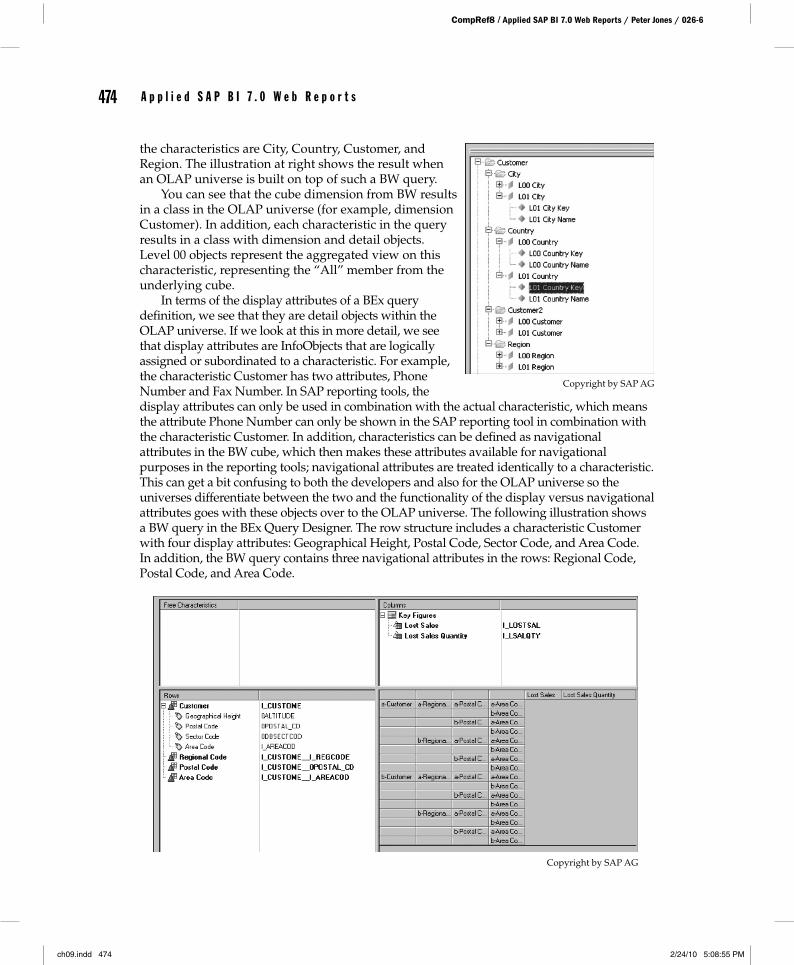
the characteristics are City, Country, Customer, and Region. The illustration at right shows the result when an OLAP universe is built on top of such a BW query.
You can see that the cube dimension from BW results in a class in the OLAP universe (for example, dimension Customer). In addition, each characteristic in the query results in a class with dimension and detail objects. Level 00 objects represent the aggregated view on this characteristic, representing the “All” member from the underlying cube.
In terms of the display attributes of a BEx query definition, we see that they are detail objects within the OLAP universe. If we look at this in more detail, we see that display attributes are InfoObjects that are logically assigned or subordinated to a characteristic. For example, the characteristic Customer has two attributes, Phone Number and Fax Number. In SAP reporting tools, the display attributes can only be used in combination with the actual characteristic, which means the attribute Phone Number can only be shown in the SAP reporting tool in combination with the characteristic Customer. In addition, characteristics can be defined as navigational attributes in the BW cube, which then makes these attributes available for navigational purposes in the reporting tools; navigational attributes are treated identically to a characteristic. This can get a bit confusing to both the developers and also for the OLAP universe so the universes differentiate between the two and the functionality of the display versus navigational attributes goes with these objects over to the OLAP universe. The following illustration shows a BW query in the BEx Query Designer. The row structure includes a characteristic Customer with four display attributes: Geographical Height, Postal Code, Sector Code, and Area Code. In addition, the BW query contains three navigational attributes in the rows: Regional Code, Postal Code, and Area Code.
Copyright by SAP AG
Copyright by SAP AG
ch09.indd 474 2/24/10 5:08:55 PM
C h a p t e r 9 : I n t e g r a t i o n o f S A P B u s i n e s s O b j e c t s 475
CompRef8 / Applied SAP BI 7.0 Web Reports / Peter Jones / 026-6
C h a p t e r 9 : I n t e g r a t i o n o f S A P B u s i n e s s O b j e c t s 475
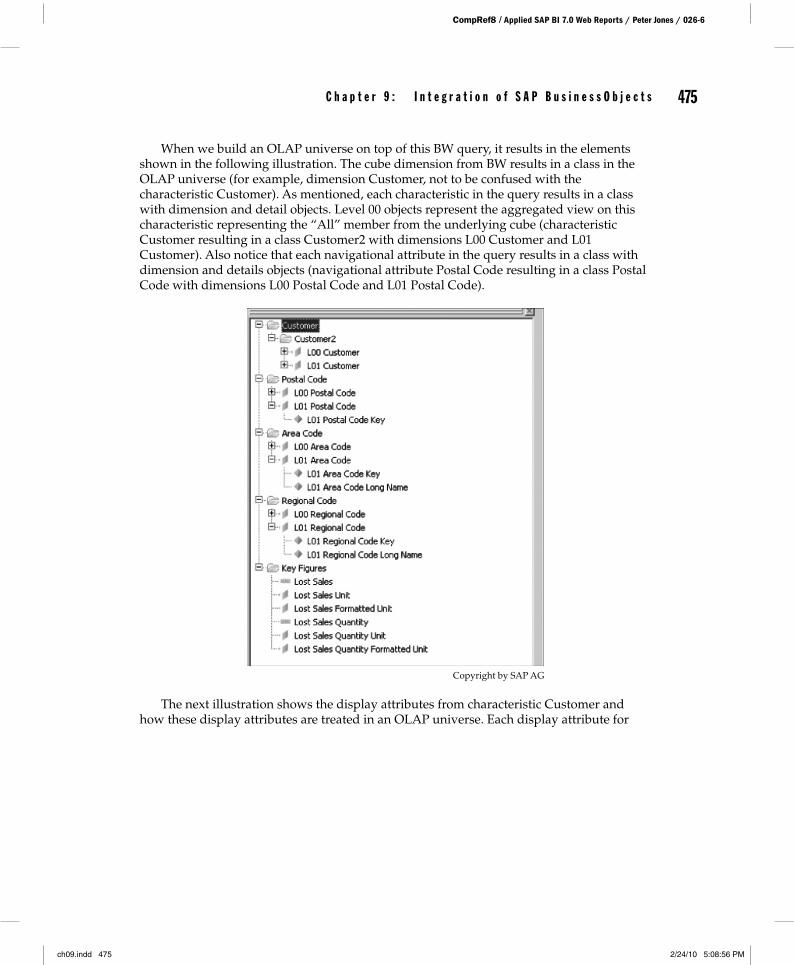
When we build an OLAP universe on top of this BW query, it results in the elements shown in the following illustration. The cube dimension from BW results in a class in the OLAP universe (for example, dimension Customer, not to be confused with the characteristic Customer). As mentioned, each characteristic in the query results in a class with dimension and detail objects. Level 00 objects represent the aggregated view on this characteristic representing the “All” member from the underlying cube (characteristic Customer resulting in a class Customer2 with dimensions L00 Customer and L01 Customer). Also notice that each navigational attribute in the query results in a class with dimension and details objects (navigational attribute Postal Code resulting in a class Postal Code with dimensions L00 Postal Code and L01 Postal Code).
Copyright by SAP AG
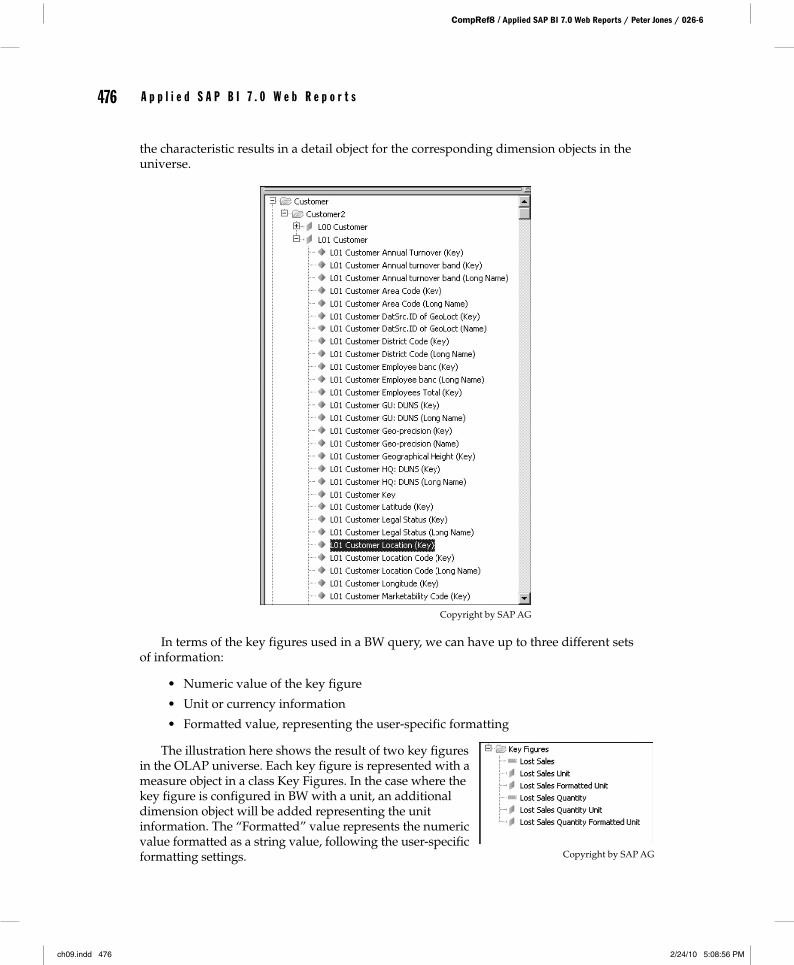
The next illustration shows the display attributes from characteristic Customer and how these display attributes are treated in an OLAP universe. Each display attribute for
ch09.indd 475 2/24/10 5:08:56 PM
CompRef8 / Applied SAP BI 7.0 Web Reports / Peter Jones / 026-6
476 A p p l i e d S A P B I 7 . 0 W e b R e p o r t s 476 A p p l i e d S A P B I 7 . 0 W e b R e p o r t s
the characteristic results in a detail object for the corresponding dimension objects in the universe.
Copyright by SAP AG
In terms of the key figures used in a BW query, we can have up to three different sets of information:
• Numeric value of the key figure
• Unit or currency information
• Formatted value, representing the user-specific formatting
The illustration here shows the result of two key figures in the OLAP universe. Each key figure is represented with a measure object in a class Key Figures. In the case where the key figure is configured in BW with a unit, an additional dimension object will be added representing the unit information. The “Formatted” value represents the numeric value formatted as a string value, following the user-specific formatting settings. Copyright by SAP AG
ch09.indd 476 2/24/10 5:08:56 PM
C h a p t e r 9 : I n t e g r a t i o n o f S A P B u s i n e s s O b j e c t s 477
CompRef8 / Applied SAP BI 7.0 Web Reports / Peter Jones / 026-6
C h a p t e r 9 : I n t e g r a t i o n o f S A P B u s i n e s s O b j e c t s 477
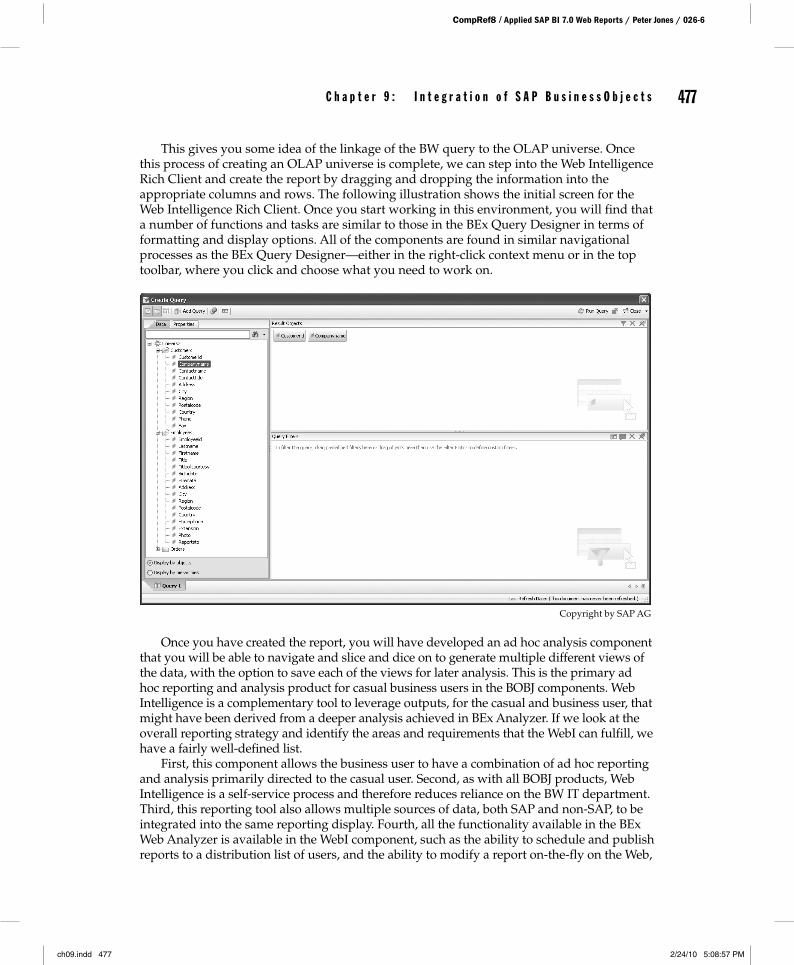
This gives you some idea of the linkage of the BW query to the OLAP universe. Once this process of creating an OLAP universe is complete, we can step into the Web Intelligence Rich Client and create the report by dragging and dropping the information into the appropriate columns and rows. The following illustration shows the initial screen for the Web Intelligence Rich Client. Once you start working in this environment, you will find that a number of functions and tasks are similar to those in the BEx Query Designer in terms of formatting and display options. All of the components are found in similar navigational processes as the BEx Query Designer—either in the right-click context menu or in the top toolbar, where you click and choose what you need to work on.
Copyright by SAP AG
Once you have created the report, you will have developed an ad hoc analysis component that you will be able to navigate and slice and dice on to generate multiple different views of the data, with the option to save each of the views for later analysis. This is the primary ad hoc reporting and analysis product for casual business users in the BOBJ components. Web Intelligence is a complementary tool to leverage outputs, for the casual and business user, that might have been derived from a deeper analysis achieved in BEx Analyzer. If we look at the overall reporting strategy and identify the areas and requirements that the WebI can fulfill, we have a fairly well-defined list.
First, this component allows the business user to have a combination of ad hoc reporting and analysis primarily directed to the casual user. Second, as with all BOBJ products, Web Intelligence is a self-service process and therefore reduces reliance on the BW IT department. Third, this reporting tool also allows multiple sources of data, both SAP and non-SAP, to be integrated into the same reporting display. Fourth, all the functionality available in the BEx Web Analyzer is available in the WebI component, such as the ability to schedule and publish reports to a distribution list of users, and the ability to modify a report on-the-fly on the Web,
ch09.indd 477 2/24/10 5:08:57 PM
CompRef8 / Applied SAP BI 7.0 Web Reports / Peter Jones / 026-6
478 A p p l i e d S A P B I 7 . 0 W e b R e p o r t s 478 A p p l i e d S A P B I 7 . 0 W e b R e p o r t s
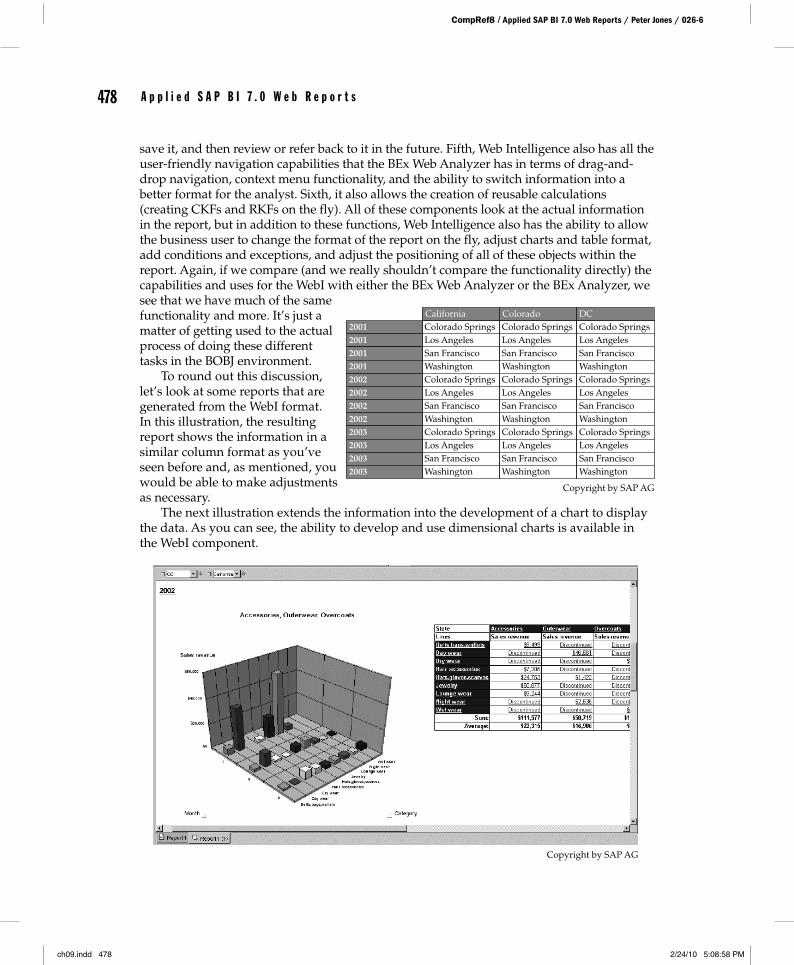
save it, and then review or refer back to it in the future. Fifth, Web Intelligence also has all the user-friendly navigation capabilities that the BEx Web Analyzer has in terms of drag-and-drop navigation, context menu functionality, and the ability to switch information into a better format for the analyst. Sixth, it also allows the creation of reusable calculations (creating CKFs and RKFs on the fly). All of these components look at the actual information in the report, but in addition to these functions, Web Intelligence also has the ability to allow the business user to change the format of the report on the fly, adjust charts and table format, add conditions and exceptions, and adjust the positioning of all of these objects within the report. Again, if we compare (and we really shouldn’t compare the functionality directly) the capabilities and uses for the WebI with either the BEx Web Analyzer or the BEx Analyzer, we see that we have much of the same functionality and more. It’s just a matter of getting used to the actual process of doing these different tasks in the BOBJ environment.
To round out this discussion, let’s look at some reports that are generated from the WebI format. In this illustration, the resulting report shows the information in a similar column format as you’ve seen before and, as mentioned, you would be able to make adjustments as necessary.
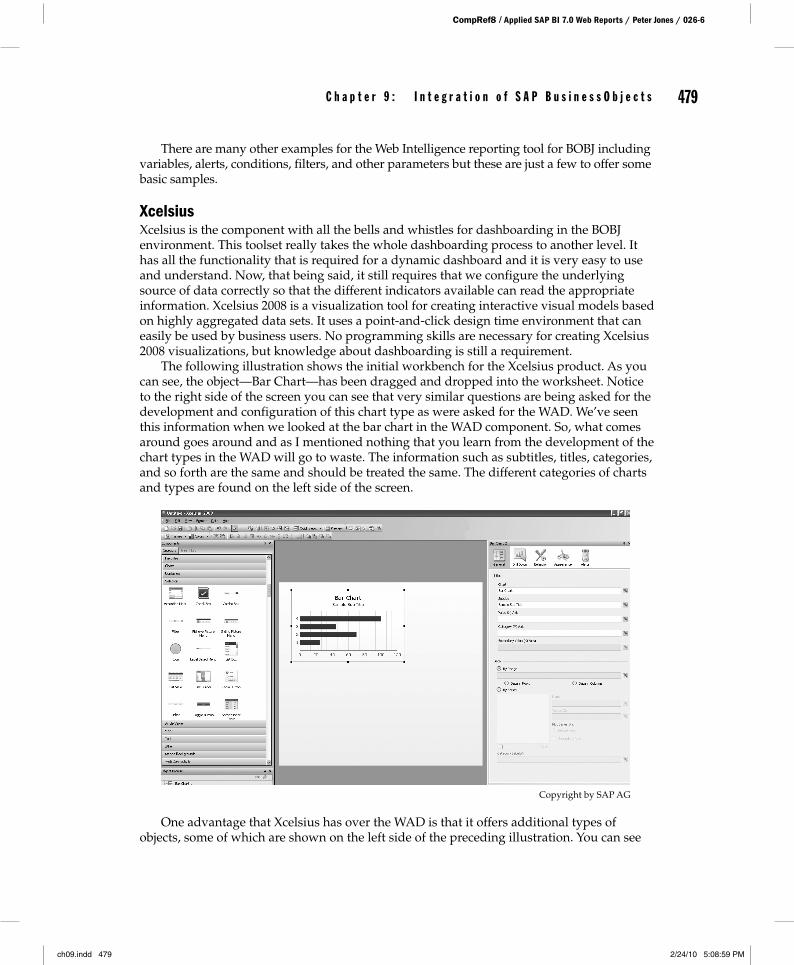
The next illustration extends the information into the development of a chart to display the data. As you can see, the ability to develop and use dimensional charts is available in the WebI component.
Copyright by SAP AG
2001CaliforniaColorado Springs
Colorado Springs
Los Angeles
Los Angeles
San Francisco
San Francisco
Washington
WashingtonColorado SpringsLos AngelesSan FranciscoWashington
200120012001
20032003200320032002200220022002
Colorado Springs
Colorado Springs
Los Angeles
Los Angeles
San Francisco
San Francisco
Washington
WashingtonColorado SpringsLos AngelesSan FranciscoWashington
Colorado Springs
Colorado Springs
Los Angeles
Los Angeles
San Francisco
San Francisco
Washington
WashingtonColorado SpringsLos AngelesSan FranciscoWashington
DCColorado
Copyright by SAP AG
ch09.indd 478 2/24/10 5:08:58 PM
C h a p t e r 9 : I n t e g r a t i o n o f S A P B u s i n e s s O b j e c t s 479
CompRef8 / Applied SAP BI 7.0 Web Reports / Peter Jones / 026-6
C h a p t e r 9 : I n t e g r a t i o n o f S A P B u s i n e s s O b j e c t s 479
There are many other examples for the Web Intelligence reporting tool for BOBJ including variables, alerts, conditions, filters, and other parameters but these are just a few to offer some basic samples.
XcelsiusXcelsius is the component with all the bells and whistles for dashboarding in the BOBJ environment. This toolset really takes the whole dashboarding process to another level. It has all the functionality that is required for a dynamic dashboard and it is very easy to use and understand. Now, that being said, it still requires that we configure the underlying source of data correctly so that the different indicators available can read the appropriate information. Xcelsius 2008 is a visualization tool for creating interactive visual models based on highly aggregated data sets. It uses a point-and-click design time environment that can easily be used by business users. No programming skills are necessary for creating Xcelsius 2008 visualizations, but knowledge about dashboarding is still a requirement.
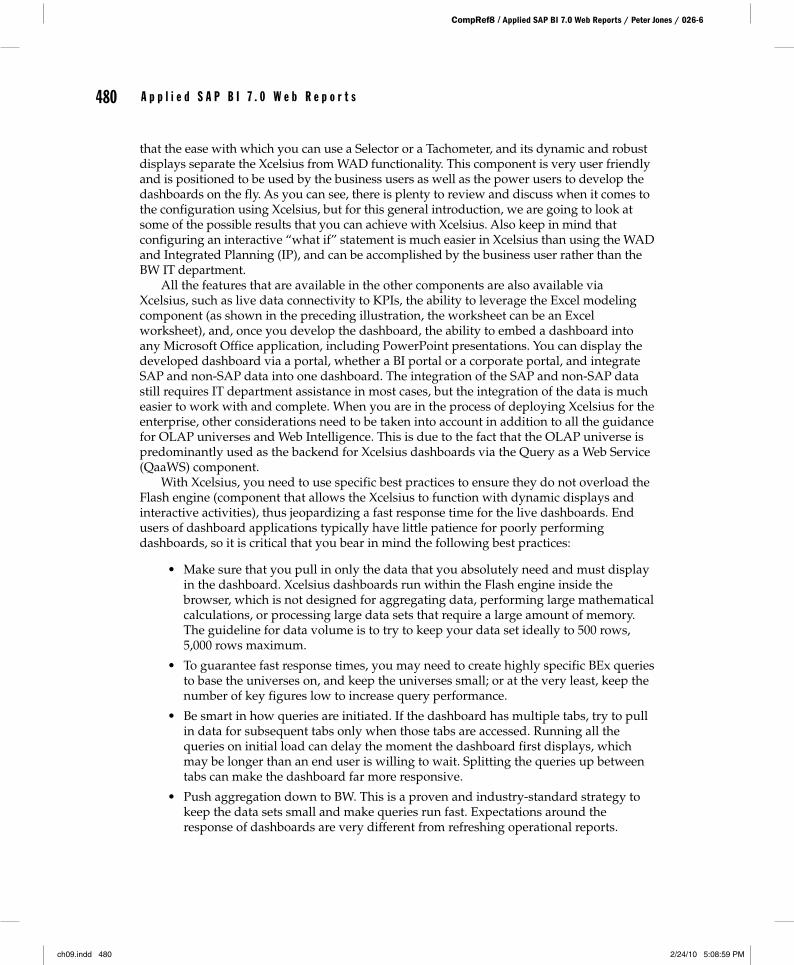
The following illustration shows the initial workbench for the Xcelsius product. As you can see, the object—Bar Chart—has been dragged and dropped into the worksheet. Notice to the right side of the screen you can see that very similar questions are being asked for the development and configuration of this chart type as were asked for the WAD. We’ve seen this information when we looked at the bar chart in the WAD component. So, what comes around goes around and as I mentioned nothing that you learn from the development of the chart types in the WAD will go to waste. The information such as subtitles, titles, categories, and so forth are the same and should be treated the same. The different categories of charts and types are found on the left side of the screen.
Copyright by SAP AG
One advantage that Xcelsius has over the WAD is that it offers additional types of objects, some of which are shown on the left side of the preceding illustration. You can see
ch09.indd 479 2/24/10 5:08:59 PM
CompRef8 / Applied SAP BI 7.0 Web Reports / Peter Jones / 026-6
480 A p p l i e d S A P B I 7 . 0 W e b R e p o r t s 480 A p p l i e d S A P B I 7 . 0 W e b R e p o r t s
that the ease with which you can use a Selector or a Tachometer, and its dynamic and robust displays separate the Xcelsius from WAD functionality. This component is very user friendly and is positioned to be used by the business users as well as the power users to develop the dashboards on the fly. As you can see, there is plenty to review and discuss when it comes to the configuration using Xcelsius, but for this general introduction, we are going to look at some of the possible results that you can achieve with Xcelsius. Also keep in mind that configuring an interactive “what if” statement is much easier in Xcelsius than using the WAD and Integrated Planning (IP), and can be accomplished by the business user rather than the BW IT department.
All the features that are available in the other components are also available via Xcelsius, such as live data connectivity to KPIs, the ability to leverage the Excel modeling component (as shown in the preceding illustration, the worksheet can be an Excel worksheet), and, once you develop the dashboard, the ability to embed a dashboard into any Microsoft Office application, including PowerPoint presentations. You can display the developed dashboard via a portal, whether a BI portal or a corporate portal, and integrate SAP and non-SAP data into one dashboard. The integration of the SAP and non-SAP data still requires IT department assistance in most cases, but the integration of the data is much easier to work with and complete. When you are in the process of deploying Xcelsius for the enterprise, other considerations need to be taken into account in addition to all the guidance for OLAP universes and Web Intelligence. This is due to the fact that the OLAP universe is predominantly used as the backend for Xcelsius dashboards via the Query as a Web Service (QaaWS) component.
With Xcelsius, you need to use specific best practices to ensure they do not overload the Flash engine (component that allows the Xcelsius to function with dynamic displays and interactive activities), thus jeopardizing a fast response time for the live dashboards. End users of dashboard applications typically have little patience for poorly performing dashboards, so it is critical that you bear in mind the following best practices:
• Make sure that you pull in only the data that you absolutely need and must display in the dashboard. Xcelsius dashboards run within the Flash engine inside the browser, which is not designed for aggregating data, performing large mathematical calculations, or processing large data sets that require a large amount of memory. The guideline for data volume is to try to keep your data set ideally to 500 rows, 5,000 rows maximum.
• To guarantee fast response times, you may need to create highly specific BEx queries to base the universes on, and keep the universes small; or at the very least, keep the number of key figures low to increase query performance.
• Be smart in how queries are initiated. If the dashboard has multiple tabs, try to pull in data for subsequent tabs only when those tabs are accessed. Running all the queries on initial load can delay the moment the dashboard first displays, which may be longer than an end user is willing to wait. Splitting the queries up between tabs can make the dashboard far more responsive.
• Push aggregation down to BW. This is a proven and industry-standard strategy to keep the data sets small and make queries run fast. Expectations around the response of dashboards are very different from refreshing operational reports.
ch09.indd 480 2/24/10 5:08:59 PM
C h a p t e r 9 : I n t e g r a t i o n o f S A P B u s i n e s s O b j e c t s 481
CompRef8 / Applied SAP BI 7.0 Web Reports / Peter Jones / 026-6
C h a p t e r 9 : I n t e g r a t i o n o f S A P B u s i n e s s O b j e c t s 481
• Where a live query is not feasible, LiveOffice is a good option. However, the LiveOffice documents should also be optimized to ensure good dashboard performance.
• Ensure that you are on the latest patch levels for Xcelsius, BusinessObjects Enterprise (BOE), and BW. A number of product issues have been enhanced, so the latest Fix Packs provide all the resolutions for issues identified earlier. The Fix Packs are synchronized and rely on each other, so it is not sufficient to only patch the BOE servers or the BW system alone.
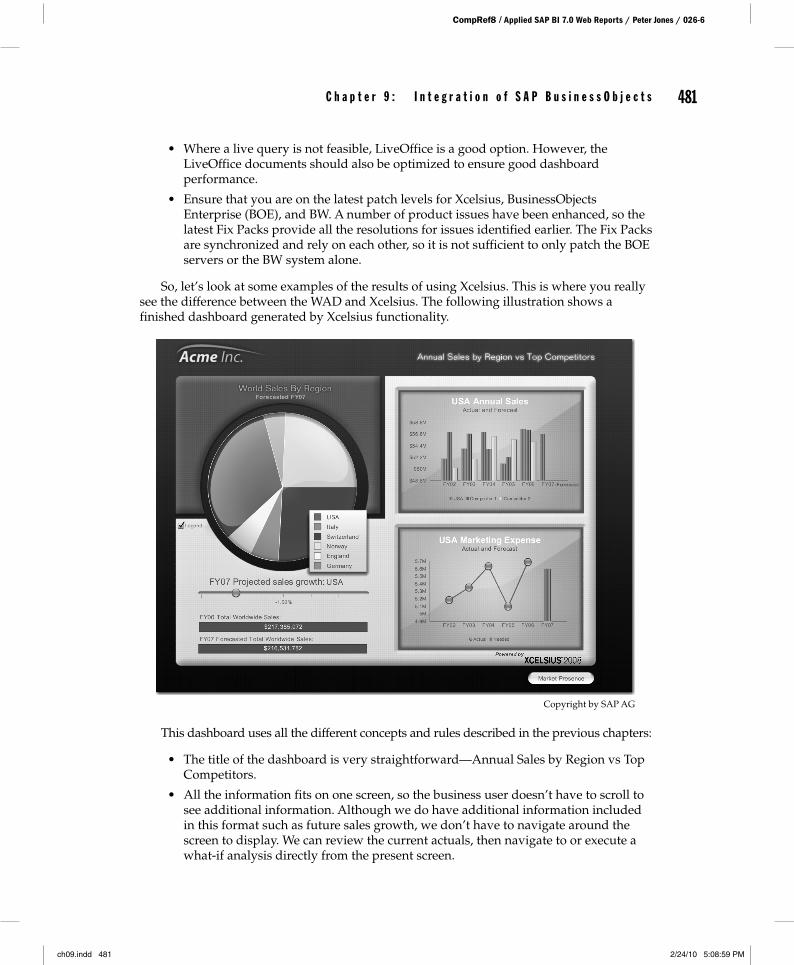
So, let’s look at some examples of the results of using Xcelsius. This is where you really see the difference between the WAD and Xcelsius. The following illustration shows a finished dashboard generated by Xcelsius functionality.
Copyright by SAP AG
This dashboard uses all the different concepts and rules described in the previous chapters:
• The title of the dashboard is very straightforward—Annual Sales by Region vs Top Competitors.
• All the information fits on one screen, so the business user doesn’t have to scroll to see additional information. Although we do have additional information included in this format such as future sales growth, we don’t have to navigate around the screen to display. We can review the current actuals, then navigate to or execute a what-if analysis directly from the present screen.
ch09.indd 481 2/24/10 5:08:59 PM
CompRef8 / Applied SAP BI 7.0 Web Reports / Peter Jones / 026-6
482 A p p l i e d S A P B I 7 . 0 W e b R e p o r t s 482 A p p l i e d S A P B I 7 . 0 W e b R e p o r t s
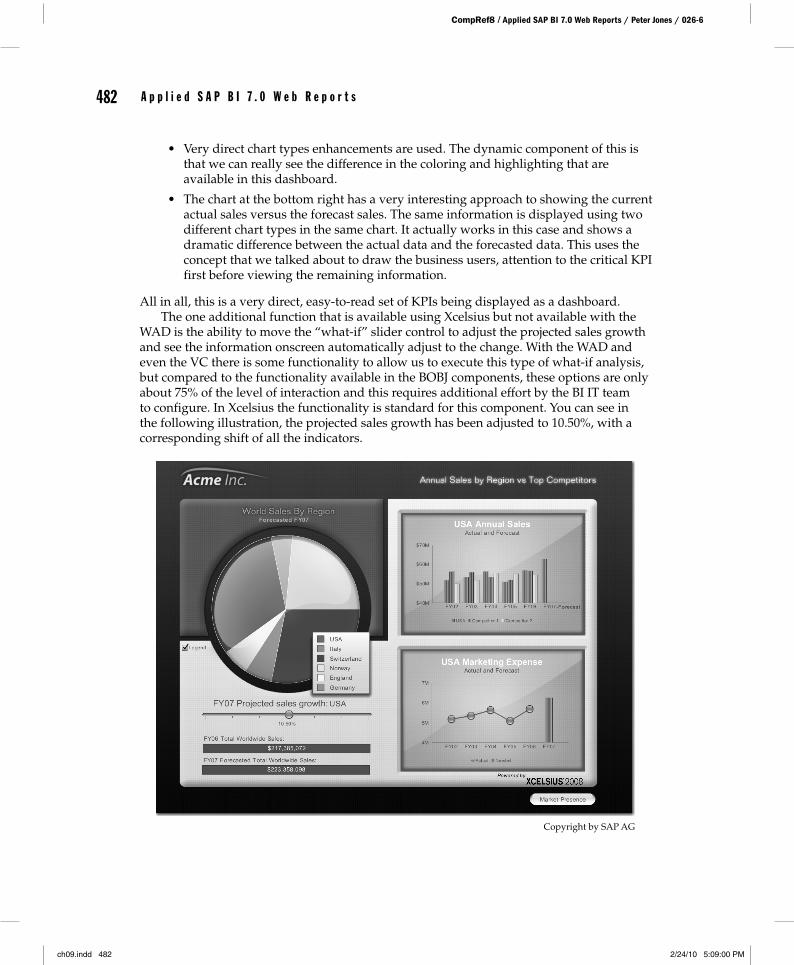
• Very direct chart types enhancements are used. The dynamic component of this is that we can really see the difference in the coloring and highlighting that are available in this dashboard.
• The chart at the bottom right has a very interesting approach to showing the current actual sales versus the forecast sales. The same information is displayed using two different chart types in the same chart. It actually works in this case and shows a dramatic difference between the actual data and the forecasted data. This uses the concept that we talked about to draw the business users, attention to the critical KPI first before viewing the remaining information.
All in all, this is a very direct, easy-to-read set of KPIs being displayed as a dashboard. The one additional function that is available using Xcelsius but not available with the
WAD is the ability to move the “what-if” slider control to adjust the projected sales growth and see the information onscreen automatically adjust to the change. With the WAD and even the VC there is some functionality to allow us to execute this type of what-if analysis, but compared to the functionality available in the BOBJ components, these options are only about 75% of the level of interaction and this requires additional effort by the BI IT team to configure. In Xcelsius the functionality is standard for this component. You can see in the following illustration, the projected sales growth has been adjusted to 10.50%, with a corresponding shift of all the indicators.
Copyright by SAP AG
ch09.indd 482 2/24/10 5:09:00 PM
C h a p t e r 9 : I n t e g r a t i o n o f S A P B u s i n e s s O b j e c t s 483
CompRef8 / Applied SAP BI 7.0 Web Reports / Peter Jones / 026-6
C h a p t e r 9 : I n t e g r a t i o n o f S A P B u s i n e s s O b j e c t s 483
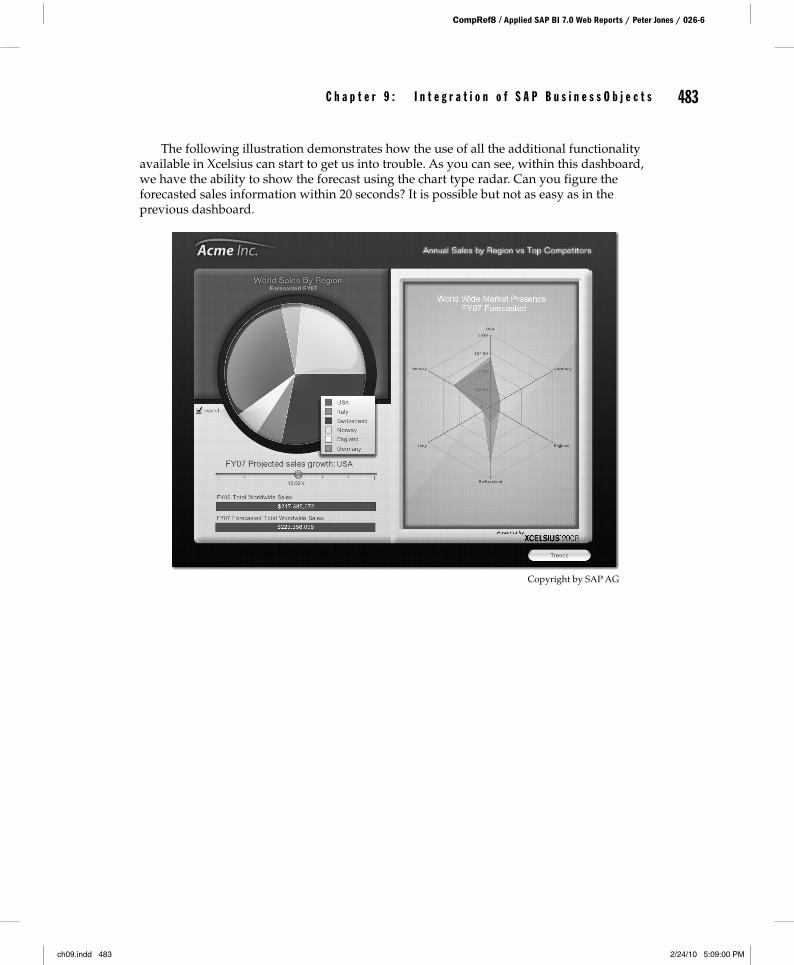
The following illustration demonstrates how the use of all the additional functionality available in Xcelsius can start to get us into trouble. As you can see, within this dashboard, we have the ability to show the forecast using the chart type radar. Can you figure the forecasted sales information within 20 seconds? It is possible but not as easy as in the previous dashboard.
Copyright by SAP AG
ch09.indd 483 2/24/10 5:09:00 PM
CompRef8 / Applied SAP BI 7.0 Web Reports / Peter Jones / 026-6
484 A p p l i e d S A P B I 7 . 0 W e b R e p o r t s 484 A p p l i e d S A P B I 7 . 0 W e b R e p o r t s
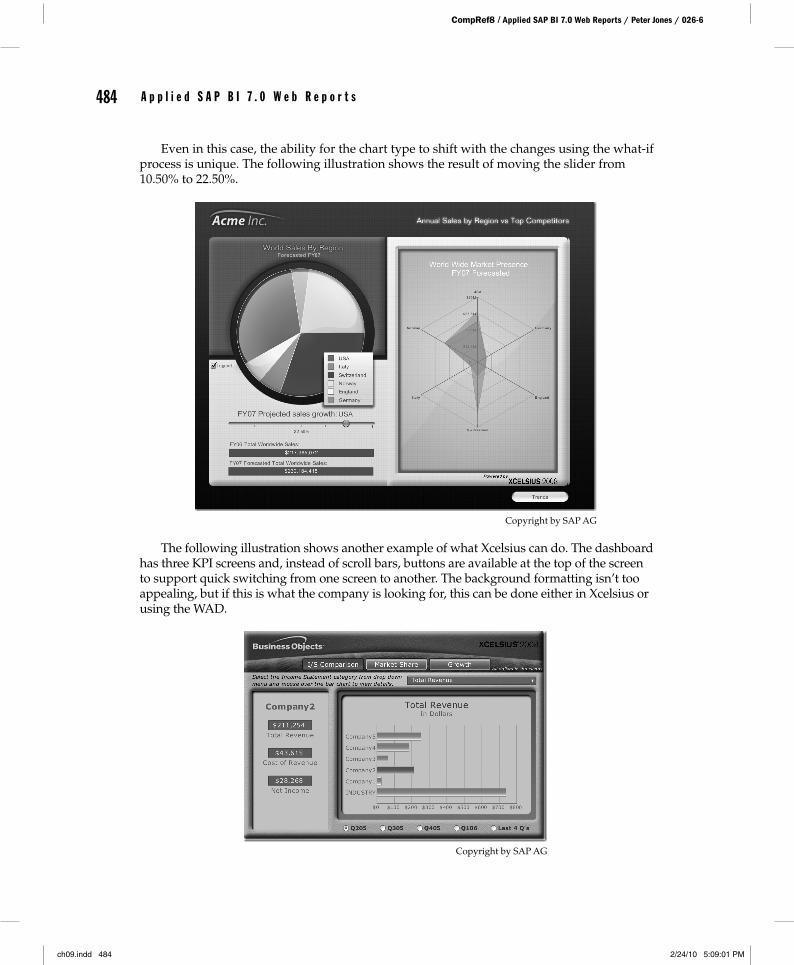
Even in this case, the ability for the chart type to shift with the changes using the what-if process is unique. The following illustration shows the result of moving the slider from 10.50% to 22.50%.
Copyright by SAP AG
The following illustration shows another example of what Xcelsius can do. The dashboard has three KPI screens and, instead of scroll bars, buttons are available at the top of the screen to support quick switching from one screen to another. The background formatting isn’t too appealing, but if this is what the company is looking for, this can be done either in Xcelsius or using the WAD.
Copyright by SAP AG
ch09.indd 484 2/24/10 5:09:01 PM
C h a p t e r 9 : I n t e g r a t i o n o f S A P B u s i n e s s O b j e c t s 485
CompRef8 / Applied SAP BI 7.0 Web Reports / Peter Jones / 026-6
C h a p t e r 9 : I n t e g r a t i o n o f S A P B u s i n e s s O b j e c t s 485
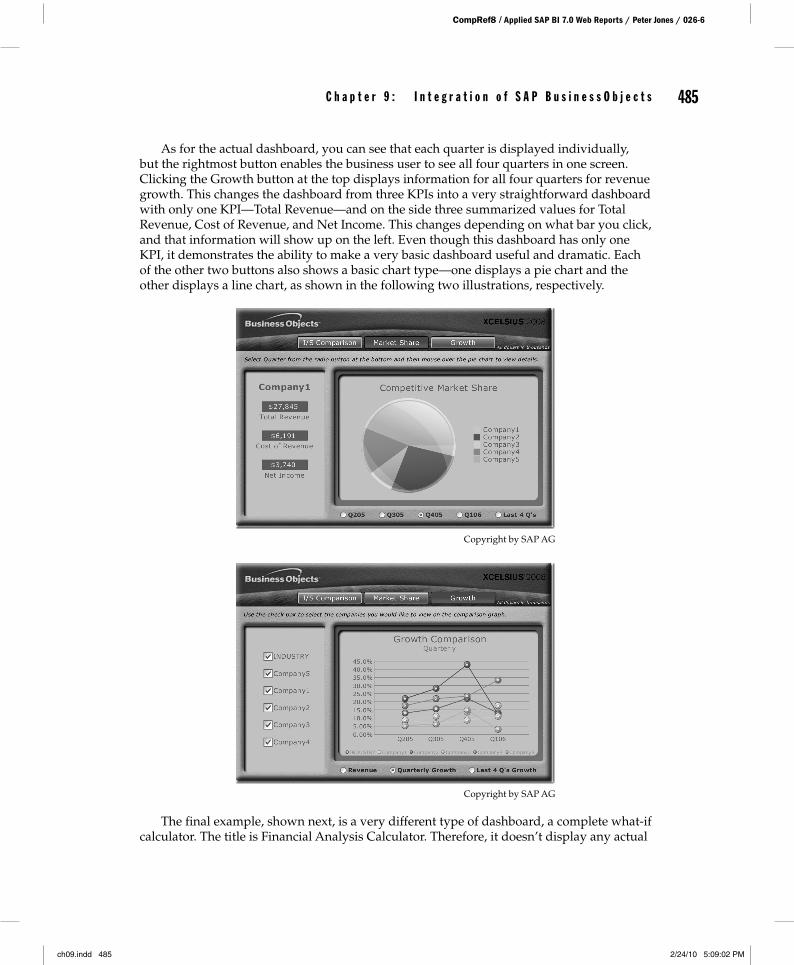
As for the actual dashboard, you can see that each quarter is displayed individually, but the rightmost button enables the business user to see all four quarters in one screen. Clicking the Growth button at the top displays information for all four quarters for revenue growth. This changes the dashboard from three KPIs into a very straightforward dashboard with only one KPI—Total Revenue—and on the side three summarized values for Total Revenue, Cost of Revenue, and Net Income. This changes depending on what bar you click, and that information will show up on the left. Even though this dashboard has only one KPI, it demonstrates the ability to make a very basic dashboard useful and dramatic. Each of the other two buttons also shows a basic chart type—one displays a pie chart and the other displays a line chart, as shown in the following two illustrations, respectively.
Copyright by SAP AG
Copyright by SAP AG
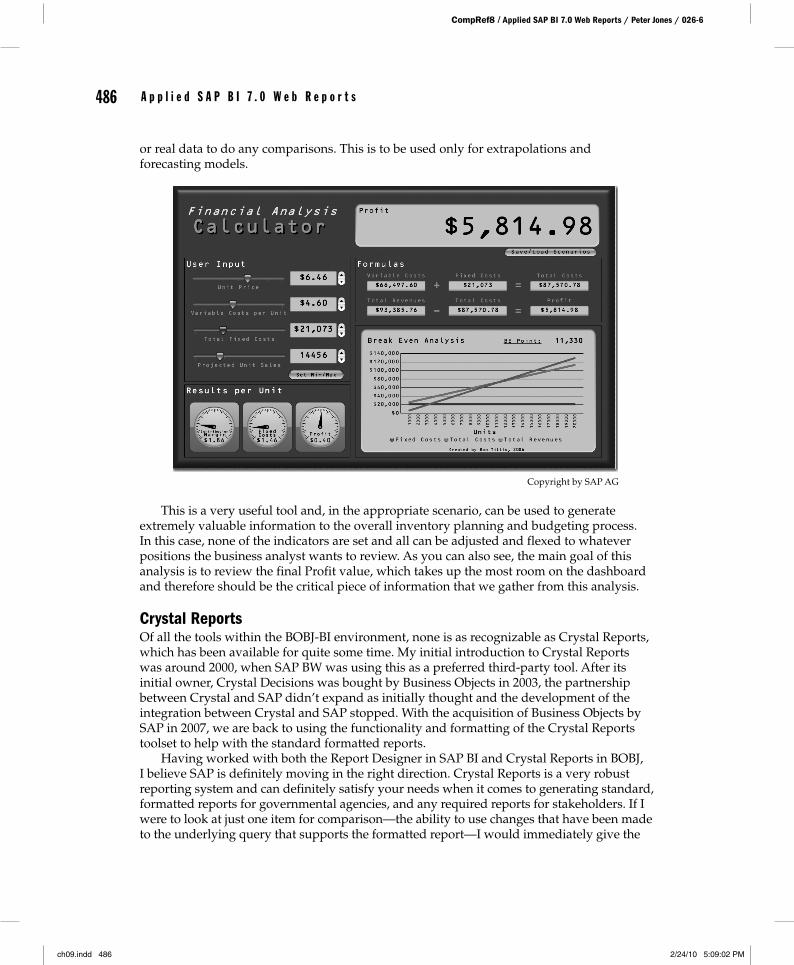
The final example, shown next, is a very different type of dashboard, a complete what-if calculator. The title is Financial Analysis Calculator. Therefore, it doesn’t display any actual
ch09.indd 485 2/24/10 5:09:02 PM
CompRef8 / Applied SAP BI 7.0 Web Reports / Peter Jones / 026-6
486 A p p l i e d S A P B I 7 . 0 W e b R e p o r t s 486 A p p l i e d S A P B I 7 . 0 W e b R e p o r t s
or real data to do any comparisons. This is to be used only for extrapolations and forecasting models.
Copyright by SAP AG
This is a very useful tool and, in the appropriate scenario, can be used to generate extremely valuable information to the overall inventory planning and budgeting process. In this case, none of the indicators are set and all can be adjusted and flexed to whatever positions the business analyst wants to review. As you can also see, the main goal of this analysis is to review the final Profit value, which takes up the most room on the dashboard and therefore should be the critical piece of information that we gather from this analysis.
Crystal ReportsOf all the tools within the BOBJ-BI environment, none is as recognizable as Crystal Reports, which has been available for quite some time. My initial introduction to Crystal Reports was around 2000, when SAP BW was using this as a preferred third-party tool. After its initial owner, Crystal Decisions was bought by Business Objects in 2003, the partnership between Crystal and SAP didn’t expand as initially thought and the development of the integration between Crystal and SAP stopped. With the acquisition of Business Objects by SAP in 2007, we are back to using the functionality and formatting of the Crystal Reports toolset to help with the standard formatted reports.
Having worked with both the Report Designer in SAP BI and Crystal Reports in BOBJ, I believe SAP is definitely moving in the right direction. Crystal Reports is a very robust reporting system and can definitely satisfy your needs when it comes to generating standard, formatted reports for governmental agencies, and any required reports for stakeholders. If I were to look at just one item for comparison—the ability to use changes that have been made to the underlying query that supports the formatted report—I would immediately give the
ch09.indd 486 2/24/10 5:09:02 PM
C h a p t e r 9 : I n t e g r a t i o n o f S A P B u s i n e s s O b j e c t s 487
CompRef8 / Applied SAP BI 7.0 Web Reports / Peter Jones / 026-6
C h a p t e r 9 : I n t e g r a t i o n o f S A P B u s i n e s s O b j e c t s 487
nod to Crystal Reports. When business users talk about Crystal Reports we talk mostly about the formatted reporting coming from this component. Several layers of integration make up Crystal Reports, but the other components deal with the user interface, server setup for distribution of reports, and other activities that allow users to share the formatted reports.
Crystal Reports is designed to work with your database to help you analyze and interpret important information. Crystal Reports makes it easy to create simple reports, and it also has the comprehensive tools you need to produce complex or specialized reports. Crystal Reports is designed to produce the required reports from both SAP and non-SAP data sources. The ability to log on and quickly get up and running with Crystal Reports is enhanced by built-in report wizards to guide you step by step through building reports and completing common reporting tasks. Crystal Reports has many of the same functions (such as formulas, cross-tabs, subreports, and conditional formatting) that most other reporting toolsets have, but the primary difference between Crystal Reports and the others is the formatting functionality.
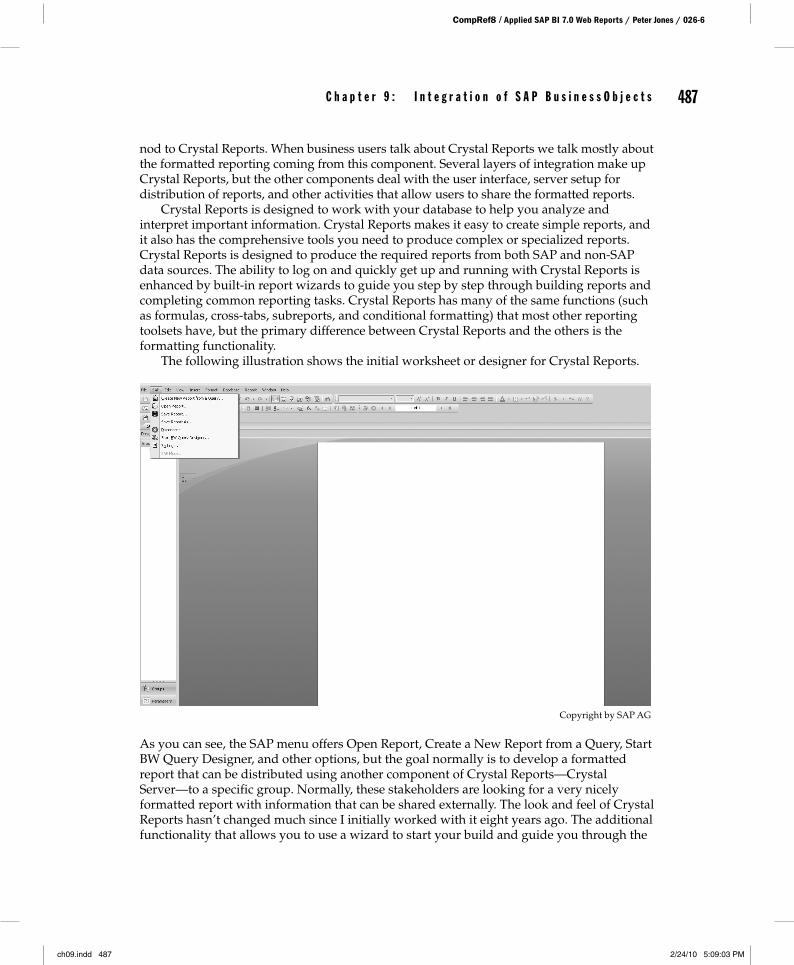
The following illustration shows the initial worksheet or designer for Crystal Reports.
Copyright by SAP AG
As you can see, the SAP menu offers Open Report, Create a New Report from a Query, Start BW Query Designer, and other options, but the goal normally is to develop a formatted report that can be distributed using another component of Crystal Reports—Crystal Server—to a specific group. Normally, these stakeholders are looking for a very nicely formatted report with information that can be shared externally. The look and feel of Crystal Reports hasn’t changed much since I initially worked with it eight years ago. The additional functionality that allows you to use a wizard to start your build and guide you through the
ch09.indd 487 2/24/10 5:09:03 PM
CompRef8 / Applied SAP BI 7.0 Web Reports / Peter Jones / 026-6
488 A p p l i e d S A P B I 7 . 0 W e b R e p o r t s 488 A p p l i e d S A P B I 7 . 0 W e b R e p o r t s
process should put you in pretty good shape immediately upon starting the process. As with any new system, you will need some time to bone up on some of the features and also how to navigate within the Crystal components rather than having to search and experiment with the parameters while trying to make your deadline for report requirements.
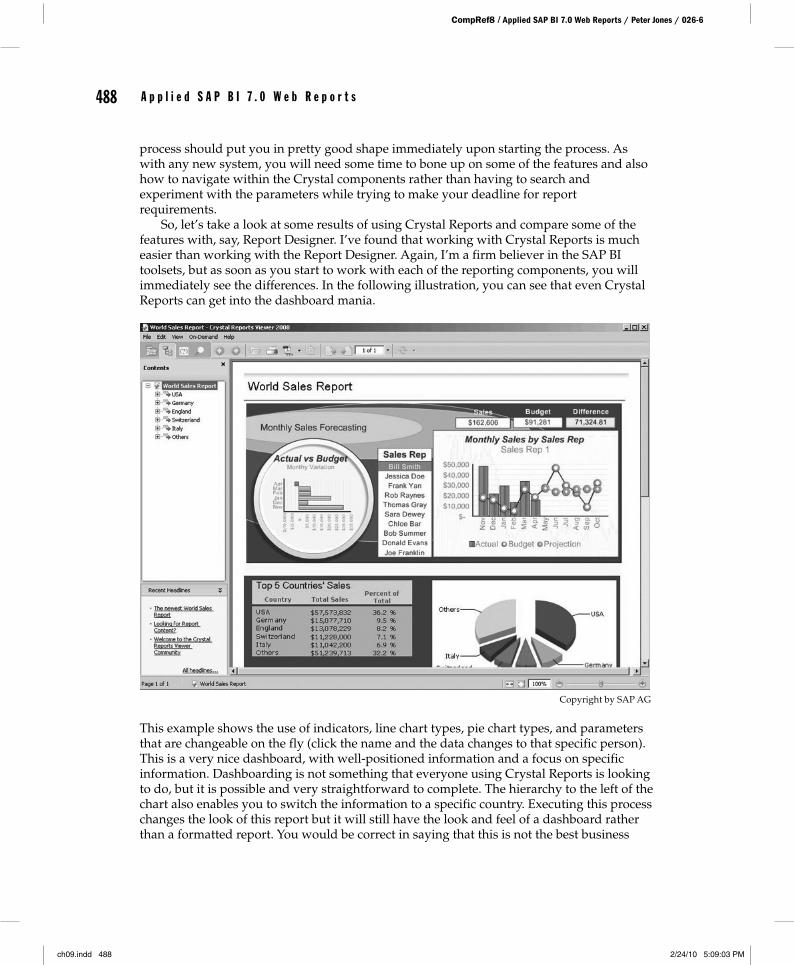
So, let’s take a look at some results of using Crystal Reports and compare some of the features with, say, Report Designer. I’ve found that working with Crystal Reports is much easier than working with the Report Designer. Again, I’m a firm believer in the SAP BI toolsets, but as soon as you start to work with each of the reporting components, you will immediately see the differences. In the following illustration, you can see that even Crystal Reports can get into the dashboard mania.
Copyright by SAP AG
This example shows the use of indicators, line chart types, pie chart types, and parameters that are changeable on the fly (click the name and the data changes to that specific person). This is a very nice dashboard, with well-positioned information and a focus on specific information. Dashboarding is not something that everyone using Crystal Reports is looking to do, but it is possible and very straightforward to complete. The hierarchy to the left of the chart also enables you to switch the information to a specific country. Executing this process changes the look of this report but it will still have the look and feel of a dashboard rather than a formatted report. You would be correct in saying that this is not the best business
ch09.indd 488 2/24/10 5:09:03 PM
C h a p t e r 9 : I n t e g r a t i o n o f S A P B u s i n e s s O b j e c t s 489
CompRef8 / Applied SAP BI 7.0 Web Reports / Peter Jones / 026-6
C h a p t e r 9 : I n t e g r a t i o n o f S A P B u s i n e s s O b j e c t s 489
practice, to use Crystal for dashboarding, but the specific activity to focus on in this case would be that we have a structured layout that can be used and distributed. Again, can this be developed and distributed by using Xcelsius—definitely—and would it take on a more complete look—probably.
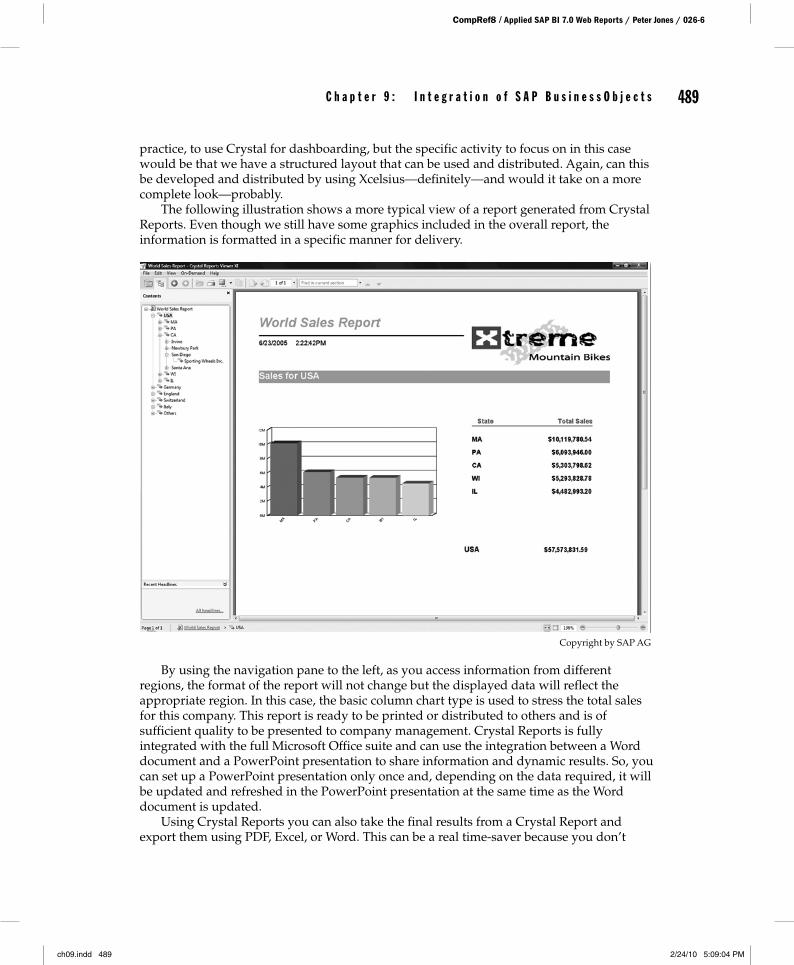
The following illustration shows a more typical view of a report generated from Crystal Reports. Even though we still have some graphics included in the overall report, the information is formatted in a specific manner for delivery.
Copyright by SAP AG
By using the navigation pane to the left, as you access information from different regions, the format of the report will not change but the displayed data will reflect the appropriate region. In this case, the basic column chart type is used to stress the total sales for this company. This report is ready to be printed or distributed to others and is of sufficient quality to be presented to company management. Crystal Reports is fully integrated with the full Microsoft Office suite and can use the integration between a Word document and a PowerPoint presentation to share information and dynamic results. So, you can set up a PowerPoint presentation only once and, depending on the data required, it will be updated and refreshed in the PowerPoint presentation at the same time as the Word document is updated.
Using Crystal Reports you can also take the final results from a Crystal Report and export them using PDF, Excel, or Word. This can be a real time-saver because you don’t
ch09.indd 489 2/24/10 5:09:04 PM
CompRef8 / Applied SAP BI 7.0 Web Reports / Peter Jones / 026-6
490 A p p l i e d S A P B I 7 . 0 W e b R e p o r t s 490 A p p l i e d S A P B I 7 . 0 W e b R e p o r t s
have to reformat a report that was developed in Word and export the results into an Excel spreadsheet.
In this case, the flexibility of Crystal Reports doesn’t end with creating reports—your reports can be published in a variety of formats, including Microsoft Word and Excel, e-mail, and even over the Web. Advanced Web reporting lets other members of your workgroup view and update shared reports inside their Web browser. In addition, Crystal Reports saves time because all the features are very user-friendly and you can develop a report similar to the one displayed in the previous illustration in a matter of minutes without any training.
Basically, the features of Crystal Reports include the ability to generate formatted reporting, use static or dynamic data feed reports, offer printing in just about any format, and all of this with a very professional and complete report that can be distributed in multiple different methods, and can also incorporate both SAP and non-SAP information.
BusinessObjects ExplorerThis is the newest component in the SAP BOBJ-BI suite. SAP BusinessObjects Explorer takes the place of SAP BusinessObjects Polestar. SAP renamed BusinessObjects Polestar to BusinessObjects Explorer to clearly describe the value it provides. BusinessObjects Explorer, accelerated version for SAP NetWeaver Business Warehouse, brings together intuitive information search and exploration combined with high performance and scalability made possible by SAP NetWeaver Business Warehouse Accelerator (BWA).
One of the main issues encountered with the other reporting toolsets was the inability to manipulate both structured and nonstructured data quickly. The combination of BusinessObjects Explorer and BW Accelerator resolves this issue. Using BusinessObjects Explorer, the business user can work with information on the fly and generate results for questions that are being asked at that time. In this way, the analyst doesn’t need to wait for the BI IT department to pull together the information into a query or universe. The only requirement at this time is that all data must be either SAP BW data or non-SAP data, not a mix of the two. In the future, this component will be able to navigate against both types of data at the same time, but for now it must be either one or the other.
Using the BW Accelerator, SAP BusinessObjects Explorer is able to link directly to the BW InfoCubes, without the additional layer of either universes or BEx queries, and search through the information at very fast speeds. In some of the implementations of the BW Accelerator that I’ve been involved in, we have experienced increases in query performance from several minutes to pull the data and display to several seconds to generate the report. If the performance of the BW Accelerator directly against a reporting component is similarly impressive, your query will definitely perform much faster than in any other reporting component within the BOBJ suite. Power users, who understand the structures of the underlying BW data sources (BW InfoCubes), use SAP BusinessObjects Explorer to create Information Spaces, which are sets of contextually related objects selected directly from an SAP BW Accelerator index enabled for Explorer. New Information Spaces need to be indexed once, in order to generate the metadata required by the Explorer search engine. This is a very similar process that occurs using the BW Accelerator outside of the Explorer for performance improvements against BEx queries. Because BW Accelerator indexes are consumed directly, the values visible to users are always the latest, up-to-date values on the underlying BW InfoCube. Information consumers and analysts search and explore Information Spaces to create personal exploration views of the data and can then distribute
ch09.indd 490 2/24/10 5:09:04 PM
C h a p t e r 9 : I n t e g r a t i o n o f S A P B u s i n e s s O b j e c t s 491
CompRef8 / Applied SAP BI 7.0 Web Reports / Peter Jones / 026-6
C h a p t e r 9 : I n t e g r a t i o n o f S A P B u s i n e s s O b j e c t s 491
the information across a group of analysts to develop additional information to help drive business for their corporation.
The functionality available with the BOBJ Explorer is not quite the same as the other reporting tools since it is used primarily for analysis and the sorting of data mining information, there are few formatting and context menu functions to work with. Accessing BOBJ Explorer is similar to accessing a search engine screen on the Internet, while other reporting tools present you with a selection of reports for execution. Most of the basic functions are available, such as generating reports and queries, using charts and graphics to display the information, and some navigational functions, but the primary goal of the Explorer is to allow you to obtain information and answers at the speed of thought. Parameters exist to allow the distribution of the data, but over and above that, the information is displayed as is for analysis.
Using BusinessObjects Explorer, you can query on terabytes of data and generate an answer for a customer immediately while you are on the phone with that customer and not have to get back to them with decisions on product cost, price, and shipping information. With this reporting tool, your business analysts can discuss areas of concern and get answers for questions immediately and not have to go through the process of getting a change request from the BW IT department. If this reduces the workload on the BW IT group, that is another benefit. Because business and power users can obtain information immediately, they can develop their own reports and test the information immediately. This requires a user interface that is user friendly and easy to work with, which is a trait of all the BOBJ products.
SummaryThe rollout of the BusinessObjects reporting components is in its early stages. SAP is developing some extensions to these components with items such as Pioneer to support more detailed analysis and other enhancements in the integration of these reporting toolsets and the NetWeaver platform. All in all, you will have your choice of either or both sets of reporting objects. The support for the older-version BI reporting tools—WAD, BEx Web Analyzer, BEx Analyzer, Report Designer, and others—will continue through 2014 at least, after which these reporting features will be available but may not have as much support. SAP has already ceased further development of these components, but support is still available. In any case, understanding the differences and features that you get with both sets of components is important, and even if you decide not to go any further in the use of or configuration of any BusinessObjects components, it is important to understand each and where it fits into the SAP landscape.
You will find that SAP is moving to incorporate these components into many of its other product lines that are supported by NetWeaver platforms such as the BPC component. In BPC the integration will take place with all of the BOBJ reporting tools, which will support Excel functionality and have access to all of the Microsoft Office suite including the ability to integrate and use Excel, Word, and PowerPoint dynamically. If you are a BW/BI consultant in the SAP and Web environments, you really have no choice but to learn how to use these additional tools. The final versions of the reporting objects will be hybrids of the best of each company—SAP and Business Objects—and offer significant best business practice reporting components and processes.
ch09.indd 491 2/24/10 5:09:04 PM

CompRef8 / Applied SAP BI 7.0 Web Reports / Peter Jones / 026-6 blind folio : 492
ch09.indd 492 2/24/10 5:09:04 PM