Embed Size (px)
Citation preview
CHAPTER-IV
POPULATION, POVERTYAND UNEMPLOYMENT
-A GLOBAL SCENARIO

107
Population, Poverty and Unemployment – A Global Scenario
"Common interest of mankind is that, ‘mankind wants to survive; has the
moral obligation to survive.’ This can be achieved by overcoming world hunger, mass
misery and alarming disparities between living conditions of rich and poor. World
peace is not only threatened by military conflict but also, more so, by chaos resulting
from mass hunger, economic disaster, environmental catastrophes and terrorism.
Wars produce hunger. But, mass hunger can lead to war or end in chaos. When
hunger rules, peace cannot prevail. So, there is a need for change from chaos to
order." -Willy Brandt1
The exertions that men find it necessary to make, in order to support
themselves or families, frequently awaken faculties that might otherwise have lain for
ever dormant, and it has been commonly remarked that new and extraordinary
situations generally create minds adequate to grapple with the difficulties in which
they are involved"".
- Robert Malthus2
4.1: World Population3
“World Population is the total number of human beings living on Earth.”
The world population which was around 350 million in 1,350 at the end of
Great Famine and Black Death has experienced continuous fast paced growth since
then.4 The growth rate in global population which normally lingered around 1.0 per
cent per annum or even less, gathered momentum at the turn of twentieth century and
showed higher growth rates hovering around 1.8 per cent per annum during 1960s
and 1970s and reached its peak at 2.2 per cent per annum in 1963. In the later period
global population growth rates exhibited a declining trend, mainly because of the
family planning drive in China and India, and had reached a low of 1.1 per cent per
annum in 2012. As a result of improvement in life expectancy, decline in death rate
due to a surge in health care out pacing decline in birth rate as the populous countries
1Brandt, Willy (1980), North-South: A Programme for Survival, The report of the Independent
Commission on International Development Issues, Pan books, London, pp. 7-16. 2 Kunzing , Robert (2011), Quoted in National Geographic, Seven Billion Special Issue, January. 3 World Development Indicators 4Biraben, Jean-Noël (1980), An Essay Concerning Mankind's Evolution, Population, Selected Papers,
4: 1–13. Original paper in French: (b) Jean-Noël Biraben (1979)."Essai sur l'évolution du nombre des
hommes". Population. Vol. 34 (no. 1). pp. 13–25.

108
woke up to the problems of population explosion, the world population grew at a
higher pace in the twentieth century compared to the previous centuries and crossed
the population figure of 7 billion on 31st October, 2011 as estimated by the United
Nations Population Fund5. UN projections of 2012 indicate that, despite a steady
decline in population growth rate, the global population is expected to reach between
8.3 and 10.9 billion by 20506. Sustainability of further growth of global population is
disparaging as it puts enormous pressure on the environment, food supplies, energy
resources, employment opportunities, poverty and hunger, many analysts opine.
Table-4.1: World Population (Millions)
Sl. No.
Top Ten Most Populous Countries
1990 2008 2014 / 2015 2025*
1 China 1,141 1,333 1,371 (18.90) 1,458 2 India 849 1,140 1,272 (17.60) 1,398 3 United States 250 304 321 (04.43) 352 4 Indonesia 178 228 252 (03.48) 273 5 Brazil 150 192 204 (02.82) 223 6 Pakistan 108 166 190 (02.62) 226 7 Bangladesh 116 160 158 (02.19) 198 8 Nigeria 94 151 174 (02.40) 208 9 Russia 149 143 146 (02.02) 137 10 Japan 124 128 127 (01.75) 126
World Total 5,267 6,689 7,242 (100) 8,004 Source: Complied from World Development Indicators.
With constant annual 2007/2008 growth until 2025
Note: Figures in the parentheses indicate percentage to total
Graph-4.A: Most Populous Countries in the World: 2014-15
5 Coleman, Jasmine (2011), World's Seven Billionth Baby' is Born, The Guardian (London), October 31. 6 UN ( 2012), World Population Prospects, the 2012 Revision – "Low variant" and "High variant"
values, United Nations Organization.

109
As revealed by Table 4.1. and Graph 4.A approximately 4.185 billion people,
representing about 58 per cent of the world’s population as of 2014, live in these 10
countries and the six most populous countries with an approximate combined
population of 3.6 billion people account for half of the world population. China and
India alone accommodate around 37 per cent of the total population. This reflects the
enormity of problems of unemployment, poverty and overall misery in many of the
Asian countries associated with population pressure.
The gap between populations of China and India, which was 238 million in
2001 slimmed down to around 131 million in 2011. During the same period the gap
between populations of India and United States widened from 741 million to 902
million. India’s population as of now is roughly equal to the combined population of
USA, Indonesia, Brazil, Pakistan, Bangladesh and Japan put together7. Unless
colossal efforts on a sustainable basis is not taken up to generate sufficient
employment, conserve the natural resources, reduce poverty and associated misery,
enhance income with equity, we will have unsolvable problems on our hands in the
near future.
Graph-4.B: World Population by Continent (in millions) during 2014
Source: http://www.statista.com/
7 The World Bank (2011), World Development Indicators, International Bank for Reconstruction and
Development, Washington DC, USA, pp. 44.

110
Six of the Earth’s seven continents are inhabited on a large scale (Graph 4.B).
Asia with 4.35 billion people or 60 per cent of the world’s inhabitants is the most
populous continent. Africa with 1.14 billion inhabitants, accounting for 15 per cent of
the world’s population comes second. Europe’s 741 million inhabitants makeup 12
per cent of the global total while 618 people accounting for 9 per cent of the total
have made their home in Latin American and Caribbean regions. United States and
Canada forming the major partners in North America has a population of 353 million
people or 5 per cent of the total8. Oceania, the least populated region in the world, has
around 39 million people (0.5% of the total). Antarctica, the seventh continent,
contains only a small number of people, comprising of international population,
whose number varies with the season9.
Graph-4.C: Estimates of Population Evolution in Different Continents
between 1950 and 2050
Source: http://en.wikipedia.org/wiki/World_population, retrieved on 30-05-2015
8 United Nations (2011), World Population Prospects: The 2010 Revision Population Database, April
15, 2011. 9 CIA (2014), Antarctica, CIA World Fact book, June.

111
Rate of population growth varies from region to region (Graph 4.C).
However, the growth has shown an increasing trend, over the years, in all the
continents as well as in most of the individual countries. With an increase in global
population from 1.6 billion in 1900 to over 6 billion in 2000, the world’s population
observed the greatest increase during the 20th century. Factors which contributed to
this enormous increase in population include, inter alia; improvement in sanitation
and health care, decline in mortality rate and green revolution in the agriculture front.
4.2: World Population Milestones
Estimation by United States Census Bureau (USCB) indicates that the world
population reached one billion mark in around 1804 (Table 4.2). It took about 123
years for the global population to increase from one to two billion (in 1927). Then
onwards the world experienced population explosion. It jumped from two to three
billions in just 32 years and started galloping to reach the billion milestones in less
than half of that time gap10. The fact that economic development coupled with
improvements in public health was the cause for this extremely rapid population
growth is a poor solace, compared to the tremendous pressure this growth exerts on
the environment in terms of exploitation of natural resources and associated
degradation, on the people of populous countries who are forced to eke out a living
with meager resources, on the poor who have to bear the brunt of economic disparity
and on the state which have to unrelentingly strive hard to mobilize resources,
generate employment, alleviate poverty, improve the standard of living of their
subjects and achieve economic and social welfare.
Table-4.2: World Population Milestones
Population (Billions) Year Years elapsed between milestones
1 1804 Innumerable
2 1927 123
3 1959 32
4 1974 15
5 1987 13
6 1999 12
7 2011 12
8 2026 15
9 2042 16
Source: USCB estimates, 2013
10 USCB (2013), U.S. Census Bureau – World POP Clock Projection, July 2013.

112
Many developing countries experienced enormous population growth during
the twentieth century for the aforementioned socio-economic reasons. China’s
population increased from about 430 million in 1850 to 580 million in 195311 and now
it has crossed 1.3 billion. In the Indian subcontinent comprising of India, Pakistan and
Bangladesh, the population which stood at a mere 175 million in 1750, increased to
389 million in 194112 and now the combined population of these three countries
stands at a whopping 1.5 billion people. In 1815 Java, the present day Indonesia had 5
million population, but, today it counts at 140 million13. Similar are the cases of
Mexico14 (from 13.6 million in 1900 to 112 million in 2010) and Kenya (from 2.9
million in 1920 to 37 million in 2000). The twentieth century began with 1.6 billion
people inhabiting this earth and ended with a figure of 6.1 billion.
4.2 (i): Will Overpopulation be Threat to Survival of Mankind due to
Unemployment, Poverty, Hunger and Misery?
Though some public policy analysts answer this question in the affirmative,
the Population Research Institute (PRI) argues that, “advances in agricultural,
medical, and industrial technology have allowed global economic productivity to keep
pace with rising populations despite Malthusian predictions to the contrary and family
sizes are naturally declining worldwide due to higher living standards, increased
adoption of family planning measures and better economic opportunities for
women.”15
4.2 (ii): A Comparison of Population and Income in Low, Medium and High
Income Groups of Countries across different Regions of the World
From the data presented in Table 4.3 we can observe that countries falling
under the low and middle income group, that includes countries belonging to East
Asia & Pacific, Europe & Central Asia, Latin America & Caribbean islands, Middle
East & North Africa, South Asia, and Sub Saharan Africa regions, constitute about 84
per cent of the total global population, but generate only about 30 per cent of the
world’s total Gross National Income. GNI per capita in the poor regions ($ 3,286) is
one-twelfth of that of high income region ($ 38,745). South Asian countries (1.6
billion population with only $ 1920 billion GNI and $ 1,176 GNI per capita) and
11JSTOR (1978), China's demographic evolution 1850–1953 reconsidered, The China Quarterly. 12 CIA (2012), India, CIA World Fact book, July. 13 Encyclopedia, Java (island. Indonesia), Encyclopedia Britannica. 14Jorge Durand (2004), From Traitors to Heroes: 100 Years of Mexican Migration Policies, University of Guadalajara, March.
15 IAP (2012), IAP Statement on Population and Consumption, Inter Academy Panel: The Global Network of Science Academies, June 14.

113
Countries belonging to Sub Saharan Africa (0.9 billion population with only $ 1004
billion GNI and $ 1,176 GNI per capita) are the worst affected regions in terms of
poverty and hunger. Even the GNI per capita PPP figures endorse it.
Table-4.3: Population, National Income, Per Capita Income in
Different Regions of the World (2010)
Sl.
No. Region
Population
(Million)
Gross National
Income
(Billion $)
GNI per
capita ($)
GNI PPP
(Billion $)
GNI
Per capita
PPP ($)
1 East Asia & Pacific 1,962 7,294.4 3,696 13,058.0 6,657
2 Europe and Central
Asia 405 2,946.7 7,272 5,428.2 13,396
3 Latin America &
Caribbean countries 583 4505.0 7,733 6,365.1 10,926
4 Middle East & North
Africa 331 1,283.5 3,874 2,627.3 8,068
5 South Asia 1,633 1920.1 1,176 5,101.4 3,124
6 Sub Saharan Africa 853 1,003.6 1,176 1,833.4 2,148
7 Low & middle
income group total 5,767 18,948.9 3,286 34,577.9 5,996
8 High income group 1,127 43,682.7 38,745 42,072.5 37,317
World 6,895 62,525.2 9,069 76,295.6 11,066 Source: World Development Indicators, 2012.
4.3: Rural Poverty
“Poverty is the inability to afford not only the commodities which are
indispensably necessary for the support of life, but whatever the custom of the country
renders it indecent for creditable people, even of the lowest order, to be without.” As
defined by Adam Smith in his ‘Wealth of Nations’.16
A state where one lacks the basic human needs including clean and fresh
water, nutrition, clothing, shelter, health care and education is termed as Absolute
Poverty, while a state of lacking the socially acceptable level of income as compared
with others within a society or a country is called Relative Poverty. Some of the
predicaments associated with poverty are, inter alia, hunger, low life expectancy,
malnutrition, child mortality, maternal deaths, lack of education, poor sanitation and
high disease incidences.
As discussed earlier, around 84 per cent of the total global population residing
in East Asia & Pacific, Europe & Central Asia, Latin America & Caribbean islands,
Middle East & North Africa, South Asia, and Sub Saharan Africa regions contribute
barely about 30 per cent of the world’s total Gross National Income. Their GNI per
capita is less than one-tenth of the per capita GNI in high income group countries.
16 http://en.wikipedia.org/wiki/Poverty, retrieved on 21-09-2014

114
These figures indicate that a substantial proportion of world’s population living,
especially in rural areas of Asia, Africa and Latin America is affected by poverty
related problems in one form or the other. A thorough discussion of the level of
poverty in different regions of the world and related issues are presented in this
section.
4.3 (i): Rural Poverty in Asia17
Map-4.I: GNI Per Capita among the Asian Countries (2009)
Source: http://www.ruralpovertyportal.org/region/home/tags/asia
Asia, having roughly 17 per cent of the world’s surface area, is home to nearly
two-thirds of the world’s population, numbering about 4 billion people. Though the
region has the benefit of varied climatic conditions and agro-ecological zones, large
areas of the continent are subjected to degradation over the past fifty years and the
rural people of this region share a number of social and demographic characteristics
like limited access to land, large size families, low level of education and higher
degree of underemployment.
17 http://www.ruralpovertyportal.org/region/home/tags/asia, retrieved on 30-05-2015
115
Poverty is more of a rural problem in Asia, which shelters two-thirds of the
world’s poverty stricken population. Roughly 80 to 90 per cent of the population lives
in villages in this continent. These people lack the basic amenities like clean and safe
water supply, sanitation and electricity. They have limited access to technology,
equipments and credit and are also constrained by lack of information, collective
organizations and bargaining power that deprives them of the ability to compete on
equal terms in the marketplace.
4.3 (ii): Eastern Asia
Eastern Asia region has been the focal point of “Economic Miracle” that was
achieved in the last three decades, wherein the Gross Domestic Product grew at the
rate of 7 to 10 per cent per annum and poverty was reduced by around two-thirds. A
significant contribution to this appreciable economic upsurge came from agricultural
growth, especially in the countries where land distribution was done on an egalitarian
basis, the economy experienced stable macroeconomic policies and trade policies
were relatively open. China stands out among those nations.
4.3 (iii): South-Eastern Asia
South-Eastern Asia akin to neighbouring Eastern Asia had witnessed a striking
economic revival in the last three decades. Gross National Income had been growing
at 4.4 per cent per annum and poverty had been reduced by two-thirds. But, in the
recent few years this region has been dealt with two devastating blows in the form
HIV/AIDS pandemic and the tsunami. The dreaded disease which is increasingly
affecting the rural poor, if unchecked, will wane all the gains made in the region by
reducing rural poverty. Tsunami that killed people by thousands, destroyed countless
number of villages and fishing communities has reduced the livelihoods of the victims
to precarious condition.
4.3 (iv): Southern Asia
Southern Asia is lagging behind their other Asian counterparts in terms of
economic resurgence. In the past three decades the economy might have grown by 4
to 6 per cent per annum, but, the Gross National Income registered only a modest 1.4
per cent growth. In spite of a decline in the poverty to the tune of one-third, the
incidence of poverty in terms of percentage of population living below the
Government fixed poverty line has been higher in Southern Asia than in any other
region of the world, except the Sub-Saharan Africa. Gender inequalities have been the

116
highest in this region and women suffer severe social deprivation. Ratio of women to
men is only 94:100 in Southern Asia while it is 106:100 worldwide.
4.3 (v): Central Asia
Many of the Central Asian countries, consolidating their independence, have
been undergoing periods of impressive economic transition. Structural adjustment
programmes and privatization of agricultural sector are taking place. Small, privately
owned enterprises have been carved out of large state-run farms. The new farm
entrepreneurs have neither the management skills and cultivation technology, nor the
capital to adopt innovations. Poverty among mountain communities remains
practically untouched as these areas have remained out of the influence of economic
revival efforts. Herders and small farmers in these areas are facing severe scarcity of
resources and the land, their most valuable possession, is becoming progressively
more degraded. Since men migrate to urban areas in search of employment, women
are left with twin burdens of farming and family maintenance.
4.3 (vi): Western Asia
Agro-ecological base in Western Asia is fragile and population growth rate
has been persistently high. Urban-centric Government policies and investments have
cast a shadow of neglect on the rural sector, which shelters 60 to 70 per cent of the
poor. This negligence has resulted in poor infrastructure, high rates of illiteracy, weak
local institutions and large scale migration of rural youth to urban areas. Political
uncertainties and economic crisis have been threatening livelihoods of poor,
increasing the poverty rates and income inequalities. In Armenia, Georgia and
Azerbaijan, escalating costs of energy such as fossil fuel, electricity and gas has left
the poor in the lurch. It has affected their income on the one hand and has degraded
the environment on the other, propelled by deforestation to fulfill their fuel wood
needs. Introduction of fees for health care has deprived the poor of access to health
care services. Civil conflict and burgeoning refugee population is pouring misery in to
the already brimming cup of woes. Turkey is the only country in Western Asia which
has been successful in reducing rural poverty over the past decade. But, even in that
country problem of wide income disparities persists and about 30 per cent of the
people live without satisfactory basic needs.

117
4.4: Rural Poverty in Africa18
Africa is the second largest continent after Asia. It is divided in to Northern
Africa and Sub-Saharan Africa by the vast Sahara desert. Like in other regions of the
world with low income, in Africa too poverty is primarily rural. Paradoxically, even
though more than 70 per cent of the population in the continent lives in rural areas and
depend on agriculture for livelihood, development assistance for that sector has been
decreasing. Sub-Saharan Africa is home for more than 280 million people, living
mostly in Eastern and Southern Africa, who are suffering from acute poverty. This
area has one of the world’s highest concentrations of poor people and incidence of
poverty, in this region, is increasing at a faster rate than the population. Overall the
tempo of poverty reduction in most of Africa has slowed down since the 1970s.
Map-4.II: GNI Per Capita among the African Countries (2009)
Source: http://www.ruralpovertyportal.org/region/home/tags/africa
18 http://www.ruralpovertyportal.org/region/home/tags/africa, retrieved on 30-05-2015

118
The roots of rural poverty in most of the regions in Africa can be traced back
to the policy and institutional restraints imposed on the poor people by the colonial
system. In the recent decades efforts are being made to close the income gap through
appropriate economic policies and institutional frameworks. Unfortunately, structural
adjustments attempted earnestly have been successful in dismantling the old rural
systems, but have often failed to build new ones. As a result, many of the economies
in the transitional stage are characterized by continuing stagnation, poor production,
low incomes and increasing vulnerability of the poor. The problems pestering the
rural mass include lack of access to markets for the poor who are weakly organized,
poverty alleviation programs and social safety nets not reaching them and the
Government policies and investments in poverty reduction being largely pro-urban.
A major devastating health problem changing the rural poverty profile in
Africa, in the recent times, is HIV/AIDS. It is exerting a severe strain on the rural
livelihood, whose primary income earning asset is their labour. It is unfortunate that
two-thirds of the 34 million people in the world suffering from HIV/AIDS live in the
African Continent.
4.4 (i): Western and Middle Africa
In the countries like Angola, Burundi, Mozambique and Uganda located in
Western and Middle Africa, where three-fourths of poor people or more than 90
million people live in rural areas and depend on agriculture for their livelihood are
affected by warfare. In these conflict-torn countries continuous wars between tribes
and countries have curtailed the capacity of poor people to make livelihood and per
capita food production has plummeted. Land degradation, deforestation, and
overgrazing have reached alarming proportions and have further threatened the
livelihood security of the vulnerable poor.
4.4 (ii): Eastern and Southern Africa
Rural poverty status is deteriorating by the day in Eastern and Southern
Africa, where more than 130 million poor people live in rural areas. Half of the
countries in the region have an average annual per capita income of less than US $
400. More than 85 per cent of the rural poor live on land that has medium to high
potential for enhancing productivity. But, unfortunately, declining development
assistance to agriculture has a negative impact on farming which primarily consists of
119
small holdings. The poorest people in this part of Africa live in the desert or semi-arid
land that forms nearly 40 per cent of the land base. Consequently agriculture
productivity of labour is either stagnating or decreasing.
4.4 (iii): Northern Africa
In Northern Africa too poverty is concentrated in rural areas. However, the
percentage of rural people living below the national poverty lines from as low as 6 per
cent in Tunisia to as high as 87 per cent in Sudan and 90 per cent in Somalia. Primary
cause for rural poverty in the region is scarcity of good arable land and irrigation
water, followed by the havoc caused by droughts and floods. In Somalia and Sudan
highly populated with poor people, political conflict has disrupted agriculture and
consequently has aggravated poverty. Stumbling blocks in the way of rural poverty
alleviation in Northern Africa are poor transport and social infrastructure, high rates
of illiteracy, especially among women, weak local institutions, poor integration with
national economy and migration of rural youth to urban areas. Countries such as
Egypt and Tunisia embarked on structural adjustments, aiming at reducing poverty.

120
4.5: Rural Poverty in Latin America19
Map-4.III: GNI Per Capita among the Latin American Countries (2009)
Source: http://www.ruralpovertyportal.org/region/home/tags/americas
19 http://www.ruralpovertyportal.org/region/home/tags/americas, retrieved on 30-05-2015

121
4.5 (i): Northern America
The two large countries of Northern America, United States of America and
Canada are associated with prosperity than poverty. Both provide aid to poor
countries on a large scale. Yet there are islands of poverty, especially in the rural
areas, amidst the ocean of prosperity in the rich North America.
In USA more than 14 per cent of the rural population and around 12 per cent
of the urban population lived below the poverty line in 2002. Rural poverty was
concentrated more in certain parts of south and west. Poverty rates are higher for
minorities than for non-Hispanic whites. More than a quarter of rural Hispanics,
blacks and indigenous Americans such as American Indians, Intuits and Aleuts live in
poverty. Family structure is the key factor in prevalence of poverty among these
groups. For rural families headed by a single adult, particularly a woman, the poverty
rate in 2002 was 10 percentage points greater than for urban families headed by
women.
In rural Canada, the incidence of poverty averaged 14 per cent in 2000.
Between 1980 and 2000 the incidence of poverty in rural areas declined by 2 per cent
from 16 per cent in all the regions except British Columbia. In contrast the urban
poverty increased from 16 per cent to 18 per cent. The provinces with the highest
rural poverty were Newfoundland and Labrador, Saskatchewan and New Brunswick.
Almost half of indigenous people living on reserves are affected by poverty.
4.5 (ii): Central America
In Mexico that lies as a bridge between richer countries in the Northern
America and poorer countries to the south and east, including parts of Central and
South America and the Caribbean islands, the northern provinces closer to USA are
wealthier and in the southern parts poverty is concentrated in rural areas. Price of
maize, cultivation of which is the main source of income and food security for most of
the poor farmers, in the international market and competition from the subsidized
maize cultivators in USA were the major threats to poor farmers in Mexico. About 45
per cent of the rural households in that country were poor in 2002 and 50 per cent of
them were extremely poor not capable of meeting the cost of a basic food basket.
Half of Central America’s population is affected by poverty and in the rural
areas two-thirds of the people are poor. Among them three-fourth of the poor are
incapable of meeting their basic nutritional needs. The main reason for this state of

122
affair is that income from exports of agricultural products and textiles is controlled by
a few large-scale landowners and entrepreneurs.
Honduras tops the list of poverty affected economies in Central America with
about 75 per cent of its rural population living in poverty and 63 per cent of them in
extreme poverty. Next in the line are Guatemala with 54 per cent of rural people,
Nicaragua and El Salvador with 47 per cent of the rural people reeling under poverty.
Performance of Panama and Costa Rica is comparatively better as the population
below poverty line in those countries stand at 37 per cent and 23 per cent respectively.
Among the rural poor in that region the most vulnerable are the indigenous
communities, with the lowest levels of income and without access to basic services
such as housing, health care and education.
4.5 (iii): South America
In South American region 70 per cent of the population is urban based and
existence of urban slums is widespread. So, poverty is perceived as an urban
phenomenon in this part of the world. Even then, poverty affects a higher proportion
of the population in rural areas. Brazil has more than 20 million rural poor most of
whom are living in the arid north-east. Migration of rural poor to metropolitan areas
such as Sao Paulo and Rio de Janeiro is common. The most vulnerable among them
are the indigenous farming communities living in the remote mountain areas in
Bolivia, Peru and Ecuador. About 35 per cent of the poorest people in the region are
eking out a living in the ruthless Andean environment. Even in the southern part of
South America, poverty is deepest among the indigenous communities residing in
Chile and Argentina.
Lack of access to and unequal distribution of productive land, inadequate
access to information and productive assets, geographical isolation, limited public
investment in education, health services and housing are the main causes for
incidence of poverty in South America. Market oriented policies of the Governments
have led to a decline in investments in rural areas and increase in the woes of poverty.
Rural women are the worst affected among the poor as they suffer the consequences
of internal conflicts and migration of men both within and outside their countries.
123
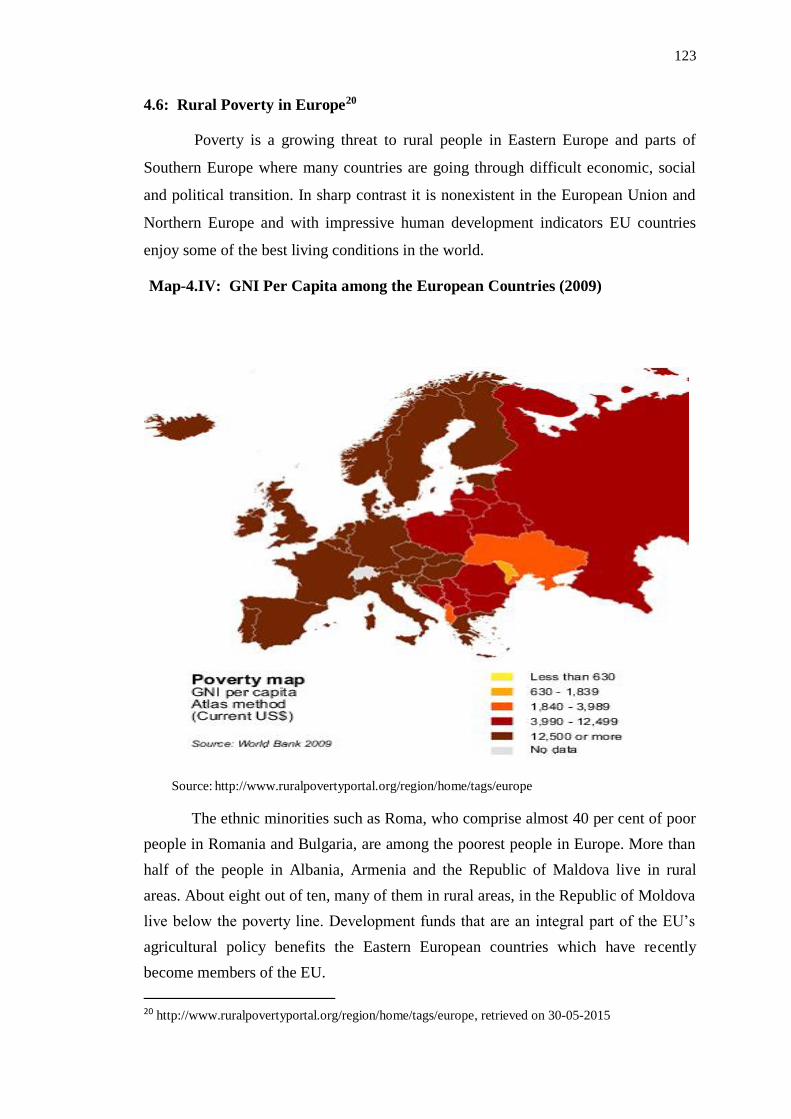
4.6: Rural Poverty in Europe20
Poverty is a growing threat to rural people in Eastern Europe and parts of
Southern Europe where many countries are going through difficult economic, social
and political transition. In sharp contrast it is nonexistent in the European Union and
Northern Europe and with impressive human development indicators EU countries
enjoy some of the best living conditions in the world.
Map-4.IV: GNI Per Capita among the European Countries (2009)
Source: http://www.ruralpovertyportal.org/region/home/tags/europe
The ethnic minorities such as Roma, who comprise almost 40 per cent of poor
people in Romania and Bulgaria, are among the poorest people in Europe. More than
half of the people in Albania, Armenia and the Republic of Maldova live in rural
areas. About eight out of ten, many of them in rural areas, in the Republic of Moldova
live below the poverty line. Development funds that are an integral part of the EU’s
agricultural policy benefits the Eastern European countries which have recently
become members of the EU.
20 http://www.ruralpovertyportal.org/region/home/tags/europe, retrieved on 30-05-2015
124
4.6 (i): Eastern Europe (including the Newly Independent States)
Till the collapse of the Communist system in Eastern Europe people enjoyed
secure employment and assured income. But, after those countries became
independent, poverty has escalated in that region at unparalleled alacrity. One-fifth of
the population in that region lives below poverty line in the recent times.
Privatization of former collective and state farms has rendered the rural
workers jobless sans alternative employment opportunities. On the one hand, these
private farms have disowned the social assets such as schools, health care centers and
community centers and on the other, public administrations lack the necessary
financial and institutional capacity to manage them. So, many rural people are forced
to migrate to urban areas in search of livelihood. Scarcity of land and fragmentation
of land holdings has also contributed to rise in rural poverty in Romania and Bulgaria.
In Bosnia, Herzegovina and Albania loss of assets due to recent conflicts has
deepened rural poverty. Many rural poor people depend on the remittances from
family members who have emigrated for their living.
4.7: A Comparison of Poverty Rates across the Regions over the Years
The World Bank Statistics presented in Table 4.4 indicates that poverty rates
at international poverty lines i.e., people living on less than 2005 PPP $2 a day,
decreased between 1981 and 2008, in East Asia and pacific, Europe and Central Asia,
Latin America and Caribbean and Middle East and North Africa, both in absolute
terms, in spite of growth in population and percentage-wise. In East Asia and Pacific
the population below poverty line (BPL) got halved from 1313 million in 1981 to 659
million in 2008. During the same period the percentage of population BPL found
three fold decline from 92.4 per cent to 33.2 per cent. In Europe and Central Asia the
percentage of population BPL dwindled by nearly four times from 8.3 per cent to 2.2
per cent between 1981 and 2008, while it got halved from 23.8 per cent to 12.4 per
cent in Latin America and Caribbean and decreased from 30.1 per cent to 13.9 per
cent in Middle East and North Africa. Decrease in poverty rates in absolute numbers
can also be observed from the Table 4.4. The exceptions are South Asia and Sub-
Saharan Africa, where, though poverty rates in percentage terms have reduced
marginally, the number of people suffering from this malady has increased by about
50 per cent. This calls for furthering of poverty alleviation efforts on war footing in
South Asia and Sub-Saharan Africa.

125
Table-4.4: Poverty Rates at International Poverty Lines
Sl.
No. Region or Country 1981 1990 1999 2008
Million (%) Million (%) Million (%) Million (%)
1 East Asia & Pacific 1313 92.4 1334 81 1138 61.7 659 33.2 2 China 972 97.8 961 84.6 770 61.4 395 29.8 3 Europe & Central
Asia 36 8.3 32 6.9 57 12.1 10 2.2 4 Latin America &
Caribbean 87 23.8 98 22.4 111 22 71 12.4 5 Middle East & North
Africa 52 30.1 53 23.5 60 22 44 13.9 6 South Asia 811 87.2 959 83.6 1069 77.8 1125 70.9 7 India 621 86.6 722 82.6 818 78.9 862 72.4 8 Sub Saharan Africa 288 72.2 389 76 503 77.4 562 69.2
Total 2585 69.6 2864 64.6 2937 57.4 2471 43
Source: World Development Indicators. 2012, pp. 72
Note: International Poverty Line refers to people living on less than 2005 PPP $ 2 a day
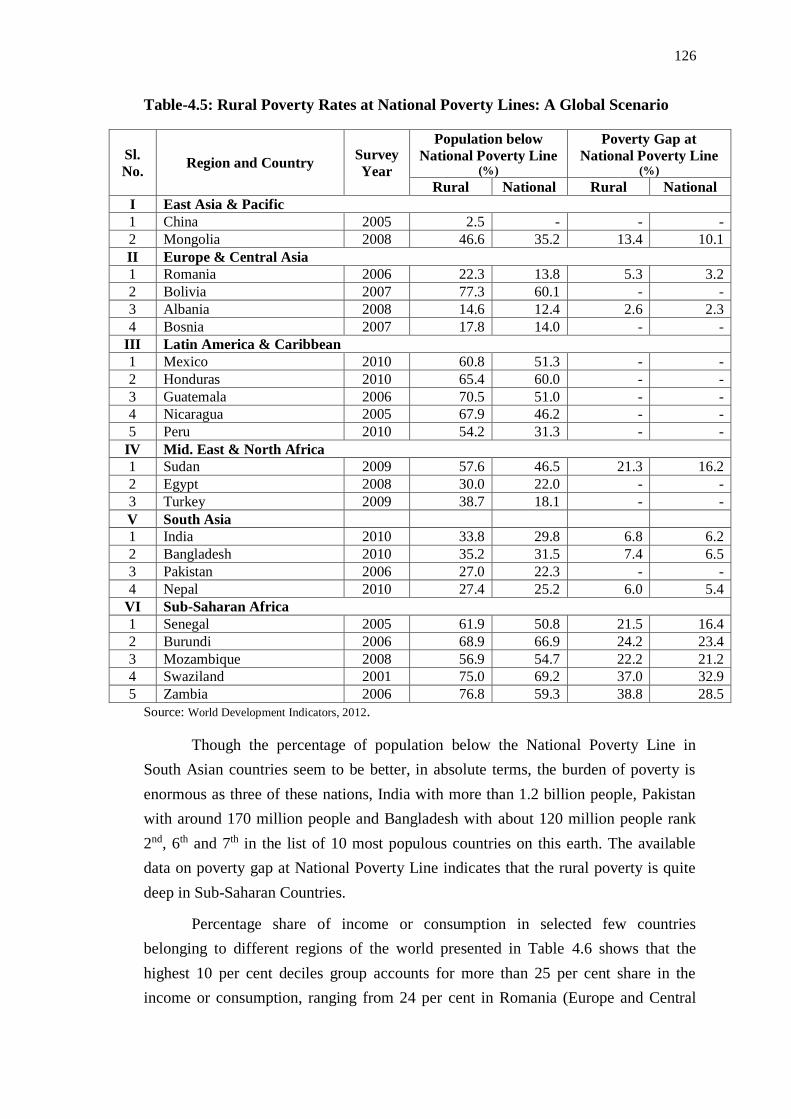
It can be observed from Table 4.5 that, it is the rural areas which house the
larger proportion of the poor in all the countries mentioned in the table, without an
exception. Percentage of rural population below the National Poverty Line is higher in
the regions of Latin America and Caribbean and Sub-Saharan Africa compared to
Europe and Central Asia and South Asia. Rural poverty rates of 70.5 per cent in
Guatemala, 67.9 per cent in Nicaragua, 65.4 per cent in Honduras, and 60.8 per cent
in Mexico in Latin America and Caribbean region and 76.8 per cent in Zambia, 75.0
per cent in Swaziland, 68.9 per cent in Burundi and 61.9 per cent in Senegal speak
themselves regarding the extent of misery persisting in the rural areas of those
regions.
126
Table-4.5: Rural Poverty Rates at National Poverty Lines: A Global Scenario
Sl.
No. Region and Country
Survey
Year
Population below
National Poverty Line (%)
Poverty Gap at
National Poverty Line (%)
Rural National Rural National
I East Asia & Pacific
1 China 2005 2.5 - - -
2 Mongolia 2008 46.6 35.2 13.4 10.1
II Europe & Central Asia
1 Romania 2006 22.3 13.8 5.3 3.2
2 Bolivia 2007 77.3 60.1 - -
3 Albania 2008 14.6 12.4 2.6 2.3
4 Bosnia 2007 17.8 14.0 - -
III Latin America & Caribbean
1 Mexico 2010 60.8 51.3 - -
2 Honduras 2010 65.4 60.0 - -
3 Guatemala 2006 70.5 51.0 - -
4 Nicaragua 2005 67.9 46.2 - -
5 Peru 2010 54.2 31.3 - -
IV Mid. East & North Africa
1 Sudan 2009 57.6 46.5 21.3 16.2
2 Egypt 2008 30.0 22.0 - -
3 Turkey 2009 38.7 18.1 - -
V South Asia
1 India 2010 33.8 29.8 6.8 6.2
2 Bangladesh 2010 35.2 31.5 7.4 6.5
3 Pakistan 2006 27.0 22.3 - -
4 Nepal 2010 27.4 25.2 6.0 5.4
VI Sub-Saharan Africa
1 Senegal 2005 61.9 50.8 21.5 16.4
2 Burundi 2006 68.9 66.9 24.2 23.4
3 Mozambique 2008 56.9 54.7 22.2 21.2
4 Swaziland 2001 75.0 69.2 37.0 32.9
5 Zambia 2006 76.8 59.3 38.8 28.5
Source: World Development Indicators, 2012.
Though the percentage of population below the National Poverty Line in
South Asian countries seem to be better, in absolute terms, the burden of poverty is
enormous as three of these nations, India with more than 1.2 billion people, Pakistan
with around 170 million people and Bangladesh with about 120 million people rank
2nd, 6th and 7th in the list of 10 most populous countries on this earth. The available
data on poverty gap at National Poverty Line indicates that the rural poverty is quite
deep in Sub-Saharan Countries.
Percentage share of income or consumption in selected few countries
belonging to different regions of the world presented in Table 4.6 shows that the
highest 10 per cent deciles group accounts for more than 25 per cent share in the
income or consumption, ranging from 24 per cent in Romania (Europe and Central

127
Asia) to 55 per cent in Namibia (Sub-Saharan Africa) and the highest 20 per cent
deciles group garners 38 to 68 per cent share in the income or expenditure, again in
Romania and Namibia, respectively. However, the percentage share of income or
expenditure in the lowest 10 per cent deciles group ranged from a meagre 0.8 per cent
in Brazil (Latin America and Caribbean) to a low 4 per cent in India (South Asia)
Kazkhstan (Europe and Central Asia). This highlights the income disparity among the
poor and rich groups in the economy.
Gini Index indicates the income inequality that exists in an economy. ‘Zero’
Gini index shows perfect equality and a Gini index of ‘Hundred’ indicates perfect
inequality. The countries Namibia with a Gini Index of 63.9 had very high income or
consumption inequality, followed by Brazil (54.7), Rwanda (50.8), Jamaica (45.5) and
China (42.5). Comparatively India had a better performance with a Gini Index of
33.4.
Table-4.6: Distribution of Income or Consumption in Different Regions of the World
Sl. No.
Region or Country Survey Year
Gini Index
Percentage Share of
Income or Consumption
Lowest
10 %
Lowest
20 %
Highest
20 %
Highest
10 %
I East Asia & Pacific
1 China 2005 42.5 1.8 5 47.9 32
2 Mangolia 2008 36.5 3 7.1 44 28.4
II Europe & Central Asia
1 Romania 2009 30 3.4 8.3 38.3 23.5
2 Kazakhstan 2009 29 4 9.1 38.4 23.8
III Latin America & Caribbean
1 Brazil 2009 54.7 0.8 2.9 58.6 42.9
2 Jamaica 2004 45.5 2.3 5.4 51.6 35.9
IV Middle East & North Africa
1 Egypt 2008 30.8 4 9.2 40.3 26.6
2 Sudan 2009 35.3 2.7 6.8 42.4 26.7
V South Asia
1 India 2005 33.4 3.8 8.6 42.4 28.3
2 Bangladesh 2010 32.1 4 8.9 41.4 27
VI Sub Saharan Africa
1 Rwanda 2011 50.8 2.1 5.2 56.8 43.2
2 Namibia 2004 63.9 1.4 3.2 68.6 54.8
Source: World Development Indicators. 2012, pp. 75-76
128
4.8: Unemployment
“Unemployment is the state of the labour force without work but available for and
seeking employment.”
– World Bank21
“Unemployed are members of the economically active population who are without
work but available for and seeking work, including people who have lost their jobs or
who have voluntarily left work.”
– World Bank22
The main challenges faced by rural work force are low pay, poor quality jobs,
widespread underemployment, inadequate social protection and lack of support by
law. Productive employment helps the people to move out of poverty. Though a
gradual decline in the rate of population growth has begun in the recent years,
between 1961 and 2000, the world’s rural population increased by 1.2 billion and is
expected to continue to grow for some more time. About 75 per cent of the world’s
poor live in rural areas. Since the extent and severity of poverty are greater in rural
areas as compared to urban areas, providing productive employment to the rural
workers is a major development challenge.
In most of the developing nations women form the mainstay of agriculture
sector and rural labour force. They take the major responsibility in sowing,
intercultural operations, post-harvest activities and off-farm income generation
activities. Migration of men to urban areas or their shift to non-farm activities leads to
“Feminization” of agricultural work.
Abundance of labour and high population pressure on land results in
involuntary unemployment. Weather uncertainties and price volatility often reduce
overall demand for labour. Large oscillations in demand for labour and labour
productivity throughout the agricultural cycle results in seasonal employment
patterns, seasonal migration, intra-year wage variations, widespread
underemployment and dominance of casual over permanent employment. Wage
earnings during busy season are often insufficient to sustain them during the lean
season and the agriculture labour tend to migrate. Such seasonal migration can be
welfare enhancing.
21 The World Bank (2012), World Development Indicators, International Bank for Reconstruction and
Development, Washington DC, USA, pp. 22. 22 Ibid,
129
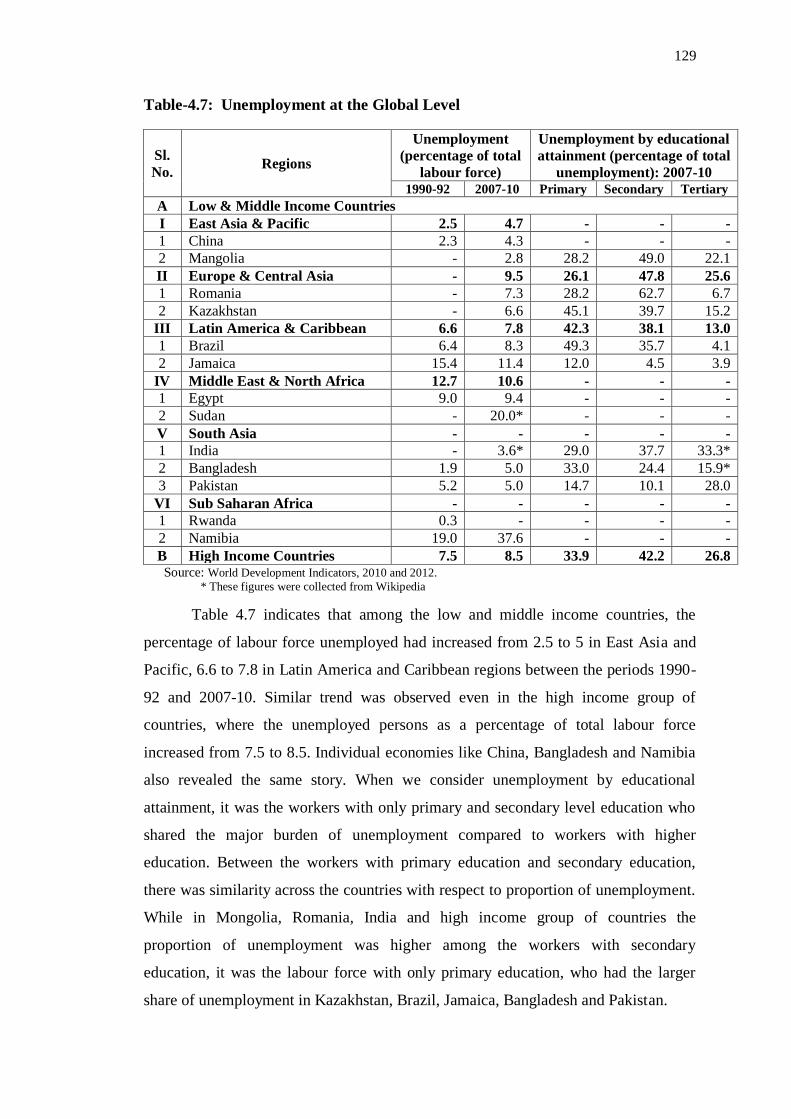
Table-4.7: Unemployment at the Global Level
Sl.
No. Regions
Unemployment
(percentage of total
labour force)
Unemployment by educational
attainment (percentage of total
unemployment): 2007-10 1990-92 2007-10 Primary Secondary Tertiary
A Low & Middle Income Countries
I East Asia & Pacific 2.5 4.7 - - -
1 China 2.3 4.3 - - -
2 Mangolia - 2.8 28.2 49.0 22.1
II Europe & Central Asia - 9.5 26.1 47.8 25.6
1 Romania - 7.3 28.2 62.7 6.7
2 Kazakhstan - 6.6 45.1 39.7 15.2
III Latin America & Caribbean 6.6 7.8 42.3 38.1 13.0
1 Brazil 6.4 8.3 49.3 35.7 4.1
2 Jamaica 15.4 11.4 12.0 4.5 3.9
IV Middle East & North Africa 12.7 10.6 - - -
1 Egypt 9.0 9.4 - - -
2 Sudan - 20.0* - - -
V South Asia - - - - -
1 India - 3.6* 29.0 37.7 33.3*
2 Bangladesh 1.9 5.0 33.0 24.4 15.9*
3 Pakistan 5.2 5.0 14.7 10.1 28.0
VI Sub Saharan Africa - - - - -
1 Rwanda 0.3 - - - -
2 Namibia 19.0 37.6 - - -
B High Income Countries 7.5 8.5 33.9 42.2 26.8 Source: World Development Indicators, 2010 and 2012.
* These figures were collected from Wikipedia
Table 4.7 indicates that among the low and middle income countries, the
percentage of labour force unemployed had increased from 2.5 to 5 in East Asia and
Pacific, 6.6 to 7.8 in Latin America and Caribbean regions between the periods 1990-
92 and 2007-10. Similar trend was observed even in the high income group of
countries, where the unemployed persons as a percentage of total labour force
increased from 7.5 to 8.5. Individual economies like China, Bangladesh and Namibia
also revealed the same story. When we consider unemployment by educational
attainment, it was the workers with only primary and secondary level education who
shared the major burden of unemployment compared to workers with higher
education. Between the workers with primary education and secondary education,
there was similarity across the countries with respect to proportion of unemployment.
While in Mongolia, Romania, India and high income group of countries the
proportion of unemployment was higher among the workers with secondary
education, it was the labour force with only primary education, who had the larger
share of unemployment in Kazakhstan, Brazil, Jamaica, Bangladesh and Pakistan.

130
The Second Annual Employment and Unemployment Survey Report (2011-
12) by the Labour Bureau, GOI23 states that "according to International Labour
Organization (ILO) the world unemployment rate in 2001 was 6 per cent. The Euro-
zone had an unemployment rate of 11 per cent and the countries in that zone which
were most affected by the sovereign debt crisis had higher unemployment rates
amounting to 25 per cent in Spain, 21 per cent in Greece and over 14 per cent in
Ireland. The Economist has reported that some of the countries outside the Euro-zone
which had higher unemployment rates were South Africa (24 per cent), Egypt (12 per
cent) and USA (8 per cent). Compared to these countries, India was in a better
position with an All-India unemployment rate of 3.8 per cent estimated as per usual
principal status approach"24.
In summary, it can be said that the countries with higher population, majority
of them being less developed, have higher proportion of people residing in rural areas
and their main source of livelihood comes from agriculture sector. Heavy dependence
of labour force on agriculture in these developing countries, which is beset with
problems of seasonality of production, low technology adoption, low productivity,
high output, price and income uncertainty has pushed the rural work force in to
unemployment, underemployment and disguised unemployment. This status of rural
labour force has placed the rural population in the perpetual condition of poverty and
hunger. It is the priority of all states to fight the malady of poverty on war-footing.
The Governments in power in all those countries have been implementing poverty
alleviation programmes either on their own or with the financial support from
international agencies and developed nations. Some of such efforts made in different
countries are discussed briefly in the next chapter.
23 Government of India, (2012), Report on Second Annual Employment and Unemployment Survey
(2011-12), Labour Bureau, Ministry of Labour and Employment, Chandigarh, pp. iv. 24 Ibid,