Embed Size (px)
Citation preview
CHAPTER - IV
PROFILE OF THE STUDY AREA
Origin and History of Kanyakumari District
Kanyakumari district has its ancient history dating back to
the ‘Sangam Age’ a ‘Cradle of Civilization’ in this part of India. The
district has a large number of historic monuments and temples. A
series of ‘Kingdoms’ are known to have ruled Kanyakumri, most
important being the Cheras, the Cholas and the Pandyas. Up to
early 50’s of the 20th Century, this region was part of Travancore
Samasthan, present day Kerala State, where the Tamil speaking
majority population struggled much to merge with Tamil Nadu
state and as such Kanyakumari district became part of Tamil
Nadu, after the constitution of the state Re-organising Commission
of 1956. On the recommendations of the Commission, it was
rearranged that Agasteeswaram, Thovalai, Kalkulam, Vilacancode
and Senkottai taluks were given to Tamil Nadu state among which
the first four taluks were grouped to form a new Kanyakumari
district. On Ist November 1956, the present Kanyakumari district
came into existence with its headquarters at Nagercoil. 1
Kanyakumari district lies at the southern most tip of
peninsular India, where the Indian Ocean, the Arabian Sea and the
Bay of Bengal embrace one another. By its very location, this
district occupies a unique place among the districts of Tamil Nadu.
One of the most important pilgrim centres of India, Kanyakumari
(Cape Comerin) is very famous for its tourist attractions. Besides,
enjoying with comparatively high rates of rainfall and fertile soils,
the district is also called Nanjil Nadu, legendary for agricultural
productivity. Moreover, one could witness to ‘rare scene’ of the
setting of the sun and the rising of the moon simultaneously on a
full moon day at Cape Commerin in Kanyakumari. 2
Location
Kanyakumari district is situated in the southern tip of the
Indian sub-continent lying between 770-05 and 770-36 of the
eastern longitude and 8o-03 and 8o-35’ of the northern latitude.
Kanyakumari district has an area of 1672 sq.km. It is bounded by
Tirunelveli district in the north and north – east, Kerala State in
the north –west and sea in the west and south.
On the basis of physiography, the district can be divided into
three natural divisions. North-eastern portion of the district
comprises of the eastern portion of the Kalkulam and Vilavancode
taluks. The north-eastern portion of the Thovalai taluk constitutes
a mountainous division with spurs from Western Ghats running
into it. In the extreme west and south west of the district is the sea
coast which is flat and fairly fertile. The land along the sea coast is
called the low lands. In between the mountainous region (high
land) and the sea coast (low land), there exists a strip of undulating
valley (midlands) with a few streams available for cultivation.3 A
geographical map is also depicted in this chapter to correctly locate
the study area.
Population in Kanyakumari District
The total area of Kanyakumari district is 1672 sp.km. Its
population is 1676034, and of this 832269 are males and 843765
are females. The total rural population is 582761 and the urban
1087002. According to 2001 census, the density of population in
Kanyakumari district is 999 per sq.km and total literates are
1308322.
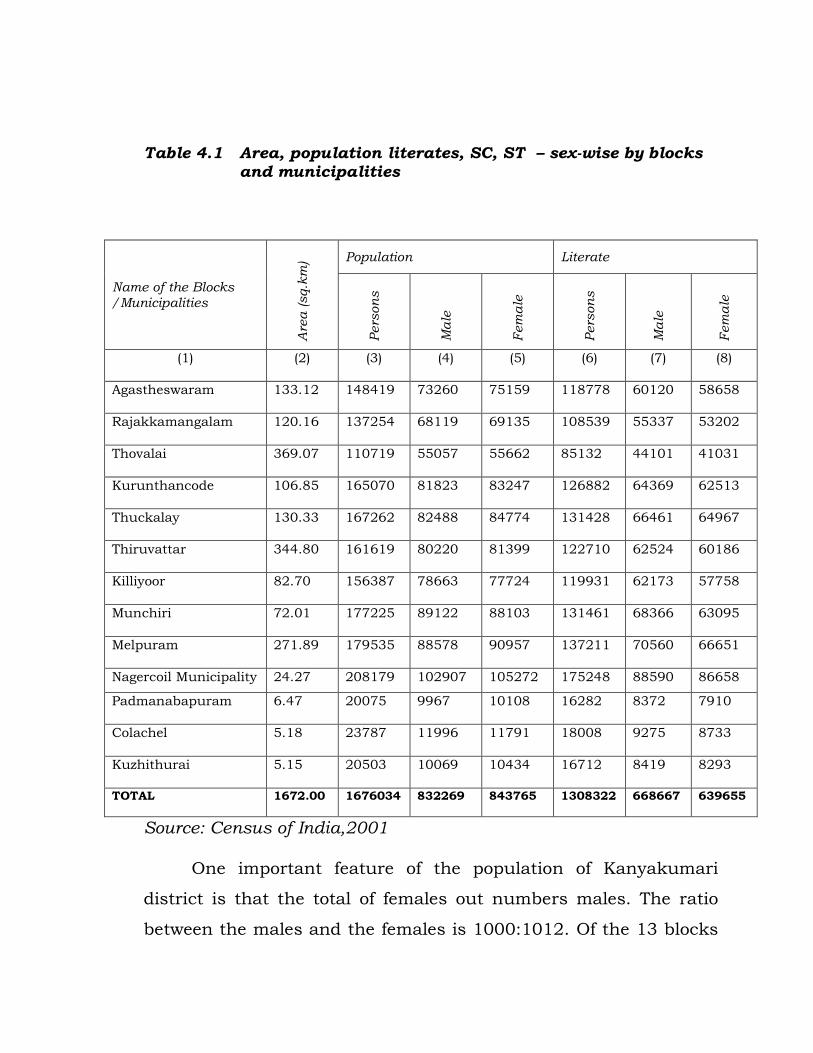
Table 4.1 Area, population literates, SC, ST – sex-wise by blocks and municipalities
Source: Census of India,2001
One important feature of the population of Kanyakumari
district is that the total of females out numbers males. The ratio
between the males and the females is 1000:1012. Of the 13 blocks
Name of the Blocks /Municipalities
Are
a (sq.k
m) Population Literate
Pers
on
s
Ma
le
Fem
ale
Pers
on
s
Ma
le
Fem
ale
(1) (2) (3) (4) (5) (6) (7) (8)
Agastheswaram 133.12 148419 73260 75159 118778 60120 58658
Rajakkamangalam 120.16 137254 68119 69135 108539 55337 53202
Thovalai 369.07 110719 55057 55662 85132 44101 41031
Kurunthancode 106.85 165070 81823 83247 126882 64369 62513
Thuckalay 130.33 167262 82488 84774 131428 66461 64967
Thiruvattar 344.80 161619 80220 81399 122710 62524 60186
Killiyoor 82.70 156387 78663 77724 119931 62173 57758
Munchiri 72.01 177225 89122 88103 131461 68366 63095
Melpuram 271.89 179535 88578 90957 137211 70560 66651
Nagercoil Municipality 24.27 208179 102907 105272 175248 88590 86658
Padmanabapuram 6.47 20075 9967 10108 16282 8372 7910
Colachel 5.18 23787 11996 11791 18008 9275 8733
Kuzhithurai 5.15 20503 10069 10434 16712 8419 8293
TOTAL 1672.00 1676034 832269 843765 1308322 668667 639655
and municipalities, Agasteeswaram block, Melpuram block,
Nagercoil Municipality and Kuzhithurai block, we can find that
females out number males and in all other blocks females are less.
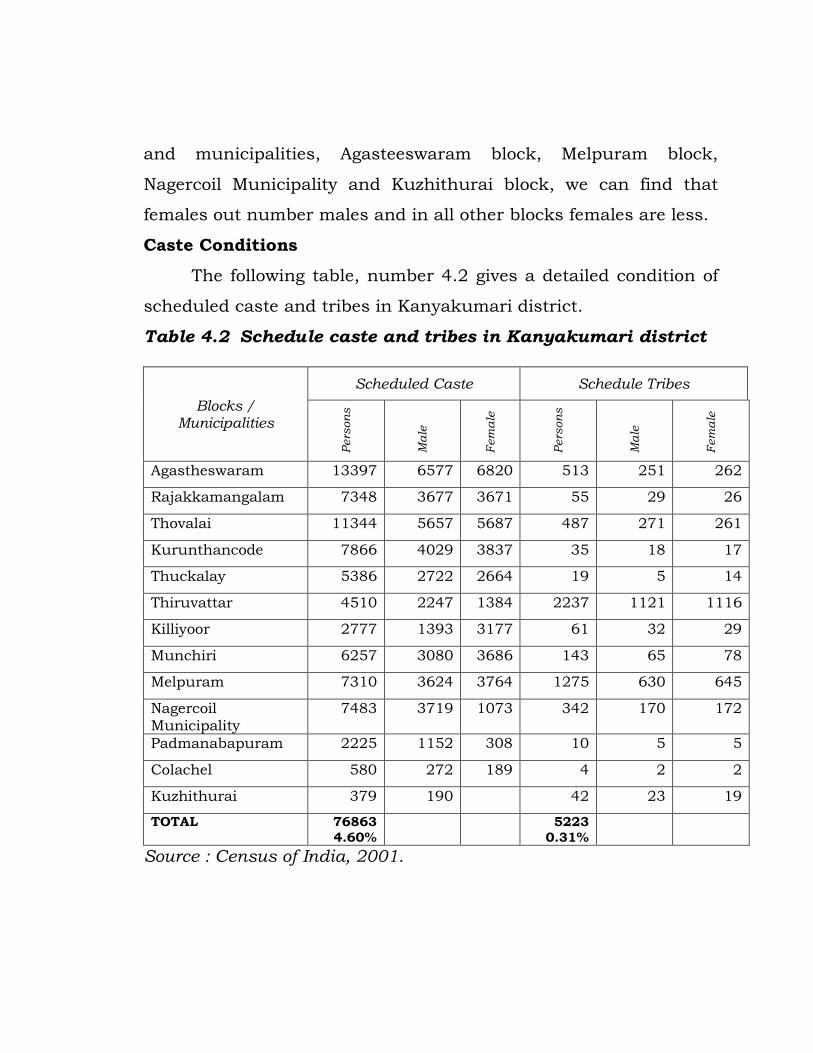
Caste Conditions
The following table, number 4.2 gives a detailed condition of
scheduled caste and tribes in Kanyakumari district.
Table 4.2 Schedule caste and tribes in Kanyakumari district
Blocks / Municipalities
Scheduled Caste Schedule Tribes
Pers
on
s
Ma
le
Fem
ale
Pers
on
s
Ma
le
Fem
ale
Agastheswaram 13397 6577 6820 513 251 262
Rajakkamangalam 7348 3677 3671 55 29 26
Thovalai 11344 5657 5687 487 271 261
Kurunthancode 7866 4029 3837 35 18 17
Thuckalay 5386 2722 2664 19 5 14
Thiruvattar 4510 2247 1384 2237 1121 1116
Killiyoor 2777 1393 3177 61 32 29
Munchiri 6257 3080 3686 143 65 78
Melpuram 7310 3624 3764 1275 630 645
Nagercoil Municipality
7483 3719 1073 342 170 172
Padmanabapuram 2225 1152 308 10 5 5
Colachel 580 272 189 4 2 2
Kuzhithurai 379 190 42 23 19
TOTAL 76863 4.60%
5223 0.31%
Source : Census of India, 2001.
Out of the total population of Kanyakumari district 4.60
percent are scheduled castes and 0.31 percent are scheduled
tribes.
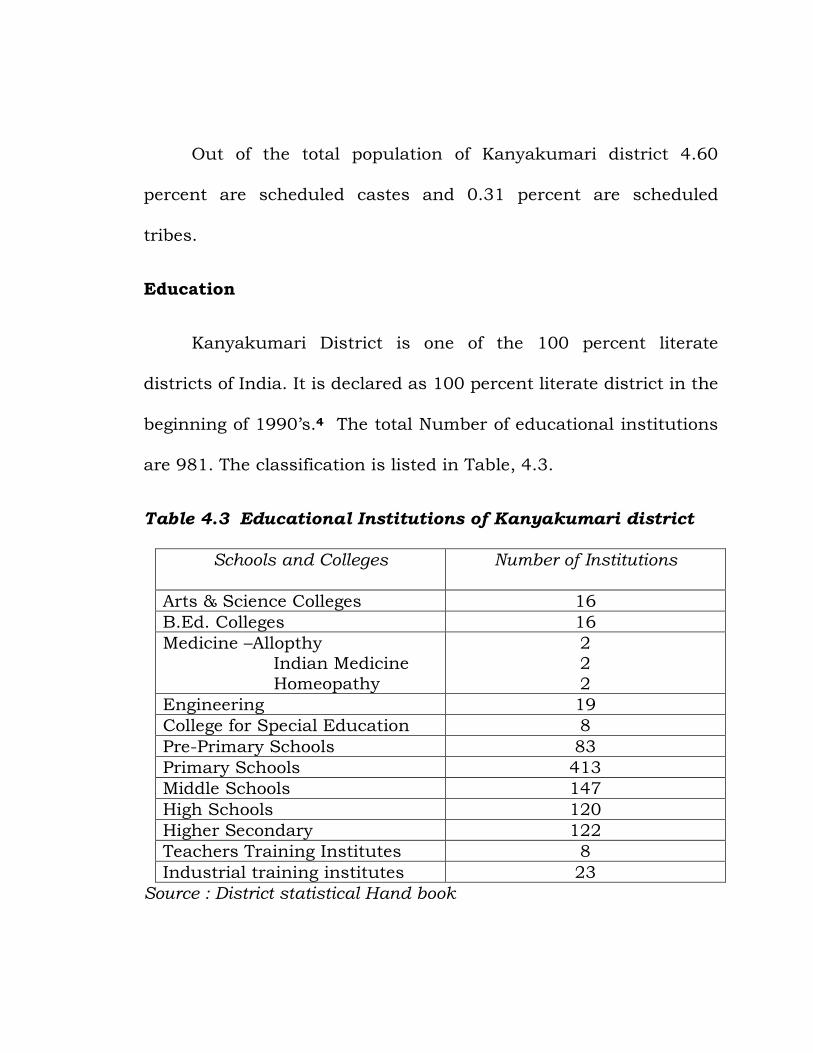
Education
Kanyakumari District is one of the 100 percent literate
districts of India. It is declared as 100 percent literate district in the
beginning of 1990’s.4 The total Number of educational institutions
are 981. The classification is listed in Table, 4.3.
Table 4.3 Educational Institutions of Kanyakumari district
Schools and Colleges Number of Institutions
Arts & Science Colleges 16
B.Ed. Colleges 16
Medicine –Allopthy Indian Medicine
Homeopathy
2 2
2
Engineering 19
College for Special Education 8
Pre-Primary Schools 83
Primary Schools 413
Middle Schools 147
High Schools 120
Higher Secondary 122
Teachers Training Institutes 8
Industrial training institutes 23
Source : District statistical Hand book
Financial Resources
In terms of banking coverage, Kanyakumari district could be
considered as one of the well-banked districts of Tamil Nadu. There
are 114 branches of different commercial banks, spread over 103
centres of the district. Indian Overseas Bank has been considered
to be the lead bank of the district for distributing the necessary
loans and advances to farmers, industrial workers and other
industrial organizations of the district. 5
Soil Condition
Soil in the district is mostly of red loam variety. In the sea
coasts, the sandy type of soil prevails and near the mountain
regions gravelly soil is generally seen. In the lowlands there is
neither white sand nor sandy loam. The mid lands and high lands
contain fairly fertile soil. The valleys in the mid land have loamy
clay soil with high sand content. Generally, in the mid lands the
soil is clay loam of laterite origin with an admixture of gravel sand.6
Different categories of soil and the suitability of crops is
shown in the Table 4.4.
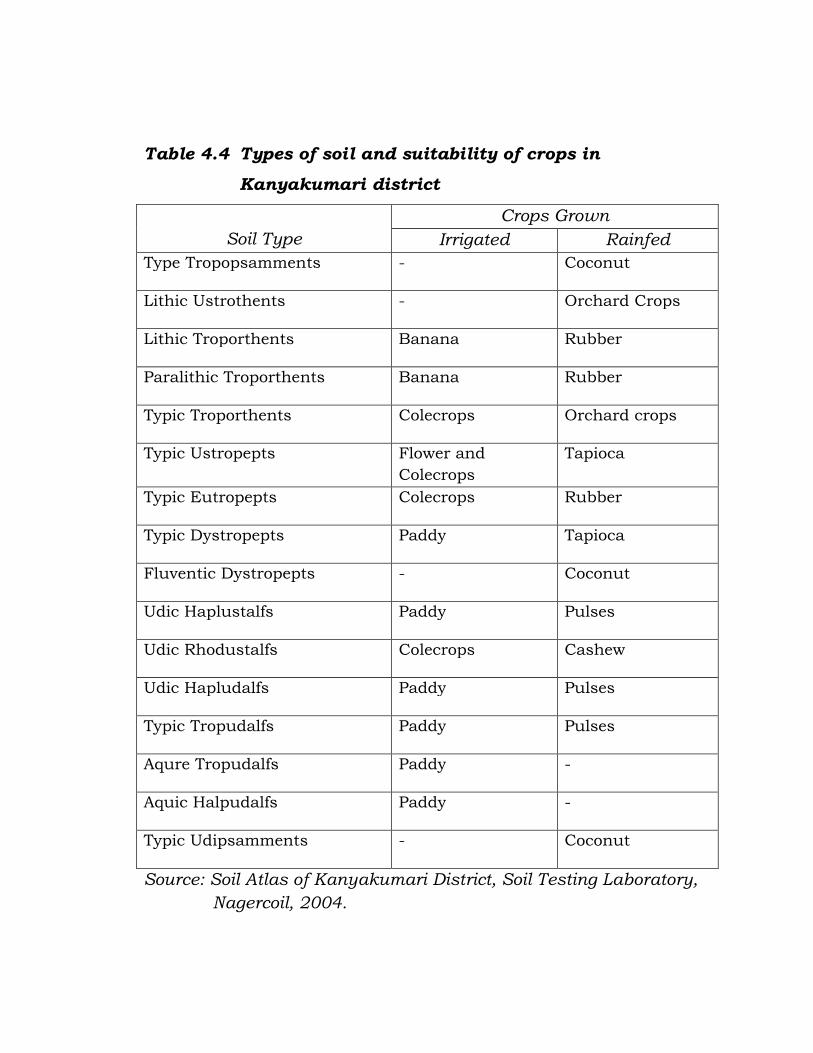
Table 4.4 Types of soil and suitability of crops in
Kanyakumari district
Soil Type
Crops Grown
Irrigated Rainfed
Type Tropopsamments - Coconut
Lithic Ustrothents - Orchard Crops
Lithic Troporthents Banana Rubber
Paralithic Troporthents Banana Rubber
Typic Troporthents Colecrops Orchard crops
Typic Ustropepts Flower and
Colecrops
Tapioca
Typic Eutropepts Colecrops Rubber
Typic Dystropepts Paddy Tapioca
Fluventic Dystropepts - Coconut
Udic Haplustalfs Paddy Pulses
Udic Rhodustalfs Colecrops Cashew
Udic Hapludalfs Paddy Pulses
Typic Tropudalfs Paddy Pulses
Aqure Tropudalfs Paddy -
Aquic Halpudalfs Paddy -
Typic Udipsamments - Coconut
Source: Soil Atlas of Kanyakumari District, Soil Testing Laboratory,
Nagercoil, 2004.
The soil fertility is given in terms of the contents of nitrogen,
phosphorus and potash. The soil in most of the blocks have low
contents of nitrogen, phosphorous and potash while the soil in the
Killiyoor and Agasteeswaram blocks have medium content of
potash. Diverse soils promote cultivation of diverse crops over the
different parts of the district.
Climate
The District has a favourable agro-climatic condition which is
suitable for growing a number of crops. The proximity of the
equator, its topography and other climate factors favour the growth
of various crops. The paddy varieties grown in the second crop
season in Thovalai and Agasteeswaram taluks are grown during the
first crop season in Kalkulam and Vilavancode taluks. This shows
that there is distinct variation in the climate conditions prevailing
within the district. Unlike other districts in Tamil Nadu, it has a
rainfall both during the South West and the North East monsoons.
The South West monsoon period starts from the month of June and
ends in September, while the North East monsoon period starts
from October and ends in the middle of December. The average
rainfall is shown in Table 4.5.
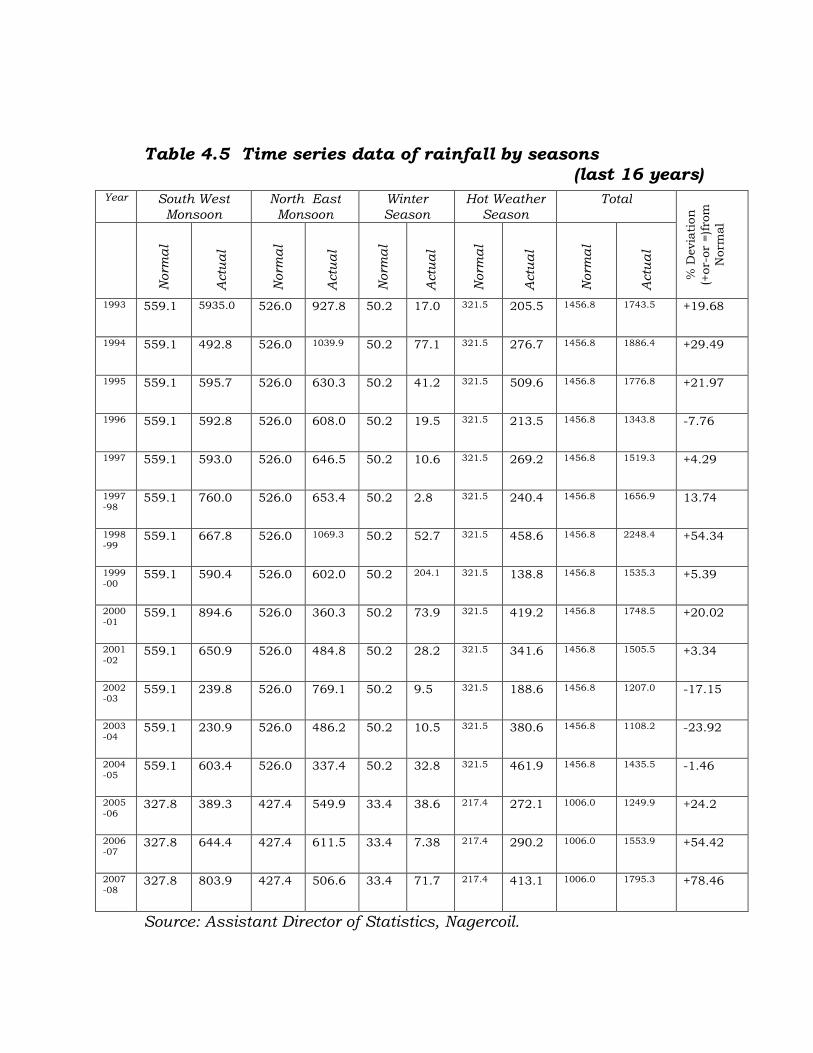
Table 4.5 Time series data of rainfall by seasons (last 16 years)
Source: Assistant Director of Statistics, Nagercoil.
Year South West Monsoon
North East Monsoon
Winter Season
Hot Weather Season
Total
% D
evia
tion
(+or-
or
=)fro
m
Norm
al
Norm
al
Actu
al
Norm
al
Actu
al
Norm
al
Actu
al
Norm
al
Actu
al
Norm
al
Actu
al
1993 559.1 5935.0 526.0 927.8 50.2 17.0 321.5 205.5 1456.8 1743.5 +19.68
1994 559.1 492.8 526.0 1039.9 50.2 77.1 321.5 276.7 1456.8 1886.4 +29.49
1995 559.1 595.7 526.0 630.3 50.2 41.2 321.5 509.6 1456.8 1776.8 +21.97
1996 559.1 592.8 526.0 608.0 50.2 19.5 321.5 213.5 1456.8 1343.8 -7.76
1997 559.1 593.0 526.0 646.5 50.2 10.6 321.5 269.2 1456.8 1519.3 +4.29
1997-98
559.1 760.0 526.0 653.4 50.2 2.8 321.5 240.4 1456.8 1656.9 13.74
1998-99
559.1 667.8 526.0 1069.3 50.2 52.7 321.5 458.6 1456.8 2248.4 +54.34
1999-00
559.1 590.4 526.0 602.0 50.2 204.1 321.5 138.8 1456.8 1535.3 +5.39
2000-01
559.1 894.6 526.0 360.3 50.2 73.9 321.5 419.2 1456.8 1748.5 +20.02
2001-02
559.1 650.9 526.0 484.8 50.2 28.2 321.5 341.6 1456.8 1505.5 +3.34
2002-03
559.1 239.8 526.0 769.1 50.2 9.5 321.5 188.6 1456.8 1207.0 -17.15
2003-04
559.1 230.9 526.0 486.2 50.2 10.5 321.5 380.6 1456.8 1108.2 -23.92
2004-05
559.1 603.4 526.0 337.4 50.2 32.8 321.5 461.9 1456.8 1435.5 -1.46
2005-06
327.8 389.3 427.4 549.9 33.4 38.6 217.4 272.1 1006.0 1249.9 +24.2
2006-07
327.8 644.4 427.4 611.5 33.4 7.38 217.4 290.2 1006.0 1553.9 +54.42
2007-08
327.8 803.9 427.4 506.6 33.4 71.7 217.4 413.1 1006.0 1795.3 +78.46
The content of the above table shows that the quantum of
rainfall is subjected to severe fluctuations. The deviations from the
normal ranges from 478.40 % to 23.92%.
In Kanyakumari district, rainfall is distributed over four
seasons. They are south-west and north-east monsoons, winter
and hot weather season.
The south-west monsoon and north-east monsoon are more
effective in the district, contributing to an average of 1369.9 MM as
annual rainfall.
The season-wise distribution of rainfall in Kanyakumari
district shows the availability and flourishment of different crops.
The south-west monsoon extends up to the month of September
from June and the north-east starts in October and ends in
December. Greater concentration of rainfall exists during these two
monsoon seasons. The winter season is in the month of January
and February. In this season, the rainfall is extremely low. The
summer season begins in the month of March and ends in May.
The summer seasons enjoy a higher average rainfall than the
winter but less than in the monsoon seasons. Season-wise
distribution of normal rainfall is given in Table 4.6.
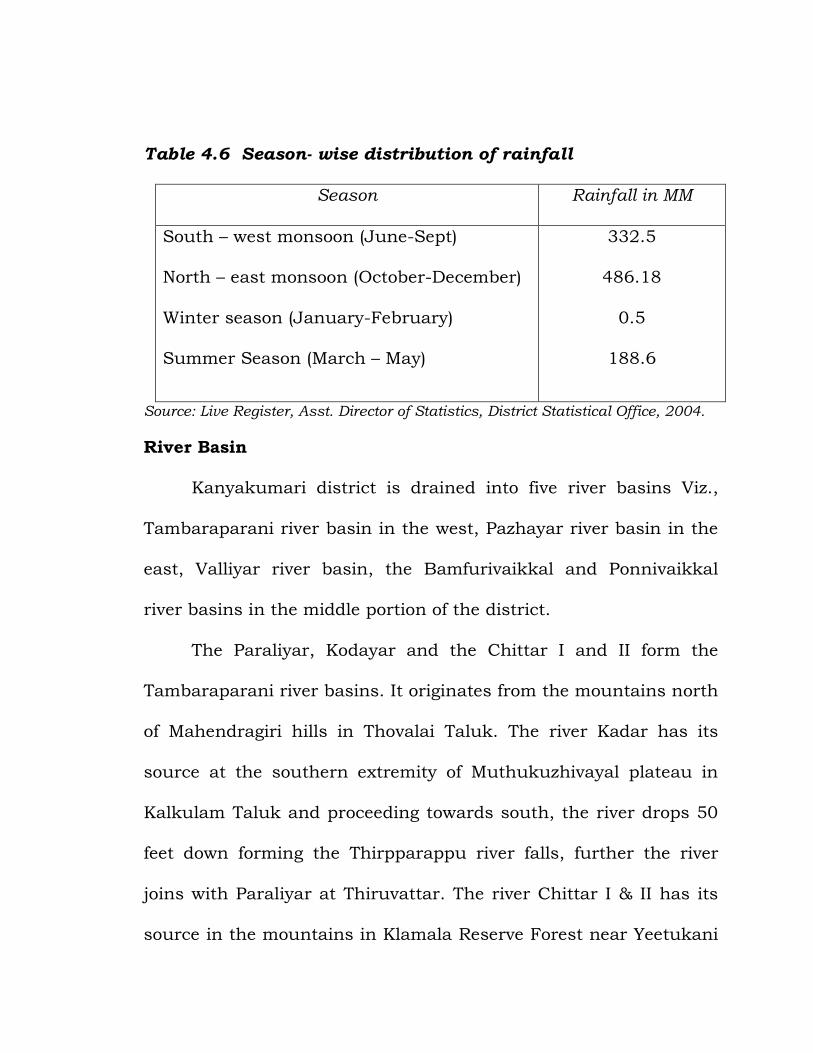
Table 4.6 Season- wise distribution of rainfall
Season Rainfall in MM
South – west monsoon (June-Sept)
North – east monsoon (October-December)
Winter season (January-February)
Summer Season (March – May)
332.5
486.18
0.5
188.6
Source: Live Register, Asst. Director of Statistics, District Statistical Office, 2004.
River Basin
Kanyakumari district is drained into five river basins Viz.,
Tambaraparani river basin in the west, Pazhayar river basin in the
east, Valliyar river basin, the Bamfurivaikkal and Ponnivaikkal
river basins in the middle portion of the district.
The Paraliyar, Kodayar and the Chittar I and II form the
Tambaraparani river basins. It originates from the mountains north
of Mahendragiri hills in Thovalai Taluk. The river Kadar has its
source at the southern extremity of Muthukuzhivayal plateau in
Kalkulam Taluk and proceeding towards south, the river drops 50
feet down forming the Thirpparappu river falls, further the river
joins with Paraliyar at Thiruvattar. The river Chittar I & II has its
source in the mountains in Klamala Reserve Forest near Yeetukani
and Vandiplaavukani. Both the rivers join the river Kodayar near
Alanchola and Thirpparappu village. Pazhayar originates in the
south of Mahendragiri peak surrounded by the Tirunelveli district
in the east, Tambaraparani river basin in the west and by the
Arabian Sea in the south. The Valliyar starts from Velimalai in
Kalkulam Taluk. The river Bomfurivaikkal originates from the hills
located near Valvachakostam Village. The Ponnivaikkal originates
from the Puliyadicheri hills.
Irrigation
Irrigation projects may be in the form of surface flow or
ground water irrigation. Surface flow irrigation covers rivers,
canals, tanks, springs and others and ground water through wells.
An account of these sources is given in Table 4.7.
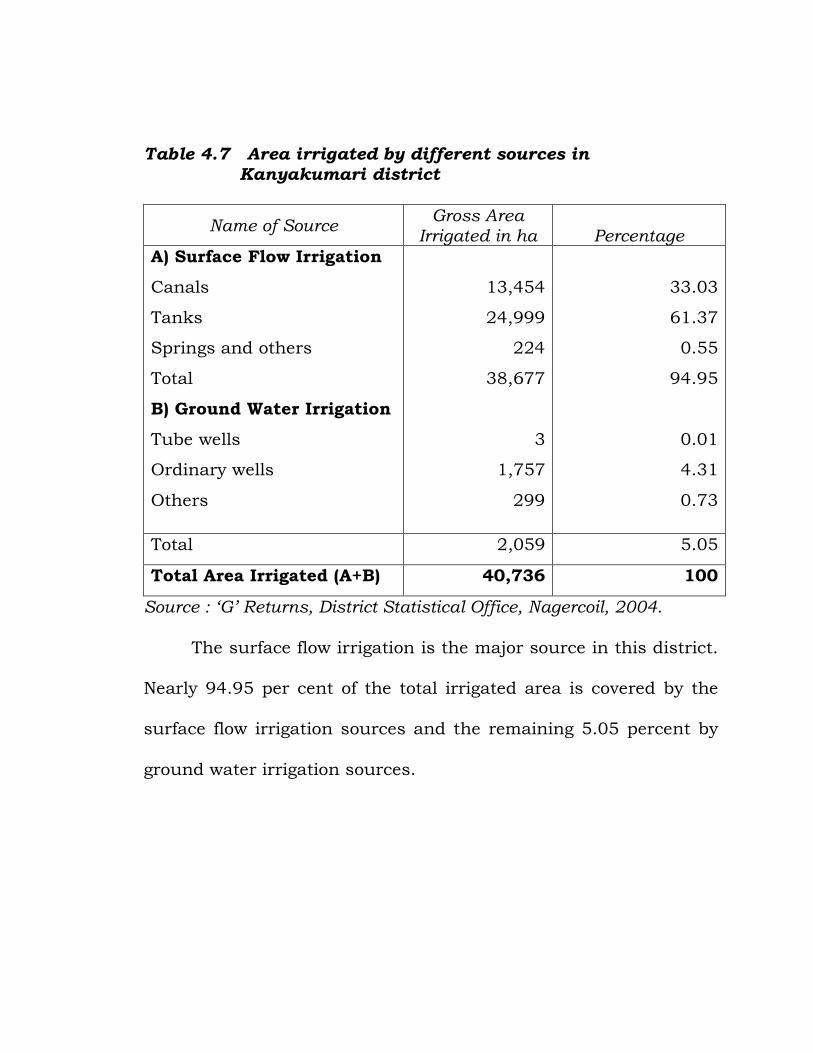
Table 4.7 Area irrigated by different sources in Kanyakumari district
Name of Source Gross Area
Irrigated in ha
Percentage
A) Surface Flow Irrigation
Canals
Tanks
Springs and others
Total
B) Ground Water Irrigation
Tube wells
Ordinary wells
Others
13,454
24,999
224
38,677
3
1,757
299
33.03
61.37
0.55
94.95
0.01
4.31
0.73
Total 2,059 5.05
Total Area Irrigated (A+B) 40,736 100
Source : ‘G’ Returns, District Statistical Office, Nagercoil, 2004.
The surface flow irrigation is the major source in this district.
Nearly 94.95 per cent of the total irrigated area is covered by the
surface flow irrigation sources and the remaining 5.05 percent by
ground water irrigation sources.
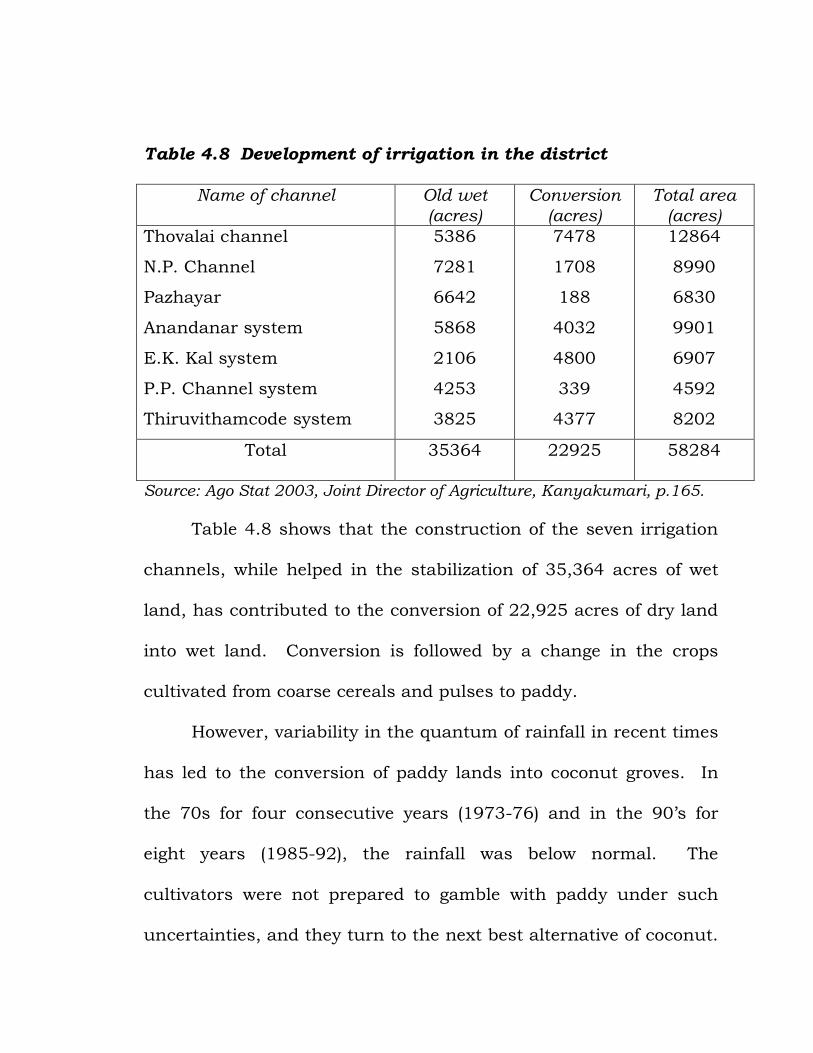
Table 4.8 Development of irrigation in the district
Name of channel Old wet
(acres)
Conversion
(acres)
Total area
(acres)
Thovalai channel
N.P. Channel
Pazhayar
Anandanar system
E.K. Kal system
P.P. Channel system
Thiruvithamcode system
5386
7281
6642
5868
2106
4253
3825
7478
1708
188
4032
4800
339
4377
12864
8990
6830
9901
6907
4592
8202
Total 35364 22925 58284
Source: Ago Stat 2003, Joint Director of Agriculture, Kanyakumari, p.165.
Table 4.8 shows that the construction of the seven irrigation
channels, while helped in the stabilization of 35,364 acres of wet
land, has contributed to the conversion of 22,925 acres of dry land
into wet land. Conversion is followed by a change in the crops
cultivated from coarse cereals and pulses to paddy.
However, variability in the quantum of rainfall in recent times
has led to the conversion of paddy lands into coconut groves. In
the 70s for four consecutive years (1973-76) and in the 90’s for
eight years (1985-92), the rainfall was below normal. The
cultivators were not prepared to gamble with paddy under such
uncertainties, and they turn to the next best alternative of coconut.
Coconut crop is found in the tail-end area of rivers and canals
because of repeated failure of paddy crop especially at the dough
stage caused by inadequate supply of water.
Irrigation Systems
The ancient irrigation works in this district dates back well
over thousand years. The Pandian dam across the river Paraliyar
and the feeding channel known as Pandiankal were constructed by
the ancient rulers about one thousand years ago. Table 4.9 lists
the rivers, dams and the canals of the districts.
Irrigation may be defined as the supply of water by human
efforts for the cultivation of crops. The function of irrigation is to
supplement the supplies of water obtained in the form of rain on
the area to be cultivated during the seasons and to extend required
water for the successful cultivation of crops.
In Kanyakumari district, rivers, dams, channels are the
important sources of irrigation. These sources are shown in
table 4.9.
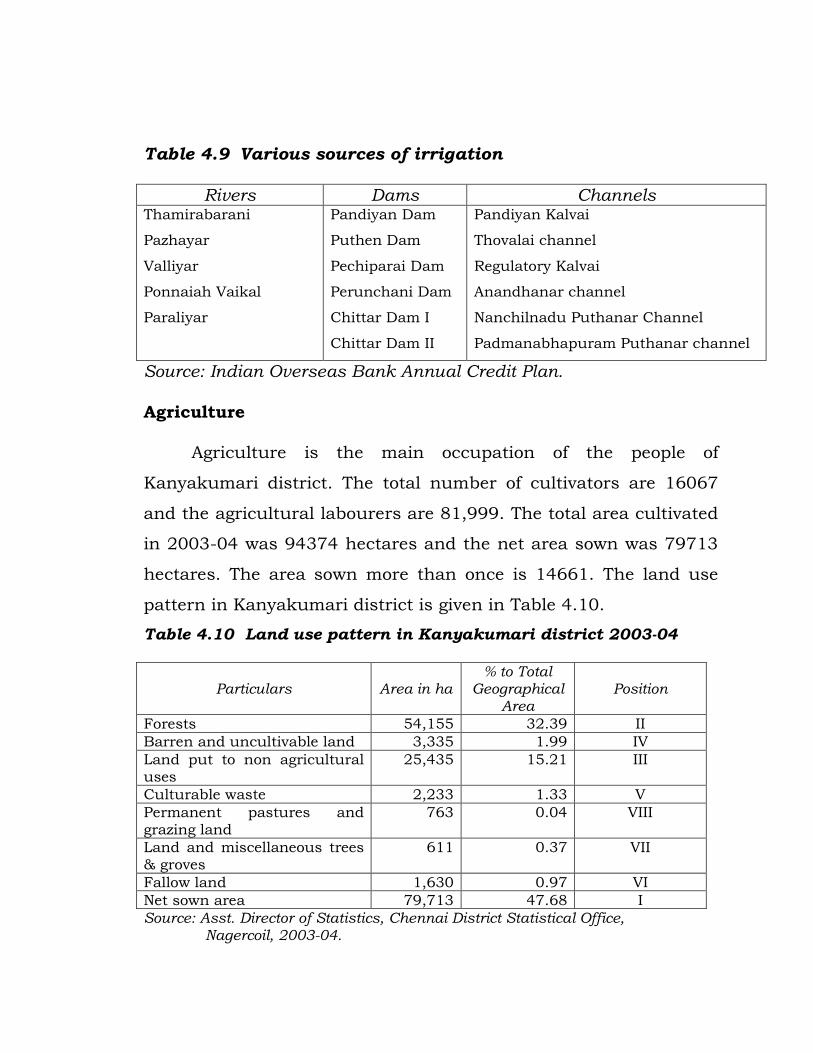
Table 4.9 Various sources of irrigation
Rivers Dams Channels Thamirabarani
Pazhayar
Valliyar
Ponnaiah Vaikal
Paraliyar
Pandiyan Dam
Puthen Dam
Pechiparai Dam
Perunchani Dam
Chittar Dam I
Chittar Dam II
Pandiyan Kalvai
Thovalai channel
Regulatory Kalvai
Anandhanar channel
Nanchilnadu Puthanar Channel
Padmanabhapuram Puthanar channel
Source: Indian Overseas Bank Annual Credit Plan.
Agriculture
Agriculture is the main occupation of the people of
Kanyakumari district. The total number of cultivators are 16067
and the agricultural labourers are 81,999. The total area cultivated
in 2003-04 was 94374 hectares and the net area sown was 79713
hectares. The area sown more than once is 14661. The land use
pattern in Kanyakumari district is given in Table 4.10.
Table 4.10 Land use pattern in Kanyakumari district 2003-04
Particulars Area in ha % to Total
Geographical Area
Position
Forests 54,155 32.39 II
Barren and uncultivable land 3,335 1.99 IV
Land put to non agricultural uses
25,435 15.21 III
Culturable waste 2,233 1.33 V
Permanent pastures and grazing land
763 0.04 VIII
Land and miscellaneous trees & groves
611 0.37 VII
Fallow land 1,630 0.97 VI
Net sown area 79,713 47.68 I
Source: Asst. Director of Statistics, Chennai District Statistical Office, Nagercoil, 2003-04.
The area under forests represents both government and
private lands covered by forests. In Kanyakumari district, 39 per
cent of the total area is occupied by forests. The barren and
uncultivable land comprises the land under mountains and
deserts. Such lands are not fit for cultivation purposes. Only 1.99
per cent of the total land has been identified as barren and
uncultivable.
The land put to non-agricultural uses covers the lands used
for the construction of buildings, roads, railways, the area covered
by water and similar other activities. This accounts for 1.21 per
cent. Culturable waste refers to the land which is available for
cultivation but not cultivated during the current year and previous
five years or more. Only 01.33 percent land account for this
culturable waste. Fallow land consists of current fallows and other
fallow lands. Current fallows are the cultivable lands which are
kept fallow after the harvest. This accounts for 0.97 percent.
The net area sown is the area cropped at least once in an
agricultural year. It accounted for 47.68 per cent to the total
geographical area in the year 2003-04.
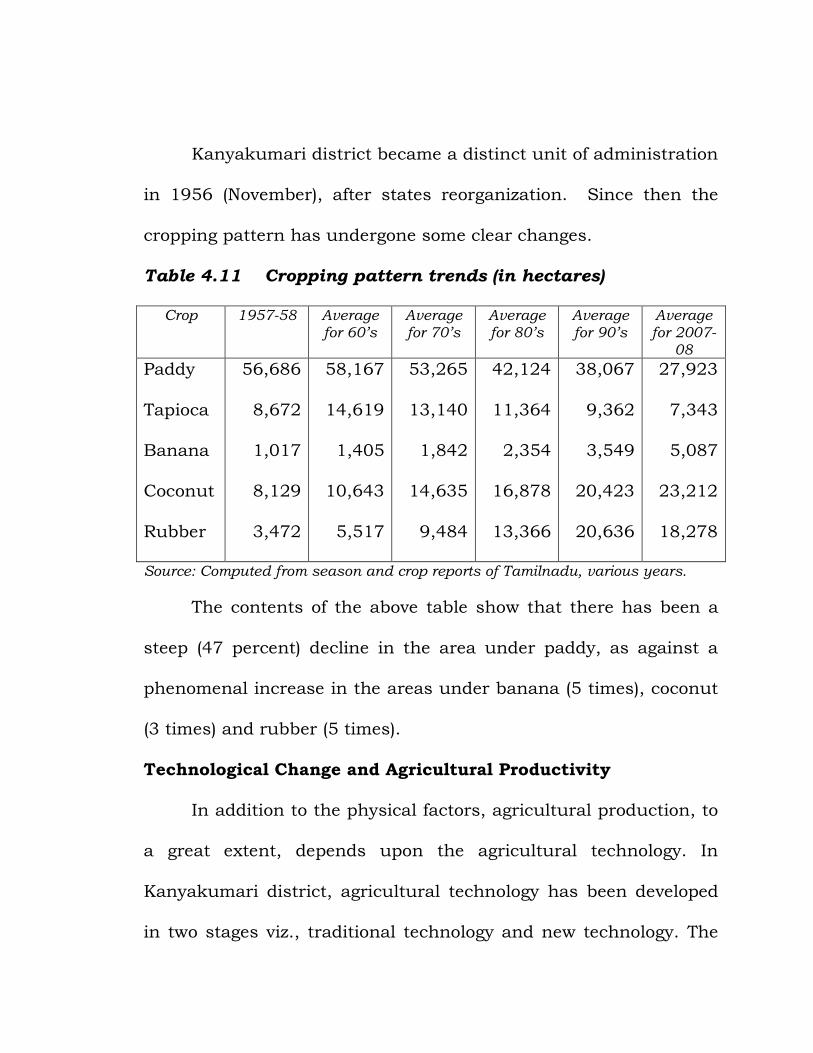
Kanyakumari district became a distinct unit of administration
in 1956 (November), after states reorganization. Since then the
cropping pattern has undergone some clear changes.
Table 4.11 Cropping pattern trends (in hectares)
Crop 1957-58 Average for 60’s
Average for 70’s
Average for 80’s
Average for 90’s
Average for 2007-
08
Paddy
Tapioca
Banana
Coconut
Rubber
56,686
8,672
1,017
8,129
3,472
58,167
14,619
1,405
10,643
5,517
53,265
13,140
1,842
14,635
9,484
42,124
11,364
2,354
16,878
13,366
38,067
9,362
3,549
20,423
20,636
27,923
7,343
5,087
23,212
18,278
Source: Computed from season and crop reports of Tamilnadu, various years.
The contents of the above table show that there has been a
steep (47 percent) decline in the area under paddy, as against a
phenomenal increase in the areas under banana (5 times), coconut
(3 times) and rubber (5 times).
Technological Change and Agricultural Productivity
In addition to the physical factors, agricultural production, to
a great extent, depends upon the agricultural technology. In
Kanyakumari district, agricultural technology has been developed
in two stages viz., traditional technology and new technology. The
traditional technology was in practice before the introduction of
new strategy of Green Revolution.7
Technological change in agriculture is concerned with the
adoption of new high yielding variety seeds, increased use of
chemical fertilizers, extensive use of plant protection chemicals,
improved agricultural tools and machinery. The adoption of these
components depends upon the factors like irrigation, size of farm
holdings, farm capital, price of produce and agricultural extension
service.
Fisheries
Kanyakumari district is famous for fish production. It has
both inland and coastal fishing centres. It has a long coastal line of
68 km. Fish find a good place in the diet of the people of
Kanyakumari district; a variety of fishes are produced in
Kanyakumari district. It has five coastal blocks and 42 coastal
landing centres. 37,250 tonnes of marine and 3708 tonnes of
inland fishes are produced annually in this district.
Industries
Kanyakumari district is an industrially backward district. It
has only 649 registered working factories. The number of large
scale industries are four and those of medium, small and cottage
industries are 645, 991 and 121 respectively. 8
The District Industrial Centre in Kanyakumari district
classified the existing industrial units into seven main groups.
(1) Agro-based Industries, (2) Forest-based industries, (3) Food-
based industries, (4) Chemical-based industries, (5) Electrical and
electronic industries, (6) Engineering industries and
(7) Miscellaneous industries. An agro-based industry is one which
produces things for the local market and uses agricultural products
as its main raw material. On the basis of this criteria, the District
Industrial Centre has identified nearly 287 variety of industrial
units as agro-based industries in Kanyakumari district. These
industries are located in rural areas and absorb the rural labour
supply for their existence.
THOVALAI TALUK
Thovalai taluk is spread over an area of 359 sq. km. flanked
on the north by the hills of the Western Ghats, on the east by
Tirunelveli district, west and south by Kalkulam and
Agasteeswaram taluks. The highest hill in the district is
Mahendragiri (165 m) of Thovalai taluk.
Population
In Thovalai taluk, there is no urban area and hence the entire
area of the taluk is considered as rural. The total population of the
taluk was 1,10,719 in 2001; out of the total population 55,057
were, males, 55,662 were females; 11.50% of the population
belongs to SC (high ratio in the district) 0.4% ST. The density of
population was only 265 per sq. km. (the lowest in the district). The
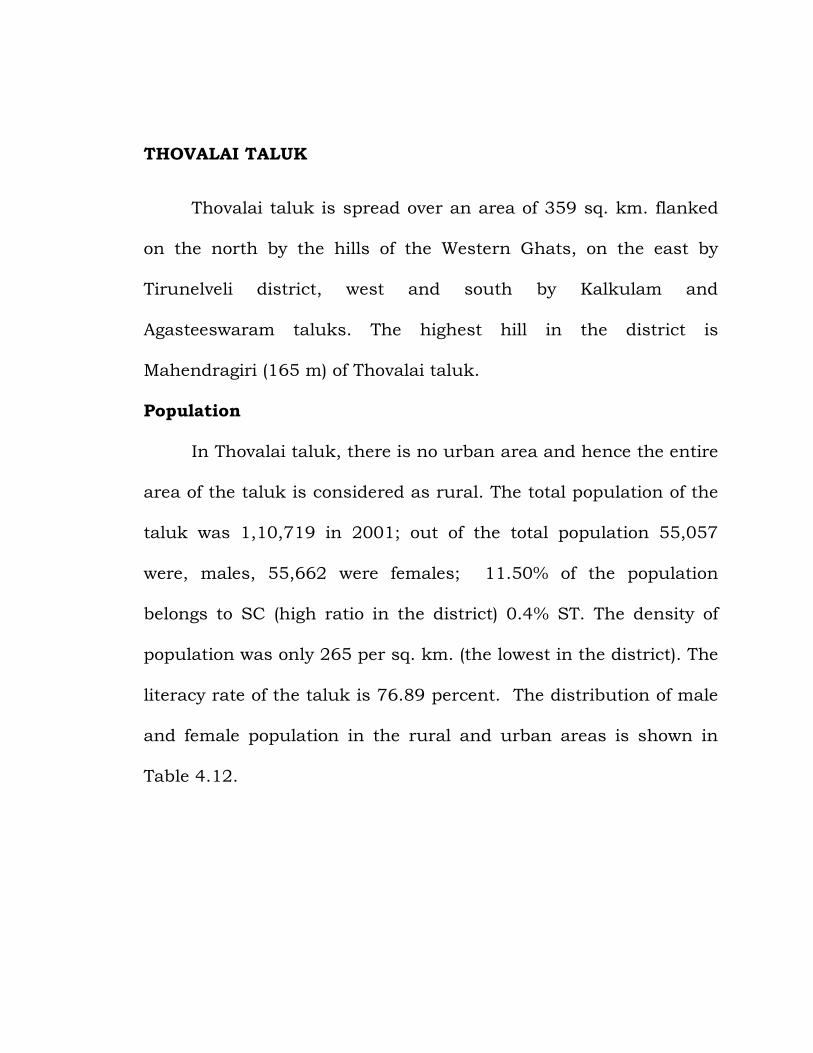
literacy rate of the taluk is 76.89 percent. The distribution of male
and female population in the rural and urban areas is shown in
Table 4.12.
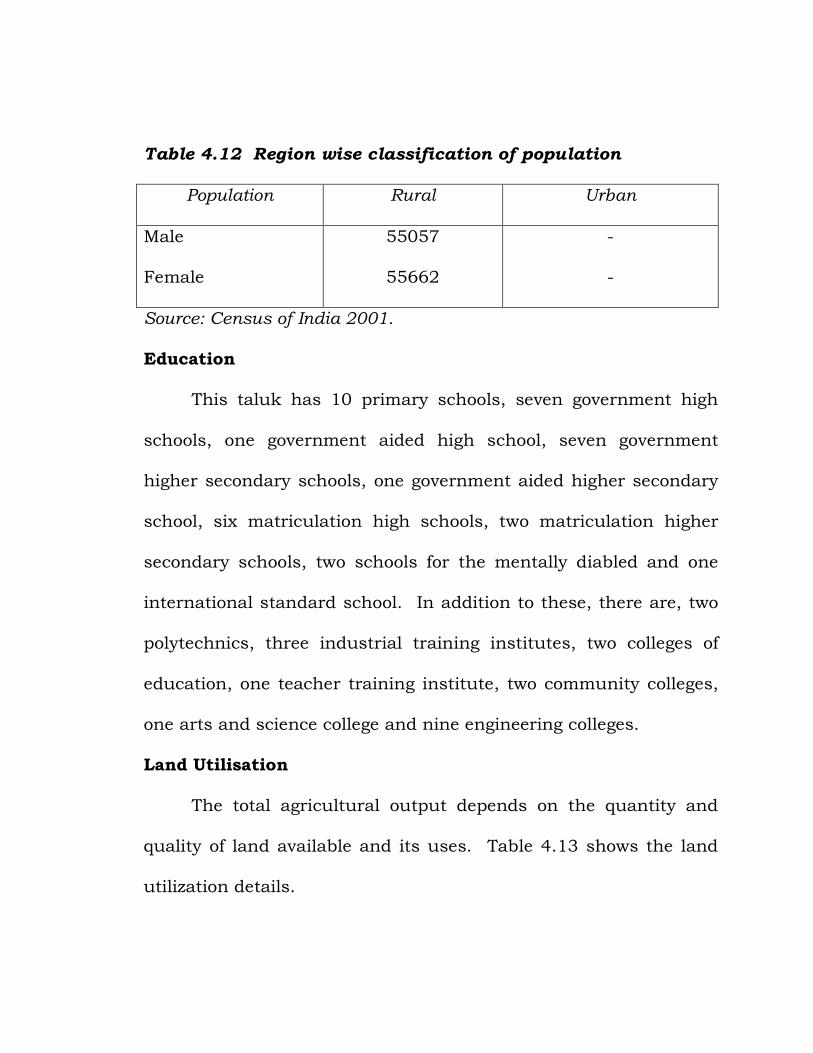
Table 4.12 Region wise classification of population
Population Rural Urban
Male
Female
55057
55662
-
-
Source: Census of India 2001.
Education
This taluk has 10 primary schools, seven government high
schools, one government aided high school, seven government
higher secondary schools, one government aided higher secondary
school, six matriculation high schools, two matriculation higher
secondary schools, two schools for the mentally diabled and one
international standard school. In addition to these, there are, two
polytechnics, three industrial training institutes, two colleges of
education, one teacher training institute, two community colleges,
one arts and science college and nine engineering colleges.
Land Utilisation
The total agricultural output depends on the quantity and
quality of land available and its uses. Table 4.13 shows the land
utilization details.
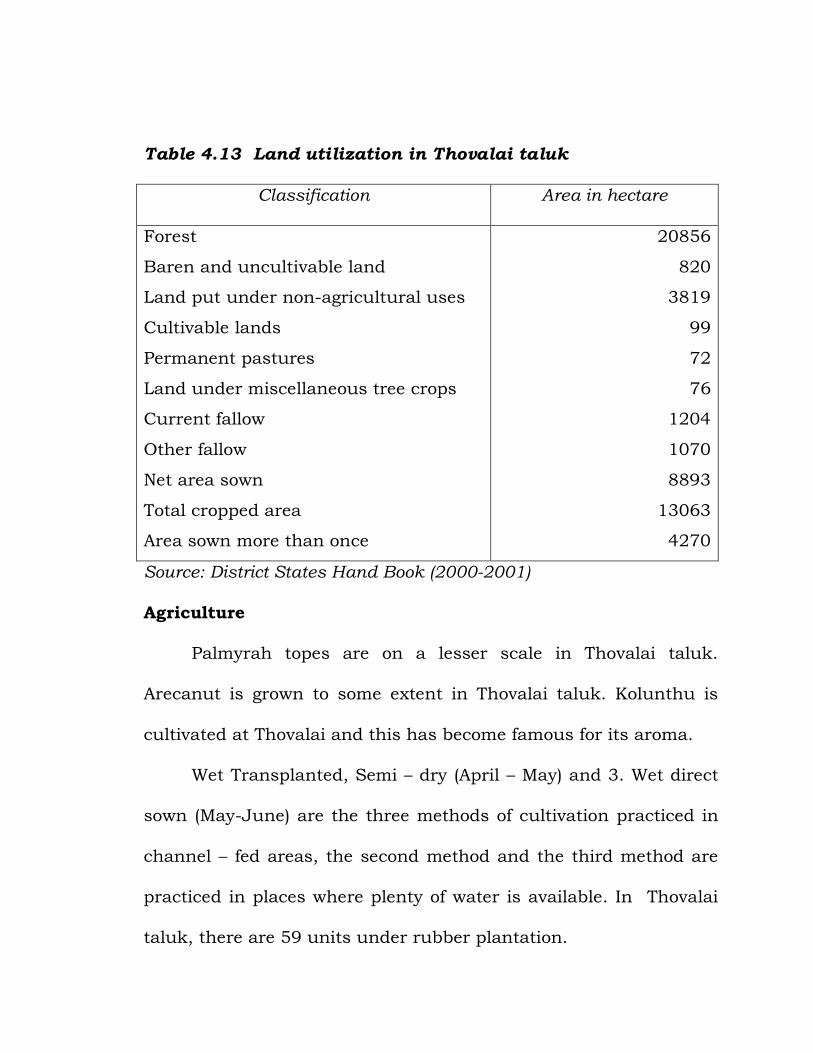
Table 4.13 Land utilization in Thovalai taluk
Classification Area in hectare
Forest
Baren and uncultivable land
Land put under non-agricultural uses
Cultivable lands
Permanent pastures
Land under miscellaneous tree crops
Current fallow
Other fallow
Net area sown
Total cropped area
Area sown more than once
20856
820
3819
99
72
76
1204
1070
8893
13063
4270
Source: District States Hand Book (2000-2001)
Agriculture
Palmyrah topes are on a lesser scale in Thovalai taluk.
Arecanut is grown to some extent in Thovalai taluk. Kolunthu is
cultivated at Thovalai and this has become famous for its aroma.
Wet Transplanted, Semi – dry (April – May) and 3. Wet direct
sown (May-June) are the three methods of cultivation practiced in
channel – fed areas, the second method and the third method are
practiced in places where plenty of water is available. In Thovalai
taluk, there are 59 units under rubber plantation.
Irrigation
Thovalai taluk has 92 rainfed tanks (Manavari) and 118
system tanks (Channel fed). Thovalai taluk has a non-system tank,
namely, Chenbagaramanputhoor Periyakulam and the Ayacut
under the tank is 213.49 acres. 9 Besides, it has 96.8 km. long
canals and 285 wells used for irrigation purpose only.
4.2.11 Banking and Finance
There are 9 commercial banks in 7 villages which are
functioning in Thovalai taluk - in Aralvoimozhi, Bank of Tamil
Nadu Limited and State Bank of India; in Bhoothapandy, Canara
Bank and State Bank of Travancore; Bank of Tamil Nadu Limited in
Thazhakudi, IOB in Thittuvilai; IOB in Thovalai; Canara Bank in
Azhagiapandiyapuram and SBI in Thadikarankonam. The
Kanyakumari District Central Co-operative Bank Limited, Nagercoil
provides crop insurance in Thovalai taluk. In addition to these,
there are nine primary co-operative banks functioning in this taluk
and issuing agricultural credits to the farmers.
AGASTHESWARAM TALUK
Agasteeswaram taluk, spread over an area of 276 sq. km. is
one of the four constituent taluks of Kanyakumari distict. This
taluk is bounded by the three seas: the Indian Ocean, the Arabian
Sea and the Bay of Bengal. It is surrounded on the north by
Thovalai taluk, on the north-east by Tirunelveli district, on the east
by the Bay of Bengal and the west by Kalkulam taluk. It is situated
in the southern most tip of the Indian Sub continent. Nagercoil,
the head quarters town of the distict is located within this taluk.
Population
The total population of Agasteeswaram taluk as per 2001
census was 4,92,714; of the total population, 2,43,831 were males
and 2,48,883 were females. The density of population in
Agasteeswaram taluk is 940 persons per sq.km. The proportion of
female population is high in both rural and urban regions (The
literacy rate of the taluk is 84.96 percent). The distribution of male
and female population in the rural and urban areas is shown in
Table 4.14.
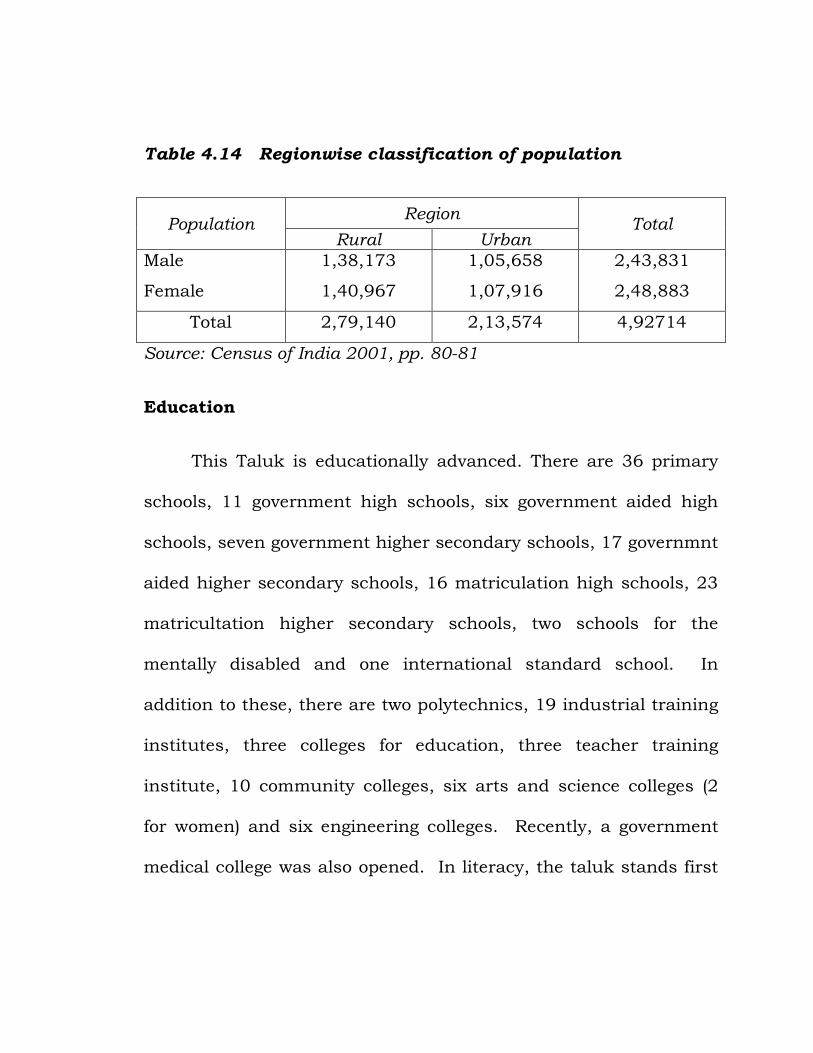
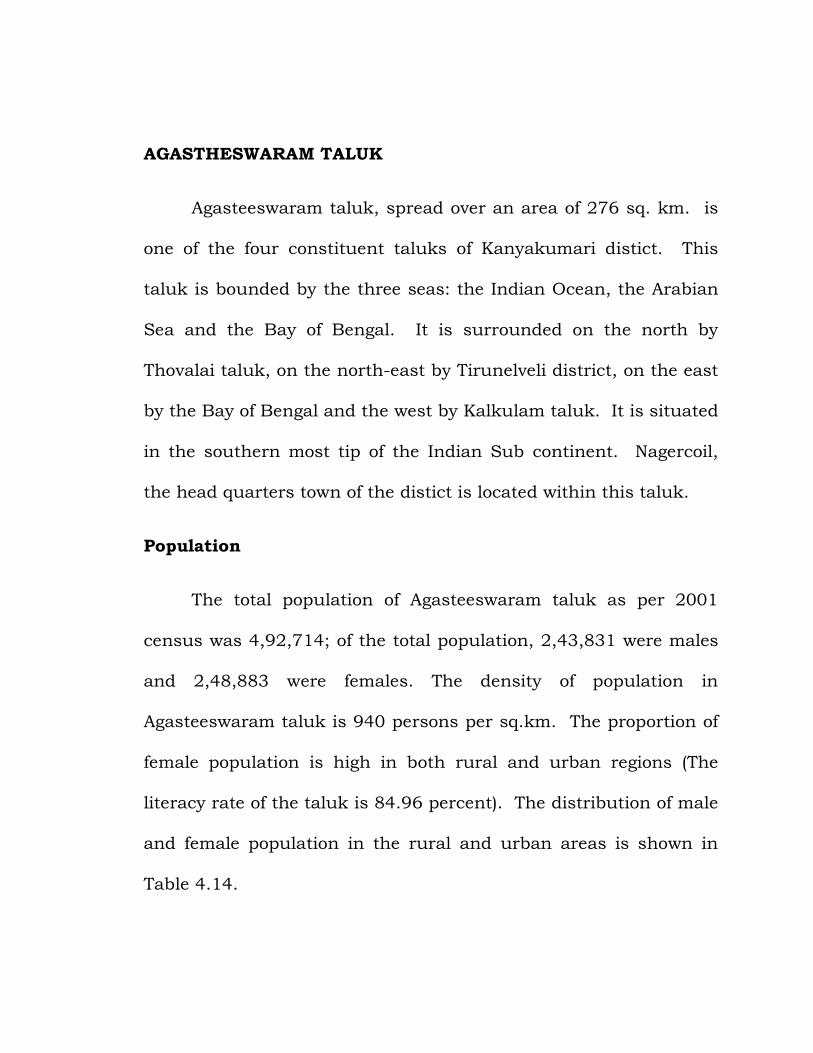
Table 4.14 Regionwise classification of population
Population Region
Total Rural Urban
Male
Female
1,38,173
1,40,967
1,05,658
1,07,916
2,43,831
2,48,883
Total 2,79,140 2,13,574 4,92714
Source: Census of India 2001, pp. 80-81
Education
This Taluk is educationally advanced. There are 36 primary
schools, 11 government high schools, six government aided high
schools, seven government higher secondary schools, 17 governmnt
aided higher secondary schools, 16 matriculation high schools, 23
matricultation higher secondary schools, two schools for the
mentally disabled and one international standard school. In
addition to these, there are two polytechnics, 19 industrial training
institutes, three colleges for education, three teacher training
institute, 10 community colleges, six arts and science colleges (2
for women) and six engineering colleges. Recently, a government
medical college was also opened. In literacy, the taluk stands first
in Kanyakumari district, it has been declared as 100 percent
literate.
Land Utilisation
The total agricultural output depends on the quantity and
quality of land available and its uses. The total cropped area in the
taluk comes to 11,551 hectares. Table 4.15 shows the land
utilization details.
Table 4.15 Land utilization in Agasteeswaram taluk
Classification Area in hectare
Forest
Baren and uncultivable land
Land put under non-agricultural uses
Cultivable lands
Permanent pastures
Land under miscellaneous tree crops
Current fallow
Other fallow
Net area sown
Total cropped area
Area sown more than once
795
583
4221
--
--
--
--
--
8195
11581
3386
Source: District States Hand Book (2000-2001)
Agriculture
This block is fully dependent upon the agricultural sector.
Paddy, pulses and banana are the major food crops in the block,
whereas coconut, vegetables, fruits, cashewnut are the major
commercial crops in the block. An important feature of this block
is the production of off-season mangoes. Of the different crops (in
2003-04), paddy occupied 69% of cropped area, coconut was
calculated over 23% of the area and banana only 9%.
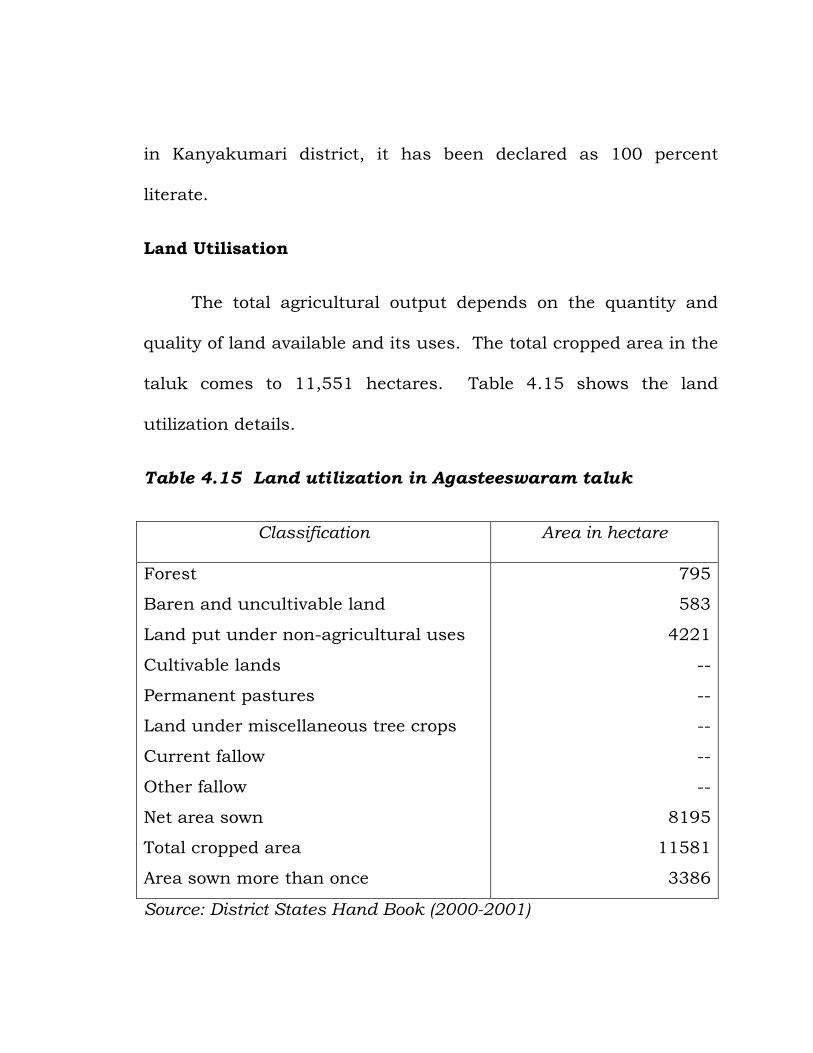
Irrigation
The taluk falls in the higher rainfall zone, where both south-
west and north-east monsoon are active. This taluk receives higher
amount of rainfall from south-west monsoon.
Tanks and channels are the most important sources of
irrigation in this taluk. There are 247 tanks and 26 km. long
canals in the taluk. The area under different irrigation facilities is
furnished in Table 4.16.
Table 4.16 Area under different sources of irrigation in Agasteeswaram taluk
Source Gross area Percentage variation
Tanks
Canals Wells Others
10,502.95
8,184.55 1,573.20 181.70
51.37
40.03 7.69 0.90
Total 20,442.40 100.00 Source: Agasteeswara taluk office, G. return for 2003-04 Nagercoil p.5.
Table 4.16 exhibits that tanks pose the first place by
facilitating irrigation for 10,502.95 hec. (51.37%), canals occupy
the second place in the total area under irrigation, facilitating
8184.55 hec. (40.03%). Wells supply water to 1573 hec. (7.69%) of
the total area. The number of wells has been increasing as a result
of intensive cultivation, frequent monsoon failure and lack of
irrigation facilities as this taluk is the tail end. The other sources
of irrigation supply only 0.90 percent of the total land under
cultivation.
Banking and Finance
Banks are available in plenty in this taluk. The village people
get various types of loans from government and private banks and
they include the scheduled commercial banks, Primary Agricultural
Credit Societies and Co-operative banks. People are getting jewel
loan, agricultural loan and vehicle loan from these financial
institutions. In this taluk, there are 63 commercial banks, six
district central cooperative banks and 15 primary cooperative
banks.
REFERENCES
1. Ibid.,p.1.
2. ‘District Profile’, District Statistical Office, Nagercoil, 2003-04.
3. Ibid.
4. Office of the Assistant Director of Statistics, Kanyakumari
District, Nagercoil, 2003.
5. “Annual Action Plan for Kanyakumari District”, Indian Overseas Bank Bulletin, 2001,p.11.
6. Soil Atlas of Kanyakumari District, Soil Testing Labouratory,
Nagercoil, 2003-04.
7. G. Returns, District Statistical Office, Nagercoil,2003-04.
8. General Manager, District Industrial Centre, Nagercoil 2003-04.
9. Ibid ., P.334.