Embed Size (px)
Citation preview
125
Chapter Nine
MODELING THE COST IMPLICATIONS OFALTERNATIVE FACO STRATEGIES FOR
JSF PRODUCTION
Analyzing the costs of any production task can be complex. In thiscase, the many scenarios that must be considered make the analysiseven more difficult. To analyze different work splits, we have devel-oped a cost model that can be used to examine the effects of the costdrivers under different scenarios. We have also identified and exam-ined a number of other issues beyond those in the congressional lan-guage to complete a full and objective evaluation of the differentscenarios.
Many factors, including labor efficiency, taxes, facilities require-ments, environmental constraints, would affect the cost of havingadditional or alternative FACO sites for JSF production. It is difficultto predict the influence of all these cost effects. Some factors couldincrease the total production cost of using a second site—mostnotably, the need for redundant facilities, tooling, and equipment.Other factors may even decrease the total FACO cost for a multiple-site strategy compared with a single-site one. One such factor is theincentives to hire workers. These incentives may reduce the produc-tion cost at a second site. If the number of employees that could takeadvantage of these incentives were limited, it might make sense tomove that portion of the work that would take advantage of theincentives to that second site. How these factors combine to result ina higher or lower FACO production cost is not obvious. We have noway of knowing whether a particular FACO strategy is more or lessexpensive without accounting for all the relevant factors in a consis-tent manner.
126 FACO Alternatives for the Joint Strike Fighter
Cost influences may not be independent of one another, whichcomplicates the accounting. Some influences on the FACO costaffect other factors. For example, environmental regulations mayrequire additional facilities investments, such as a thermal oxidizerto reduce emissions of VOCs. These will in turn increase powerusage, and thus overhead cost, at the site. Reflecting these linkagesbetween factors is critical to an accurate determination of costeffects. The cost model that RAND has developed enables thequantitative assessment of the cost implications of different FACOstrategies. In this chapter, we describe this model and the calcula-tions made within it.
COST ELEMENTS IN THE MODEL
The RAND model was developed in Microsoft Excel and consists ofnine different modules that correspond to discrete elements of cost.These elements, which are the major cost drivers for FACO activities,are production labor, indirect costs (overhead and G&A), invest-ments (facilities, equipment, and tooling), taxes and credits, envi-ronmental and permitting costs, transportation, power, prime andsupplier management support, and fee. Generally, each module cal-culates the appropriate cost for each fiscal year1 of production. Somecosts, such as labor, are incurred over the entire production run(called recurring costs), while others, such as tooling and equipment,might be onetime costs or periodic (called nonrecurring costs). Inthis section, we describe the methodology and assumptions used toevaluate each cost element.
Production Labor
Labor is one of the largest cost components for FACO. The laborassociated with FACO activities consists of two distinct types:“touch” and “support.” Touch labor is the direct work in the pro-duction of the aircraft, including such activities as structural mate,testing, and flight operations. Support labor is direct labor that facili-
______________ 1For the FACO activity of the JSF program, we assume that actual costs are incurredtwo years after the government fiscal year in which the funds are appropriated (thegap between order and delivery).
Modeling the Cost Implications of Alternative FACO Strategies 127
tates FACO touch work, including engineering, quality, materialinventory, and the like. For all these elements, we used the workbreakdown structure (WBS) employed by Lockheed Martin for FACOactivities and modeled each as a separate component of the overallproduction labor. The WBS is as follows:
• Direct Labor
—Fuselage structural mate
—Subsystem mate
—Final assembly and test
—Flight operations
—Manloads/incomplete task logs2
—Final finishes
• Support Labor
—Manufacturing engineering
—Tool engineering
—Tool manufacturing
—Quality
—Engineering
—Material inventory
For each of the above components of production labor, we calculatethe number of hours of work on a yearly basis at each site. (This cal-culation is complicated by the need to consider learning effects,which are described below.) These hours are then multiplied by adirect labor rate to determine the direct labor cost. Not all compo-nents have the same direct rate. Some components are more expen-sive on a per-hour basis than others. For example, the hourly directrates for engineering are higher than those for structural mate.
______________ 2This category includes residual work that must be accomplished post delivery at theFACO location on purchased subassemblies before they can be incorporated into finalassembly.
128 FACO Alternatives for the Joint Strike Fighter
Unit Learning Curve. The number of work hours per aircraftassembled is not static. It has long been understood that manufac-turers become more efficient at producing identical items over time.This observation is the “learning effect.”3 We cannot determine thehours worked each year by simply multiplying the production rate bya fixed number of hours per aircraft.
To reflect experience-based gains in efficiency, we use the unitlearning curve that represents the production hours per aircraft as apower function of cumulative production. The equation takes thegeneral form:
T n T nslope
( ) ( )ln( )
ln( )= ×1 2 . (1)
The variable n is the cumulative number of units produced. T(n) isthe number of hours for the nth unit. T(1) is the number of hours forthe first unit. The variable slope is the improvement rate and repre-sents the quantity by which the number of hours gets multipliedeach time the production unit number doubles. For example, a slopeof 0.95 implies that the unit hours decrease by 5 percent for eachdoubling of quantity. Therefore, if unit one takes 1.000 hours, unittwo takes 0.950 hours and unit four takes 0.903 hours.4,5
To determine the number of hours each of the 12 components ofFACO labor requires, at a minimum, the calculation of 12 learningcurves. However, the RAND model incorporates more complexity.Two additional aspects to production labor for JSF FACO need to beaddressed (and were incorporated into the cost model) to reflect theunique nature of this study and of the program: the possibility that
______________ 3Asher, 1956.4The insight that hours required to perform manufacturing functions decline at a setrate as the production units successively double was a foundation of formal cost esti-mation (Asher, 1956).5It should be noted that Lockheed Martin uses a compound learning curve thatchanges slope at three points in the production. Its curve mimics an “s”-shapedimprovement curve. We have used constant slope curves for our analysis, in line withwhat the JSF Program Office and the OSD CAIG have done. A comparison analysisusing a learning curve like Lockheed Martin’s and a simple single slope curve revealsthat the difference in labor hours is only about +/– 3 percent. The difference dependson the point at which a second source is introduced.
Modeling the Cost Implications of Alternative FACO Strategies 129
learning can transfer between sites and the fact that what is beingproduced is not one single aircraft, but three variants of a singleaircraft with a high level of commonality.
Transferable Learning. The efficiency improvement that the unitlearning curve reflects results from a combination of factors, includ-ing improvements in production methods and experience gained bythe workers. All FACO scenarios under examination rely on a singlecontractor (Lockheed Martin) controlling configuration and meth-ods. Therefore, some, although not all, of the efficiency improve-ment could plausibly transfer between the various FACO sites. Morelikely to be transferable are larger-scale engineering improvementsor process improvements, including new methods, simplifications ofwork methods, and tooling improvements. This type of change inthe way work is done can be captured in documentation or evenshared by engineers traveling between locations. Another kind oflearning is generally not so easily transferred—that involved in thework done by touch labor, such as mechanics working on the factoryfloor. This learning would include start-up or training expertiserequired for a task, manual dexterity (“learning by doing”), andundocumented tricks or shortcuts that workers might not even beable to articulate.
In the cost model, we have incorporated the flexibility to modellearning transfers of different levels between sites. To do so, we splitthe learning curve for a particular component of labor into two setsof curves, a universal one (for all sites) and a site-specific one. Theuniversal curve is based on the units produced at all sites, whereasthe site-specific curves are based on the unit production exclusivelyat one particular site. The revised learning curve has the form:
T n T n ni all i
slope slope
( ) ( ) ( )ln ( )
ln ( )
ln ( )
ln ( )= + −
1 12 2γ γ , (2a)
where i is an index of location, nall is the cumulative number of unitsproduced at all locations, ni is the cumulative number of units pro-duced at location i, T(ni)is the number of hours for unit ni, and T(1) isthe number of hours for the first unit, assumed to be location-independent.
130 FACO Alternatives for the Joint Strike Fighter
The constant γ is the fraction of learning that is transferable. Forexample, say a site has produced 23 units of 54 total units. If that siteproduces the next new unit, nall is 55 and ni is 24. Note that weassume the universal and site-specific slopes to be identical. Wemake this assumption because, with the Lockheed Martin manage-ment team controlling production, we have no reason to believe thatany one site will be able to “learn” more effectively than another,given that the skills required across sites will be the same and thatthe engineers involved will be able to interact with their counterpartsat other sites.6,7 This implies that formula 2a converges to formula 1when γ is 1 or one site does all the production (i.e., nall = ni).
The RAND FACO cost model implements equation 2a in a slightlymodified form. The unit parameter n for the universal part of thecurve is actually the prior year’s last unit number (total) plus thesite’s unit number for the current year. For example, say the prioryear’s total cumulative production was 57 and that site i had pro-duced 22 of those units. Say this year’s total production is 20, ofwhich 10 are produced at site i. For the 10th new unit site i producesthis year, nall would be 67 and ni would be 32. For the first unit pro-duced at site i the next year, nall would be 78 and ni would be 33. Thismodification reflects that universal learning would not be transferredinstantaneously. We assume a delay of one year for improvements inproduction efficiencies to be transferred from site to site.
Determining a reasonable value for γ (learning transfer) is prob-lematic. Learning-curve analysis has been typically done at anaggregate level where the cause and effect of the efficiency improve-ments have not been isolated. Other authors have examined theability to transfer learning under circumstances where a gap in pro-duction occurs.8 These cases represent an extreme in the transfer oflearning. That is, when production is restarted, all of the learningbenefit from the workers’ efficiency will have disappeared. The effi-ciency gains from methods improvements should have been cap-
______________ 6This assumes the Northrop Grumman site will be closely tied in with its JSF partner,Lockheed Martin.7To explore how this assumption affects the cost results, we test the sensitivity of onealternative to different learning transfer percentages.8Andelhor, 1969; Birkler et al., 1993.
Modeling the Cost Implications of Alternative FACO Strategies 131
tured in the processes used to analyze and implement engineeringchanges. Therefore, a reasonable estimate for the value γ can bedetermined from an analysis of restarted production. Recasting thedata slightly from that reported in Birkler et al. (1993), we find that,on average, 64 percent (percent
Learning tained T T R
T T LRe = −−
( ) ( )( ) ( )11 ) of the
overall learning (in hours) is retained for production labor, with arange of 30–88 percent. We use this average (and range) as asurrogate for γ (the transferable portion). The remainder of learningwill, therefore, be site-specific. The cost model does incorporateflexibility in implementing different assumptions about learningtransfer, so further sensitivity analysis on all cases from zero tocomplete learning transfer can be tested.
Commonality of Variants. The original vision of the JSF programincluded the cost advantages of having three variants of a single air-craft meet the needs of the Air Force, Navy, and Marine Corps, ratherthan having each service pay for separate development and produc-tion programs. Commonality among the variants is expected to savesignificant design and production costs (and perhaps maintenancecosts for the life of the aircraft). For the production costs specific toFACO, these benefits should also apply.
To represent the effect of the commonality among the three variants,each of the components of labor is determined in the model by acombination of a common and a unique learning curve. We treated“cousin” aspects of commonality as “common” because the assem-blies are similar enough to allow for learning transfer among cousinparts.9 In particular, while cousin parts might have internal differ-ences that affect cost during the fabrication or subassembly process,the interface properties of cousin assemblies and parts are extremelyclose or identical. Therefore, the shared learning among variants isexpected to be high for FACO activities. (The JSF Program Officeaccepted this approach of treating common and cousin aspects simi-larly as appropriate for FACO activities.) The formulation of thecommon and unique learning equation is analogous to equation 2a.
______________ 9Common parts are exactly the same among variants. Unique parts are completelydifferent—the STOVL lift fan is one example. Cousin parts are similar in shape andsize but may vary slightly. Thicker spars for increased strength on the CV offer oneexample.
132 FACO Alternatives for the Joint Strike Fighter
The equation for one variant (if all production were produced at onesite) would be,
T n T n nj j j j j
slope
j all
slope
( ) ( ) ( )
ln( )ln( )
ln( )ln( )
= + −
1 1
2 2θ θ , (2b)
where j is an index of the variant, nall is the cumulative production ofall variants, nj is the cumulative number of variant j units produced,Tj(nj) is the number of hours for unit nj, and Tj (1) is the number ofhours for the first unit of variant j. θ j is the work fraction unique forthe variant j. We based the values for θ j on commonality values forthe airframe as provided by the Program Office. The percent uniquevalues are 13.3 percent for CTOL, 48.1 percent for CV, and 34.4 per-cent for STOVL.
Generalizing equations 2a and 2b into a combined formulation, wearrive at
T n Tn n
n n
j j i j
j j all
slope
j all all
slope
j j i
slope
j all i
slope( ) ( )
( )
( ) ( )( )
,,,
ln( )ln( )
,
ln( )ln( )
,
ln( )ln( )
,
ln( )ln( )
=+ − +
− − −
11
1 1 1
2 2
2 2
θ γ θ γ
θ γ θ γ+
(2c)
where j is the index of variant and i is the index of location, nall,all isthe cumulative number of units produced of all variants at all loca-tions, nj,all is the cumulative number of units produced of variant j atall locations, nall,i is the cumulative number of units produced of allvariants at location i, nj,i is the cumulative number of units producedof variant j at location i, Tj(nj,i) is the number of hours for unit nj,i,and Tj(1) is the number of hours for the first unit of variant j,assumed to be location independent.
Indirect Costs
Indirect costs consist of overhead, G&A expenses, and other compo-nents of indirect cost listed later in this report. Overhead costs, thelarger of the two, are costs related to fabrication and assembly activi-ties, but cannot be allocated on a direct basis to a particular product
Modeling the Cost Implications of Alternative FACO Strategies 133
for reasons of either practicality or accounting convention. Over-head includes the costs of fringe benefits, indirect labor, deprecia-tion, building maintenance and insurance, computer services,supplies, travel, and so forth.10 G&A expenses relate more to thecompany as an entity and may not relate to activity levels at only oneplant. The G&A expenses include such general business costs asexecutive salaries, human resources costs, and the costs of such staffservices as legal, accounting, public relations, and financial func-tions.11 G&A costs are generally incurred and accounted for at a cor-porate level, whereas overhead is a site-specific cost.
While these indirect costs are related to and scale with the total directlabor for a site, the relationship is not strictly linear. Indirect costsinclude both fixed and variable components. As the number ofdirect labor hours at a site increases, the overhead and G&A ratesdecrease because the fixed costs are spread over a greater number ofhours. To reflect the relationship between direct hours and the indi-rect cost rates, we use the following formulation:
rate
ABi
ii= +
Total Hours, (3)
where ratei is the indirect rate, and Ai and Bi are constants. Todetermine these constants, we surveyed each of the potential sitesfor their rate information and the sensitivity of those rates to changesin labor base. The constants Ai and Bi for each site were determinedby fitting these data (the FY 2001 rate at several hypothesized laborhour levels) to equation 3.12
By using the current indirect rate information from each of the sites,we assume that no significant changes to the site or its businessstructure will occur. This assumption is very tenuous; almost cer-tainly, changes will occur in what each site produces over the next
______________ 10DSMC, 2001.11Contract Pricing Reference Guides, Department of Defense Procurement Web site,http://www.acq.osd.mil/dp/cpf/pgv1_0/pgv4/pgv4c2.html (last accessed May 30,2002).12We are not able to present the results of this analysis because the results arebusiness-sensitive to each of the firms.
134 FACO Alternatives for the Joint Strike Fighter
few decades. However, it is impossible to predict what these changesmight be over the 20-plus years of JSF production, which does noteven begin until FY 2006.13 The potential FACO sites did provide aworkload forecast for the next five years.14 We have assumed a flatworkload after the fifth year. This is the best estimate we can make atthis time.
The FACO activities for JSF will also change the fixed component ofoverhead for the sites.15 For example, some new facilities will benecessary, which will lead to additional depreciation charges, fran-chise taxes, and property taxes. For the changes to the fixed compo-nents of indirect costs caused by FACO, we will calculate each itemexplicitly and add it to the overhead costs (from equation 3) todetermine a new effective overhead rate. This separate accountingwas done to isolate the effects of these costs. These explicitly mod-eled components of overhead (discussed later in this chapter) are
• facilities depreciation
• franchise taxes
• property taxes
• sales and use taxes
• tax credits
• additional power costs
• environmental costs.
Given that increasing the workload at a site typically lowers indirectrates, a benefit accrues to other government programs at JSF FACOsites. The increased workload will decrease the allocated indirectcosts for these programs. We calculate the indirect cost savings forthese programs as the difference between rates with and without the
______________ 13The 14 SDD aircraft will be built before then.14We have also assumed that all FACO work for a given fiscal year lot is completed inone calendar year. FACO is expected to take only about 40 days, so overlap would berelatively insignificant. However, there is an offset of two years between the fiscal year(year of purchase) and the year that FACO activities complete for the lot.15The formulation of G&A expenses is assumed to be unaffected by FACO activities—that is, the fixed portions of G&A costs do not change when FACO work is added.
Modeling the Cost Implications of Alternative FACO Strategies 135
FACO activities, multiplied by an average direct wage rate and thenumber of forecast hours for the other work.
We also include as part of the indirect cost calculations the following:
• fringe benefit costs16 (e.g., vacation, health insurance, workers’compensation insurance, FICA).
• facilities cost of money (COM).
• overtime premium.
• marketing fees.
• hiring and training costs.
These indirect costs are added based on current Lockheed MartinAero and Northrop Grumman practices as agreed with the DCMA.
Investments: Facilities, Equipment, and Tooling
To undertake FACO activities for JSF production, a site will need avariety of facilities, equipment, and tooling investments, which weredescribed in Chapter Three. There are two general types of invest-ments:
• Contractor-owned. These investments are not specific to the JSFprogram—i.e., they could be used for other aircraft productionprograms. An example of such an investment is a paint facility.Contractor-owned facilities, equipment, and tooling are typicallysubject to property and sales taxes.17 Cost recovery for theseitems is through depreciation and cost of money components ofoverhead.
• Government-owned. These investments are specific to JSFFACO activities. An example of a government-owned investmentis unique tooling used for JSF FACO work. Government-owneditems are not subject to sales and property tax (although some
______________ 16While fringe benefit costs could be considered “direct charges,” Lockheed MartinAero applies a uniform rate to the direct labor dollars for purposes of billing.17As described in Chapter Six, real property (e.g., a building) is not subject to sales tax,regardless of ownership.
136 FACO Alternatives for the Joint Strike Fighter
states [California, for example] levy a “possessor” tax on suchitems). The government generally reimburses the contractor infull for these investments.
The investment cost at each site is modeled as a function of the rateof production at the site. For example, the manufacturing floorspace required will increase as the annual production rate increases.
We used three steps to determine investment costs:
• Determine requirement. Based on the maximum rate that a sitewill produce over the entire production run, we determine arequired level of investment at a site.18 Rate dependence ismodeled as a step function. For a value between two steps, therequirement is linearly interpolated. The step function can havearbitrary form and can include only one step. For example, aSTOVL pad is a requirement for each facility where FACO activi-ties for that variant will take place. One pad is sufficient to han-dle the highest total annual rate now planned for that variant.
• Determine facilities/equipment/tooling already available.Some sites might have existing infrastructure not currently beingused and not set aside for other work or programs; therefore, aparticular investment might be reduced or not needed at all.This step determines the usable facilities, equipment, and toolingexisting at a site. This information was obtained though surveyssubmitted to the sites and through follow-up data collection withthe sites.
• Calculate cost of needed investment. If the requirement exceedsthat already available, the site will need to add an investment.We estimated the cost of such additions based on existing infor-mation on such factors such as dollars per square foot, dollarsper unit, etc. Lockheed Martin provided most of this investmentcost information.
______________ 18The investments have been treated as onetime investments, although, in practice,sites could build up facilities incrementally. However, because the production profilefor the JSF builds to a full rate by 2012 and remains rather flat after that, this shouldnot significantly affect the calculations. Also, we assume that assets are not trans-ferred between sites.
Modeling the Cost Implications of Alternative FACO Strategies 137
Three other variables are tracked along with the investment costs:depreciation, residual asset value, and operations and maintenancecosts. Depreciation is tracked because it is an allowable overheadexpense for contractor-owned items. Therefore, adding contractorinvestments to a site will increase the overhead rate through in-creased depreciation.
Some states have property taxes on manufacturing equipment.Therefore, the residual asset value must be tracked for a new con-tractor-owned investment to estimate the property tax implications(property tax itself is an allowable cost charged to the government).The residual value for a contractor-owned investment is also trackedto calculate the appropriate facilities cost of money, which is part ofoverhead. Each year, the residual asset value for these FACO-specificfacilities is multiplied by the COM rate to determine the COM charge.We assume the rate to be 5.5 percent.19
Some investments might require significant annual maintenance orhave significant operating expenses. An example of such an invest-ment would be a thermal oxidizer for pollution control of VOCs.These units require a large amount of natural gas to operate and areexpensive to maintain. We assume that the annual level of opera-tions and maintenance cost is a function of the size of the facility orinvestment.
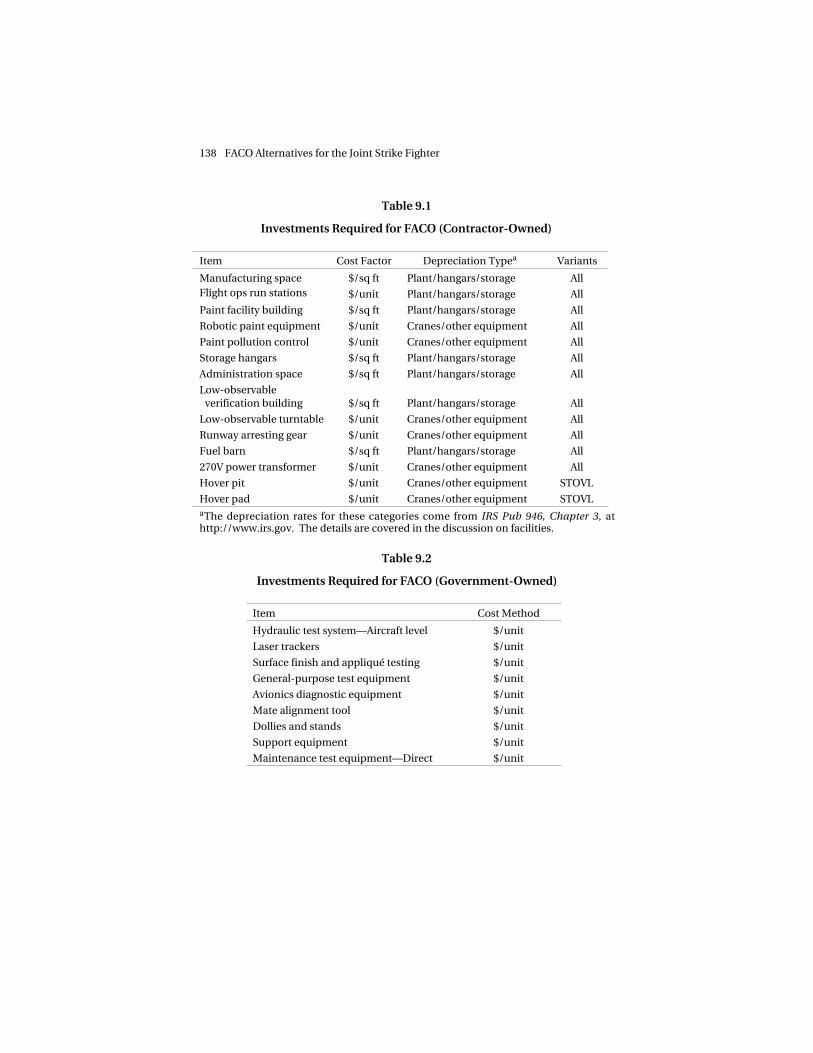
Table 9.1 summarizes the contractor-owned investments trackedalong with the specific depreciation and cost methodology used, aswell as the variants whose production requires these assets. Table9.2 summarizes the government-owned investments. As these itemsare not depreciated and are general to all variants, depreciationmethod and variant requirement are not shown.
Taxes and Incentives
Each state has unique accounting rules for taxation that include dif-ferent tax rates and different definitions of taxable income. For any
______________ 19This is the current (2002) COM rate as published by the U.S. Department of theTreasury. See http://www.publicdebt.treas.gov/opd/opdprmt2.htm (last accessedMay 20, 2002).
138 FACO Alternatives for the Joint Strike Fighter
Table 9.1
Investments Required for FACO (Contractor-Owned)
Item Cost Factor Depreciation Typea Variants
Manufacturing space $/sq ft Plant/hangars/storage AllFlight ops run stations $/unit Plant/hangars/storage All
Paint facility building $/sq ft Plant/hangars/storage All
Robotic paint equipment $/unit Cranes/other equipment All
Paint pollution control $/unit Cranes/other equipment All
Storage hangars $/sq ft Plant/hangars/storage All
Administration space $/sq ft Plant/hangars/storage All
Low-observableverification building $/sq ft Plant/hangars/storage All
Low-observable turntable $/unit Cranes/other equipment All
Runway arresting gear $/unit Cranes/other equipment All
Fuel barn $/sq ft Plant/hangars/storage All
270V power transformer $/unit Cranes/other equipment All
Hover pit $/unit Cranes/other equipment STOVL
Hover pad $/unit Cranes/other equipment STOVLaThe depreciation rates for these categories come from IRS Pub 946, Chapter 3, athttp://www.irs.gov. The details are covered in the discussion on facilities.
Table 9.2
Investments Required for FACO (Government-Owned)
Item Cost Method
Hydraulic test system—Aircraft level $/unit
Laser trackers $/unit
Surface finish and appliqué testing $/unit
General-purpose test equipment $/unit
Avionics diagnostic equipment $/unit
Mate alignment tool $/unit
Dollies and stands $/unit
Support equipment $/unit
Maintenance test equipment—Direct $/unit
Modeling the Cost Implications of Alternative FACO Strategies 139
two sites in different states, taxes can be quite different, even if themanufacturing operations are identical. To assess the effect of taxeson different FACO strategies, we include in the model four kinds oftax treatments: franchise taxes, property taxes, sales and use taxes,and state and local incentives (which take the form of tax credits andother kinds of benefits—i.e., negative taxation in these cases).20
These issues were discussed in more detail in Chapter Six.
Franchise taxes are payments to a state for operating a revenue-generating entity in that state. These taxes are analogous to federalcorporate income taxes. Determining the state-by-state taxable por-tion of income for a company that has a presence in multiple states isan intricate process. Most states use an apportionment formula todetermine the fraction of the company’s total income that is taxableby that state. The formula is based on the fraction of assets, sales,and labor that the company has in the state. Each state being con-sidered in this analysis applies different weights to these compo-nents.
To understand fully the franchise tax implications of alternativeFACO strategies, we would need detailed financial data for all facili-ties of the companies involved. Such calculations and data gatheringare not practical within the scope of this study and would involveconsiderable insight and involvement from the contractors’corporate-level tax experts. Therefore, we have taken the followingapproach to estimating the change in the franchise tax a companywould pay if it added FACO activity in any given state. We assumethat the additional tax equals the state’s corporate income tax ratemultiplied by the fee associated with FACO. The state corporateincome tax rates were provided in Table 6.1.
This franchise tax simplification has drawbacks. One is that it doesnot reflect the effect of different states’ weighting formulas. Becauseeach state has a different formula, one state might apportion more orless income to itself for identical operations compared with anotherstate. Another, subtler, effect is that companies can use losses from
______________ 20Because this analysis assesses the cost to DoD and not the net cost to the govern-ment, we do not include federal income taxes. It should also be noted that federalincome taxes are not allowable costs.
140 FACO Alternatives for the Joint Strike Fighter
other states and even other countries to reduce income in any givenstate. The apportionment formula is based on total corporateincome.
Property tax calculations are more straightforward than franchise taxcalculations. As discussed above (under “Investments”), the modeltracks the residual asset value (original cost minus accumulateddepreciation) of FACO property over time.21 Property taxes are cal-culated as the product of residual asset value and the property taxrate (see Table 6.1). The reader should note that this calculation isbased only on contractor-owned investments, not the tooling andequipment owned by the government. The exception is California,where the contractor is charged a possessor tax for government-owned items.
State sales and use taxes apply to some contractor-owned invest-ments. As described in Chapter Six, some states exempt manufactur-ing equipment as well as real property from these taxes. We deter-mine a sales tax for each investment, if appropriate, by multiplyingthe purchase price by the local rate.
Certain states offer tax credits as an incentive to increase local work-forces. For every new employee, the company is given a onetime taxcredit. For the FACO model, we determine the number of FACOworkers based on total number of required work hours divided bythe standard hours per year worked. Based on that head count, wecalculate the employment credit assuming the number of new hiresthat will likely be needed by each site, which was provided during thesite visits.
States sometimes offer investment tax credits to companies for newplants, facilities, and equipment. These credits are typically a per-centage of the total investment cost. Using the investment costsdescribed above, we calculate the investment credit by multiplying itby the credit percentage, where appropriate, and use it to reduce thenet franchise tax at site.
______________ 21As a simplification, we have used a common set of depreciation schedules for allsites, based on Internal Revenue Service rules.
Modeling the Cost Implications of Alternative FACO Strategies 141
Environmental and Permitting Costs
For FACO, the major environmental issues are VOC emissions result-ing from painting and finishing activities and noise from flight tests.Environmental and permitting issues can add to overall FACO coststhrough such requirements as permit fees, preparation and mainte-nance time, and required equipment and facilities for pollutionabatement. These costs are difficult to assess and forecast becausefew companies typically track them separately as a direct expense byprogram. Instead, environmental costs are usually part of overheadand are shared among all the work at one site.
Because we had no other method to estimate these costs, we useddata provided by the contractor. Equipment needed for FACO-driven environmental reasons is included in the “investment” cate-gory. Permit fees are set by the state in Texas and Georgia and by theAir Quality Management District in California. For each location,Lockheed Martin provided an estimate of the permit preparationtime and filing fees. For the Palmdale site, these preparation costsare higher because Lockheed Martin anticipates the need to file anEIS. Lockheed Martin also estimated the annual recurring permitcosts and fees for each location. These costs have been included inthe model.
Noise regulations do not have an associated cost in the model. Asdiscussed in Chapter Seven, noise restrictions may limit or restrictflight-test activities.
Transportation
Typically, the majority (50–70 percent) of the value of any aircraft isproduced by subcontractors and then incorporated into the aircraftby the primary assembler. In the case of the JSF, where LockheedMartin is teaming with Northrop Grumman and BAE Systems, theportion that the prime contractor is contributing is even lower thanaverage. The company estimates that it will have an 18-percentshare of the total production value. Hence, much of the material,purchased equipment, and major subassemblies for the productionof the JSF aircraft are manufactured at locations other than FortWorth, and must be shipped to Fort Worth or whichever FACO site isused. Moving the FACO site or adding additional sites will change
142 FACO Alternatives for the Joint Strike Fighter
the cost for shipping these items. The major components that mustbe available to each FACO site include
• forward fuselage
• center fuselage
• aft fuselage and tail
• wings
• edges
• doors
• weapons bay doors
• engines
• radar.
Changes of FACO location may change transportation costs. Forexample, Lockheed Martin plans to build many of the componentsfor which it is responsible, such as the wings and forward fuselage, atits Fort Worth facility. If this location is the FACO site, these itemswill have no transportation costs. For other FACO sites, these itemswill need to be shipped to the assembly location.
Lockheed Martin plans for truck delivery of all components. Foroverseas sources, we assume that these items are transported bycontainer ship to a common port—Houston. From that port, theitems are trucked to the various FACO sites.
We developed a cost-estimating relationship (CER) to evaluate thesetrucking costs. We obtained notional quotes to ship partial truck-loads of subassemblies from their source (source locations wereprovided by Lockheed Martin) to the various potential locations.22
We also determined the driving distance between sites.23 The CERincorporated into the cost model is
ln( ) . . ln( ) . ln( ),Cost Volume Distance= + × + ×0 556 0 568 0 392 (4)
______________ 22Source: http://www.transportation.com.23Source: http://www.mapquest.com.
Modeling the Cost Implications of Alternative FACO Strategies 143
where,
• Cost is in FY 2002 dollars.
• Volume is in cubic feet.
• Driving distance is in miles.
R2 was 0.91 with a root mean square error of 0.21.
Crate return costs, if needed, are expressed as a percentage of theinitial shipping value.
Power
While electrical power is typically an indirect cost charged throughoverhead, we have estimated power costs of FACO activities. Theestimate has two components. The first is a general facility demandbased on square footage of manufacturing space. The power esti-mate for this purpose is 31.2 kWh per square foot per year, which isindependent of the annual production rate (this power is mostly forlighting and heating and air conditioning and, therefore, the powerusage is based on facility size). The second component of power costdepends on the annual rate, consisting of the power for high-drawequipment needed for FACO activities. This equipment includes runstations, the fuel facility, the paint facility, and low-observable test-ing equipment. Each piece of equipment has a power usage per yearper station. Each station is assumed to operate at full capacity or notat all. The number of stations assumed to operate in a year dependson the number of JSF aircraft produced. For example, a total of eightpaint stations might be at a site, but only six may be used due toworkload. At the time this report was written, Lockheed Martin wasunable to determine the power usage for each of these facilities. Asan approximation, we used the same average power usage per squarefoot as given above for these items. To arrive at a power cost, theadded power demand for the year is multiplied by the site’s powerrate (dollars per kWh). We assume that the power rates remainstable (in constant dollars) over the production run because it is dif-ficult to forecast future utility prices.
144 FACO Alternatives for the Joint Strike Fighter
Management and Supplier Support
Having multiple FACO locations will result in additional manage-ment, oversight, travel, and communications effort by LockheedMartin and its suppliers. To estimate these costs, we assume that afixed number of dedicated prime contractor management represen-tatives will be on site to run the FACO activities at any location out-side Fort Worth. The estimate in the model is that 14.0 full-timeequivalents (FTEs) would be required for Lockheed Martin represen-tation the first year of production and 7.0 FTEs per year thereafter.The additional 7.0 FTEs for the first year are caused by the setup bur-den. To arrive at an estimate of the effect of the support costs ofmanagement representation on site, the total FTE value was multi-plied by an estimated cost of $150,000 per manager (fully burdened).
Having supplier representatives on site to serve their customers isbecoming an increasingly common manufacturing practice. Weassume that the JSF program will have supplier representatives onsite and estimate that 5.0 FTEs are required per year. (The cost of thesupplier representatives typically would be included in the price ofthe component; however, as we do not include the cost of the majorsubassemblies in our analysis, we treat these costs as a direct cost tothe government.)
Fee
The last element to discuss is fee. Fee represents the “profit” earnedby the contractor on the cost of the work performed. Typically, thefee is negotiated between the government and the contractorbeforehand. To determine a total price, we apply a fixed fee to thedirect labor, support labor, and indirect costs. We assume thattransportation costs and tooling and equipment costs are passeddirectly through to the government (i.e., no fee added) with adminis-tration expenses associated with those purchases already included inthe indirect rates.
Modeling the Cost Implications of Alternative FACO Strategies 145
MODEL STRUCTURE
Interaction Among Cost Elements
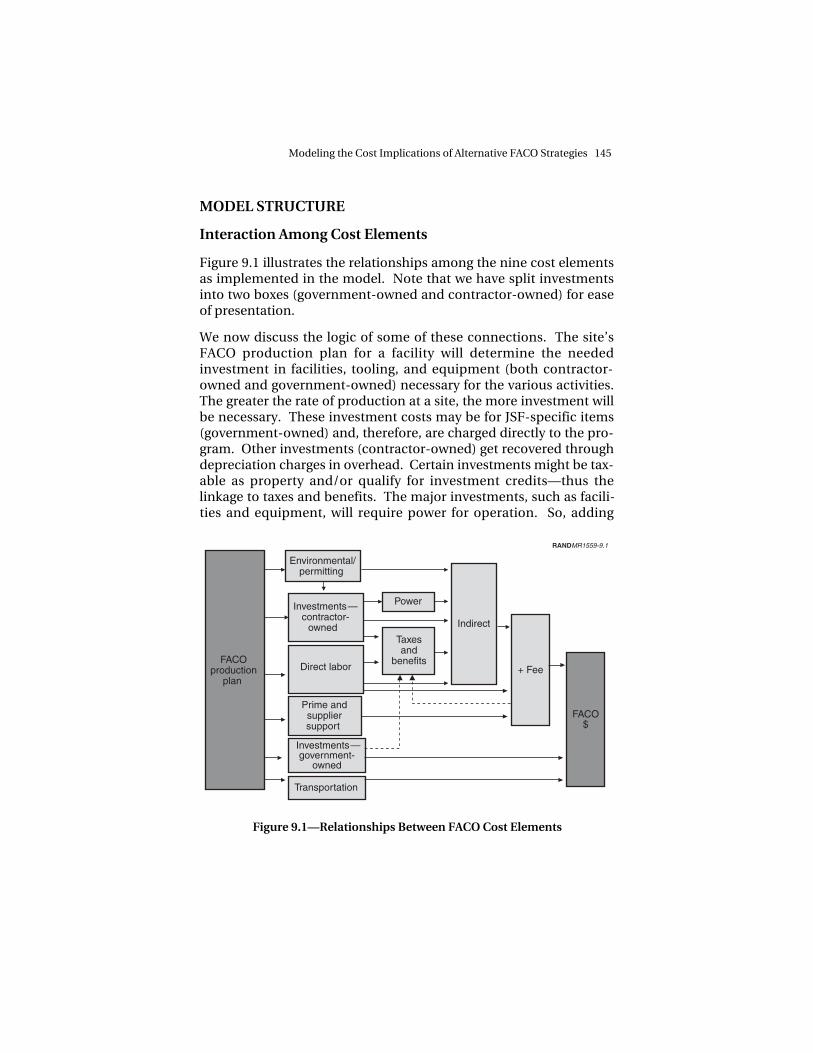
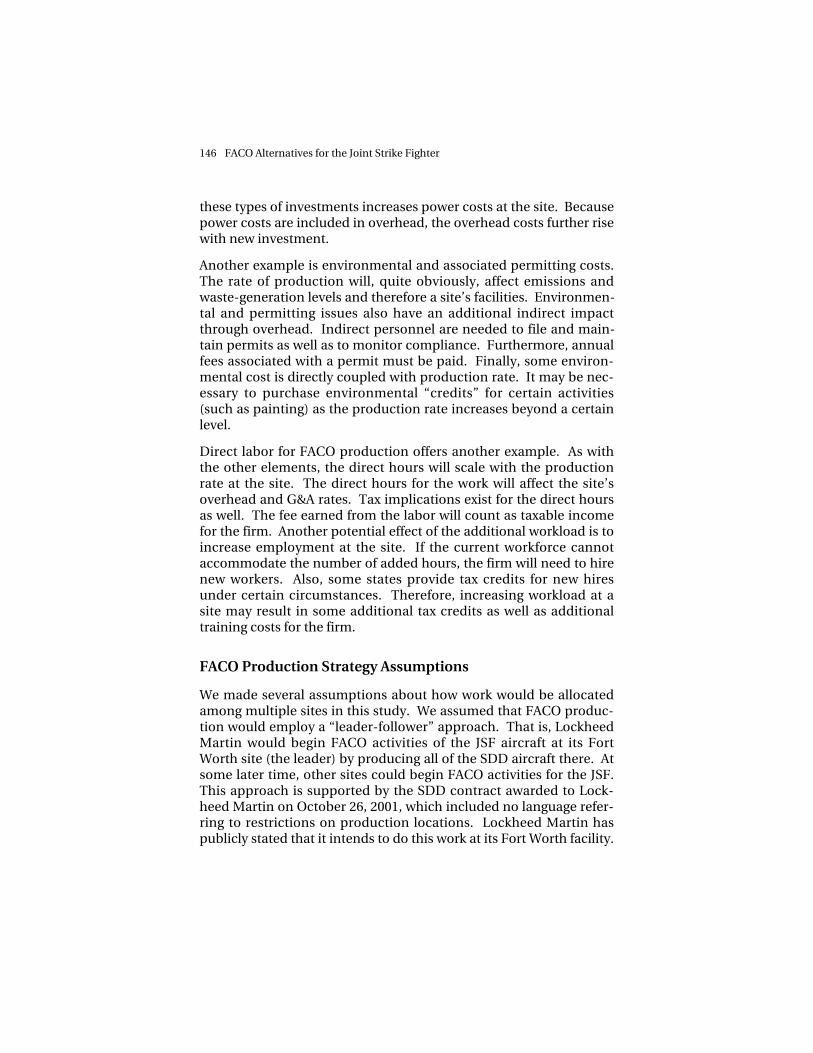
Figure 9.1 illustrates the relationships among the nine cost elementsas implemented in the model. Note that we have split investmentsinto two boxes (government-owned and contractor-owned) for easeof presentation.
We now discuss the logic of some of these connections. The site’sFACO production plan for a facility will determine the neededinvestment in facilities, tooling, and equipment (both contractor-owned and government-owned) necessary for the various activities.The greater the rate of production at a site, the more investment willbe necessary. These investment costs may be for JSF-specific items(government-owned) and, therefore, are charged directly to the pro-gram. Other investments (contractor-owned) get recovered throughdepreciation charges in overhead. Certain investments might be tax-able as property and/or qualify for investment credits—thus thelinkage to taxes and benefits. The major investments, such as facili-ties and equipment, will require power for operation. So, adding
RANDMR1559-9.1
FACOproduction
plan Direct labor
Indirect
Taxesand
benefits
Transportation
Investments—contractor-
owned
Environmental/permitting
Prime andsuppliersupport
FACO $
Power
+ Fee
Investments—government-
owned
Figure 9.1—Relationships Between FACO Cost Elements
146 FACO Alternatives for the Joint Strike Fighter
these types of investments increases power costs at the site. Becausepower costs are included in overhead, the overhead costs further risewith new investment.
Another example is environmental and associated permitting costs.The rate of production will, quite obviously, affect emissions andwaste-generation levels and therefore a site’s facilities. Environmen-tal and permitting issues also have an additional indirect impactthrough overhead. Indirect personnel are needed to file and main-tain permits as well as to monitor compliance. Furthermore, annualfees associated with a permit must be paid. Finally, some environ-mental cost is directly coupled with production rate. It may be nec-essary to purchase environmental “credits” for certain activities(such as painting) as the production rate increases beyond a certainlevel.
Direct labor for FACO production offers another example. As withthe other elements, the direct hours will scale with the productionrate at the site. The direct hours for the work will affect the site’soverhead and G&A rates. Tax implications exist for the direct hoursas well. The fee earned from the labor will count as taxable incomefor the firm. Another potential effect of the additional workload is toincrease employment at the site. If the current workforce cannotaccommodate the number of added hours, the firm will need to hirenew workers. Also, some states provide tax credits for new hiresunder certain circumstances. Therefore, increasing workload at asite may result in some additional tax credits as well as additionaltraining costs for the firm.
FACO Production Strategy Assumptions
We made several assumptions about how work would be allocatedamong multiple sites in this study. We assumed that FACO produc-tion would employ a “leader-follower” approach. That is, LockheedMartin would begin FACO activities of the JSF aircraft at its FortWorth site (the leader) by producing all of the SDD aircraft there. Atsome later time, other sites could begin FACO activities for the JSF.This approach is supported by the SDD contract awarded to Lock-heed Martin on October 26, 2001, which included no language refer-ring to restrictions on production locations. Lockheed Martin haspublicly stated that it intends to do this work at its Fort Worth facility.
Modeling the Cost Implications of Alternative FACO Strategies 147
(We also have no way to estimate the costs to change the contract sothat it includes a requirement to perform FACO at another location.)
The RAND-developed model was flexible enough to analyze the costsof running one to four FACO locations, with any site able to build anypercentage of the total production for each JSF variant (0–100 per-cent). The range of possibilities includes the following:
• Equal percentages of each variant per year per site, so that allsites would perform FACO on equal numbers of variant aircraftover the entire forecast JSF production (subject to minor annualvariations because we assume each site would produce a wholenumber of aircraft each year).
• Allowing one site to perform FACO for all of one or more variantsduring the entire forecast production, which would lead to dif-ferent numbers of JSF aircraft being produced by site in someyears because of the phasing of the buy quantities by variant.
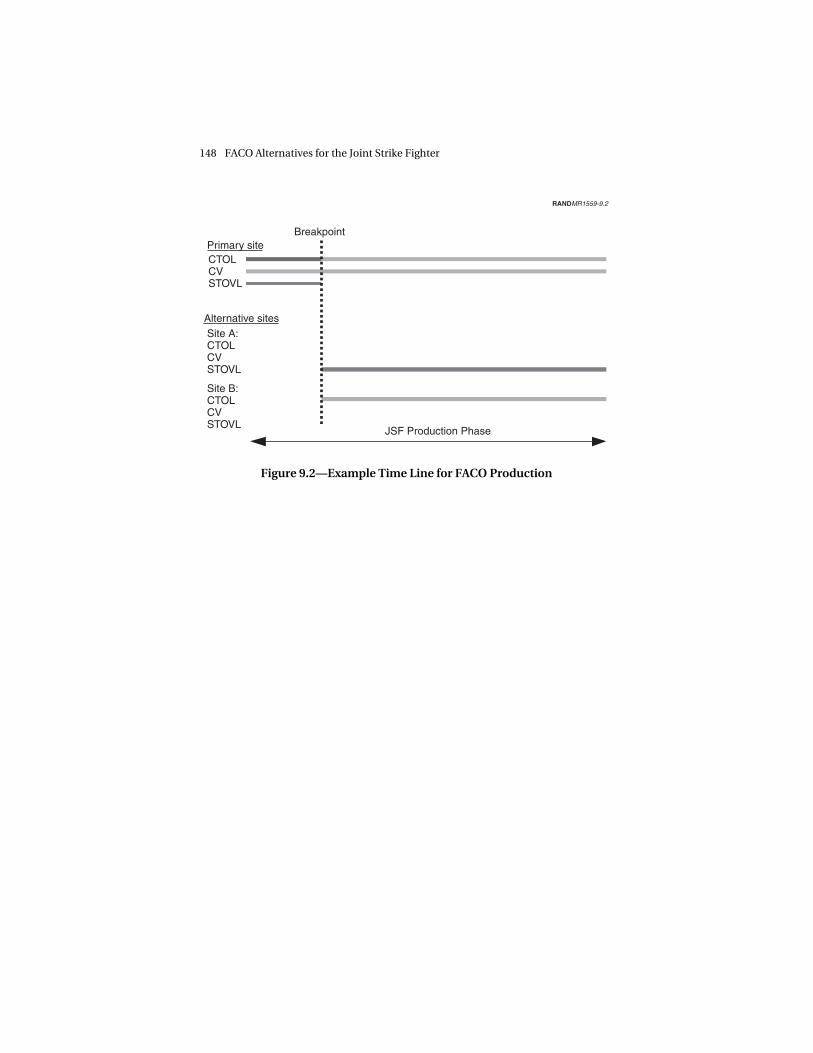
• Allowing one primary site to build all the aircraft for any length oftime in the program, and then having the subsidiary sites split offa portion of the FACO. We assume the decision to split the FACOactivities will be made at one time and will hold for the remain-der of the program life so there will be no later year-by-yearvariations in production allocation by site.
Figure 9.2 shows a sample time line for FACO activities. In thisexample, the primary site performs the FACO activities for all pro-duction until a decision is made to establish other FACO locations.After the breakpoint, the primary site continues with the entire CVand some of the CTOL FACO production. Site A does all of the FACOwork for the STOVL variant after the break. Site B does the balance ofthe CTOL FACO work.
CONCLUSION
The cost model contains significant flexibility and incorporates awide variety of cost elements that would potentially differ amongproduction sites. In the next chapter, we will discuss the specificscenarios we analyzed for different JSF FACO alternatives and theresults from the analyses of these scenarios.
148 FACO Alternatives for the Joint Strike Fighter
RANDMR1559-9.2
Primary siteCTOLCVSTOVL
Site A:CTOLCVSTOVL
Site B:CTOLCVSTOVL
Alternative sites
Breakpoint
JSF Production Phase
Figure 9.2—Example Time Line for FACO Production