Embed Size (px)
Citation preview
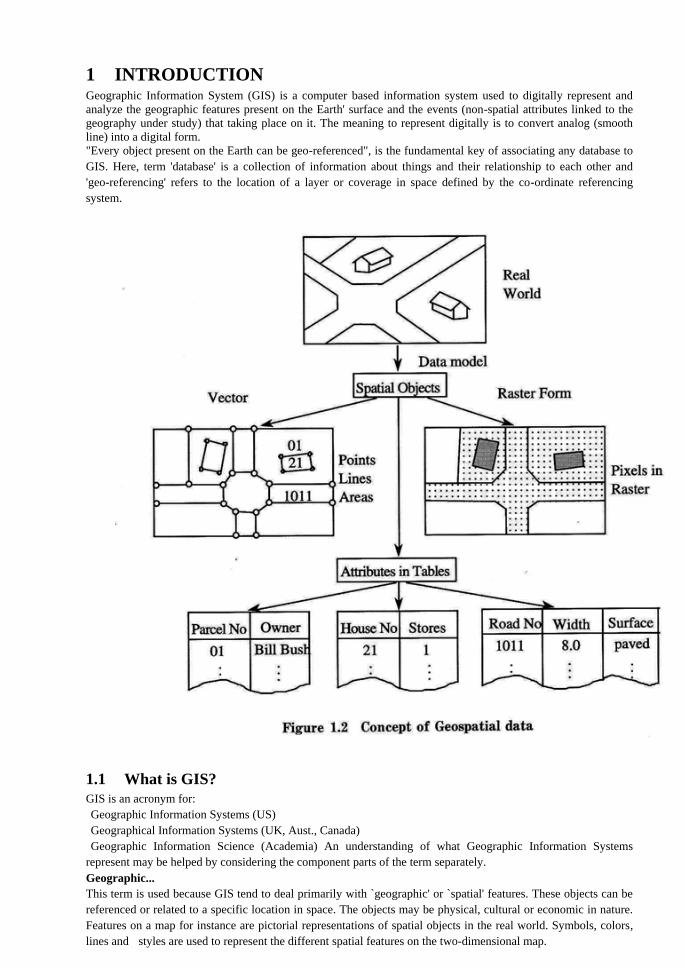
1 INTRODUCTION Geographic Information System (GIS) is a computer based information system used to digitally represent and
analyze the geographic features present on the Earth' surface and the events (non-spatial attributes linked to the
geography under study) that taking place on it. The meaning to represent digitally is to convert analog (smooth
line) into a digital form.
"Every object present on the Earth can be geo-referenced", is the fundamental key of associating any database to
GIS. Here, term 'database' is a collection of information about things and their relationship to each other and
'geo-referencing' refers to the location of a layer or coverage in space defined by the co-ordinate referencing
system.
1.1 What is GIS?
GIS is an acronym for:
Geographic Information Systems (US)
Geographical Information Systems (UK, Aust., Canada)
Geographic Information Science (Academia) An understanding of what Geographic Information Systems
represent may be helped by considering the component parts of the term separately.
Geographic...
This term is used because GIS tend to deal primarily with `geographic' or `spatial' features. These objects can be
referenced or related to a specific location in space. The objects may be physical, cultural or economic in nature.
Features on a map for instance are pictorial representations of spatial objects in the real world. Symbols, colors,
lines and styles are used to represent the different spatial features on the two-dimensional map.
Information...
This represents the large volumes of data, which are usually handled within a GIS. All real world objects have
their own particular set of characteristics or descriptive attributes. This non-spatial alphanumeric data plus
location information needs to be stored and managed for all spatial features of interest.
Conventionally maintained as paper files, computer technology has enabled much more efficient handling and
management of information within automated database management systems.
Systems...
This term is used to represent the systems approach taken by GIS, whereby complex environments are broken
down into their component parts for ease of understanding and handling but are considered to form an integrated
whole. Computer technology has aided and even necessitated this approach so that most information systems are
now computer based.
Computer systems are becoming vital for the storage and manipulation of the increasing volumes of data, the
handling of complex spatial algorithms and the integration of data of different scales, projections and formats. All
of which are essential to GIS.
Therefore, Geographic Information System (GIS) is a computer based information system used to digitally
represent and analyze the geographic features present on the Earth' surface and the events (non-spatial attributes
linked to the geography under study) that taking place on it.
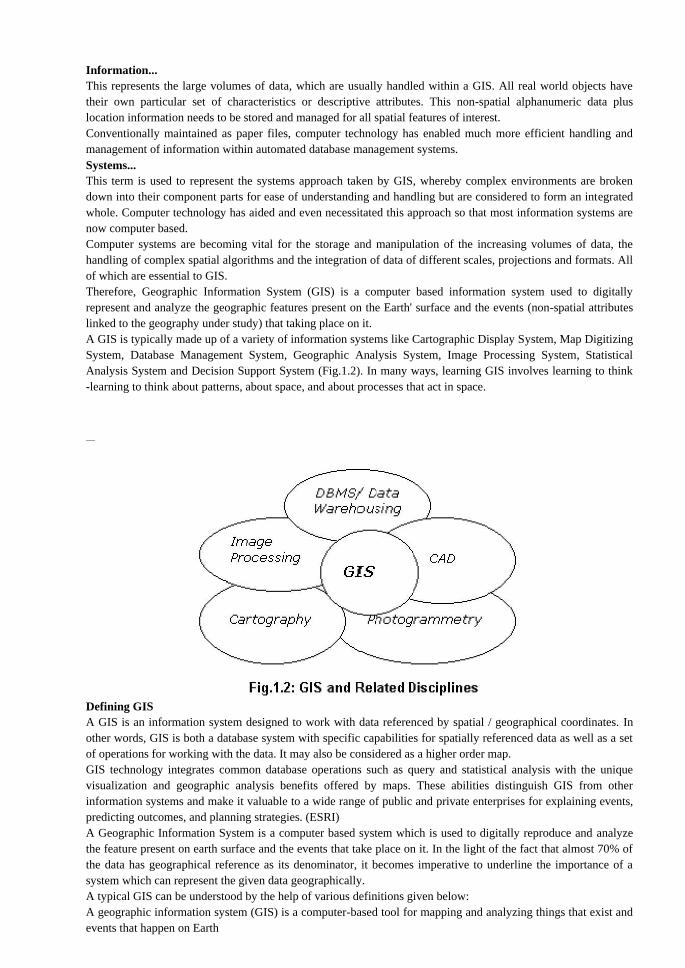
A GIS is typically made up of a variety of information systems like Cartographic Display System, Map Digitizing
System, Database Management System, Geographic Analysis System, Image Processing System, Statistical
Analysis System and Decision Support System (Fig.1.2). In many ways, learning GIS involves learning to think
-learning to think about patterns, about space, and about processes that act in space.
Defining GIS
A GIS is an information system designed to work with data referenced by spatial / geographical coordinates. In
other words, GIS is both a database system with specific capabilities for spatially referenced data as well as a set
of operations for working with the data. It may also be considered as a higher order map.
GIS technology integrates common database operations such as query and statistical analysis with the unique
visualization and geographic analysis benefits offered by maps. These abilities distinguish GIS from other
information systems and make it valuable to a wide range of public and private enterprises for explaining events,
predicting outcomes, and planning strategies. (ESRI)
A Geographic Information System is a computer based system which is used to digitally reproduce and analyze
the feature present on earth surface and the events that take place on it. In the light of the fact that almost 70% of
the data has geographical reference as its denominator, it becomes imperative to underline the importance of a
system which can represent the given data geographically.
A typical GIS can be understood by the help of various definitions given below:
A geographic information system (GIS) is a computer-based tool for mapping and analyzing things that exist and
events that happen on Earth
Burrough in 1986 defined GIS as, "Set of tools for collecting, storing, retrieving at will, transforming and
displaying spatial data from the real world for a particular set of purposes"
Different definitions of GIS given by various organizations are as follows:
A geographic information system, commonly referred to as a GIS, is an integrated set of hardware and
software tools used for the manipulation and management of digital spatial (geographic) and related
attribute data.
A geographic information system (GIS) is a computer-based tool for mapping and analyzing things that
exist and events that happen on earth. GIS technology integrates common database operations such as
query and statistical analysis with the unique visualization and geographic analysis benefits offered by
maps.
GIS is an integrated system of computer hardware, software, and trained personnel linking topographic,
demographic, utility, facility, image and other resource data that is geographically referenced.
A geographic information system (GIS) is a computer-based information system that enables capture,
modeling, manipulation, retrieval, analysis and presentation of geographically referenced data.
1.2 Philosophy of GIS
The proliferation of GIS is explained by its unique ability to assimilate data from widely divergent sources, to
analyze trends over time, and to spatially evaluate impacts caused by development.
For an experienced analyst, GIS is an extension one's own analytical thinking. The system has no in-built
solutions for any spatial problems; it depends upon the analyst.
The importance of different factors of GIS in decreasing order is as under:
* Spatial Analysis
* Database
* Software
* Hardware GIS involves complete understanding about patterns, space, and processes or methodology needed to
approach a problem. It is a tool acting as a means to attain certain objective quickly and efficiently. Its
applicability is realized when the user fully understands the overall spatial concept under which a particular GIS
is established and analyses his specific application in the light of those established parameters.
Before the GIS implementation is considered the objectives, both immediate and long term, have to be
considered. Since the effectiveness and efficiency
(i.e. benefit against cost) of the GIS will depend largely on the quality of initial field data captured, organizational
design has to be decided upon to maintain this data continuously. This initial data capture is most important.
1.3 Advantages of GIS
The Geographic Information System has been an effective tool for implementation and monitoring of municipal
infrastructure. The use of GIS has been in vogue primarily due to the advantage mentioned below:
* Planning of project
* Make better decisions
* Visual Analysis
* Improve Organizational Integration
1.3.1 Planning Of Project Advantage of GIS is often found in detailed planning of project having a large spatial component, where analysis
of the problem is a pre requisite at the start of the project. Thematic maps generation is possible on one or more
than one base maps, example: the generation of a land use map on the basis of a soil composition, vegetation and
topography. The unique combination of certain features facilitates the creation of such thematic maps. With the
various modules within GIS it is possible to calculate surface, length, width and distance.
1.3.2 Making Decisions The adage "better information leads to better decisions" is as true for GIS as it is for other information systems. A
GIS, however, is not an automated decision making system but a tool to query, analyze, and map data in support
of the decision making process. GIS technology has been used to assist in tasks such as presenting information at
planning inquiries, helping resolve territorial disputes, and sitting pylons in such a way as to minimize visual
intrusion.
1.3.3 Visual Analysis Digital Terrain Modeling (DTM) is an important utility of GIS. Using DTM/3D modeling, landscape can be
better visualized, leading to a better understanding of certain relations in the landscape. Many relevant
calculations, such as (potential) lakes and water volumes, soil erosion volume (Example: landslides), quantities of
earth to be moved (channels, dams, roads, embankments, land leveling) and hydrological modeling becomes
easier.
Not only in the previously mentioned fields but also in the social sciences GIS can prove extremely useful.
Besides the process of formulating scenarios for an Environmental Impact Assessment, GIS can be a valuable
tool for sociologists to analyze administrative data such as population distribution, market localization and other
related features.
1.3.4 Improving Organizational Integration Many organizations that have implemented a GIS have found that one of its main benefits is improved
management of their own organization and resources. Because GIS has the ability to link data sets together by
geography, it facilitates interdepartmental information sharing and communication. By creating a shared database
one department can benefit from the work of another--data can be collected once and used many times.
As communication increases among individuals and departments, redundancy is reduced, productivity is
enhanced, and overall organizational efficiency is improved. Thus, in a utility company the customer and
infrastructure databases can be integrated so that when there is planned maintenance, affected people can be
informed by computer-generated letters.
1.4 Need of GIS
Many professionals, such as foresters, urban planners, and geologists, have recognized the importance of spatial
dimensions in organizing & analyzing information. Whether a discipline is concerned with the very practical
aspects of business, or is concerned with purely academic research, geographic information system can introduce
a perspective, which can provide valuable insights as
70% of the information has geographic location as it's denominator making spatial analysis an essential
tool.
Ability to assimilate divergent sources of data both spatial and non-spatial (attribute data).
Visualization Impact
Analytical Capability
Sharing of Information
2 Components of a GIS An operational GIS also has a series of components that combine to make the system work. GIS have five
important components, computer hardware, sets of application software modules, required data, people who
manage the system and develops plans, and a well designed implementation method. These components are
critical to a successful GIS.
A working GIS integrates the following five key components:
Hardware
Software
Data
People
Methods
2.1 Hardware
Hardware is the computer system on which a GIS operates. A GIS relies on a computer for storage and processing
of data. The size of the computing system will depend on the type and nature of the GIS. A small-scale GIS will
only need a small personal computer to run on, while a large, enterprise-wide system will need larger computers
and a host of client machines to support multiple users.
In addition to computers, a variety of other devices can be used to capture and feed data into the system. Scanners
and digitizing tables are used to scan existing paper maps, charts and drawings into the system. GPS receivers are
used to create map features in the field and transmit the current location of moving vehicles. Today, GIS software
runs on a wide range of hardware types from centralized computer servers to desktop computers used in
stand-alone or networked configurations.
2.2 Software
GIS software provides the functions and tools needed to store, analyze, and display geographic information. The
core of any GIS system lies in the GIS software itself, providing the functionality to store, manage, link, query
and analyze geographic data. In addition to the core, various other software components can be added to GIS
software to provide access to additional sources of data and forms of functionality. Imaging systems used to
analyze satellite imagery, database management systems used to store additional sets of data, and CAD systems
can all be integrated into a GIS solution to provide the data and full functionality needs of the GIS.
2.3 Data
The most important component of a GIS is the data. Geographic data and related tabular data can be collected
in-house, compiled to custom specifications and requirements, or purchased from a commercial data provider. A
GIS can integrate spatial data with other existing data resources often stored in a corporate DBMS. The
integration of spatial data (often proprietary to the GIS software), and tabular data stored in a DBMS is the key
functionality afforded by a GIS.
Data for a GIS comes in two forms—geographic or spatial data, and attribute of spatial data. Spatial data are data
that contain an explicit geographic location in the form of a set of coordinates. Attribute data are descriptive sets
of data that contain various information relevant to a particular location, e.g. depth, height, and sales figures; and
can be linked to a particular location by means of an identifier, e.g. address and zip code.
Sources of spatial data include paper maps, charts, and drawings scanned or digitized into the system, digital files
imported from CAD or other graphic systems, coordinate data recorded using a GPS receiver and data captured
from satellite imagery or aerial photography.
Sources of attribute data include databases, workflow, messaging, and any other form of computer system that
stores data sets that can be linked to the GIS by means of a common identifier. Data streams generated by sensors
or data loggers of any kind can be stored in the GIS and that data can be linked to it by means of an identifier.
Data from satellite imagery derived through image analysis techniques that can be linked to a location or set of
locations.
2.4 People
The main objective of a GIS is to support its users with the appropriate data and decision support tools. Thus
careful consideration of particular needs of the users must be given at the design stages of the system, so that each
group of users will be given access to the data and functionality of the system in the most appropriate way. A
system must be highly accessible and usable, otherwise it may not to be used effectively, or may not be used at
all.
Some users need access to the most advanced functionality features a GIS offers, and are willing to invest the
time needed to learn how to effectively use these tools. Other users only need specific answers to their questions.
In such cases, they have no need for advanced functionality and there is no point in investing the funds required
to train them. Hence for maximum utilization of GIS by the users, it is necessary to invest in workstations and
training, allowing them to directly interact with the GIS. A careful attention to the needs of each user group will
lead to higher utilization rates, and therefore, a greater return results on the investment in GIS technology.
GIS technology is of limited value without the people who manage the system and develop plans for applying it
to real world problems. GIS users range from technical specialists who design and maintain the system to those
who use it to help them perform their everyday work. The identification of GIS specialists versus end users is
often critical to the proper implementation of GIS technology.
2.5 Methods
A successful GIS operates according to a well-designed implementation plan and business rules, which are the
models and operating practices unique to each organization.
As in all organizations dealing with sophisticated technology, new tools can only be used effectively if they are
properly integrated into the entire business strategy and operation. To do this properly, it requires not only the
necessary investments in hardware and software, but also in the hiring of personnel to utilize the new technology
in the proper organizational context. Failure to implement the GIS without regard for a proper organizational
commitment will result in an unsuccessful system. It is simply not sufficient for an organization to purchase a
computer with some GIS software, hire some enthusiastic individuals and expect instant success.
2.6 Factors Aiding the Rise of GIS.
Revolution in Information Technology. Computer Technology, Remote Sensing, Global Positioning
System
Communication Technology.
Rapidly declining cost of Computer Hardware, and at the same time, exponential growth of operational
speed of computers.
Enhanced functionality of software and their user-friendliness.
Visualizing impact of GIS corroborating the Chinese proverb "a picture is worth a thousand words."
Geographical feature and data describing it are part of our everyday lives & most of our everyday
decisions are influenced by some facet of Geography.
2.7 History of GIS
Work on GIS began in late 1950s, but first GIS software came only in late 1970s from the lab of the ESRI.
Canada was the pioneer in the development of GIS as a result of innovations dating back to early 1960s. Much of
the credit for the early development of GIS goes to Roger Tomlinson. Evolution of GIS has transformed and
revolutionized the ways in which planners, engineers, managers etc. conduct the database management and
analysis.
1960’s – Canada Geographic Information System (CGIS) – developed by Roger Tomlinson.
- In USA a similar system developed for processing natural resources data
1970’s – Main developments took place in universities in the US, Canada and UK
- Commercial agencies like ESRI and Intergraph staring to develop and offer
- Growing awareness of the need for sound and stable structure to store and analyze map data becoming a
dominant trend
1980’s – Marked with the widespread availability of PCs, tremendous progress on research on spatial data
structures, indexing methods and spatial databases
- In 1988 with the formation of NCGIA major contributions towards the progress in GIS research.
1990’s – Breaking through of object orientation in system and database design.
- Geo-informatics in professional recognition, spatial information theory – theoretical basis for GIS
- GIS enters medium and small businesses and new domains such as geo-marketing
- Evolution of Desktop GIS, Internet GIS
2.8 GIS Applications
2.8.1 Government Applications
Economic development
Transportation and Service Routing
Housing
Infrastructure
Health
Tax Maps
Human Services
Law Enforcement
Land use planning
Parks and Recreation
Environmental Monitoring
Emergency Management
Geodemographics
2.8.2 Business Applications
Delivery of goods and services
Retail store placement
Distribution of competitors
Location of potential customers
Traffic flow
Parking locations
2.8.3 Environmental Applications
Land cover and land use analysis
Modeling watersheds
Soil Erosion
Forest management
Conservation and Protected Areas
2.8.4 Computer Cartography The growth of computer-assisted-cartography (CAC) has been largely dependent on the development of
vector-based GIS. With the help of GIS, cartographic tasks such as thematic overlays of information, map
projections, and map sheet layouts can be performed much more conveniently.
Continually updated geographic databases provide an easy way to produce new map editions. Automated
mapmaking and virtual map images have replaced traditional paper maps in many applications. Web-based maps
have made general-purpose navigation far more accessible to the public.
However, manually digitized paper maps remain the primary form of data input in an automated cartography GIS.
Scanned maps are also often used.
2.8.5 Land Information GIS has aided management of land information by enabling easy creation and maintenance of data for land
records, land planning and land use. In particular, a flourishing number of municipal governments have started to
implement GIS to help manage their land information. GIS makes input, updates, and retrieval of data such as tax
records, land-use plan, and zoning codes much easier then during the paper-map era.
Typical uses of GIS in land information management include managing land registry for recording titles to land
holdings, preparing land-use plan and zoning maps, cadastral mapping etc. Input of data into a land information
GIS includes: political and administrative boundaries, transportation, and soil cover.
2.9 Spatial Operation
Spatial operations are functions that form important components of an underlying model that takes input data,
performs analysis on it, and assimilates the data to produce output information.
The following operations can be used to create new data from input data.
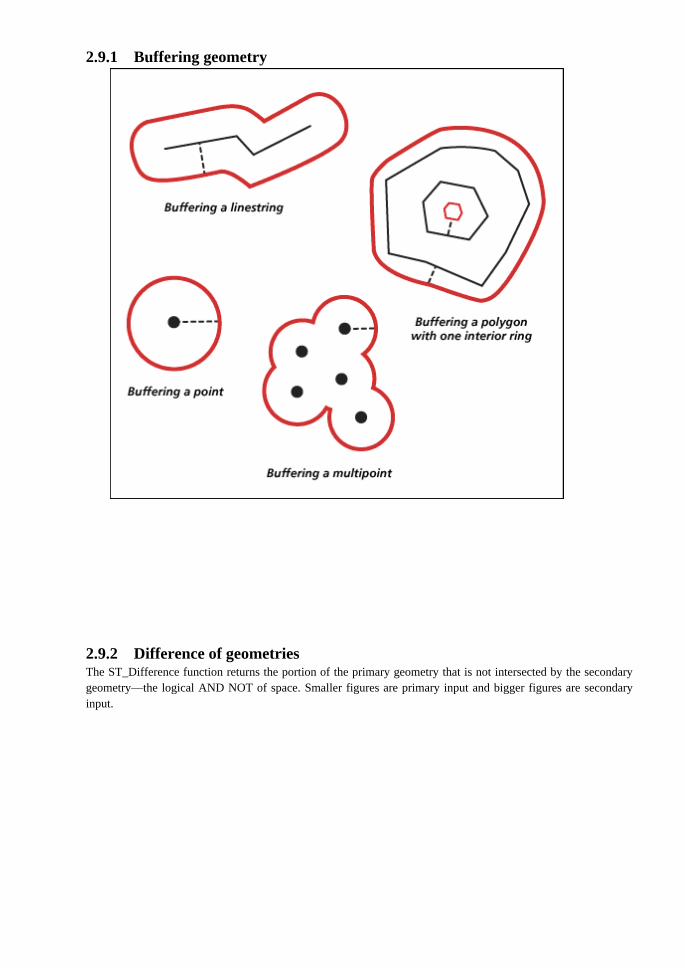
2.9.1 Buffering geometry
2.9.2 Difference of geometries The ST_Difference function returns the portion of the primary geometry that is not intersected by the secondary
geometry—the logical AND NOT of space. Smaller figures are primary input and bigger figures are secondary
input.
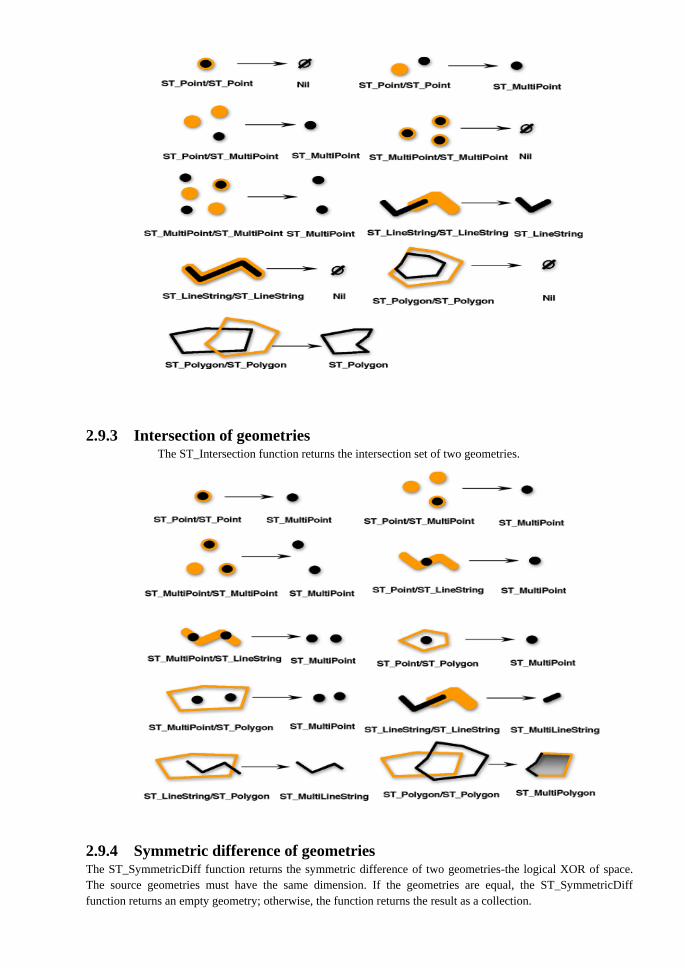
2.9.3 Intersection of geometries The ST_Intersection function returns the intersection set of two geometries.
2.9.4 Symmetric difference of geometries The ST_SymmetricDiff function returns the symmetric difference of two geometries-the logical XOR of space.
The source geometries must have the same dimension. If the geometries are equal, the ST_SymmetricDiff
function returns an empty geometry; otherwise, the function returns the result as a collection.
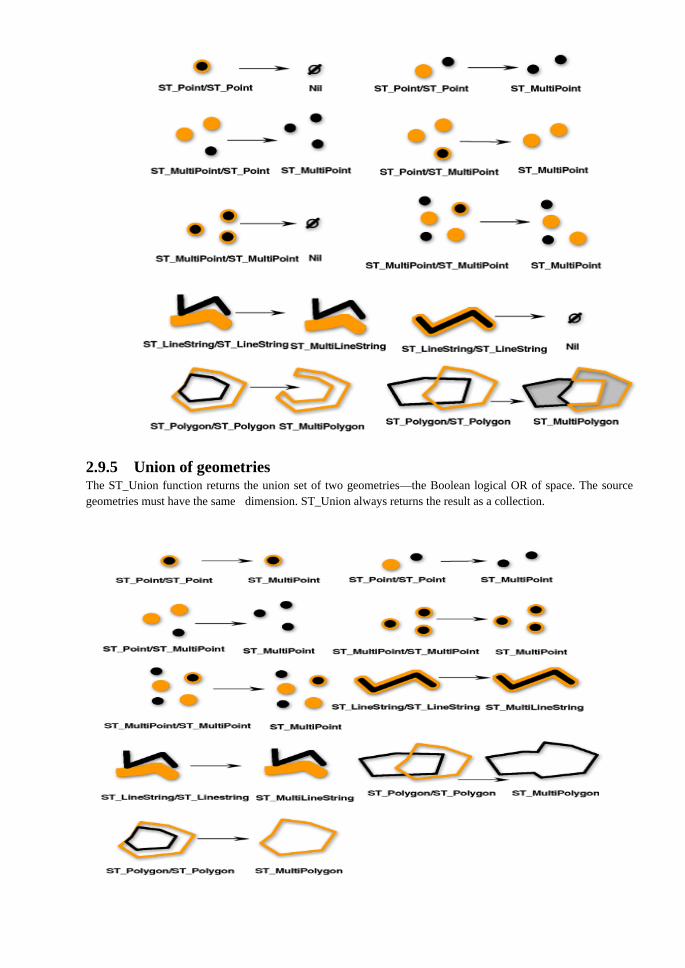
2.9.5 Union of geometries The ST_Union function returns the union set of two geometries—the Boolean logical OR of space. The source
geometries must have the same dimension. ST_Union always returns the result as a collection.
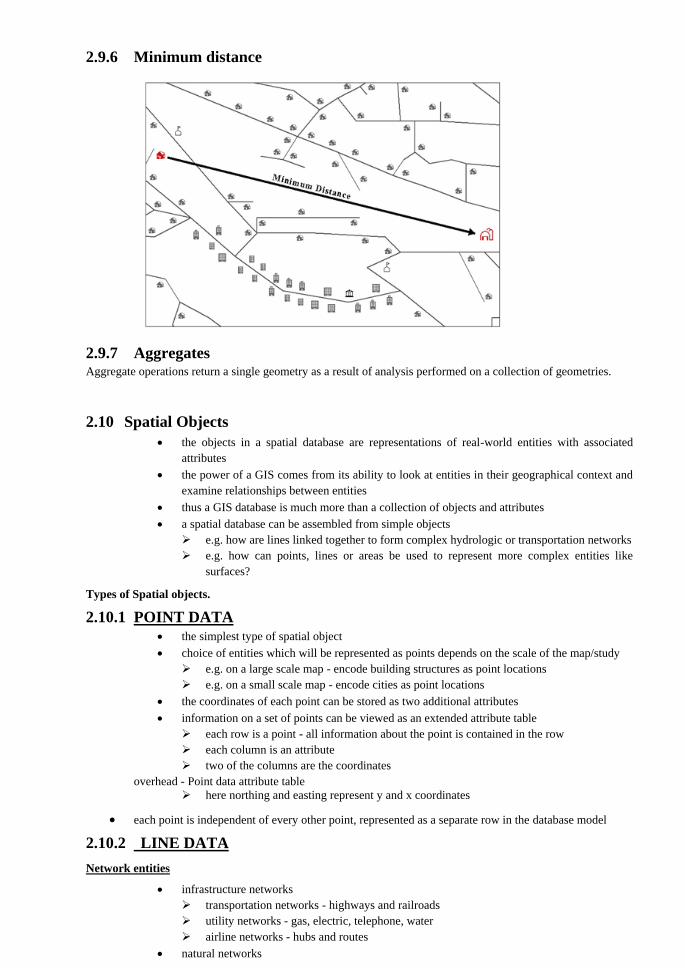
2.9.6 Minimum distance
2.9.7 Aggregates Aggregate operations return a single geometry as a result of analysis performed on a collection of geometries.
2.10 Spatial Objects
the objects in a spatial database are representations of real-world entities with associated
attributes
the power of a GIS comes from its ability to look at entities in their geographical context and
examine relationships between entities
thus a GIS database is much more than a collection of objects and attributes
a spatial database can be assembled from simple objects
e.g. how are lines linked together to form complex hydrologic or transportation networks
e.g. how can points, lines or areas be used to represent more complex entities like
surfaces?
Types of Spatial objects.
2.10.1 POINT DATA
the simplest type of spatial object
choice of entities which will be represented as points depends on the scale of the map/study
e.g. on a large scale map - encode building structures as point locations
e.g. on a small scale map - encode cities as point locations
the coordinates of each point can be stored as two additional attributes
information on a set of points can be viewed as an extended attribute table
each row is a point - all information about the point is contained in the row
each column is an attribute
two of the columns are the coordinates
overhead - Point data attribute table
here northing and easting represent y and x coordinates
each point is independent of every other point, represented as a separate row in the database model
2.10.2 LINE DATA
Network entities
infrastructure networks
transportation networks - highways and railroads
utility networks - gas, electric, telephone, water
airline networks - hubs and routes
natural networks
river channels
Network characteristics
a network is composed of:
nodes - junctions, ends of dangling lines
links - chains in the database model
diagram
valency of a node is the number of links at the node
ends of dangling lines are "1-valent"
4-valent nodes are most common in street networks
3-valent nodes are most common in hydrology
a tree network has only one path between any pair of nodes, no loops or circuits are possible
most river networks are trees
Attributes
examples of link attributes:
direction of traffic, volume of traffic, length, number of lanes, time to travel along link
diameter of pipe, direction of gas flow
voltage of electrical transmission line, height of towers
number of tracks, number of trains, gradient, width of most narrow tunnel, load bearing
capacity of weakest bridge
examples of node attributes:
presence of traffic lights, presence of overpass, names of intersecting streets
presence of shutoff valves, transformers
note that some attributes (e.g. names of intersecting streets) link one type of entity to another
(nodes to links)
some attributes are associated with parts of network links
e.g. part of a railroad link between two junctions may be inside a tunnel
e.g. part of a highway link between two junctions may need pavement maintenance
many GIS systems require such attributes to be attached to the network by splitting existing
links and creating new nodes
e.g. split a street link at the house and attach the attributes of the house to the new
(2-valent) node
e.g. create a new link for the stretch of railroad which lies inside the tunnel, plus 2 new
nodes
this requirement can lead to impossibly large numbers of links and 2-valent nodes
e.g. at a scale of 1:100,000, the US rail network has about 300,000 links
the number of links would increase by orders of magnitude if new nodes had to be
defined in order to locate bridges on links
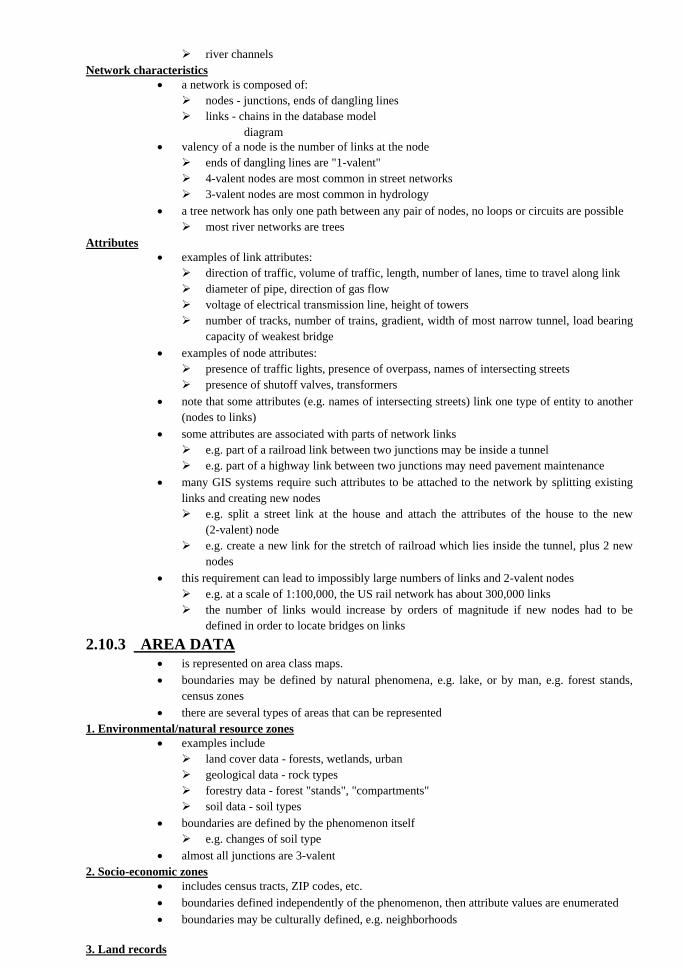
2.10.3 AREA DATA
is represented on area class maps.
boundaries may be defined by natural phenomena, e.g. lake, or by man, e.g. forest stands,
census zones
there are several types of areas that can be represented
1. Environmental/natural resource zones
examples include
land cover data - forests, wetlands, urban
geological data - rock types
forestry data - forest "stands", "compartments"
soil data - soil types
boundaries are defined by the phenomenon itself
e.g. changes of soil type
almost all junctions are 3-valent
2. Socio-economic zones
includes census tracts, ZIP codes, etc.
boundaries defined independently of the phenomenon, then attribute values are enumerated
boundaries may be culturally defined, e.g. neighborhoods
3. Land records
land parcel boundaries, land use, land ownership, tax information
Areal coverage
overhead - Areal coverage
1. entities are isolated areas, possibly overlapping
any place can be within any number of entities, or none
e.g. areas burned by forest fires
areas do not exhaust the space
2. any place is within exactly one entity
areas exhaust the space
every boundary line separates exactly two areas, except for the outer boundary of the
mapped area
areas may not overlap
any layer of the first type can be converted to one of the second type
each area may now have any number of fire attributes, depending on how many times it
has been burned - unburned areas will have none
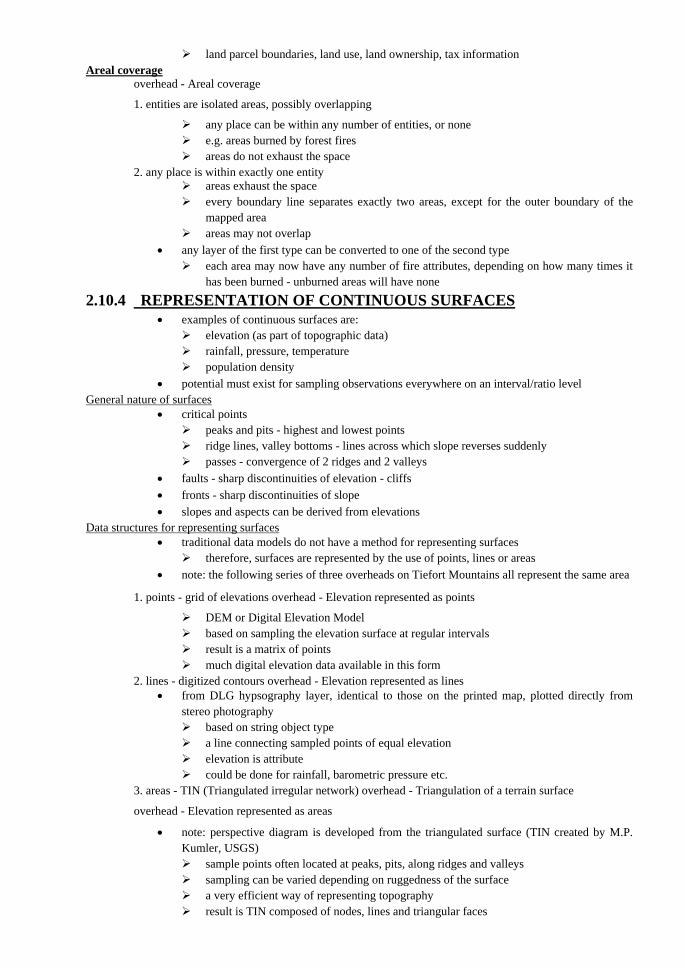
2.10.4 REPRESENTATION OF CONTINUOUS SURFACES
examples of continuous surfaces are:
elevation (as part of topographic data)
rainfall, pressure, temperature
population density
potential must exist for sampling observations everywhere on an interval/ratio level
General nature of surfaces
critical points
peaks and pits - highest and lowest points
ridge lines, valley bottoms - lines across which slope reverses suddenly
passes - convergence of 2 ridges and 2 valleys
faults - sharp discontinuities of elevation - cliffs
fronts - sharp discontinuities of slope
slopes and aspects can be derived from elevations
Data structures for representing surfaces
traditional data models do not have a method for representing surfaces
therefore, surfaces are represented by the use of points, lines or areas
note: the following series of three overheads on Tiefort Mountains all represent the same area
1. points - grid of elevations overhead - Elevation represented as points
DEM or Digital Elevation Model
based on sampling the elevation surface at regular intervals
result is a matrix of points
much digital elevation data available in this form
2. lines - digitized contours overhead - Elevation represented as lines
from DLG hypsography layer, identical to those on the printed map, plotted directly from
stereo photography
based on string object type
a line connecting sampled points of equal elevation
elevation is attribute
could be done for rainfall, barometric pressure etc.
3. areas - TIN (Triangulated irregular network) overhead - Triangulation of a terrain surface
overhead - Elevation represented as areas
note: perspective diagram is developed from the triangulated surface (TIN created by M.P.
Kumler, USGS)
sample points often located at peaks, pits, along ridges and valleys
sampling can be varied depending on ruggedness of the surface
a very efficient way of representing topography
result is TIN composed of nodes, lines and triangular faces
2.11 Spatial interpolation
frequently when using continuous data we wish to estimate values at specific locations which are not
part of the point, line or area dataset
these values must be determined from the surrounding values using techniques of spatial
interpolation (see Units 40 and 41)
e.g. to interpolate contours, a regular grid is often interpolated from an irregular scatter
of points or densified from a sparse grid
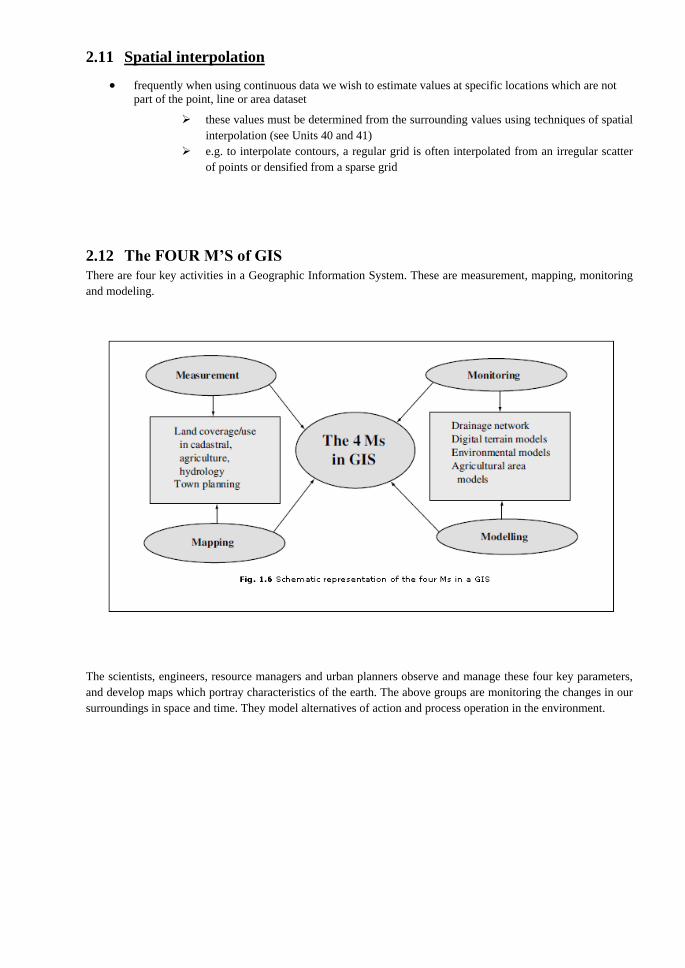
2.12 The FOUR M’S of GIS
There are four key activities in a Geographic Information System. These are measurement, mapping, monitoring
and modeling.
The scientists, engineers, resource managers and urban planners observe and manage these four key parameters,
and develop maps which portray characteristics of the earth. The above groups are monitoring the changes in our
surroundings in space and time. They model alternatives of action and process operation in the environment.