Embed Size (px)
Citation preview

1
Chapter One
Introduction and Roadmap to the Thesis
Optical microcavities have now been infused into a variety of scientific arenas and have
found applications in numerous technologies. The significance of their role in science and
the abundance of their applications are expanding at a fast pace as higher quality factors
are being achieved and novel geometries are being developed.
Quality factor (Q) is a measure of optical loss in microcavities and determines the
extent of temporal confinement of optical filed in these structures. Microtoroids, used
throughout my thesis work, belong to the category of surface-tension-induced-
microcavities that have proved to provide the highest quality factors to date. Highly
efficient coupling of optical power to these cavities has also been realized by extremely
low-loss tapered optical fibers. Combination of ultra-high-Q microcavities and tapered
fibers can hence result in minimizing optical loss in various studies, which is often the
main obstacle in realizing distinct physical functionalities. The ability to attain high
efficiency power transfer between two distinct waveguides is an example of the tasks that
have long been tried to be addressed by optical microcavities. Chapter 2 describes my
effort in attending to this long-sought goal. A universal model for the resonant-coupling
efficiency is developed and confirmed by adjusting the coupling between the resonator
and waveguides. Different regimes of operation are investigated, and as a result, a record
waveguide-to-waveguide power transfer efficiency of 93% (0.3 dB loss) for extremely
narrow bandwidth four-port couplers is achieved (57 MHz at 1550nm wavelengths). The
2
transfer efficiency is predicted to be even higher for narrower bandwidth filters. The
substantial improvement demonstrated in this chapter, compared to all prior work on
similar microcavity-type structures, elevates their performance to a level at which they
could be useful for loss-sensitive quantum optical applications, which until now have not
been accessible for these devices.
Chapter 2 demonstrates an almost ideal design that diminishes the optical losses
to a limit where the intrinsic microcavity losses become the limiting factor in the device
performance. Transcending these limits demands a precise knowledge of the sources of
intrinsic optical loss in microcavities. Chapter 3 of this thesis investigates different
sources of optical loss present in whispering-gallery microcavities. Scattering and
absorption are generally considered the responsible loss mechanisms in limiting the
quality factor of optical cavities with large enough diameters that render the whispering-
gallery losses insignificant. Quality factor measurement, however, can only determine the
total optical loss present in the device or, in other words, the sum of scattering and
absorption losses. Ability to differentiate these two mechanisms, nevertheless, is
instrumental in fabrication and also numerous applications of these devices. As a relevant
example, fabrication of microtoroids for the first time in our laboratory was accompanied
by the ambiguity as to what process limits the achievable quality factors of these cavities.
Surface roughness, contaminants on the surface, or impurities in the thermally grown
oxide on the silicon wafer, among many, were all equally likely to cause this limitation.
Resolution on this issue could have a great impact on focusing our efforts towards
efficient optimization of microtorid fabrication.

3
Since the optical mode is located in the periphery of the whispering-gallery
microcavities, the scattering losses are mainly due to surface roughness of these
structures. Historically, therefore, the method used to determine the magnitude of
scattering losses was careful theoretical estimation of the surface irregularities of
microcaities and determining the surface roughness and the correlation parameters. Given
the complexity of this task requiring high resolution imaging and detailed mathematical
analysis of surface roughness of these microstructures, and also the inherent requirement
of comparison with empirical results, I was prompted to develop an experimental
technique to isolate absorption losses from those due to scattering. The circulating power
in microcavities is partially absorbed and partially scattered, but only the absorbed power
can generate heat and temperature rise in the structure, resulting in a nonlinearity called
“thermal bistability.” This phenomenon is exploited in chapter 3 as a new tool for
characterizing the relative importance of absorption and scattering losses in toroidal
microcavities. An empirical realization was made during this study, of the existence of
water molecules on the cavity surface, the optical absorption of which is the dominant
loss mechanism under certain conditions. Based on this result, thermal nonlinearity of
microtoroids was used to reveal the role of surface contaminants in absorption losses, and
hence to study the interaction of microtoroids with their ambient environment. Prospects
of this work could be beneficial in sensing applications, an example of which is
illustrated in detail in chapter 3.
Extremely low intrinsic losses in ultra-high-Q optical microcavities (e.g.,
microspheres and microtoroids) make them also ideally suited for observing nonlinear
optical effects with extremely low (sub-microwatt) threshold powers. The combination of

4
high circulating power made possible by high quality factor and strong confinement of
this power within mode volumes of the order of hundreds of μ m3 lead to inter-cavity
circulating intensities, which are sufficient to unveil nonlinear phenomena even in
materials like silica that are weakly nonlinear. Thermal nonlinearity, for instance, is not
the only effect contributing to the bistability effect observed in experiments in chapter 3.
Optical Kerr effect or intensity-dependent refractive index phenomenon leads to optical
bistabilty in a similar way as do thermal nonlinearities. The observation of this effect,
however, is problematic as it is accompanied by relatively larger thermal nonlinear
effects. In an attempt towards observation of this nonlinearity in micro-cavities, evidence
is found for Kerr bistability by immersing microspheres in a superfluid helium bath at
2K. This cryogenic setup greatly reduces the sensitivity of WGM resonances to
temperature and allows the Kerr effect to be dominant and hence observable. In chapter
4, however, an innovative method for observing the optical Kerr effect in microcavities at
room temperature and in presence of the dominant thermal nonlinearities is proposed and
experimentally verified. The technique discriminates against the much larger and
typically dominant thermal component of nonlinearity by using its relatively slow
frequency response compared to the almost instantaneous Kerr effect. Measurement of
the Kerr coefficient ( 2n ), or equivalently third-order nonlinear susceptibility of the cavity
material ( )3(χ ), is demonstrated for the case of a silica microcavity. With this approach
useful information about the characteristic thermal response time in microresonators can
also be acquired.
Whispering-gallery microresonators have historically been perceived as structures
that could efficiently confine optical energies. This is due to their exceedingly low losses

5
at optical frequencies. In the final years of my Ph. D. studies, I had the opportunity to
explore the quality of these structures in a starkly different frequency range. Optical
microcavities like any other structure have mechanical eigenmodes or resonant modes of
vibration. The same way that optical Q factor describes the temporal energy confinement
in optical frequencies, a quality factor can be associated to each one of these mechanical
eigenmodes, representing the efficiency of energy storage at mechanical frequencies. The
micron size of these structures results in vibrations at radio frequencies, about seven
orders of magnitude apart from the optical frequencies. Mechanical quality factors of
toroidal microcavities at their eigenfrequencies of vibration (1-100 MHz in devices
studied in this thesis) are measured in chapter 5. Q factors in excess of 5,000 are reported
in this chapter, revealing a heretofore unknown potential of these structures in storing
energy at frequencies remarkably distant from their optical resonant modes. This
realization stimulates a curiosity as to whether these two resonators, an optical one
resonating at 100 THz and a mechanical one resonating at tens of MHz frequencies now
both present in the same device, could potentially be coupled to each other.
Chapter 5 describes how radiation-pressure or the force due to impact of photons
could result in exceptionally strong coupling between these two resonators. The
discovered optomechanical coupling present in toroid microcavities is shown to reach
such a high level that could initiate regenerative mechanical oscillations of the cavity
structure with only microwatts of optical threshold power. This is the first demonstration
of radiation-pressure-induced mechanical oscillations in any type of optomechanical
system. Chapter 5 presents a detailed theoretical and experimental analysis of this effect
in ultra-high-Q microtoroids. Embodied within a microscale, chip-based device, this

6
mechanism can both benefit research into macroscale quantum mechanical phenomena
and improve the understanding of the mechanism within the context of Laser
interferometer gravitational-wave observatory (LIGO). It also suggests that new
technologies are possible that will leverage the phenomenon within photonics.
Chapter 6 provides a brief summary of the presented material in this thesis and its
significance and prospects for different scientific communities and technological
applications.

7
Chapter Two
Ultra-Low-Loss, High-Q, Four-Port Resonant Couplers
2-1 Introduction
Minimizing optical loss is of crucial importance in various studies, as it is often the main
obstacle in realizing distinct physical functionalities. This is true in quantum optical
applications of microcavities where parasitic loss can both inhibit the generation of
quantum states and interfere with intended coupling to a transport medium such as optical
fiber [1-8]. Also, in photonic applications of these devices [9-12], the ability to attain
high-efficiency power transfer between two distinct waveguides is of great interest. The
ability to attain coupling coefficients between the resonator and waveguides that are
greater than the intrinsic roundtrip loss of the cavity (usually called the overcoupled
regime) is fundamental to achieve high waveguide-to-waveguide resonant power-transfer
efficiency. High waveguide coupling efficiency and high intrinsic quality factor (Q) are
hence essential in almost all applications of waveguide-coupled resonator systems. Such
characteristics ensure that overall quality factor of the system can be dominated by the
intentional control of waveguide loading (coupling into and out-from the resonator) as
opposed to parasitic mechanisms that include intrinsic losses of the cavity and scattering
losses at the waveguide-resonator junctions.
In this chapter an all-optical four-port resonant coupler (add-drop geometry) is
demonstrated. Ultra-high-Q (>108) toroidal microcavities [13] and tapered optical fibers
8
are the building blocks of this filter configuration. A new realm of performance is
enabled for operation of these devices, combining the ultra-high-quality-factor (UHQ)
microresonators (Q>108) [7,8,13] and the ability to provide high efficiency coupling to
these cavities by use of low-loss tapered fiber waveguides [14].
A model for the resonant-coupling efficiency and quality factor variation versus
waveguide loading is developed and confirmed by adjusting the coupling between the
resonator and waveguides. Different regimes of operation are investigated and, as a
result, waveguide-to-waveguide power transfer efficiency of 93% (0.3 dB loss) and
nonresonant insertion loss of 0.02% (<0.001 dB) for narrow bandwidth (57 MHz at
1550nm wavelengths) four-port couplers are achieved. The transfer efficiency is
predicted to be even higher for narrower bandwidth filters. This represents a substantial
improvement compared to all prior work on similar microcavity-type structures, elevating
their performance to a level at which they could be useful for loss-sensitive quantum
optical applications that until now have not been accessible for four-port resonant
couplers. The combination of low loss, fiber compatibility, and wafer-scale design would
be suitable for a variety of applications ranging from quantum optics to photonic
networks.

9
2-2 Add-Drop Geometry and Power Transfer Efficiency
Figure 2.1 depicts the device geometry including a UHQ microtoroid resonator
evanescently side-coupled to a pair of tapered optical fibers. In this configuration where a
whispering-gallery mode enables resonant power transfer between two distinct
waveguides, the microcavity acts as a frequency selective coupler. Resonant optical
power ( 2λ in Figure 2.1) launched into port 1 is transferred to port 4 via the microtoroid,
while nonresonant waves are largely unaffected upon transmission beyond the resonator-
waveguide junction. This system (symmetric or asymmetric geometry add/drop [15]) can
be studied using a simple model based on the assumption of weak coupling between the
resonator and waveguides, which is valid in the current work. Weak coupling allows the
separation of individual contributions to the cavity field decay time. A quality factor can
be assigned to each dissipation process where the total quality factor takes the following
compact form:
dropbustotal QQQQ1111
0
++= (2.1)
busQ and dropQ are quality factors associated with coupling to bus (input) and drop
(output) waveguides, respectively. The overall quality factor of the system ( totalQ )
determines the filter bandwidth and is lower than the intrinsic Q of the cavity ( 0Q ), due to
the intentionally introduced couplings at the waveguide-resonator junctions.

10
Figure 2.1: Illustration showing a microtoroid four-port filter (add/drop geometry).
Wavelength 2λ in the bus waveguide is resonant with a whispering gallery mode of the
resonator and subsequently couples to the drop waveguide. Nonresonant launched power
( 1λ ) is transmitted past the resonator-waveguide junction. Inset is a top view
photomicrograph of a microtoroid coupled to two tapered optical fibers.

11
The following relationship exists between the transmitted and dropped power:
TDQ
Qdrop −=⎥⎦
⎤⎢⎣
⎡+ 11
0
(2.2)
where T and D are the transmitted and coupled (dropped) powers normalized to the
incident signal power (see Figure 2.1). Assuming a fixed coupling between the resonator
and the drop waveguide (fixed dropQ ), the dropped power to port 4 and the transmitted
power to port 2 lie on a straight line, as coupling to the bus waveguide ( busQ ) varies. At
the critical coupling point (T=0) [16,17], the drop efficiency reaches its maximum value:
0max
21QQD total−= (2.3)
The important role of high intrinsic Q cavities (high 0Q ) in obtaining high-power
transfer efficiency is apparent in this expression. The condition of criticality,
10
11 −−− += QQQ dropbus , assures that coupling to the resonator from the input waveguide
compensates both for the intrinsic loss of the cavity and the power coupling to the drop
waveguide. It also ensures high transmission extinction of the resonant signal in the input
waveguide.
The sources of deviation from unity efficiency include the degree to which the
resonator is non-critically coupled (T>0), the high, but nonetheless finite intrinsic Q
factor of the resonator, and the parasitic losses at the resonator-waveguide junction,
which include both scattering losses and coupling to the undesired modes of the tapered
fiber [14]. As will be discussed later in the chapter, the latter losses, which can be
effectively lumped in to the Q0 of the coupled resonator, are negligible in this work. Also,
throughput extinctions above 30 dB (T< 0.001) are achieved, which rules out the non-

12
critical coupling as a significant source of power transfer inefficiency. Therefore in this
work the efficiency is solely limited by the finite Q of the cavities.
2-3 Experimental Results
To confirm the theoretical analysis, microtoroids of various sizes and quality factors were
fabricated according to the previously reported microtoroid fabrication process [13]. Low
loss (<0.3 dB) fiber-tapers, serving as input and drop waveguides, were simultaneously
made by the technique of continuous flame-heating and stretching of two standard single-
mode fibers. The device presented in this chapter is a microtoroid of principal diameter
65 µm and minor diameter of approximately 6 µm. Fiber tapers used in the measurement
had waist diameters of approximately 1 μm and 1.7 μm, for bus and drop waveguides
respectively. The chip containing the microtoroid was held on a platform that could be
manipulated relative to the waveguides using a 10 nm step-resolution piezoelectric stage.
To fulfill the assumption of constant coupling to the drop channel (fixed dropQ ), the fiber
taper used for the drop waveguide was held in contact with the resonator. The other
waveguide was manipulated using a probe controlled by a high-resolution
micropositioner. A single mode, tunable, external cavity laser, emitting in the 1550 nm
band, was used to excite the whispering gallery modes of the microtoroid. Transmission
and drop powers were simultaneously monitored using two (125 MHz) photodiode
detectors, as the laser frequency was slowly (<10 Hz) scanned over about 50 GHz using a
function generator. Before discussing the experimental results it should be noted that in
the present work the power-transfer efficiency has reached such a high level that
uncertainties in power measurements associated with losses external to the device such as

13
splice losses are vastly larger than the resonator-based transfer loss itself. In this regard,
external losses incurred by mode conversion from a single mode fiber to the thin
waveguides at the resonator coupling region can be excluded in the device efficiency
measurements. This is done by using port 1 and port 2 as input ports for the device in
separate measurements and subtracting off the individual losses of the bus and drop fiber
taper mode converters (about 0.15 dB per converter). Using this technique accuracy in
transfer loss measurements of about 0.1 dB (~3%) can be achieved. Since precision of
efficiency measurements is limited to this level, in order to verify our theoretical
predictions we opt to measure the efficiency in more weakly loaded toroid filters having
correspondingly higher totalQ factors and hence lower transfer efficiencies (see equation
2.3). To this end, waveguides with larger waist diameters can be used to limit the extent
of the evanescent field and thereby reduce the waveguide-resonator coupling.
Coupling to the resonator by each fiber taper, acting alone was first examined.
Resonator line-width measurements using a single waveguide in the highly undercoupled
regime ( 0QQtotal ≅ ) revealed a 3 dB bandwidth of about 1.9 MHz at the resonant
wavelength of 1565 nm, which translates to an intrinsic resonator quality factor of
8101× .
Figure 2.2 shows optical transmission vs. air gap using the input (bus) taper.
Over-coupled transmission as high as 96% was observed demonstrating the high ideality
of the junction. The efficiency of coupling between the fundamental mode of the tapered
fiber and the resonant mode of microtoroid can be estimated using the transformation
introduced in reference 11:

14
TTK
m11±
= (2.4)
In this expression, T is the transmission beyond the taper-resonator junction, and K is
the ratio of desired waveguide mode coupling to total parasitic losses of the system
(intrinsic round-trip loss of the cavity, and parasitic coupling losses at the junction). The
upper and lower signs are taken for overcoupled and undercoupled regimes, respectively.
Non-ideality arises from parasitic losses, i.e., coupling of the resonator mode to either the
radiation modes or the higher-order modes of the fiber-taper-waveguide, which
subsequently are radiated or coupled to cladding modes upon transition to the single-
mode fiber. Ideality of the coupling junction can be deduced by plotting K vs. gap
distances on a logarithmic scale. In cases where the parasitic couplings are masked by the
intrinsic resonator loss, this plot will be a single slope line and a lower bound on the
ideality can be inferred by measuring K values at the smallest possible separations. The
inset in Figure 2.2 is such a plot for the device under study. K values well above 100
place a lower bound on junction ideality of better than 99% in the overcoupled regime
( 0QQbus < ) meaning that less than 1% of power is coupled to undesired modes of the
tapered fiber. This clearly demonstrates that parasitic losses at the junction are minimal
and can be ignored (at least in the presented experiments) compared to the intrinsic losses
of the cavity.

15
0.0
0.2
0.4
0.6
0.8
1.0
1 210
-2
10-1
100
101
102
Overcoupled
2.52.01.51.0
Tra
nsm
issi
on
Separation (µm)
0.5
Undercoupled
K
Separation (µm)
Over
couple
d
Under
couple
d
Figure 2.2: Transmission plotted versus taper-toroid separation. Overcoupling as high as
96% is measured. The inset is a plot of K versus position and illustrates the quality of
junction. A lower bound of 99% on Ideality in the overcoupled regime can be inferred
from this plot. The dotted line marks the critical coupling point at 1.3 μm gap distance.

16
Figure 2.3 shows the drop efficiency D (the fraction of power at the first
waveguide redirected to the second waveguide), measured for different loading regimes
and plotted versus the ratio of the intrinsic Q to the loaded quality factor of the system.
Data were measured as the gap between input waveguide and resonator was varied. As
noted earlier, the drop waveguide coupling is fixed during these measurements. As an
aside, note that the total quality factor is reduced by a factor of 15 (labeled in Figure 2.3)
upon attachment of the drop waveguide to the resonator. The Q factor at the critical
coupling point is a factor of 30 lower than the intrinsic Q ( 810= ), corresponding to a
filter bandwidth of 57 MHz. From equation (2.3), the factor of 30 yields a maximum
theoretical drop efficiency of 93.3% (0.3 dB loss) in good agreement with the measured
values in Figure 2.3. The inset in Figure 2.3 is a plot of the measured transmission versus
the drop power and confirms the predicted linear relationship. This way of plotting the
data results in a more reliable estimate of the maximum drop efficiency, which
is )%394( ± for this device. This is the best efficiency ever reported for a four-port
microcavity-type resonant coupler. It also agrees well with the expected theoretical value
of 93.3%. The transmission data are obtained by normalizing the on-resonance
transmission to its value with the resonator far from the waveguides. The nonresonant
insertion loss in the bus channel was measured to be less than 0.02% during the
experiment. This loss, as noted earlier, is due to scattering of the evanescent field at the
waveguide-resonator junction and is measured by comparing the off-resonance
transmission in port 2, when the device is working as an add/drop, to the same
transmission but when the resonator is far from the bus waveguide (infinite gap). As

17
such, the measurement of insertion loss yields a higher level of accuracy and precision
than is possible for measurement of the drop efficiency.
The small deviation from the ideal case of infinite intrinsic Q can be observed in
the inset of Figure 2.3 (see the dashed line). This deviation, a direct consequence of
energy conservation, is due to the power dissipation in the cavity due to finite intrinsic
losses. Note that in the theoretical model, all parasitic losses have been lumped into 0Q .
Therefore the excellent agreement between the measured values for the efficiency and the
theoretical predictions, which assume all the parasitic losses come from the intrinsic loss
of the cavity, are further evidence of low loss at the waveguide-resonator junctions.
Figure 2.3 also shows that the bus waveguide can induce at least a factor of 103 decrease
in quality factor relative to that of the original resonator ( busQQ 30 10= ). Were the drop
waveguide designed to produce this level of coupling, an exceedingly high drop
efficiency of 99.9% would result with an overall loaded Q factor of 4105× or a filter
bandwidth of about 4 GHz. Higher bandwidths in this range are of interest in
telecommunication applications of these devices [18-20].

18
10 100 1000 100000
20
40
60
80
100
20 40 60 80 1000
20
40
60
80
100
30
over
couple
d
Dro
p (
%)
Q 0/Q total
15
under
couple
d
D(%)
T(%
)
infinite Q
Q = 10 8
0
0
0
Figure 2.3: Transferred power to the drop waveguide (D) versus the inverse-loaded Q of
the system. The data shows a factor of 15 reduction in Q factor upon attachment of the
drop taper to the resonator. At the critical coupling point ( 30/0 =totalQQ ), 93% of the
input power is transferred to the drop port and throughput transmission vanishes. The
theoretical drop efficiency is given by the solid line. The inset is a plot of T and D
measured for the same coupling levels in the main Figure and verifying their linear
relationship. The solid curve is the theoretical curve, and the dashed curve gives the ideal
case of infinite intrinsic Q.

19
Figure 2.4 shows transmission and drop spectra measured for a device designed to
operate in the higher bandwidth regime. The filter shape is Lorentzian and the bus
waveguide extinction is a record 33 dB. Note that the FWHM of the drop and
transmission spectra almost coincide due to almost negligible amount of loss in power
transfer process.

20
-20 -10 0 10
-30
-20
-10
0
Tra
nsm
issi
on a
nd D
rop (
dB
)
Frequency Detuning (GHz)
Drop
Transmission3 dB Bandwidth
= 4.2 GHz
20
Figure 2.4: Drop port (triangles) and throughput port (circles) spectra measured for a
four- port resonant coupler with 4.2 GHz bandwidth. Extinction of 33 dB in input channel
occurs at the resonant wavelength of 1540 nm.

21
To characterize the performance of this filter for telecommunication purposes,
using an external Mach-Zehnder modulator, the laser power launched into port one was
modulated with 1231 − PRBS data, and the quality of the received signal was monitored
at the drop port. Figure 2.5 shows the bit error rate (BER) curves obtained from dropped
data at 10 Gbit/s. Also plotted is the so-called back-to-back data obtained by removal of
the filter. The 0.7 dB power penalty, without any sign of error floor, is attributed to the
finite pass band of the filter response, resulting in cut off of the high frequency
components of the signal.

22
-21 -20 -19-12
-11
-10
-9
-8
-7
-6
-5
Log(
BE
R)
Power Received (dBm)
through resonator back to back
0.7 db
Figure 2.5: Back-to-back (circles) and through-the-resonator (triangles) BER
measurements taken using an all-optical four-port coupler device at 10 Gbit/s data rates.
There is a 0.7 dB power penalty when the add-drop is used owing to its finite bandwidth.

23
2-4 Conclusions
The results presented in this chapter demonstrate the ability of taper-coupled ultra-high-Q
toroid microcavities to reach exceedingly high power-transfer efficiencies in add-drop
filter applications. This can be of great interest in the study of processes requiring very
low loss. As an example, losses are one of the main impediments in realizing long-
distance quantum communication networks, as they tend to destroy the entanglement of
quantum states and ultimately decrease the communication fidelity [21]. Also the ability
to filter out broad-band noise while maintaining the signal amplitude (low insertion loss)
is highly desirable in radio-frequency photonics [22] or sensitive power detection
applications (e.g., single photon experiments). The latter application requires high-finesse
cavities to achieve strong out-of-band noise rejection. A free spectral range of about 8 nm
and loaded Q of 3.3 million implies a finesse in excess of 104 for the device studied here.
On the other hand, due to the extremely low intrinsic loss of cavities in these devices, the
quality factor of the system is almost entirely determined by coupling to waveguides.
Therefore, a remarkable operational dynamical range (both bandwidth and power-transfer
ratio) is attainable by controlling the coupling between resonator and individual
waveguides. Finally, the excellent agreement of the experimental results with theoretical
predictions suggests that this method allows the realization of resonant couplers with
negligible losses. Indeed, the selection of filter design in the present study was intended
to produce a measurable loss within the accuracy of our experimental equipment for
purposes of comparison to the model.

24
2-5 Bibliography
[1] H. J. Kimble. Strong interactions of single atom and photons in cavity QED. Physica
Scripta, T76: 127-137, 1998.
[2] S. Haroche. Entanglement, mesoscopic superposition and decoherence studies with
atoms and photons in a cavity. Physica Scripta, T76: 159-164, 1998.
[3] A. Kiraz et al. cavity-quantum electrodynamics using a single InAs quantum dot in a
microdisk structure. Applied Physics Letters, 78(25): 3932-3934, 2001.
[4] J. I. Cirac, P. Zoller, H. J. Kimble, and H. Mabuchi. Quantum state transfer and
entanglement distribution among distant nodes in a quantum network. Physical
Review Letters, 78(16): 3221-3224, 1997.
[5] J. M. Gerard, et al. InAs quantum boxes in GaAs/AlAs pillar microcavities: from
spectroscopic investigations to spontaneous emission control. Physica E, 2(1-4): 804-
808, 1998.
[6] E. Waks et al. Secure communication: Quantum cryptography with a photon turnstile.
Nature, 420(6917): 762-762, 2002.
[7] D. W. Vernooy, A. Furusawa, N. P. Georgiades, V. S. Ilchenko, and H. J. Kimble.
Cavity QED with high-Q whispering gallery modes. Physical Review A, 57(4):
R2293-R2296, 1998.
[8] V. B. Braginsky, M. L. Gorodetsky, and V. S. Ilchenko. Quality-factor and nonlinear
properties of optical whispering-gallery modes. Physics Letters A, vol. 137(7-8): 393-
397, 1989.

25
[9] B. E. Little, S. T. Chu, W. Pan, D. Ripin, T. Kaneko, Y. Kokubun, and E. Ippen.
Verically coupled glass microring resonator channel dropping filters. IEEE Photonics
Technology Letters, 11(2): 215-217, 1999.
[10] S. Suzuki, Y. Hatakeyama, Y. Kokubun, and S. T. Chu. Precise control of
wavelength channel spacing of microring resonator add-drop filter array. Journal of
Lightwave Technology, 20(4): 745-750, 2002.
[11] K. Djordjev, S. J. Choi, and P. D. Dapkus. Vertically coupled InP microdisk
switching devices with electroabsorptive active regions. IEEE Photonics Technology
Letters, 14(8): 1115-1117, 2002.
[12] P. Rabiei, W. H. Steier, C. Zhang, and L. R. Dalton. Polymer micro-ring filters and
modulators. Journal of Lightwave Technology, 20(11): 1968-1975, 2002.
[13] D. K. Armani, T. J. Kippenberg, S. M. Spillane, and K. J. Vahala. Ultra-high-Q
toroid microcavity on a chip. Nature, 421(6926): 925-928, 2003.
[14] S. M. Spillane, T. J. Kippenberg, O. J. Painter, and K. J. Vahala. Ideality in a fiber-
taper-coupled microresonator system for application to cavity quantum
electrodynamics. Physical Review Letters, 91(4): art. no. 043902, 2003.
[15] A. Vorckel, M. Monster, W. Henschel, P. H. Bolivar, and H. Kurz. IEEE Photonics
Technology Letters, 15(7): 921-923, 2003.
[16] M. Cai, O. Painter and K. J. Vahala. Observation of critical coupling in a fiber taper
to silica-microsphere whispering gallery mode system. Physical Review Letters,
85(1): 74-77, 2000.
[17] A. Yariv. Critical coupling and its control in optical waveguide-ring resonator
systems. IEEE Photics Technology Letters, 14(4): 483-485, 2002.
26
[18] B. J. Offrein et al. Resonator coupler-based tunable add-after-drop filter in Silicon-
oxynitride technology for WDM networks. IEEE Journal of Selected Topics in
Quantum Electronics, 5(5): 1400-1406, 1999.
[19] R. Grover et al. Vertically coupled GaInAsP-InP microring resonators. Optics
Letters, 26(8): 506-508, 2001.
[20] B. E. Little, S. T. Chu, H. A. Haus, J. Foresi, and J. P. Laine. Micro-ring resonator
channel add-dropping filters. Journal of Lightwave Technology, 15(6): 998-1005,
1997.
[21] S. J. van Enk, J. I. Cirac, P. Zoller. Ideal quantum communication over noisy
channels: A quantum optical implementation. Physical Review Letters, 78 (22): 4293-
4296, 1997.
[22] X. S. Yao and L. Maleki. Optoelectronic microwave oscillator. Journal of Optical
Society of America B, 13(8): 1725-1735, 1995.

27
Chapter Three
Loss Characterization in Microcavities Using the
Thermal Bistability Effect
3-1 Introduction
At sufficiently high quality factors (Q), whispering gallery mode microresonators can
enter a regime where minute injected optical powers can result in large thermal
nonlinearities [1-2]. The circulating intensity in these cavities, greatly enhanced due to
their high quality factors and small mode volumes, is partially absorbed, and the
generated heat can produce thermal bistability [3]. In this chapter we exploit this
phenomenon as a new tool for characterizing distinct optical loss mechanisms responsible
for limiting the quality factor of high-Q microresonators [4]. A powerful method is
demonstrated, based on the thermal bistability effect, to characterize the relative
importance of absorption and scattering losses in toroidal microcavities. Empirical results
on thermal nonlinearity of these structures have been used to study the interaction of
microtoroids with their ambient environment.
The results, applicable to any other type of microresonator, provide insight into
the relative importance of surface scattering and absorption centers in these cavities as
well as the role of surface contaminants in altering the quality factor and thermal
nonlinearities of these structures.

28
3-2 Thermal Bistability Effect
Thermal broadening/compression of the resonance line shape is frequently encountered in
ultra-high-Q (UHQ) microcavities (Q>108) [5]. As the laser frequency is swept across the
cavity resonance, optical power coupled into the resonator is partially absorbed and
converted to heat, hence altering the optical properties of the bulk medium and shifting
the resonant frequency either along or opposite to the direction of laser scanning. In
silica, the dominant effect is due to the temperature-dependent refractive index of the
cavity material, which results in a negative frequency shift of the resonance with
increased temperature:
TdTdn
Δ−=− 00 )( ννν (3.1)
where )( 0νν − is the resonant frequency shift due to temperature change of TΔ , 0ν is the
initial resonant frequency, and dTdn / is the thermo optic coefficient of the cavity bulk
material (i.e., the rate of refractive index change as a function of temperature). As a
result, the resonance line-shape is distorted from its original Lorentzian profile, becoming
broader when scanned towards lower frequencies and narrower when scanned in the
opposite direction.
The characteristic equation for the optical power transmission spectrum in the
presence of nonlinearity is given by the following equation:
( )2
141
1
⎥⎦
⎤⎢⎣
⎡−++
=−
TPPx
CT
th
in
(3.2)
where T is the transmission beyond the resonator-waveguide coupling region and C is
the criticality factor that determines the degree to which the resonator is coupled to the

29
waveguide ( )10 ≤≤ C [6,7]. C starts at zero when the resonator is far from the
waveguide (no coupling), reaches unity at the critical coupling point (T =0), and then
declines toward zero as the resonator-waveguide coupling increases further and
transmission recovers in the overcoupled regime. x is the normalized frequency defined
as the deviation from the initial resonant frequency in units of resonator linewidth, i.e.,
( ) ( )ννν Δ−= /0x . The characteristic power in this equation, referred to as threshold
power ( thP ), is the required input power to shift a resonance by its linewidth.
Figure 3.1 shows how the resonant line-shape is modified from its original
Lorentzian profile (achievable at thin PP << ). The transmission spectrum appears as the
ABC curve when the input laser is tuned towards lower frequencies and as the CDEA
curve when scanned in the opposite direction. The minimum transmission ( CT −= 1 )
occurs at thin PCPx /−= , which shows that monitoring the thermal broadening as a
function of launched power provides a tool for accurate measurement of threshold power
for thermal bistability.

30
Figure 3.1: Thermal shift of the resonant frequency and distortion of resonant line-shape
for different input powers. When thin PP << the familiar Lorentzian profile is achieved;
however for higher values of input power the typical thermal hysteretic behavior can be
observed. The ABC curve is the transmission spectrum of the resonator when the input
laser is scanned towards lower frequencies and the CDEA curve shows its response in the
reverse direction. The BD part of the curve is unstable.

31
For the thermal nonlinearity, threshold power is related to the resonator properties
by the following form:
dTdnQCn
Pthermal
pth /
10
ατν
∝ (3.3)
peffp cVC ρ= is the heat capacity of the effective volume ( effV ) in the bulk medium where
the heating occurs, ρ and pc are the density and special heat capacity of the medium,
respectively, and α is the absorption fraction of lost power (i.e., power lost to absorption
relative to total power lost through all mechanisms contributing to intrinsic Q). From
equation (3.3) thP is inversely proportional to the quality factor (Q ) and the thermal
response time ( thermalτ ), which determines how fast the temperature of the optical mode
volume rises.
3-3 Experimental Results
In order to excite the whispering gallery modes of microtoroids, fiber tapers were used to
couple light into and out of the resonators [8]. Single-mode, tunable external-cavity lasers
emitting in the 1550 nm, 1300 nm, and 980 nm bands were used as light sources.
Transmission power through the fiber taper was monitored using fast photodiode
detectors as the laser frequency was slowly (<10Hz) scanned over 10 GHz using a
function generator.
Figure 3.2 shows the measured thermal shift of the resonant frequency vs. input power
for a high Q ( 8109.0 ×≈Q ) whispering gallery mode of a toroid microresonator at two
different wavelengths. Although Q values at these wavelengths are about the same, the
threshold power at 970 nm is a factor of 20 higher than that at 1545 nm.

32
Figure 3.2: Shows thermal shift of the resonant frequency of a whispering gallery mode
in a toroid microcavity as a function of coupled power to the resonator. The squares
(blue) are the data at wavelength 1545.4 nm and the circles (red) are for the same
fundamental transverse mode at 969.4 nm. The bistability threshold power is higher by a
factor of 20 at 969.4 nm and is believed to be due to lower absorption of water at this
wavelength.

33
From equation (3.3), the above difference suggests a higher absorption loss
(higher α value) at 1545 nm compared to 970 nm. Such a difference in absorption
cannot be explained in terms of silica absorption as fused silica is about 4 times more
absorptive at 970 nm [9]. Absorption losses at 1550 nm, however, can be higher if there
is a monolayer of water molecules on the resonator surface [10,11]. Figure 3.3 contains
the calculated quality factor versus wavelength of a 60 μm diameter sphere (comparable
to the microtoroids under study for the case of large toroidal minor diameters) that is
limited by the combination of absorption due to a monolayer of surface water and the
intrinsic absorption of fused silica. From this plot, a difference in threshold power of
about 25 can be predicted using the calculated Q values alone (inversely related to
absorption losses) at the measured wavelengths indicated in the Figure. The close
agreement between the predicted and measured ratio of threshold powers at these
wavelengths is thus consistent with the assumption of a water monolayer on the surface
and suggests a highly efficient heat-transfer mechanism from the surface water layer to
the bulk glass where the optical mode is mainly located.

34
Figure 3.3: Calculated absorption limited quality factor of TE and TM fundamental
WGM modes of a 60 μm diameter sphere. Absorption losses include the intrinsic bulk
absorption of fused silica and that of a monolayer of water on the cavity surface.
Predicted values for quality factor at 980 nm, 1300 nm, and 1550 nm wavelengths are
marked in the figure.
35
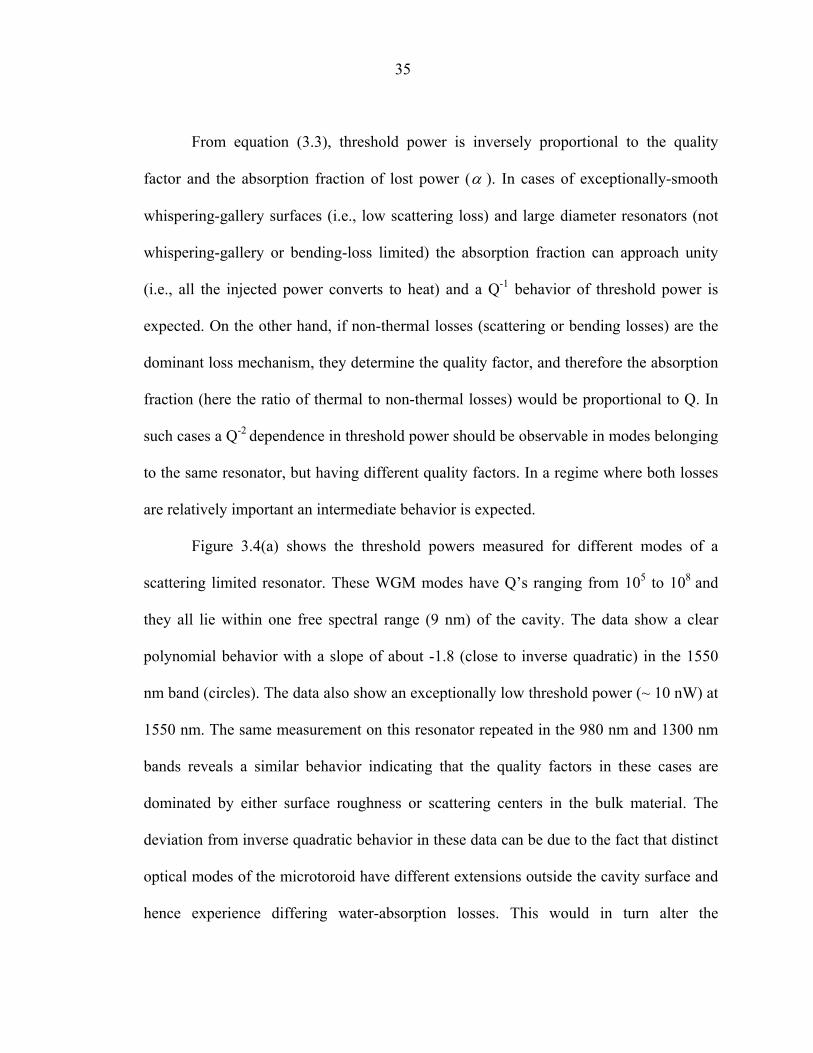
From equation (3.3), threshold power is inversely proportional to the quality
factor and the absorption fraction of lost power (α ). In cases of exceptionally-smooth
whispering-gallery surfaces (i.e., low scattering loss) and large diameter resonators (not
whispering-gallery or bending-loss limited) the absorption fraction can approach unity
(i.e., all the injected power converts to heat) and a Q-1 behavior of threshold power is
expected. On the other hand, if non-thermal losses (scattering or bending losses) are the
dominant loss mechanism, they determine the quality factor, and therefore the absorption
fraction (here the ratio of thermal to non-thermal losses) would be proportional to Q. In
such cases a Q-2 dependence in threshold power should be observable in modes belonging
to the same resonator, but having different quality factors. In a regime where both losses
are relatively important an intermediate behavior is expected.
Figure 3.4(a) shows the threshold powers measured for different modes of a
scattering limited resonator. These WGM modes have Q’s ranging from 105 to 108 and
they all lie within one free spectral range (9 nm) of the cavity. The data show a clear
polynomial behavior with a slope of about -1.8 (close to inverse quadratic) in the 1550
nm band (circles). The data also show an exceptionally low threshold power (~ 10 nW) at
1550 nm. The same measurement on this resonator repeated in the 980 nm and 1300 nm
bands reveals a similar behavior indicating that the quality factors in these cases are
dominated by either surface roughness or scattering centers in the bulk material. The
deviation from inverse quadratic behavior in these data can be due to the fact that distinct
optical modes of the microtoroid have different extensions outside the cavity surface and
hence experience differing water-absorption losses. This would in turn alter the

36
assumption of a Q-1 dependence of absorption fraction on quality factor in scattering
limited resonators.
Figure 3.4(b) illustrates a resonator of similar size and quality factor but which
exhibits absorption-limited behavior in the 1550 nm band (slope -1.1), scattering limited
behavior in the 980 nm band (slope -1.9), and an intermediate behavior at 1300 nm (slope
-1.6). By examination of Figure 3.2, this can be understood as resulting from variation in
water absorption losses at theses wavelengths.

37
Figure 3.4: Thermal bistability threshold power as a function of quality factor for
different WGM modes of a toroidal microresonator. (a) Shows a scattering limited case
obtained in resonator 1. (b) Illustrates the data from a similar experiment on resonator 2.
In this case, a monotonic increase in the slope of graphs from 1500 nm (circles) to 1300
nm (triangles) and 980 nm (stars) wavelengths shows the transition from absorption-
limited to scattering-limited regime. Also the threshold powers increase as the input
frequencies move to a more transparent part of the water absorption spectrum.

38
As further evidence that surface water layers play a major role in absorption
losses of the microtoroids under consideration, we investigated the thermal bistability
effect in humid environments. Figure 3.5 shows how the bistability threshold power at
1550 nm wavelength decreases as the environment becomes more humid. Significantly,
the quality factor of the resonator in this measurement does not change noticeably as
humidity is varied, which indicates that scattering is the dominant loss mechanism in this
microtoroid. The change in threshold power therefore arises entirely from the change in
absorption fraction parameter that can be directly related to the number of water
molecules on the surface of the cavity.

39
Figure 3.5: Thermal bistability threshold power as a function of humidity for a scattering-
limited microtoroid. Although the quality factor of the resonator remains the same, the
threshold power at 80% humidity drops to about a quarter of its value at humidity levels
below 45%. The water molecules increase the absorption coefficient (α ) as they adsorb
onto the cavity surface, demonstrating the role of the surface water layers as the main
source of absorption loss in the 1550 nm wavelength band.

40
3-4 Conclusions
Our findings in this chapter demonstrate that measurement of nonlinear thermal effects in
microresonators is an effective method to characterize different loss mechanisms in these
structures. In particular, the degree to which resonators are absorption limited or
scattering limited can be inferred from measurement of threshold power versus Q. In
cases where there is a strong spectral dependence of absorption centers (such as the case
of water adsorbed onto silica), it is also possible to make this determination through a
combination of spectral measurements of threshold power and Q. In the measurements
presented, information was obtained about the surface chemistry of the cavity, which
revealed the presence of mono-layers of water on the surface. Generalization of this
method to other surface contaminants that could advertently be deposited on the surface
of these structures can be potentially useful in sensing applications and surface chemistry
studies. Furthermore, real time monitoring of thermal properties and quality factor can be
beneficial in studying the dynamics of interaction between the resonator surface and its
environment.

41
3-5 Bibliography
[1] F. Treussart et al. Evidence for intrinsic Kerr bistability of high-Q microsphere
resonators in superfluid helium. European Physical Journal D, 1(3): 235-238, 1998.
[2] V. B. Braginsky, M. L. Gorodetsky and V.S. Ilchenko. Quality-factor and nonlinear
properties of optical whispering-gallery modes. Physics Letters A, 137(7-8): 393-
397, 1989.
[3] V. S. Ilchenko, and M. L. Gorodetsky. Thermal nonlinear effects in optical
whispering gallery microresonators. Laser Physics, 2: 1004-1009, 1992.
[4] D. K. Armani, T. J. Kippenberg, S. M. Spillane, and K. J. Vahala. Ultra-high-Q
toroid microcavity on a chip. Nature, 421(6926): 925-928, 2003.
[5] L. Collot, V. Lefevre-Seguin, M. Brune, J. M. Raimond and S. Harche. Very high-Q
whispering-gallery mode resonances observed on fused-silica microspheres.
Europhysics Letters, 23(5): 327-334, 1993.
[6] A. Yariv. Critical coupling and its control in optical waveguide-ring resonator
systems. IEEE Photics Technology Letters, 14(4): 483-485, 2002.
[7] M. Cai, O. Painter and K. J. Vahala. Observation of critical coupling in a fiber taper
to silica-microsphere whispering gallery mode system. Physical Review Letters,
85(1): 74-77, 2000.
[8] S. M. Spillane, T. J. Kippenberg, O. J. Painter, and K. J. Vahala. Ideality in a fiber-
taper-coupled microresonator system for application to cavity quantum
electrodynamics. Physical Review Letters, 91(4): art. no. 043902, 2003.

42
[9] D. A. Pinnow, T. C. Rich, F. W. Ostermayer, and M. DiDomenico. Fundamental
optical attenuation limits in liquid and glassy state with applications to fiber optical
waveguide materials. Applied Physics Letters, 22(10): 527-529, 1973.
[10] M. L. Gorodetsky, A. A. Savchenkov, and V. S. Ilchenko. Ultimate Q of optical
microsphere resonators. Optics Letters, 21(7): 453-455, 1996.
[11] D. W. Vernooy, A. Furusawa, N. P. Georgiades, V. S. Ilchenko, and H. J. Kimble.
Cavity QED with high-Q whispering gallery modes. Physical Review A, 57(4):
R2293-R2296, 1998.

43
Chapter Four
Observation of Kerr Nonlinearity in Microcavities at
Room Temperature
4-1 Introduction
Ultra-high quality factor (high Q) optical microcavities (e.g., microspheres and
microtoroids) are ideally suited for observing nonlinear optical effects with extremely
low (sub-microwatt) threshold powers [1-5]. The combination of high circulating power,
made possible by high quality and strong confinement of this power within mode
volumes of the order of hundreds of μm3, leads to inter-cavity circulating intensities in
excess of 1 GW/cm2 with only 1 mW of input power (assuming Q values of
approximately 100 million in microtoroid resonators having principal diameters of about
50 microns.) This level of intensity is sufficient to unveil nonlinear phenomena even in
materials like silica that are weakly nonlinear. The optical Kerr effect arises from the
third-order susceptibility of the optical material, which results in intensity-dependent
refractive index. This effect and a variety of its applications have been the subject of
numerous research activities around the world [6]. The observation of this phenomenon
in microcavities however is problematic as it is accompanied by relatively larger thermal
nonlinear effects [4,5,7]. As studied in chapter 3, the refractive index of silica, which is
also a function of temperature, varies as the circulating power is partially absorbed in the
medium and the cavity temperature subsequently increases. This larger effect (thermo-
optic effect) masks the Kerr-driven variations in the refractive index. F. Treussart et al. in

44
reference 5 have found evidence for Kerr bistability in microresonators by immersing
microspheres in a superfluid helium bath at 2K. This cryogenic setup greatly reduces the
sensitivity of WGM resonances to temperature and allows the Kerr effect to be dominant
and hence observable. In terms of parameters introduced in chapter 3, the cryogenic setup
reduces the thermal response time ( thermalτ ) by rapid extraction of heat from the resonator
structure. This consequently increases the thermal bistability threshold power (see
equation 3.3) suppressing the thermal nonlinearities.
In this chapter we propose and experimentally verify a method for observing the
optical Kerr effect in microcavities at room temperature. The technique discriminates
against the much larger and typically dominant thermal component of nonlinearity by
using its relatively slow frequency response compared to the almost instantaneous Kerr
effect. Measurement of the Kerr coefficient ( 2n ), or equivalently third-order nonlinear
susceptibility of the cavity material ( )3(χ ), is demonstrated for the case of a silica
microcavity. With this approach useful information about the characteristic thermal
response time in microresonators can also be acquired.

45
4-2 Kerr-Nonlinearity Measurement-Approach
In order to manipulate the time response distinction in favor of Kerr effect, we use two
beams (pump and probe) individually resonant with two WGM resonances of an optical
microcavity. Modulation of the pump power results in the modulation of the cavity
refractive index and consequently modulation of the resonant frequency of the WGM
with which the probe beam is in resonance. The probe beam power transmission beyond
the resonator waveguide junction therefore acquires a strong Fourier component at the
modulation frequency of the pump beam. This component can be measured using a lock-
in amplifier. When the pump modulation frequency becomes sufficiently faster than the
thermal effects, the signal detected by the lock-in amplifier is purely due to the Kerr
effect.
The modulated probe power (frequency Ω ) is given by the following equation:
)(2
22 xC
Vnn
QQPPP
eff
pumpeffpump
totalprobepump
probe
probe
πλΩ
Ω
=Δ
(4.1)
probeP is the probe power coupled into the resonator and ΩpumpP is the fraction of the pump
power coupled into the cavity and carrying the modulation frequency Ω .The modulated
probe power ( ΩΔ probeP ) depends on the refractive index change in the cavity as a result of
the modulated pump power ( ΩpumpP ), which is proportional to the quality factor of the
cavity at pump wavelength ( effpumpQ ), 2n coefficient, and the cross section of the optical
mode. The changes in refractive index of the cavity cause variation of the probe power
transmission, which greatly depends on the quality factor of the WGM coupled to the
probe signal. Total quality factor of the optical mode at the probe frequency ( probeν ) is

46
given by totalprobeQ , which includes both intrinsic losses of the cavity and loading by the
optical waveguide and can be obtained from linewidth measurements in the desired
coupling regime. The transfer of modulation from pump to probe beam also depends on
detuning of the cavity resonant frequency from that of the probe beam, which measured
in units of linewidth of the cavity is denoted by x . The dependence 21/2)( xxxC += is
a number between one and zero depending on x (the deviation of the resonant frequency
of the optical mode from the probe frequency in units of its linewidth). effpumpQ is the
effective quality factor (defined below) of the resonator at the pump wavelength ( pumpλ )
and determines the enhancement of the pump power in the cavity [8]:
nRQ
PP eff
pumppump
pump
cavitypump
2πλ
= (4.2)
where R and n denote the radius and refractive index of the cavity, respectively.
Equation (4.3) below shows how effpumpQ can be obtained from the coupling parameter
K defined as extQQK /0= , where 0Q is the intrinsic quality factor of the optical mode
and extQ is the quality factor associated with coupling to the optical waveguide.
20 )1( KKQQeff
pump += (4.3)
Finally, note in equation (4.1) that for a certain change in the refractive index of
the cavity, higher Q modes experience larger transmission variations and hence the
dependence of ΩΔ probeP on totalprobeQ . Also observe the role of small mode volumes ( effV ) in
reducing the required optical power for observation of nonlinear effects.

47
4-3 Experimental Results
The experimental set up used to observe and measure the Kerr nonlinearity of silica
microcavities is shown in Figure 4.1. Two tunable external cavity diode lasers were used
to generate the pump and probe beams in the 1550 nm and 1480 nm bands, respectively.
The pump and probe laser frequencies are simultaneously tuned to two optical WGM
resonances of a toroidal microcavity [9] and launched into a tapered optical fiber using a
WDM coupler. Tapered optical fibers with waist diameters of 1-3 mμ were fabricated by
the traditional technique of simultaneous flame heating and pulling standard single mode
(SMF-28) fibers [10]. Efficient and high ideality coupling to the optical modes of
microtoroid cavities is possible using these waveguides [11]. A top view optical
micrograph of a microtoroid evanescently side coupled to a tapered optical fiber is shown
in Figure 4.1. The output of the 1550 nm laser is modulated using a Mach-Zehnder
modulator (bandwidth 20 GHz) driven by an RF function generator that generates
sinusoidal waves with frequencies up to 80 MHz. The detected signal due to residual
transmitted modulated pump power in the probe channel could potentially mask the
relatively small modulation in the probe power, and therefore two cascaded wavelength-
selective couplers are used to ensure high extinction (above 38 dB) of the pump power in
the probe channel. The pump and probe laser frequencies are adjusted while the detected
pump and probe transmissions are monitored by an oscilloscope to ensure that both
frequencies are tuned to the resonant frequencies of the cavity. A high precision PZT
stage (10 nm steps) was used to position the microtoroid relative to the tapered fiber and
thereby control the coupling to the resonator. With the laser frequencies tuned to
proximity of the desired WGM resonances and with the pump power modulated, the

48
probe power is detected, and the photocurrent is processed by the lock-in amplifier using
the output of the function generator as its reference signal. The lock-in was operated in
the ( θ,r ) setting where r (in Volts) and θ (in degrees) are the amplitude and the relative
phase of the detected signal at the reference frequency (Ω ).

49
Figure 4.1: The experimental setup used for characterizing the Kerr nonlinearity of
microcavities. The picture is a top-view optical micrograph of a toroid microresonator
evanescently side coupled to a tapered optical fiber.

50
The output of the lock-in amplifier ( r ) in Vμ is plotted vs. the modulation
frequency in Figure 4.2. This plot is normalized to the frequency response of the entire
system with the microtoroid decoupled from the fiber taper. Therefore the plot shown in
Figure 4.2 is the pure response resulting from the cross modulation of the probe beam by
the pump beam. The power levels coupled to the resonator to generate the graph in Figure
2 were about 15 Wμ and 10 Wμ for pump and probe beams, respectively. Thermal effects
can follow the modulation of the pump power up to about KHz10=Ω , and hence a flat
response is observed prior to this frequency. At higher frequencies however a decline in
the amplitude response is observed with a 3 dB corner frequency of about 25 KHz
suggesting a thermal response time in the order of 6 sμ . As mentioned in reference 4, the
fastest thermal response time is associated with the conduction of heat generated in the
optical mode volume to the cavity bulk material and can be put in the following compact
form:
3/2
22
22 21)(⎟⎟⎠
⎞⎜⎜⎝
⎛==
nR
DDR
thermal πλδτ (4.4)
where Rδ is the effective thickness of the optical mode localized near the surface of the
cavity and D is the temperature conductivity of glass ( scm /108 23−× ). For the
microtoroid under study here with major radius of 36 mμ and minor diameter or thickness
of about 8 mμ , the toroid geometry becomes similar to a sphere with respect to thermal
effects within the modal volume. Applying the above expression to this sample predicts a
thermal time constant of 5 sμ , which is in close agreement with the value derived from
Figure 4.2.

51
Figure 4.2: Measured amplitude modulation of the probe beam as a function of the
modulation frequency of the pump power. The dotted lines show a 3 dB corner frequency
of about 25 KHz where the modulation of the pump power becomes comparable to or
faster than the thermal response time of the resonator. The second roll-off is due to
limited bandwidth of the cavity that does not allow the pump power in the resonator to
build up instantaneously. The flat response in the middle shows the “fast” Kerr effect.

52
Returning to Figure 4.2, the decline in the amplitude response continues until it
reaches a second plateau from around 600 KHz to 10 MHz, which is far beyond the
modulation speeds that thermal effects can follow. To ensure that this flat response was
not due to the noise level arising from residual pump power in the 1480 nm channel or
from RF crosstalk, the probe power was switched off during data acquisition in the flat
portion of the spectrum. This resulted in the lock-in response decreasing by a factor of
40, thereby confirming that the measured response is associated with modulation of the
probe wave. Furthermore, by calibrating the lock-in amplifier, the modulated probe
power could be inferred (i.e., ΩΔ probeP ). Plugging this inferred power into equation 4.1, we
obtain an 2n value of Wcm /10)46( 216−×± , which agrees well with measured 2n values
for fused silica ( Wcmn /103 2162
−×= ). We therefore attribute the flattened response
region in Figure 4.2 to the Kerr nonlinearity.
Equation (4.1) shows that the signal level at frequency Ω can be preserved for
lower Q optical modes at the cost of higher optical input powers. We confirmed this by
repeating the same measurement for different quality factor WGM resonances both
within the same cavity and other microtoroids. By doing this, the flat Kerr response has
been observed and the inferred 2n coefficient has been obtained in numerous test
samples. The flat Kerr response in the plot ultimately falls off due to the limited
bandwidth of the optical mode. The optical field in the cavity is built up in a finite period,
which is roughly equal to the inverse of the optical mode linewidth. At modulation
frequencies higher than the cavity linewidth, the modulation of the pump power cannot
fully build up within the cavity and be transferred to the probe beam. The WGM excited
in the sample studied in Figure 4.2 had a loaded Q of about 107, which translates to a

53
linewidth of about 20 MHz at 1550 nm. Using lower Q optical modes on the other hand,
we could extend the Kerr plateau to higher frequencies.
4-4 Conclusions
This chapter demonstrates a powerful approach to observe Kerr nonlinearity in
microcavities with extremely low optical powers. The simple experimental setup and
room temperature operation of these measurements are attractive for studying nonlinear
phenomena in microcavity structures. The discussed method is capable of measuring the
nonlinear susceptibility of the cavity material and can be used to characterize the 2n
coefficient for different materials packaged in a microcavity-type structure.

54
4-5 Bibliography
[1] R. K. Chang and A. J. Campillo (eds). Optical Processes in Microcavities. World
Scientific, Singapore, 1996.
[2] S. M. Spillane, T. J. Kippenberg, and K. J. Vahala. Ultralow-threshold Raman laser
using a spherical dielectric microcavity. Nature, 415(6872): 621-623, 2002.
[3] V. S. Ilchenko, A. A. Savchenkov, A. B. Matsko, and L. Maleki. Nonlinear optics and
crystalline whispering gallery mode cavities. Physical Review Letters, 92(4), art. no.
043903, 2004.
[4] V. S. Ilchenko, and M. L. Gorodetsky. Thermal nonlinear effects in optical
whispering gallery microresonators. Laser Physics, 2: 1004-1009, 1992.
[5] F. Treussart et al. Evidence for intrinsic Kerr bistability of high-Q microsphere
resonators in superfluid helium. European Physical Journal D, 1(3): 235-238, 1998.
[6] Robert W. Boyd. Nonlinear Optics. Academic Press, Boston, c, 1992.
[7] V. B. Braginsky, M. L. Gorodetsky, and V. S. Ilchenko. Quality-factor and nonlinear
properties of optical whispering-gallery modes. Physics Letters A, 137(7-8): 393-397,
1989.
[8] H. Haus. Waves and Fields in Optoelectronics. Prentice-Hall, Englewood Cliffs, N.J.,
1984.
[9] D. K. Armani, T. J. Kippenberg, S. M. Spillane, and K. J. Vahala. Ultra-high-Q
toroid microcavity on a chip. Nature, 421(6926): 925-928, 2003.
[10] M. Cai, O. Painter and K. J. Vahala. Observation of critical coupling in a fiber taper
to silica-microsphere whispering gallery mode system. Physical Review Letters,
85(1): 74-77, 2000.

55
[11] S. M. Spillane, T. J. Kippenberg, O. J. Painter, and K. J. Vahala. Ideality in a fiber-
taper-coupled microresonator system for application to cavity quantum
electrodynamics. Physical Review Letters, 91(4): art. no. 043902, 2003.

56
Chapter Five
Radiation-Pressure-Induced Mechanical Oscillations
(Parametric Instability) in Optical Microcavities
5-1 Introduction Radiation pressure can couple the mechanical modes of an optical cavity structure to its
optical modes, leading to parametric oscillation instability. This regime is characterized
by regenerative oscillation of the mechanical cavity eigenmodes. In this chapter, we
present the first observation of this effect with a detailed theoretical and experimental
analysis of these oscillations in ultra-high-Q microtoroids. Embodied within a microscale,
chip-based device, this mechanism can benefit both research into macroscale quantum
mechanical phenomena and improve the understanding of the mechanism within the
context of Laser interferometer gravitational-wave observatory (LIGO). It also suggests
that new technologies are possible that will leverage the phenomenon within photonics.

57
5-2 Parametric Instability
As circulating power is boosted in optical resonant systems there will be a natural
tendency for these systems to experience a radiation-pressure induced instability. The
instability is manifested as regenerative oscillations of the mechanical modes of the
cavity structure due to coupling of optical and mechanical degrees-of-freedom caused by
radiation pressure. This has been recognized theoretically by V. Braginsky [1,2] and is
termed “parametric oscillation instability.” At a simplistic level, this excitation process
can be understood as follows. Each circulating photon in the cavity changes its
propagation direction twice every roundtrip. Therefore, a photon transfers 4 times its
linear momentum to the cavity walls every time it completes a round trip. If the cavity is
not infinitely rigid, the walls will deform in response to the resulting pressure. Hence, the
pressure of circulating radiation induces a mechanical expansion of the cavity structure.
This motion, in return, takes the optical cavity out of resonance with the input pump
wave, thereby lowering the magnitude of radiation force. Upon restoration of the
mechanical deformation, the process resumes, leading to a periodic motion of the cavity
as well as the circulating power. It should be emphasized that this oscillation is
regenerative, exhibiting classic threshold behavior and requiring no external modulation
of the pump wave (see Figure 5.1)

58
Figure 5.1: Illustration of the radiation-pressure induced optomechanical coupling
mechanism. ωinB , the input optical field (at frequencyω close to a resonant frequency of
the cavity 0ω ) to the Fabry-Perot, causes large circulating field ωA as a result of resonant
power-buildup in the cavity. The pressure caused by this power moves the free-to-move
cavity wall by x , modeled as a damped harmonic oscillator at frequencyΩ . Motion of the
end mirror on the other hand causes frequency change of the Fabry-Perot resonant optical
mode. This interaction at sufficient optical powers results in regenerative oscillations of
the end mirror and consequently the modulation of the output optical power ωoutB .

59
More precisely, if one assumes the optical pump-wave frequency (ω ) is nearly
resonant (but not exactly resonant) with the optical mode, radiation-pressure induced
deformation of the cavity structure either lowers or raises the coupled optical pump
power, depending upon the sign of detuning of the pump frequency relative to the cavity
resonant frequency. It will be shown that when the pump laser is detuned to the high-
frequency tail of the optical mode, the phase relationship between optical pressure and
optical cavity deformation results in net power transfer from the optical pump to the
mechanical mode. This transfer manifests itself mathematically as a gain for the
mechanical oscillations, with a corresponding threshold optical pump-power.
Numerous theoretical studies have been devoted to ramifications of this effect in
the context of the Laser Interferometer Gravitational-Wave Observatory (LIGO) [3.4]. It
was predicted during the past few years [1-6] that the parametric instability could limit
the maximum stored energy in Fabry-Perot cavities (FP) used in the LIGO project and
hence the sensitivity of the gravitational wave detector. Although never observed,
recently a bench top experimental setup was proposed to verify these theoretical concerns
on a smaller scale [7].
As will be discussed in detail in the next sections, the mutual coupling of optical
and mechanical modes is significantly enhanced in smaller size cavities. Whereas in
macroscopic resonators the influence of radiation pressure is weak and only appreciable
at high power levels [8], it is significant in optical microcavities (such as silica
microspheres [9], microdisks, or microtoroids [10]), which simultaneously exhibit ultra-
high-Q optical modes and small mechanical mass. As discussed in previous chapters,
when coupled to a waveguide, the high quality factor of whispering-gallery microcavities

60
(~108) results in optical power build-up that can exceed 100 Watts of circulating power
for only 1 mWatt of waveguide input power. The resulting radiation pressure due to
confinement of these high optical powers in micron-scale volumes can expand the cavity
structure such that the optical resonant frequency shifts by hundreds of the resonance
linewidths. Therefore the combination of high optical quality factor and small mechanical
mass and dissipation can lead to threshold levels in the microwatt regime for regenerative
mechanical oscillations (i.e., parametric oscillation instability) in whispering-gallery
microcavities.
Radiation-pressure-induced optomechanical interaction has similar properties to
cavities containing a Kerr medium [11] (see chapter 4), including hysteretic wavelength
response caused by radiation pressure [8]. In particular, both radiation pressure and the
Kerr effect induce a coupling between optical path length and light intensity, one through
cavity strain and the other through the index of refraction. It is therefore not surprising
that radiation pressure has been proposed as an alternative path for observation of
quantum effects such as squeezing [11]. Radiation pressure acting on a movable cavity
can transfer information between two systems initially in semiclassical states, which, in
turn, become entangled. Using this entanglement it is possible to perform Einstein-
Podolsky-Rosen (EPR) tests [12]. Also, the possibility of teleporting and storing the
quantum information carried by the radiation field in the vibrational state of a
macroscopic cavity through ponderomotive entanglement is proposed recently [13,14].
Moreover, the nature of radiation pressure to act on a macroscopic object suggests that it
is a promising mechanism for entangling macroscopic mechanical oscillators [13],
creating a Schrödinger cat state of a macroscopic mirror [15] and teleportation of a

61
macroscopic mechanical resonator state [16]. Standard quantum-limited measurements of
position [17] are other exciting areas where this interaction can become useful.

62
5-3 Transmission Oscillations and Mechanical Eigenmodes of
Microtoroids
In this chapter we will focus on the radiation-pressure-induced parametric instability in
whispering-gallery microtoroid resonators [10]. However, all the aspects of this work
may apply in principle to any type of optical cavities.
This section reports the observation of transmission oscillations in the radio-frequency
(RF) range when optical power is coupled to sufficiently high quality factor optical
modes ( 710≈Q or 10 ns photon lifetime at infra-red wavelengths) of toroidal
microcavities [18,19,20] (see Figure 5.2.)

63
Figure 5.2: The schematics of the simple experimental setup used for observation of
transmission oscillations in toroid microcavities. The DC optical power of a laser source
is coupled to a microtoroid through a tapered optical fiber. The transmitted optical power
shows high amplitude modulations in the radio frequency range upon detection by a
photodetector.

64
Spectral analysis of the detected transmitted optical power using a high-
resolution electrical spectrum analyzer (ESA) revealed extremely narrow peaks (sub-
Hertz linewidths) at a frequency typically in the range of 10-100 MHz as well as at
harmonics of this fundamental frequency (see Figure 5.3). As can be seen in Figure 5.3,
typically two distinct fundamental oscillation frequencies (and their harmonics [21]) were
observed: a low frequency mode (~ 2-20 MHz) usually in the under-coupled regime and a
high frequency mode (~ 40-100 MHz) in the over-coupled regime (see reference [22] and
references therein for definition of under-, critical-, and over-coupled regimes).

65
Figure 5.3: The measured, spectral content of pump-power (at 1550 nm) transmission as
observed on an electrical spectrum analyzer (bandwidth set at 100kHz). Two families of
frequencies are observed along with their harmonics. Those at lower frequency range are
observed generally in the undercoupled regime and the higher frequency oscillations
mostly in the overcoupled regime.

66
Our further studies of this phenomenon revealed that in addition to their excellent
optical properties, microtoroid resonators also exhibit high-Q micromechanical modes,
which are flexural or radial in character and exhibit experimentally observed Q-factors as
high as 5000. We numerically investigated the mechanical eigenmodes of a toroidal
structure. The right panel of Figure 5.4 shows the strain and stress of the first three
rotationally symmetric eigenmodes of a toroid microcavity obtained by finite-element
modeling. The left panel of Figure 5.4 shows the experimentally observed oscillation
frequencies plotted versus length L (see right panel for definition of L) as inferred by
scanning electron microscopy (SEM) imaging. As is evident, the frequencies increase
with decreasing membrane length (L). Close agreement of the measured RF oscillation
frequencies with the results of the numerical modeling (less than 5% discrepancy)
confirms that the first- (n=1) and third- (n=3) order flexural modes are responsible for
generating the observed low- and high-frequency families of oscillations, respectively
(see Figure 5.3). It will be explained later in the chapter why n=2 mode is extremely hard
to observe in our experiments.

67
Figure 5.4: Right Panel: Finite element modeling of the micromechanical modes of a
silica toroid microcavity. The radial and azimuthal mode order are denoted with n and m
(where m = 0 corresponds to rotationally symmetric modes). Shown are the first three
rotationally symmetric radial modes (n = 1, 2, 3, m = 0) in cross section with the
amplitude of motion greatly exaggerated for clarity. In addition, the stress field is
indicated using color. Note that the mechanical motion modulates the cavity path length
due to a change in the cavity radius. Left Panel: Mechanical oscillation frequencies of the
(m=0,n=1) and (m=0,n=3) modes versus the cantilever length L (defined in the right
panel). Dots are experimentally measured frequencies and the solid lines are predictions
of the numerical modeling. Inset shows the agreement between the numerical predictions
of mechanical frequencies and measured frequencies of oscillations.

68
The mechanical origin of these oscillations was also confirmed by lowering a
metallic microprobe into proximity with the plane of the silica disk connecting the toroid
to the silicon pillar (i.e., not the toroid itself, where the optical mode lies). Since the
probe is far removed from the toroidal whispering gallery, it affects only the mechanical
and not the optical properties of the structure. The optical power oscillations were
observed to fully quench upon probe contact.
As evident in Figure 5.4, the n=3 mechanical mode has a strong radial component
to its motion and hence understanding of its excitation by way of radiation pressure
(which itself is primarily radial in direction) is straightforward. In contrast, the n=1 mode
motion is transverse, requiring a different method of force transduction (see Figure 5.5).
The details will be presented in section 5.7 where it is shown that minute offsets of the
optical mode from the equatorial plane provide a moment arm for action of radiation
pressure. The resulting torque induces the transverse motion associated with the n=1
mode. Modelling and SEM measurement of the offset, via focused ion beam preparation,
confirms this mechanism (also see Figure 5.13).

69
Figure 5.5: Left panel shows the cross section and excitation mechanism of the
fundamental (n=1) flexural mode. The offset (Δ ) between the optical mode location and
the disk equatorial plane creates a lever arm for the radial optical force ( radF ) and,
subsequently, a torque. Right panel shows the side-view image of a toroidal microcavity
pumped by CW laser at 1550 nm. Green luminescence is the result of Erbium up-
conversion (from 1.5 to 0.5 μm) which is intentionally doped in the microtoroid to
illustrate the location of the optical mode. Note that the optical mode (green) is higher
than the “cantilever beam” holding the microtoroid attesting the existence of the offset
(Δ ) in the left panel.

70
5-4 Equations of Motion for Optical and Mechanical Resonators and
Adiabatic Approximation
The system described above can be modeled using a set of coupled differential equations:
one, governing the harmonic motion of the flexing toroid and a second governing the
resonant optical field. The equation of motion for deformation (more precisely, the
displacement of the whispering gallery in the radial direction ( x )) is that of a damped,
harmonic oscillator driven by radiation pressure (generated by the circulating optical field
at the periphery of the microtoroid):
22.
0 |)(|2)()()(..
)( tAcm
nm
tftxtxtxeffeff
πγ ==Ω++ (5.1)
where effm is the effective vibrating mass of the mechanical structure in the radial
direction (the direction that alters the optical resonant frequencies of the cavity), Ω is the
mechanical frequency of the oscillation (one of the eigenfrequencies of the structure),
and 0γ is the intrinsic mechanical damping coefficient determining the mechanical quality
factor 0/ γΩ=mQ . f(t) is the radial force applied by radiation pressure of the slowly
varying field amplitude, )(tA (normalized so that 2|)(| tA is the circulating optical
power). nc / is the velocity of light in the cavity. As the optical resonance shifts with
structure expansion, the frequency difference between the input field and the moving-
cavity resonance changes as:
)()/()( 00 txRt ωωω −Δ=Δ (5.2)
Here R represents the radius of the microcavity (or more precisely, of the optical
whispering-gallery mode). The mechanically induced displacement of the optical cavity

71
resonant frequency contains, in general, a contribution from spatial and refractive index
changes (stress optical effect) [23,24]. The optical field in the cavity on the other hand
obeys the following equation [25]:
exttot TQBiti
QtAtA ωωω
=Δ−+ )](2
)[(.
)( (5.3)
B is the input pump field (normalized such that |B|2 is optical power launched in the
waveguide.) totalQ is the total quality factor of the optical mode, made up of an intrinsic
contribution 0Q and a waveguide-loading contribution extQ : 1/ totalQ =1/ 0Q +1/ extQ (see
ref. [22]). T is the photon round-trip time in the cavity.
In this section we will solve the above system of equations assuming what we will
call the “adiabatic approximation.” This approximation holds when totQ/ω<<Ω (i.e.,
mechanical frequency is much smaller than the optical cavity bandwidth). The adiabatic
picture provides a clear and intuitive understanding of the described optomechanical
interaction. In section 5.6 we will solve the system with a more general approach,
revealing the details of this interaction.
In the adiabatic regime, equations 5.1-5.3 can be solved self consistently, leading
to a mechanical gain term that is a linear function of the circulating optical power and
that offsets intrinsic sources of mechanical damping as given below. This leads to a
threshold optical pump power for onset of mechanical oscillations as follows:
)/1(0 thresholdPP−= γγ , mtotal
extthreshold QQ
Qdf
mRP 4
20
2
)(64
Ω=
ω (5.4)

72
where the intrinsic mechanical damping coefficient 0γ is modified to γ in presence of
the optical power in the waveguide ( P ) and where thresholdP denotes the incident threshold
power (power in the waveguide, not the power coupled into the resonator).
At strong coupling regimes ( 0QQext << ) the overall quality factor is dominated by
waveguide loading (i.e., exttot QQ ≈ ), and hence equation (5.4) predicts that in this
regime, the threshold power scales approximately with 3/1 totalQ emphasizing the
importance of high optical Q. Also apparent from equation 5.4 is the rapid scaling of the
threshold power with cavity dimensions. Taking into account the scaling of the effective
vibrating mass and its frequency, threshold power scales approximately
with 4RPthreshold ∝ . This explains why this effect, not yet observed in the context of the
LIGO project, is more likely to occur in microcavities with high Q factors and small
dimensions.
In equation 5.4, d is the detuning factor, giving the normalized detuning of the
optical frequency from the resonant optical pump frequency of the cavity ( 0ω ) in units of
its linewidth (i.e., totalQ
d/2 0
0
ωωω −
≡ ) and, )(df = dd /)1( 32+ is a factor that is positive for
blue-detuning of the pump (and negative for red detuning). This factor, emerging from
the analysis, reflects the intuitive picture described earlier, requiring a particular phase
relation between variation in coupled radiation pressure and cavity deformation in order
that power is transferred from the optical mode to the mechanical mode and not in the
opposite direction [26].
Analyzing the above system in time domain, by numerically solving the coupled
differential equations 5.1-5.3, offers a clear picture of the energy flow between

73
mechanical and optical fields and the of interaction between the mechanical and optical
resonators both present in the same device. Applying the predictor-corrector Adams’
method on equations 5.1-5.3 reveals the system dynamical behavior ( )(tA , )(tx ). Having
)(tA one can calculate the output power, 2|)(/)2/1(| tAQTiBQT tottot ωω +− [25].
Mechanical oscillations typically evolve to their full extent (starting from mechanical
rest) within 5 time-constants of the mechanical structure ( γ/10 ). For small oscillation
amplitudes ( totQRx /<< ) a nearly linear amplitude relation exists between mechanical
motion and output power modulation. For larger oscillations, however, the system
response becomes nonlinear as the microstructure vibrates faster than the optical power
can build up in or discharge from the cavity (see Figure 5.6). Interference of the
stationary pump wave and the field discharged from the cavity results in a train of
decaying peaks reflecting the fact that light discharged from the cavity is decaying
exponentially with time and is frequency shifted due to cavity vibrations. This behavior
of output power is depicted in Figure 6a,b. At even larger oscillation amplitudes, we have
also observed regimes where the system becomes sensitive to infinitesimal noise in the
initial conditions when a specific threshold power is exceeded, resembling the chaotic
behavior of the damped, driven pendulum.
Figure 5.6 shows the numerically solved cavity deformation, optical power in the
cavity, and their interaction during a few mechanical time cycles. Cavity motion, )(tr (not
to be confused with radial part of it, )(tx ), exhibits a flex of a few oA corresponding to a
resonance shift of few cavity bandwidths (Figure 5.6c). Cavity velocity ( )(trt∂ ) is about
0.9 mm/s when the cavity resonance crosses the pump laser wavelength (Figure 5.6d).

74
The cavity is then charged to a circulating power ( 2|)(| tA ) that approaches 50 W (Figure
5.6e) causing a centrifugal radiation force ( f ) that approaches 1.4 Nμ . Upon cavity
expansion, the power ( )()( trtf tμ∂ ) applied by radiation on the moving structure
approaches 0.2 nW (Figure 5.6f). The resulting transference of energy is manifested as a
red Doppler shift in the circulating photons. Upon the cavity shrinkage, power flows back
to the optical mode from the mechanical potential energy; the circulating photons then
experience a blue Doppler shift. A significant point is again the need for the pump wave
to be blue detuned with respect to the microcavity resonance (d>0 in equation 5.4) in
order to induce oscillations. Because of this detuning, the pump wave spends a little more
time to one side of the microcavity resonant frequency (Figure 5.6c) explaining why
energy ( ')'()'(0 ' dttrtft
t∫ ∂ μ ) flows on average from the optical mode to the mechanical
mode (Figure 5.6g) and generates gain for mechanical vibrations as predicted by equation
(5.4.) In this example, for each acoustical cycle, 18109 −× Joules of energy are given to
the optical mode upon shrinking, but then 181010 −× Joules are taken from the optical
mode upon expansion (Figure 5.6g). This energy difference drives the mechanical
vibrations. The sign of the energy flow will be reversed if the pump detuning changes
sign. It is interesting, and the reader can verify that the net energy transferred to the
mechanical mode in every cycle ( 1810− Joules) is equal to the dissipated mechanical
energy (stored mechanical energy divided by the mechanical quality
factor,m
mdissipated Q
EE
π2= ).

75
Figure 5.6: Plots versus time of (a) measured and (b) calculated transmitted optical
power; (c) cavity displacement (d); velocity; (e) optical power circulating in cavity (left
ordinate), which is proportional to the total radial force (right ordinate) applied by
radiation on the cavity; (f) power flow to mechanical mode; and (g) energy transferred to
mechanical mode from radiation. Here, the toroid radius is R = 29 μm, the mass was
calculated (from SEM imaging) to be Kg11105 −× , the intrinsic mechanical quality factor
was measured to be 1200, and the mechanical oscillation frequency occurs at 5.4 MHz.
The pump power frequency is fixed at detuning of 0.55 FWHM away from the cavity
optical resonance ( nm14610 =λ ), and the optical quality factor was measured to be
7105×=oQ .

76
5-5 Experimental Study of Below and Above Threshold Behavior
In order to verify the predictions of the above findings in the sub-threshold regime, the
mechanical damping rate was measured as a function of optical pump power. In this
regime, damping of mechanical oscillations can be decreased by injecting optical power
into the microtoroid, yet the induced mechanical gain is not sufficient to initiate the
regenerative vibrations. To measure the damping rate, an optical pump and probe
approach was used (similar to Kerr-nonlinearity measurement in chapter 4) with two laser
beams (a strong pump and a weak probe) individually resonant with two whispering
gallery mode optical resonances. The experimental setup is depicted in Figure 5.7.

77
Figure 5.7: The experimental setup used for characterizing the mechanical oscillations of
microtoroids in the subthreshold regime. Two wavelength couplers are used to ensure
high extinction of the pump power in the probe channel. The picture is a top-view optical
micrograph of a toroid microresonator evanescently side coupled to a tapered optical
fiber.

78
Two, external-cavity diode lasers with 300 kHz linewidth were used as laser
sources. The pump laser in the 1550 nm band and probe laser in the 1480 nm band were
coupled to the microcavity using a tapered optical [27]. The output of the 1550 nm laser
was weakly modulated using a Mach-Zehnder modulator. In this way the “DC”
component of the pump power creates gain for the mechanical modes while the
alternating component creates a harmonically-varying radiation-pressure that acts as a
forcing function on the sub-threshold vibrational modes. Since the response motion also
causes frequency shifts of the optical mode that is resonant with the probe signal, the
mechanical response as a function of forcing-function frequency can be measured using
the optical probe wave. The resulting modulation of the probe power can be measured
using a lock-in amplifier, and it can be related to the amplitude of vibrations by
measuring the quality factor of the optical mode coupled to the probe wave and its
detuning from probe signal (for these experiments the weak probe beam was coupled to a
low Q (~106) whispering gallery resonance to ensure that probe power would not induce
a competing oscillation effect). In this way, “vibrational spectroscopy” can be performed
by sweeping the modulation frequency through the vibrational resonances. This
spectroscopy reveals the lineshape of the mechanical resonance and hence its linewidth
(and damping rate or equivalently the mechanical Q factor). Figure 5.8 gives sample
spectroscopic scans over an n=1 vibrational mode with a resonant frequency of 7.67
MHz. The solid lines are the theoretical fits using a damped harmonic oscillator model
for the mechanical motion. The inset in Figure 5.8 gives measured damping rates
(extracted from the theoretical fits like that shown in the main Figure) plotted versus
optical pump power using the pump/probe spectroscopy measurements. A linear decrease

79
in damping with increasing pump power is evident in the data (in agreement with
equation 5.4). Also apparent is the threshold power, which in this case is expected to
occur at an optical pump power of 11 micro Watts. The intrinsic Q factor of the
mechanical mode (i.e., Q factor at zero input pump power) is inferred to be 630 in this
data.
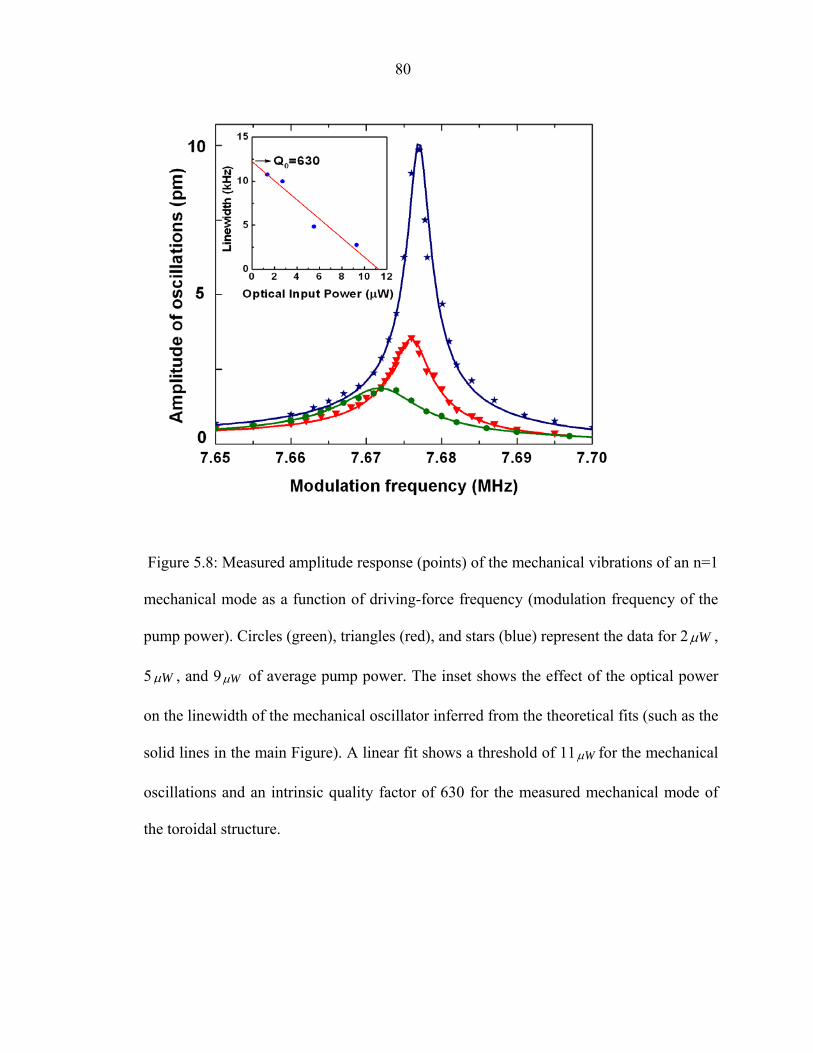
80
Figure 5.8: Measured amplitude response (points) of the mechanical vibrations of an n=1
mechanical mode as a function of driving-force frequency (modulation frequency of the
pump power). Circles (green), triangles (red), and stars (blue) represent the data for 2 Wμ ,
5 Wμ , and 9 Wμ of average pump power. The inset shows the effect of the optical power
on the linewidth of the mechanical oscillator inferred from the theoretical fits (such as the
solid lines in the main Figure). A linear fit shows a threshold of 11 Wμ for the mechanical
oscillations and an intrinsic quality factor of 630 for the measured mechanical mode of
the toroidal structure.

81
To characterize the mechanical modes in the above-threshold regime, the weak
modulation of the pump power was terminated (i.e., steady pump wave) and the spectral
content of the transmitted probe power was analyzed to monitor regenerative mechanical
oscillations. The Fourier component of the transmitted probe power at the mechanical
resonant frequency (Ω ) was monitored by the electrical spectrum analyzer. The intensity
of this signal, proportional to the amplitude of the vibrations caused by the pump wave,
was measured as a function of pump power. Figure 9 contains a typical result of these
measurements for one of the studied devices and shows a clear threshold for the
vibrational oscillations. Since the oscillator behaves as an optical power modulator [21]
the electrical spectrum analyzer data can be transformed to compute the actual amplitude
of mechanical motion. More precisely, modulation depth in the optical power can be
transformed into frequency variation caused by the mechanical motion using the
measured linewidth of the optical mode. This frequency variation, however, is directly
proportional to the ratio of amplitude of the mechanical motion to the radius of the
microtoroid. This transformation has been used to calibrate the vertical axis in Figure 9.
The data in Figure 9 also seem to suggest that the amplitude of the vibrations saturates at
high pump powers. Numerical modeling shows that this behavior can be attributed to the
induced frequency shifts of the cavity that, for higher pump power levels, exceed the
cavity linewidth. This, in turn, reduces the efficacy of the pumping mechanism as the
pump wave spends a progressively smaller fraction of time on resonance during each
mechanical cycle [28].

82
Figure 5.9: Measured mechanical oscillator displacement as a function of the optical
pump power showing threshold behavior. Oscillations initiate at about 20 Wμ of input
power and start to saturate for higher values of pump power. This saturation is associated
with the lower optical-mechanical coupling at displacements large enough to shift the
resonant frequency of the optical mode by greater than its linewidth.

83
5-6 Beyond Adiabatic Approximation: Coupled Mode Theory of
Parametric Instability
In the theoretical work of Braginsky [1,2] it was shown that the interaction of the
vibrating resonator (at frequencyΩ ) with photons inside the cavity results in the creation
of photons down-shifted (Stokes sideband, Ω−ω ) or up-shifted (anti-Stokes sideband,
Ω+ω ) in energy from the original photons by the frequency of the vibrations. If the
Stokes field coincides with an adjacent optical resonance (Figure 5.10a), beating of the
pump and Stokes-sideband provides mechanical gain for regenerative mechanical
oscillations, thereby causing the parametric oscillation instability.
It is important to note that optical resonances with Q-factors in the 106-108 range
have resonant linewidths in the range of ca. 2-200 MHZ in the infra-red frequencies,
which is indeed the range of the first three fundamental flexural modes for typical
toroidal geometries employed in this work. This insight suggests that in addition to the
Braginsky’s theory [1], where the Stokes mode must coincide with an adjacent optical
mode, mechanical oscillations can also occur when the mechanical resonance frequencies
(Ω ) fall within the same cavity bandwidth ( totQ/ω ) [29] of the pump mode (i.e.,
totQ/ω≈Ω ), heretofore called the “in-band” case (Figure 5.10b).

84
Figure 5.10: Panel A: represents Braginsky’s view of parametric instability in the
frequency domain, where the Stokes side band coincides with an adjacent optical mode.
Panel B: shows the scenario we have encountered in our observations where the Stokes
and anti-Stokes side bands both fall almost within the bandwidth of the same optical
mode. Panel C: the experimental demonstration of the panel B scenario. Optical power
out-coupled from a toroid microcavity oscillating at about 5 MHz frequency is measured
by a 1MHz-resolution spectrum analyzer (high finesse Fabry-Perot). Higher optical side
bands exist due to interaction of the Stokes and anti Stokes side bands with the
mechanical mode. Theoretical predictions are also given.

85
The adiabatic regime, for example, totQ/ω<<Ω (see section 5.4), is in fact a
special case of the in-band parametric instability ( totQ/ω≈Ω ), where Braginsky’s “out
of band” picture does not hold. The adiabatic approach has to be modified, however, to
predict correct threshold powers where the mechanical frequency is comparable to or
even larger than the optical resonant linewidths (which are also observed in our studies),
but is still too small to generate side-bands coinciding with an adjacent optical mode (see
Figure 5.10a,b). To arrive at an analytical expression for the threshold power in these
cases we have extended the theory of Braginsky for a Fabry-Perot cavity [1]. Using the
slowly varying envelope approximation and the formalism of H. Haus, the mutual
coupling of mechanical and optical modes can be described by:
BQ
iaxemR
iia
Qa
dtd
aeCmRn
ixQ
xdtd
totm
ti
efftot
ti
effeffm
mm
000
2
][2
||)(22
ωωω
ω+
Ω+Δ+−=
⋅Γ
−Ω
−=
Ω
Ω
(5.5)
These equations are identical to equations (5.1-5.3). The first equation describes
the mechanical eigenmode with an effective mass effm , where mx (as opposed to x ,
which represents the radial motion of the cavity used in equations 5.1-5.3) is normalized
to mechanical energy, i.e., ∑∫== θ
σε,,
2
zriiim dVx , ( iσ and iε are the diagonal components of
the stress and strain tensor) which decays with the lifetime Ω
mQ. )(ΓC is a correction
factor [1…2] due to the reduction of circulating power in the presence of modal coupling
[30]. Correspondingly 2a is the energy in the optical WGM mode (as opposed to 2)(tA

86
used earlier to denote the optical power in the cavity), which is excited with a pump laser
(with power 2B ) detuned by the amount ωΔ from line-center, oωωω −=Δ .
Assuming the optical filed in the cavity is composed of the pump and the
generated Stokes and anti-Stokes fields with corresponding detunings ωΔ ,
Ω−Δ=Δ ωωS and Ω+Δ=Δ ωωAS from cavity line-center 0ω (i.e.,
tiAS
tiS
tip
ti ASS eaeaeaae ωωωω ΔΔΔΔ ++= ), equation 5.5 results in four coupled mode
equations:
.)(2
,)(2
,)(2
),()(22
****
*
**
pmeff
ASAStot
AS
pmeff
SStot
S
extSmASm
effpp
tot
p
SpASpeffeff
mm
m
axmRiaia
Qta
axmRiaia
Qta
BQ
iaxaxmRiaia
Qta
aaaaCmRn
ixQt
x
Ω+Ω+Δ+−=
∂∂
Ω−Ω−Δ−−=
∂∂
++Ω
+Δ+−=∂
∂
+Γ
−+
Ω−=
∂∂
ωωω
ωωω
ωωωω
(5.6)
Solving these equations in steady state yields the threshold for radiation pressure
induced mechanical oscillation:
122
200
2
0
02 ]
41
1
41
1[8
/21 −
⎟⎟⎠
⎞⎜⎜⎝
⎛ Δ+
−
⎟⎟⎠
⎞⎜⎜⎝
⎛ Δ+
×Δ++Ω
=
o
Stot
o
AStotmtoteffthresh
QQKiQK
QQQmRP
ωω
ωω
ωωω
(5.7)
The threshold equation reveals that in order to arrive at oscillation, the mechanical
loss has to be overcome (i.e., the expected mQ/1 dependence). Dependence of radiation
pressure upon circulating optical power, however, leads to the 0/1 Q dependence as well
as the presence of a weighting factor describing the effect of waveguide coupling,

87
ex
o
K = [30]. The last term results from the interplay of the Stokes and anti-Stokes
photons, which provide mechanical gain and loss, respectively. Figure 5.11 shows a plot
of the mechanical gain (inverse of equation 5.7) as a function of both coupling (K) and
detuning frequency ( ωΔ ) for the n=1 and n=3 mechanical modes, which will be
predominantly analyzed in the experiments. It is noted, that the mechanical gain is only
positive for a blue detuned pump with respect to the cavity resonance ωΔ >0. This
situation leads to more Stokes than anti-Stokes photons (the ratio
being 220
220
2
)(4)/()(4)/(
AStot
Stot
S
AS
aa
ωωωω
Δ+Δ+
= ) and causes a net mechanical gain. The converse is
true for red-detuned pump, which causes the mechanical resonance to experience
negative gain (i.e., damping). For the special case of ωΔ =0, the gain vanishes. These are
all in agreement with our findings in the adiabatic regime (see equation 5.4 and definition
of d factor).
Furthermore, it is interesting to investigate the exact Q-factor dependence of
threshold power shown in the inset of Figure 5.11. As expected, in the adiabatic regime,
totQ/ω<<Ω , the mechanical oscillation threshold power scales as 3
0
11⎟⎟⎠
⎞⎜⎜⎝
⎛⋅∝
QQP
mthresh
in agreement with our previous expression for this regime (the reader can verify that in
this regime the expression for threshold power reduces exactly to equation 5.4). In
contrast, if the mechanical eigenfrequencies lie outside the cavity band-width, i.e.,
totQ/ω>Ω , the threshold scales as0
2
1ωωΔ
⋅Ω
∝m
thresh QP , causing a roll-off of the
optical Q dependence. In fact, analysis of equation 5.7 shows that the minimum threshold

88
( 0=Δ∂∂
∂ωK
Pthresh ) for higher optical Q factors, approaches asymptotically a limiting value,
which can only be achieved for progressively stronger over-coupling (and
correspondingly increasing the cavity bandwidth until the condition Ω≈totQ/ω is met).
The roll-over from inverse-cubic behavior occurs when Ω∝0
0
Qω
, i.e., Ω
≅− 00
ωoverrollQ as
observed in the inset of Figure 5.11.

89
Figure 5.11: Mechanical gain (from equation 5.7) as a function of detuning (negative
detuning corresponds to a redshift) and taper-waveguide-cavity coupling (simulation
parameters υ1=4.4 MHz, υ3=49.8 MHz, Q0=5x10⁷). Maximum gain for the n=1 mode
occurs in the under-coupled regime (log(K)<0), whereas for the n=3 mode it occurs
overcoupled (log(K)>0). Inset: Double logarithmic plot of the minimum oscillation
threshold power for the n=1 and n=3 mode (equation 5.7) versus the intrinsic optical
quality factor.

90
5-7 Experimental Investigation of Parametric Instability Threshold
Power
In order to confirm the threshold dependence (as given by equation 5.7) on both optical
and mechanical Q-factors we have carried out numerous experiments and simulations on
a single toroid microresonator. The microtoroid under consideration had principal, pillar,
and toroid diameter of 72 μm, 36 μm, and 6.8 μm and possessed mechanical resonance
frequencies at (4.4 MHz, 25.6 MHz, and 49.8 MHz) for the first three modes (n=1,2,3
and m=0). Minimum threshold power was measured by optimizing the detuning and
coupling (compare Figure 5.11). The result of this measurement is shown in Figure 5.12.
A double logarithmic plot is used to infer the critical exponent, which shows excellent
agreement with the prediction (1/Q3) for adiabatic regime. For progressively higher Q
values, the theoretically predicted roll-over of the 1/Q3 threshold dependence is observed.
The roll-over point occurs at a Q of ca. 107, which agrees well with the prediction
Ω=− 0
0ωoverrollQ for the first-order flexural mode. The solid line is the minimum threshold
as given by equation (5.7), which is minimized with respect to detuning (Δω) and
coupling (K) to reflect the experiments, i.e., 0=Δ∂∂
∂ωK
Pthresh . The effective mass was the only
fit parameter used and was inferred to be ( Kgmeff8)1( 103.3 −×≈ ).
The threshold for the 3rd order flexural mode was also recorded. This mode has a
resonance frequency of 49.8 MHz with 25003 ≈=nmQ . Consequently for optical Q factors
in the range of 107 this mode is in the beyond-cavity-bandwidth regime,
since 600 104×=
Ω=− ωoverrollQ . In the experiments, oscillation on this high frequency mode

91
was only observed by adjusting the taper-resonator coupling junction into the over-
coupled regime, in agreement with theory. In this regime the low frequency flexural
mode could not be excited any more, and a transition from n=1 to n=3 occurred. This
transition is in excellent agreement with the theoretical prediction of equation 5.7, as
plotted in Figure 5.11. The inset of Figure 5.12 shows the measured threshold for the n=3
resonance in comparison with the n=1 mode. The single parameter fit yields an effective
mass for the n = 3 mode, which is significantly lower than for n=1, by a factor of 660,
i.e., Kgmeff11)3( 105 −×≈ . Note, that the reason for yet lower threshold values of the n=1
mode, lies in the fact that the n=3 mode is in the beyond-cavity-bandwidth regime for the
Q-values >107 (where the roll-over behavior happens in the optical Q dependence).
However, for lower Q, the n=3 mode has indeed lower threshold, and the crossing of n =
1 and n = 3 has indeed been observed in experiments (compare with the inset of Figure
5.10).

92
106
107
108
109
101
102
103
104
105
Optical Quality factor
Aco
ust
ic T
hre
sho
ld (μ
W)
106
107
108
102
104
n=1 mode
n=3 mode
Figure 5.12: Main panel: The measured mechanical oscillation threshold (inμ Watts)
plotted versus the optical quality factor for the fundamental flexural mode
( 3500,4.42/,1 ==Ω= mQMHzn π ) on a double logarithmic scale. The solid line is a
one-parameter theoretical fit obtained from the minimum threshold equation by first
performing a minimization with respect to coupling and pump wave detuning, and then
fitting by adjustment of the effective mass ( Kgmeff8)1( 103.3 −×≈ ). Inset shows the
measured threshold for the 3rd order mode ( 2500,8.492/,3 ==Ω= mQMHzn π ) plotted
versus optical Q. The solid line gives again the theoretical prediction
with Kgmeff11)3( 105 −×≈ . The n=1 mode data from the main Figure is superimposed for
comparison.
93
The mechanical eigenmodes of microtoroids can be considered as a combination
of two harmonic oscillators: within-plane oscillator (radial amplitude x, which modulates
the cavity path length) and out-of-plane oscillator (amplitude z, which does not affect the
optical path length). Note that the mechanical energy mE is also associated with both a
radial motion ( 22 xmeff Ω ) and a transverse motion. Since only the radial direction
modulates the cavity path-length (with amplitude x), the effective mass effm for the radial
motion is given by:
)(1,,
2222 ∑∫=Ω
=Ω
≡θ
σεzxi
iim
eff dVxx
Em (5.8)
and can be evaluated by finite element simulation. The effective mass in the radial
direction will always be higher than the total mass of the structure, since not all motion is
occurring in the radial direction.
For the n = 3 mode, the predicted effective mass from our numerical models
associated with the radial motion was Kgmeff11)3( 105 −×≈ , which is in very good
agreement with the experimental fit in Figure 5.12. Furthermore, this value is
exceptionally close to the actual mass of the vibrating structure. This can be intuitively
expected as the n=3 motion is primarily radial (see Figure 5.4) and therefore the out-of-
plane motion and its contribution to the mechanical energy is negligible.
For the n=1, 2 modes, however, the calculated effective mass is a strong function
of the offset of the toroidal ring with respect to the equatorial plane of the disk [31]. As
explained in section 5-3, excitation of the n=1 mode by radiation pressure can only be
explained by existence of this offset. To both validate and quantify this offset, a cross
section of the toroid microcavity used in the study was obtained with focused-ion beam

94
slicing. SEM imaging included in Figure 5.13 reveals the presence of the above
postulated equatorial offset, which amounts to an offset of 1.3 mμ . Incorporation of this
offset to the numerical mass calculations yields Kgmeff8)1( 106.2 −×≈ and
Kgmeff9)2( 102 −×≈ . This value agrees very well with the experimental values from Figure
5.12. Finally, the numerical model also explains why the n=2 mode is observed only
subthreshold in the experiments. The low mechanical Q value (~200), in conjunction with
its high effective mass and frequency, predicts threshold powers greater than 2mW.

95
Figure 5.13: Scanning-electron micrograph of a cross section of the toroid microcavity
used in this study. The cross section was revealed by focused-ion beam (FIB) technology,
which allowed removal of a 2 micron wide section. The slicing clearly reveals the
presence of an offset of the 7-micron-diameter toroid with respect to the 2-micron thick
silica support disk (in this case an offset of ca 1.3 micron, dotted lines). Inset: side view
of the toroid microcavity inferred from the FIB method.

96
We next proceeded to verify the dependence of threshold power on the
mechanical quality factor. As both optical and mechanical Q affect threshold, a method
was needed that could reduce the mechanical Q factor while leaving the optical Q factor
unchanged. To this end, we used a silica-microprobe fabricated by heating and stretching
a single-mode-fiber using a CO2 laser. An optical micrograph is shown in the inset of
Figure 5.14 where the mechanical probe is mounted on a 3-axis piezoelectric stack and
positioned above the fiber-taper coupled microtoroid. When the probe was brought into
contact with parts of the microstructure exhibiting high-amplitude mechanical
oscillations (compare the mode profiles in Figure 5.4) a reduction of the mechanical Q-
factor was observed, while leaving the optical Q-factor unaffected. The change in
mechanical Q-factor was measured by fitting the ESA-measured resonances in the sub-
threshold regime with Lorentzian profiles. Without contact the mechanical Q was
measured to be ~5000 for the n=1 mode, and upon progressive increase in tip pressure
(controlled via piezo-electric distance) the mechanical Q could be continuously decreased
by nearly two orders of magnitude, down to a value of 50. Upon retrieving the probe the
original Q-factor was recovered. The microprobe method thus allowed changing the
mechanical Q, while leaving the optical modes unperturbed. For each mechanical Q the
minimum threshold for the n=1 flexural mode (by optimizing both Δω and K) was
measured. Figure 5.14 shows the measured minimum threshold for oscillation of n=1
mode as a function of mechanical Q-factor, clearly revealing the 1/Qm dependence of the
oscillation threshold, in agreement with equations 5.4 and 5.7, as well as theoretical
predictions of Braginsky [32,33]. This method also provides a technique to prevent
parametric oscillation instability for cases where this effect is not desirable.

97
Figure 5.14: The mechanical threshold power (in micro Watts) versus the mechanical
quality factor of the n=1 mode. The solid line is the theoretical prediction
( mthresh QP /1∝ ). Inset: Optical micrograph of the side view of the experimental setup,
consisting of a silica microprobe in proximity of a fiber-coupled microtoroid of 72-
micron-principal diameter.

98
5-8 Conclusions
The work presented in this chapter is the first demonstration of the radiation-pressure-
induced parametric instability in optical resonators of any kind. This work demonstrates
how vibrational and optical modes of the same cavity structure can act as parametrically
coupled oscillators despite their very different frequencies ( 710~ against Hz1410~ ).
Realization of this effect in microscale can be utilized as a platform for studying the
parametric-instability limitations for LIGO project.
It should be noted that mechanical oscillations in microstructures can be
generated using alternative methods. For example, references [34,35] describe thermally
actuated mechanical vibrations of a silicon disk and a silicon cantilever, respectively. In
contrast, the long thermal time constant of the toroidal structures in the present work
( thermalτ is in the order of sμ5 [36,37]) precludes initiation of RF rate oscillations such as
those observed here. Also significant is the expected threshold dependence on optical Q
for thermally driven instabilities. Because resonator deformation for a thermally driven
process (as opposed to radiation pressure) depends on coupled optical power (not
circulating power) one expects an inverse quadratic scaling of the threshold power with
optical Q ( 2−∝QPthreshold ) for thermally induced oscillations as opposed to inverse cubic
( 3−∝QPthreshold ) for radiation pressure-induced-oscillations verified in this study.
Excellent agreement of the threshold functional dependence on optical and mechanical Q
factors, and precise numerical predictions of the threshold power, provides confirmation
that radiation pressure is the excitation mechanism of the observed oscillations.
In small microtoroids (we were also able to observe similar oscillations in silica
microspheres), occurrence of these oscillations has been observed with threshold powers

99
well below those of other nonlinear effects such as Raman [38,39], Kerr parametric
oscillation [40], and lasing due to intentional doping of rare-earth elements into the
microcavities [41]. This clearly suggests that radiation-pressure-induced effects can
establish a practical limit for miniaturization of optical microcavities. This
miniaturization limit can be extended by adding a mechanical damper (or displacement
limiter as in Figure 5.14) to the cavity structure. Yet, the fundamental nature of
circulating light to apply pressure and the general nature of structural stiffness to reduce
with miniaturization [42] suggest that it is likely that all optical cavities are susceptible to
these oscillations at various optical powers. The inverse cubic dependence of threshold
power suggests that current efforts directed towards realization of higher Q optical
microcavities will only tend to accelerate the observation of these oscillations in other
microcavity systems either as a limiting floor in miniaturization, or as a useful new
optomechanical nonlinearity.
Beyond limitations caused by radiation-pressure-induced optomechanical
coupling, the parametric instability demonstrates a new class of hybrid oscillators where
a continuous source of pump-laser power (without any type of external feedback system)
can generate radio frequency mechanical vibrations of a micromechanical structure (a
rendering of the oscillation process for the n=3 mode is shown in Figure 5.15). These
oscillations imprint onto the optical pump, now an optical carrier for RF frequencies.
Realization of this effect undoubtedly benefits applications in RF micromechanical
oscillators [43] on a chip and all-optical frequency reference devices.

100
Figure 5.15: Panel A illustrates the “below threshold” behavior where the optical pump
wave at frequencyω is not strong enough to induce mechanical oscillations of the
microtoroid. Panel B illustrates the “above threshold” case for the n=3 vibrational mode.
Mechanical oscillation at frequency Ω creates optical stokes ( Ω−ω ) and anti-stoked
sidebands ( Ω+ω ) in the transmitted pump wave. Inset of panel B shows the
exaggerated cross-section of the third-order eigenmode and variation of the toriod radius
as a result of these oscillations.

101
Besides the fundamental aspects of this work, the observed coupling of
mechanical and optical modes by radiation pressure can find applications in
micromechanical and nanomechanical systems [44] for ultra-high sensitivity
measurements of charge [45], displacement, mass, force [46], or biological entities [47].
Equally important, radiation pressure as observed here can be used to achieve cooling of
mechanical resonator modes [35].
We believe the promising consequences of our recent research results will pave
the way for further practical applications of UHQ microcavities and introduce them to an
exciting and drastically novel realm of science.

102
5-9 Bibliography
[1] V. B. Braginsky, S. E. Strigin, and S. P. Vyatchanin. Parametric oscillatory instability
in Fabry-Perot interferometer. Physics Letters A, vol. 287(5-6): 331-338, 2001.
[2] V. B. Braginsky, S. E. Strigin, and S. P. Vyatchanin. Analysis of parametric
oscillatory instability in power recycled LIGO interferometer. Physics Letters A.
305(3-4): 111-124, 2002.
[3] A. Abramovici et al. The Laser-Interferometer-Gravitational-Wave Observatory.
Science, 256(5055): 325-333, 1992.
[4] G. Amelino-Camelia. Gravity-wave interferometers as quantum-gravity detectors.
Nature, 398(6724): 216-218, 1999.
[5] W. Kells and E. D'Ambrosio. Considerations of parametric instability in Fabry Perot
interferometer. Physics Letters A, 229(4): 326-330, 2002.
[6] C. Zhao, L. Ju, J. Degallaix, S. Gras, D. G. Blair. Parametric instabilities and their
control in advanced interferometer gravitational-wave detectors. Physical Review
Letters, 94(12): art. no. 121102, 2005.
[7] S. W. Schediwy, C. Zhao, L. Ju, et al. An experiment to investigate optical spring
parametric instability. Classical and Quantum Gravity, 21(5): S1253-S12587, 2004.
[8] A. Dorsel, J. D. McCullen, P. Meystre, E. Vignes, and H. Walther. Optical bistability
and mirror confinement induced by radiation pressure. Physical Review Letters,
51(17): 1550-1553, 1983.
[9] V. B. Braginsky, M. L. Gorodetsky, and V. S. Ilchenko. Quality-factor and nonlinear
properties of optical whispering-gallery modes. Physics Letters A, 137(7-8): 393-397,
1989.

103
[10] D. K. Armani, T. J. Kippenberg, S. M. Spillane, and K. J. Vahala. Ultra-high-Q
toroid microcavity on a chip. Nature, 421(6926): 925-928, 2003.
[11] L. Hilico, J. M. Courty, C. Fabre, et al. Squeezing with Chi (3) materials. Applied
Physics B-Photophysics and Laser Chemistry, 55(3): 202-209, 1992.
[12] V. Giovannetti, S. Mancini, and P. Tombesi. Radiation pressure induced Eintstein-
Podolsky-Rosen paradox. Europhysics Letters 54(5): 559-565, 2001.
[13] S. Mancini, V. Giovanetti, D. Vitali, and P. Tombesi, “Entangling macroscopic
oscillators exploiting radiation pressure,” Phys. Rev. Lett., vol. 88, 120401, 2002.
[14] S. Pirandola, S. Mancini, D. Vitali, and P. Tombesi. Continuous-variable
entanglement and quantum-state teleportation between optical and macroscopic
vibrational modes through radiation pressure. Physical Review A., 68, art. no. 062317,
2003.
[15] W. Marshall, C. Simon, R. Penrose, and D. Bouwmeester, Towards Quantum
superpositions of a mirror. Physial Review Letters, 91, art. no. 130401, 2003.
[16] S. Mancini, D. Vitali, and P. Tombesi. Scheme for teleportation of quantum states
onto a mechanical resonator. Physical Review Letters, 90(13): art. no. 137901, 2003.
[17] I. Tittonen, et al. Interferometric measurements of the position of a macroscopic
body: Towards observation of quantum limits. Physical Review A., 59(2): 1038-1044,
1999.
[18] H. Rokhsari, T. J. Kippenberg, T. Carmon, and K. J. Vahala. Radiation-pressure-
driven micromechanical oscillator. Optics Express, 13 (14): 523-5301, 2005.

104
[19] T. J. Kippenberg, H. Rokhsari, T. Carmon, A. Scherer, and K. J. Vahala. Analysis of
radiation-pressure induced mechanical oscillation of an optical microcavity. Physical
Review Letters, 95(3): art. no. 033901, 2005.
[20] T. Carmon, H. Rokhsari, L. Yang, T. J. Kippenberg, and K. J. Vahala. Temporal
behavior of radiation-pressure-induced vibrations of an optical microcavity phonon
mode. Physical Review Letters, 94(22): art. no. 223902, 2005.
[21] The characteristics of the overall waveguide-resonator system can be viewed as an
optical modulator that is driven by this oscillation. This modulator has a nonlinear
transfer function that manifests itself (in the modulated pump power) through the
appearance of harmonics of the characteristic mechanical eigenfrequencies. These
harmonics are easily observed upon detection of the modulated pump (see Figure
5.3).
[22] M. Cai, O. Painter and K. J. Vahala. Observation of critical coupling in a fiber taper
to silica-microsphere whispering gallery mode system. Physical Review Letters,
85(1): 74-77, 2000.
[23] From the simulations it is calculated that the change in refractive index due to the
stress-optical effect is more than 1 order of magnitude smaller compared to the direct
spatial change in cavity path length, i.e., )(2)()(2 dRRnnndRR effeff +≈+Δ×+ ππ .
[24] R. M. Shelby, M. D. Levenson, and P. W. Bayer. Guided acoustic-wave Brillouin-
scattering. Physical Review B., 31(8): 5244-5252, 1985.
[25] M. L. Gorodetsky, and V. S. Ilchenko. Optical microsphere resonators: optimal
coupling to high-Q whispering-gallery modes. Journarl of the Optical Society of
America B-Optical Physics, 16(1): 147-154, 1999.

105
[26] For 0)( <df , i.e., a red shift of the pump frequency with respect to the cavity mode,
the phase of the radiation pressure variations actually damps or “cools” the vibrations.
Note that no external feedback system is necessary here to damp the vibrations or
“cool” the resonator. The feedback system is inherent to the coupling mechanism.
Due to the high quality factor of our cavities (Q ~ 10 million) the “red-shifted” tail of
the optical mode is not thermally stable (see H. Rokhsari et. al. Loss characterization
in microcavities using the thermal bistability effect. Applied Physics Letters, 85(15):
3029-3031, 2004). Replacing the cavity material (silica) with a negative thermo-optic
coefficient material would stabilize the red-shifted tail and cavity-cooling induced by
radiation pressure effects could be observable.
[27] S. M. Spillane, T. J. Kippenberg, O. J. Painter, and K. J. Vahala. Ideality in a fiber-
taper-coupled microresonator system for application to cavity quantum
electrodynamics. Physical Review Letters, 91(4): art. no. 043902, 2003.
[28] For the sample tested, it is calculated that radial variations of about 10 picometers
will shift the resonant frequency of the excited optical mode by its linewidth.
[29] In special cases, we also observed the classical V. B. Braginsky case, which can
occur since the WGM modes typically appear as doublets, due to the lifting of the
CW and CCW mode degeneracy. If this doublet splitting coincides with the
mechanical oscillation frequency, parametric oscillation instability can occur when
pumping the blue-shifted doublet eigenmode, whereas it is absent on the red-shifted
eigenmode.
[30] T. J. Kippenberg, S. M. Spillane, and K. J. Vahal. Modal coupling in traveling-wave
resonators. Optics Letters, 27(19): 1669-1673, 2002.

106
[31] We note that such an offset must exist, since otherwise mechanical motion of the n
=1,2 modes causes modulation of the path length at the frequency Ω2 (i.e., frequency
doubling), which is not observed in experiments.
[32] V. B. Braginsky, M. L. Gorodetsky, and V. S. Ilchenko. Quality-factor and nonlinear
properties of optical whispering-gallery modes,” Physics Letters A, 137(7-8): 393-
397, 1989.
[33] V. B. Braginsky, M. L. Gorodetsky, V. S. Ilchenko, and S. P. Vyatchanin. On the
ultimate sensitivity in coordinate measurements. Physics Letters A, 179(4-5): 244-
248, 1993.
[34] M. Zalalutdinov, et al. Autoparametric optical drive for micromechanical oscillators.
Applied Physics Letters, 79(5): 695-697, 2001.
[35] C. H. Metzger, and K. Karrai. Cavity cooling of a microlever. Nature, 432(7020):
1002-1005, 2004.
[36] H. Rokhsari, S. M. Spillane, and K. J. Vahala. Observation of Kerr nonlinearity in
microcavities at room temperature. Optics Letters, 30(4): 427-429, 2005.
[37] V. S. Ilchenko, and M. L. Gorodetsky. Thermal nonlinear effects in optical
whispering gallery microresonators. Laser Physics, 2: 1004-1009, 1992.
[38] S. M. Spillane, T. J. Kippenberg, and K. J. Vahala. Ultralow-threshold Raman laser
using a spherical dielectric microcavity. Nature, 415(6872): 621-623, 2002.
[39] T. J. Kippenberg, S. M. Spillane, B. K. Min, and K. J. Vahala. Theoretical and
experimental study of stimulated and cascaded Raman scattering in ultrahigh-Q
optical microcavities. IEEE Journal of Selected Topics in Quantum Electronics,
10(5): 1219-1228, 2004.

107
[40] T. J. Kippenberg, S. M. Spillane, and K. J. Vahala. Kerr-nonlinearity optical
parametric oscillation in an ultrahigh-Q toroid microcavity. Physical Review Letters,
93(8): 083904, 2004.
[41] L. Yang, D. K. Armani, and K. J. Vahala. Fiber-coupled Erbium microlasers on a
chip. Applied Physics Letters, 83(5): 825-826, 2003.
[42] The spring constant of a structure is proportional to its cross section area divided by
its length and hence spring constant decreases with size.
[43] X. M. H. Huang, C. A. Zorman, M. Mehregany, and M. L. Roukes. Nanodevice
motion at microwave frequencies. Nature, 421(6922): 496-496, 2003.
[44] H. G. Craighead. Nanoelectromechancial systems. Science, 290(5496): 1532-1535,
2000.
[45] A. N. Cleland and M. L. Roukes. A nanometer-scale mechanical electrometer.
Nature, 392(6672): 160-162, 1998.
[46] D. Rugar, R. Budakian, H. J. Mamin, and B.W. Chui. Aingle spin detection by
magnetic resonance force microscopy. Nature, 430(6997): 329-332, 2004.
[47] B. Ilic, Y. Yang, and H. G. Craighead. Virus detection using nanoelectromechanical
devices. Applied Physics Letters, 85(13):, 2604-2606, 2004.

108
Chapter Six
Summary
This thesis has investigated different optical and optomechanical systems based on
whispering-gallery microcavities. An almost ideal design is developed for optical power
transfer between two waveguides where efficiency is solely limited by intrinsic losses of
the intermediate optical resonator. These intrinsic loss mechanisms are experimentally
studied and differentiated by a powerful technique based on thermal nonlinearities of the
microcavity material. Important information about the interaction between cavity surface
and the ambient environment has been obtained through this study. Taking advantage of
slow response time of thermal effects, a clever pump and probe technique is developed to
unveil Kerr nonlinearities of the microcavity material in presence of dominant thermal
effects. Kerr nonlinearity in microcavities is observed and measured for the first time at
room temperatures. The technique also enables accurate measurements of thermal
response times in microcavity structures. A journey is also embarked on in an almost
untouched territory in the field of optical microcavities. A novel type of nonlinearity
generated by mutual coupling of optical and mechanical modes of a microcavity structure
is discovered and analyzed theoretically and experimentally. The ramifications of the
optomechanical interaction and applications of the so-called “radiation-pressure-driven
micromechanical oscillator” are discussed in diverse fields of science ranging from
quantum mechanics to LIGO project to all-optical clocks on a chip.

109
Around The Rim: elegy to a photonic clock PUMP POWER vibrates steadily, pumped 80 million times per second when its rim probed steadily above threshold exceeds vibrations, saturates at high pump powers sensitive power detection exerts radiation pressure pressure in much the same way fully quench upon probe contact the disk itself swells manipulated a probe-controlled micropositioner---insertion---loss communication fidelity signal amplitude around the rim rim swells, inflated then deflates cycle repeats, repeats, repetition continues forcing function frequency pumped into into the disk, thermally actuated harmonics were observed shift in the whispering gallery repetitive processes---cavities susceptible to these oscillations integrate interactions of motion motion a t a quantum level, entanglement proposed continuous flame hating up/down shifted and stretching an overall loaded factor high-finesse cavities loaded sensitivity is boosted circuits integrated could be of help, coupling allows separation always exciting---stress field around the rim a mechanism to investigate such interactions a mechanism that needs to be understood better Robin Diamond

110