Embed Size (px)
Citation preview
Chapter PH
SHERIDAN COALFIELD, POWDER RIVER BASIN:
GEOLOGY, COAL QUALITY, AND COAL RESOURCES
By M.S. Ellis,1 R.M. Flores,1 A.M. Ochs,2 G.D. Stricker,1 G.L. Gunther,2
G.S. Rossi,1 L.R. Bader,1 J.H. Schuenemeyer,1 and
H.C. Power3
in U.S. Geological Survey Professional Paper 1625-A
1U.S. Geological Survey2Consultant, U.S. Geological Survey, Denver, Colorado3University of Delaware, Newark, Delaware
PH-ii
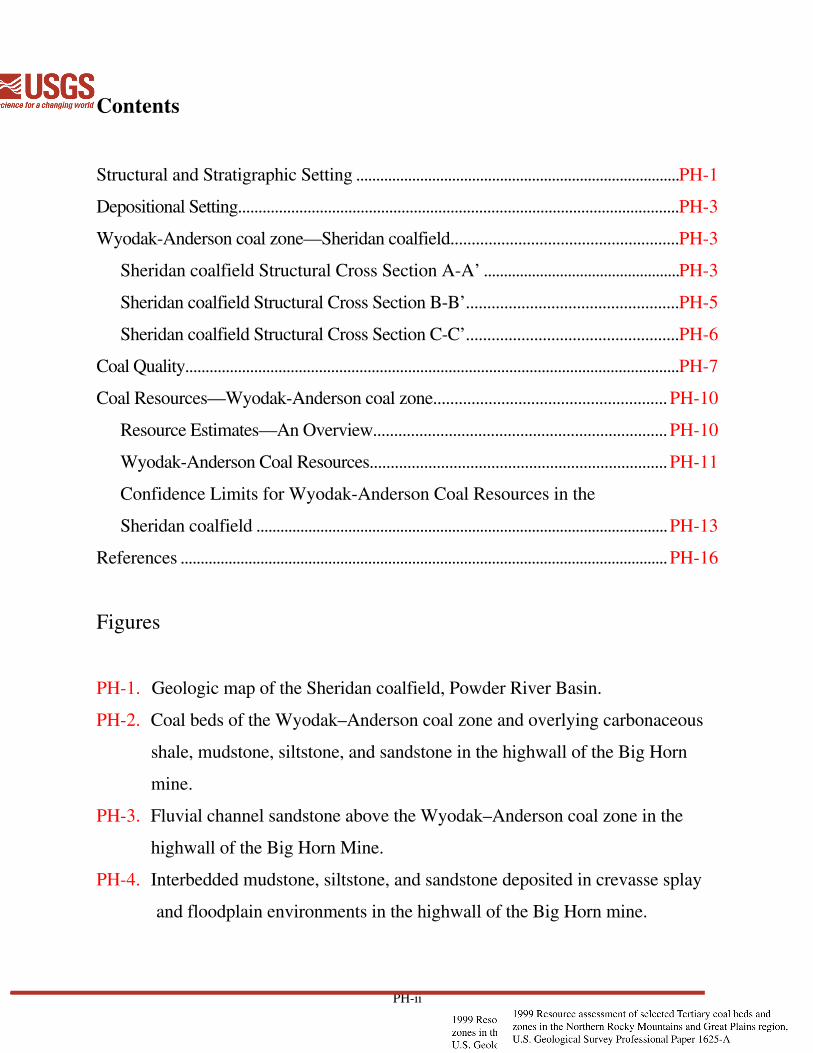
Contents
Structural and Stratigraphic Setting .................................................................................PH-1
Depositional Setting............................................................................................................PH-3
Wyodak-Anderson coal zone—Sheridan coalfield......................................................PH-3
Sheridan coalfield Structural Cross Section A-A’ .................................................PH-3
Sheridan coalfield Structural Cross Section B-B’..................................................PH-5
Sheridan coalfield Structural Cross Section C-C’..................................................PH-6
Coal Quality..........................................................................................................................PH-7
Coal Resources—Wyodak-Anderson coal zone.......................................................PH-10
Resource Estimates—An Overview......................................................................PH-10
Wyodak-Anderson Coal Resources.......................................................................PH-11
Confidence Limits for Wyodak-Anderson Coal Resources in the
Sheridan coalfield .......................................................................................................PH-13
References ..........................................................................................................................PH-16
Figures
PH-1. Geologic map of the Sheridan coalfield, Powder River Basin.
PH-2. Coal beds of the Wyodak–Anderson coal zone and overlying carbonaceous
shale, mudstone, siltstone, and sandstone in the highwall of the Big Horn
mine.
PH-3. Fluvial channel sandstone above the Wyodak–Anderson coal zone in the
highwall of the Big Horn Mine.
PH-4. Interbedded mudstone, siltstone, and sandstone deposited in crevasse splay
and floodplain environments in the highwall of the Big Horn mine.
PH-iii
Figures—continued
PH-5. The Wyodak-Anderson coal zone consisting of the Dietz and Monarch coal
beds in the highwall of the Big Horn mine.
PH-6. Index map showing locations of Sheridan coalfield cross sections and
mines.
PH-7. Sheridan coalfield structural cross section A-A’.
PH-8. Sheridan coalfield structural cross section B-B’.
PH-9. Sheridan coalfield structural cross section C-C’.
PH-10. Index map showing coal quality data distribution in the Wyodak-Anderson
coal zone, Sheridan coalfield, Powder River Basin, Wyoming.
PH-11. Ash yield in the Wyodak-Anderson coal zone, Sheridan coalfield, Powder
River Basin, Wyoming.
PH-12. Sulfur content in the Wyodak-Anderson coal zone, Sheridan coalfield,
Powder River Basin, Wyoming.
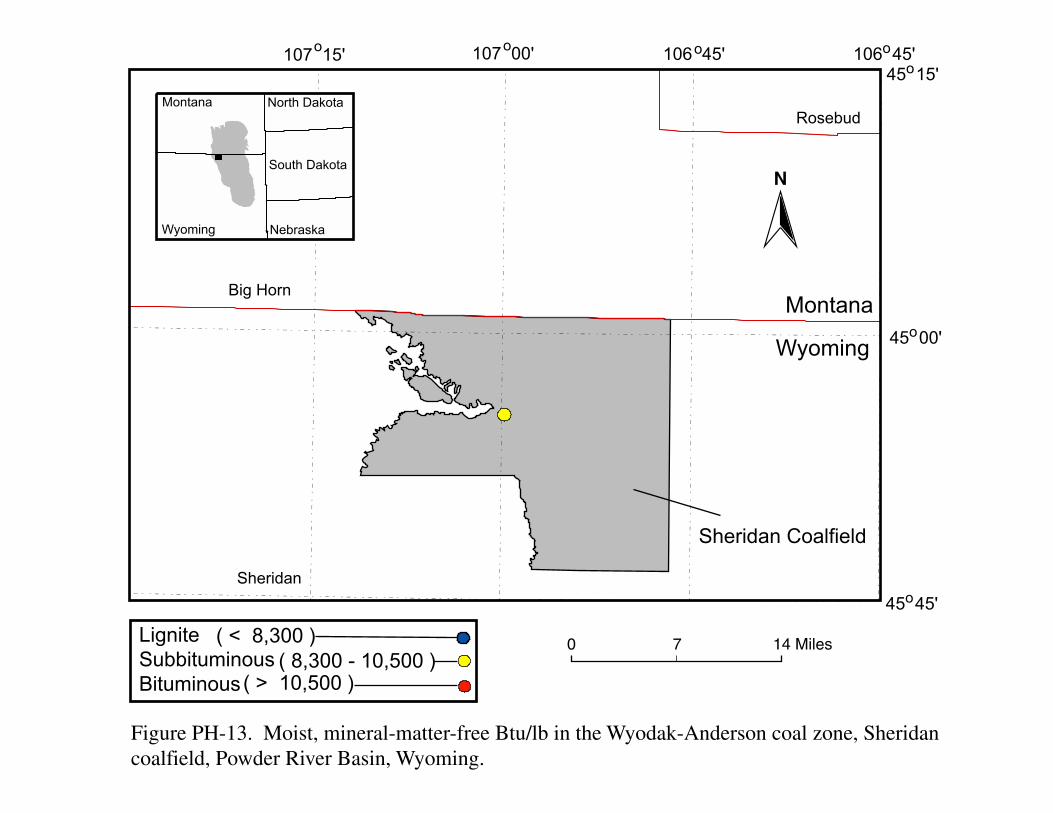
PH-13. Moist, mineral-matter-free Btu/lb in the Wyodak-Anderson coal zone,
Sheridan coalfield, Powder River Basin, Wyoming.
PH-14. Pounds of sulfur dioxide per million Btu in the Wyodak-Anderson coal
zone, Sheridan coalfield, Powder River Basin, Wyoming.
PH-15. Antimony concentration in the Wyodak-Anderson coal zone, Sheridan
coalfield, Powder River Basin, Wyoming.
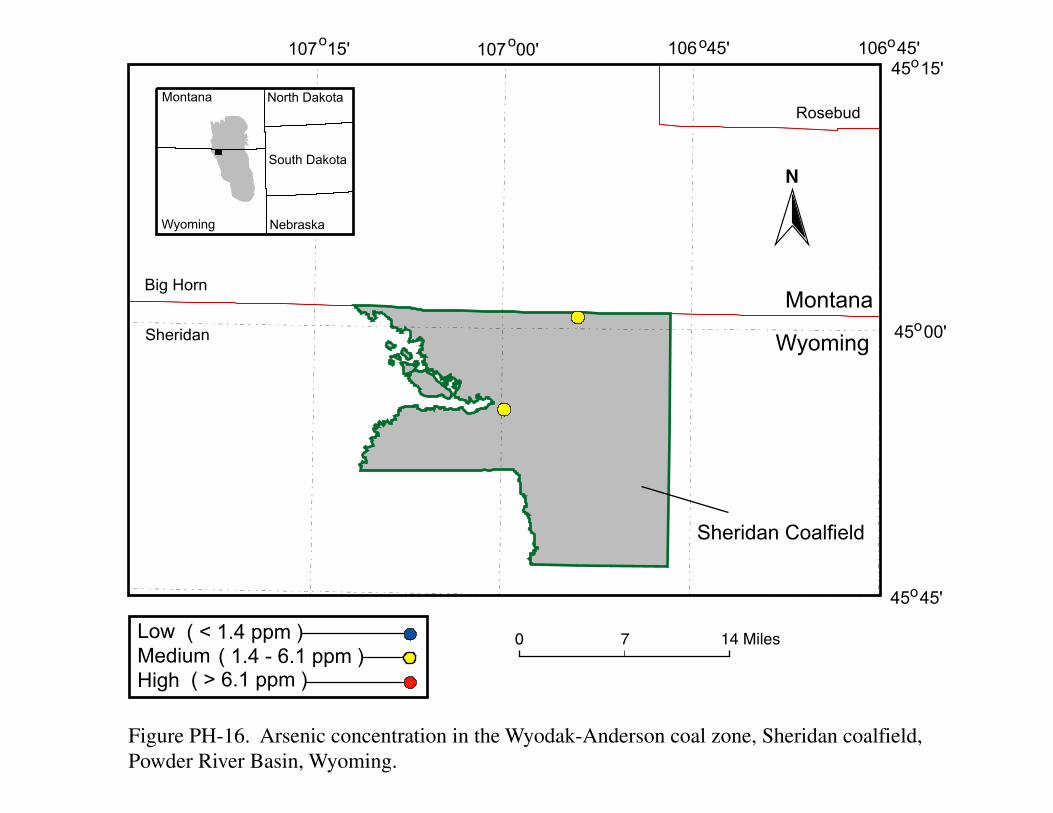
PH-16. Arsenic concentration in the Wyodak-Anderson coal zone, Sheridan
coalfield, Powder River Basin, Wyoming.
PH-17. Beryllium concentration in the Wyodak-Anderson coal zone, Sheridan
coalfield, Powder River Basin, Wyoming.
PH-18. Cadmium concentration in the Wyodak-Anderson coal zone, Sheridan
coalfield, Powder River Basin, Wyoming.
PH-iv
Figures—continued
PH-19. Chromium concentration in the Wyodak-Anderson coal zone, Sheridan
coalfield, Powder River Basin, Wyoming.
PH-20. Cobalt concentration in the Wyodak-Anderson coal zone, Sheridan
coalfield, Powder River Basin, Wyoming.
PH-21. Lead concentration in the Wyodak-Anderson coal zone, Sheridan coalfield,
Powder River Basin, Wyoming.
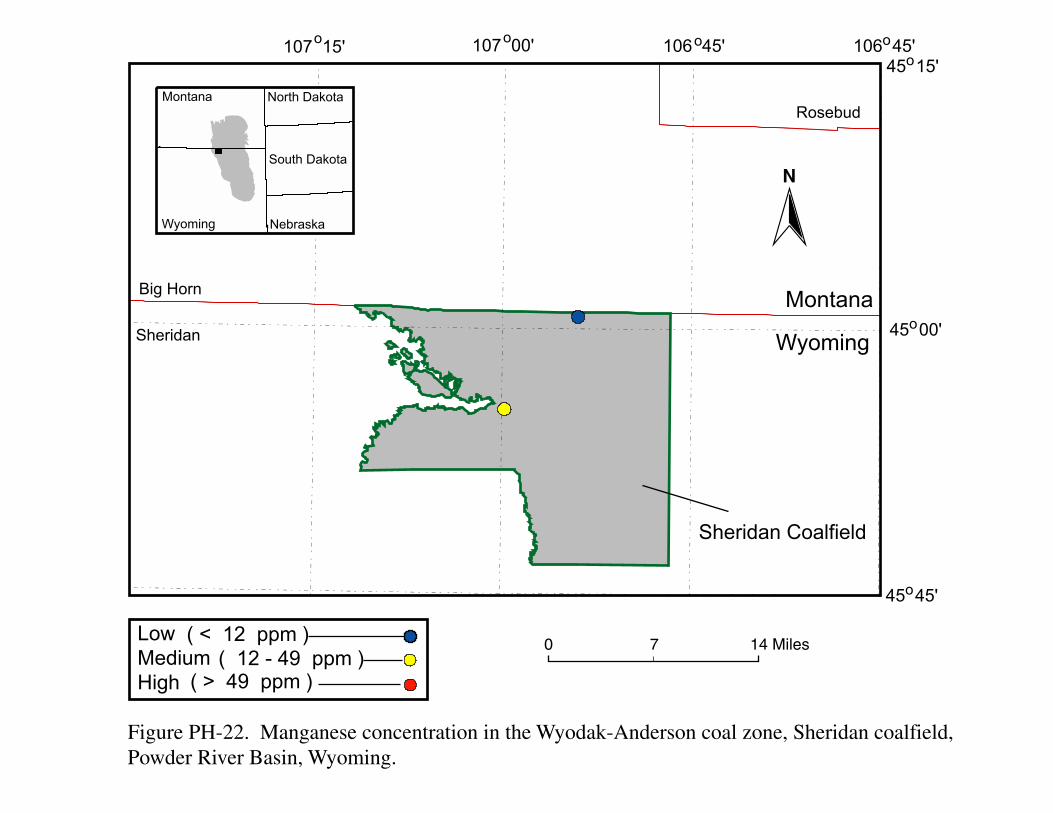
PH-22. Manganese concentration in the Wyodak-Anderson coal zone, Sheridan
coalfield, Powder River Basin, Wyoming.
PH-23. Mercury concentration in the Wyodak-Anderson coal zone, Sheridan
coalfield, Powder River Basin, Wyoming.
PH-24. Nickel concentration in the Wyodak-Anderson coal zone, Sheridan
coalfield, Powder River Basin, Wyoming.
PH-25. Selenium concentration in the Wyodak-Anderson coal zone, Sheridan
coalfield, Powder River Basin, Wyoming.
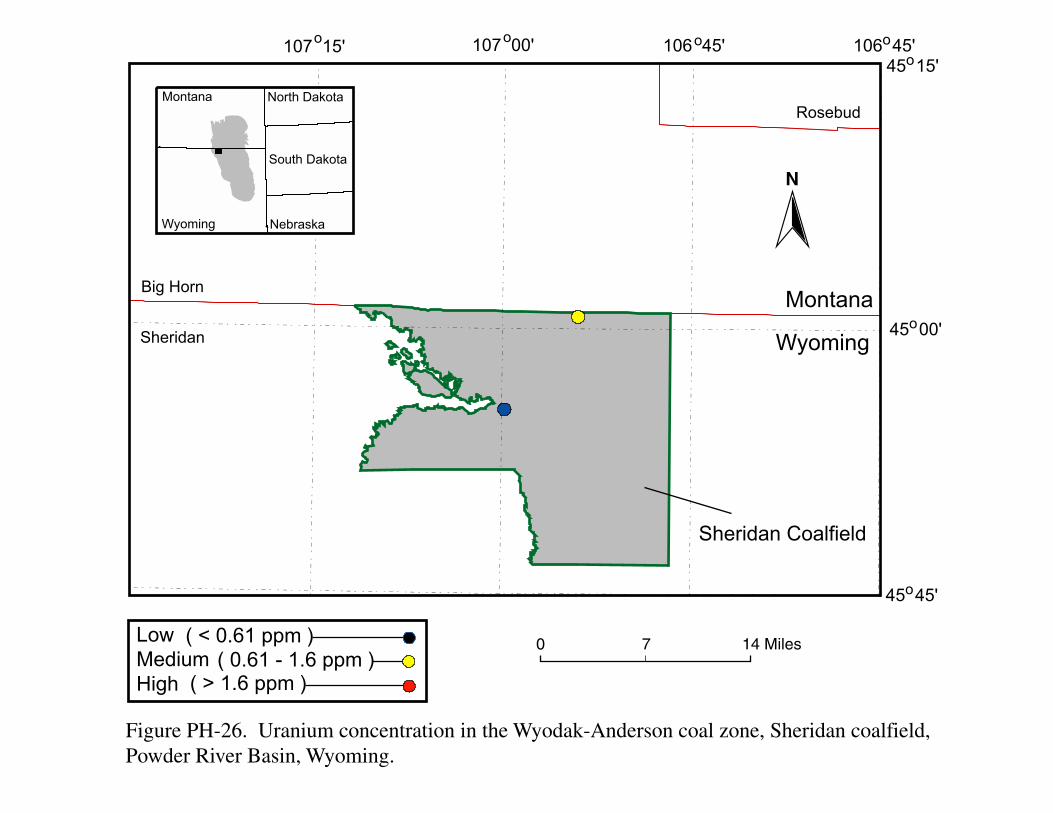
PH-26. Uranium concentration in the Wyodak-Anderson coal zone, Sheridan
coalfield, Powder River Basin, Wyoming.
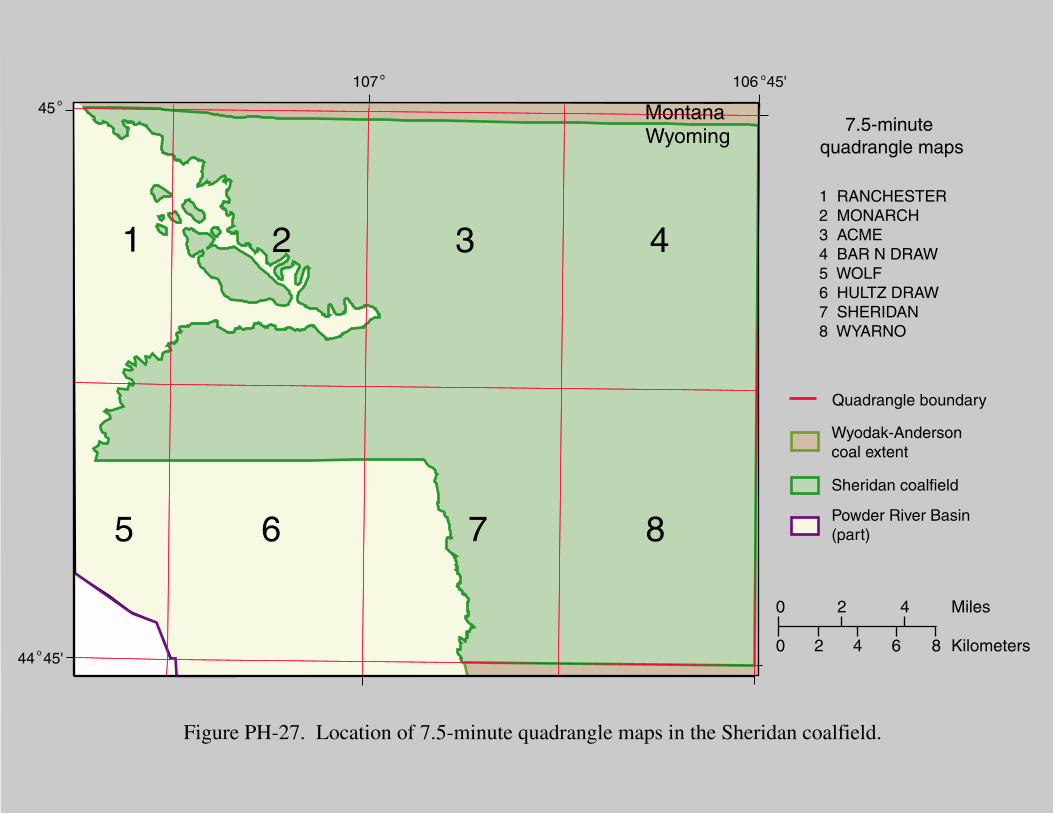
PH-27. Location of 7.5-minute quadrangle maps in the Sheridan coalfield.
PH-28. Federal coal and Federal surface ownership in the Sheridan coalfield.
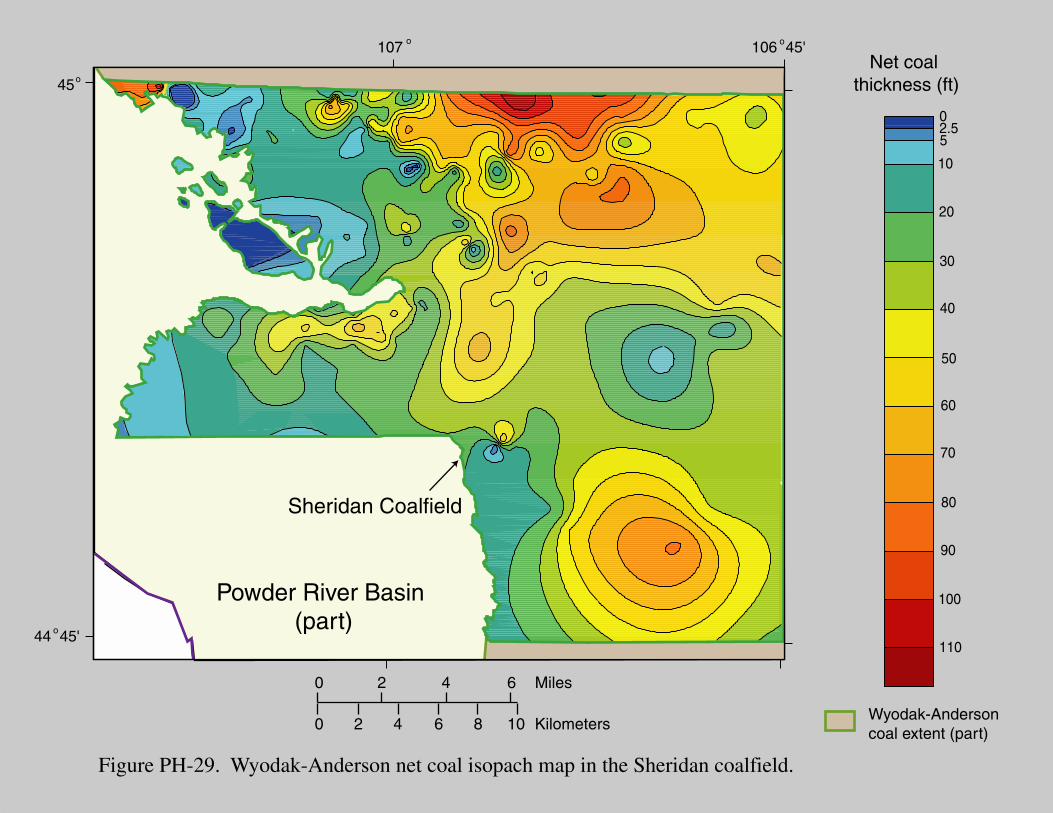
PH-29. Wyodak-Anderson net coal isopach map in the Sheridan coalfield.
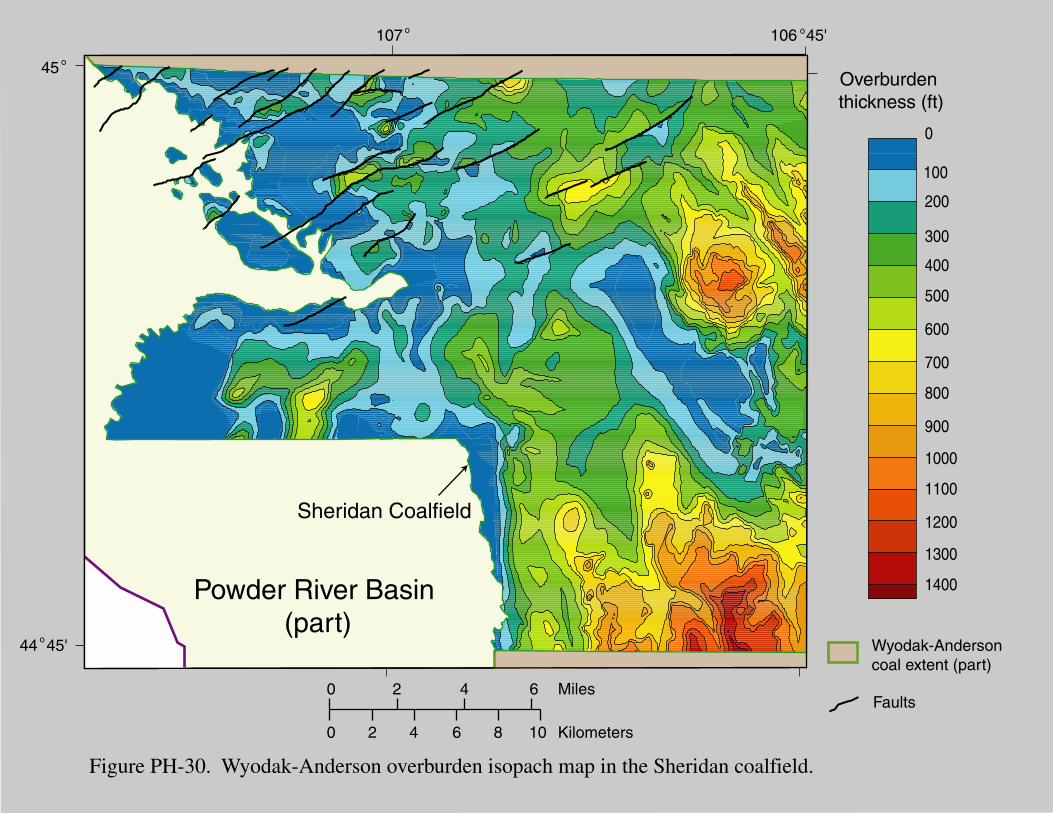
PH-30. Wyodak-Anderson overburden isopach map in the Sheridan coalfield.
PH-31. Wyodak-Anderson mine and lease areas, clinker, and resource area in the
Sheridan coalfield.

PH-v
Tables
PH-1. Summary data for Wyodak-Anderson coal zone in the Sheridan coalfield,
Powder River Basin, Wyoming
PH-2. Wyodak-Anderson coal resources in the Sheridan coalfield, Sheridan
County, Wyoming, reported by overburden thickness, net coal thickness, and
reliability categories
PH-3. Wyodak-Anderson coal resources in the Sheridan coalfield, Sheridan
County, Wyoming reported by Federal coal and Federal surface ownership
PH-4. Wyodak-Anderson coal resources in the Sheridan coalfield, Sheridan
County, Wyoming reported by 7.5-minute quadrangle map area
PH-5. Data used for computation of confidence intervals within reliability
categories for the Wyodak-Anderson coal zone in the Sheridan coalfield,
Powder River Basin, Wyoming
PH-6. Estimates of uncertainty (calculated with measurement error) for Wyodak-
Anderson coal resources in the Sheridan coalfield, Powder River Basin,
Wyoming

PH-1
STRUCTURAL AND STRATIGRAPHIC SETTING
The Sheridan coalfield contains the Fort Union Formation (Paleocene) that includes,
from bottom to top, the Tullock, Lebo, and Tongue River Members (fig. PH-1).
These members are mainly distributed in the western part of the coalfield (see fig.
PH-1; Barnum, 1974, 1975; Ebaugh, 1976; Kanizay, 1978; Law and others, 1979).
The Eocene Wasatch Formation, which conformably overlies the Fort Union
Formation, is distributed in the easternmost part of the coalfield (see fig. PH-1;
Culbertson, 1975; Culbertson and Mapel, 1976). Undifferentiated Fort Union
Formation is in the southwestern part of the coalfield. The contact between these
formations is not delineated in the subsurface because they have basically the same
lithology and are difficult to correlate. However, the surface contact between the
Wasatch and Fort Union Formations is placed at the top of the Roland coal bed,
following Baker (1929). These rocks dip 1-3 degrees eastward.
The Sheridan coalfield boundary approximately follows the area defined by Taff
(1909), who investigated the mining areas in the Fort Union Formation north and
northwest of Sheridan, and mapped Wasatch coal east of Sheridan. In this study, the
Sheridan coalfield (see fig. PH-1) is delineated by the surface contact line of the
Lebo and Tongue River Members on the west, the surface contact line of the
undifferentiated Fort Union and Tongue River Members on the south, the 106-
degree, 45-minute longitude line on the east, and the Wyoming and Montana State
line on the north.
The coal beds of the Wyodak-Anderson coal zone of the Tongue River Member of
the Fort Union Formation are mined in the Sheridan coalfield and are locally named,

PH-2
from top to bottom, Dietz 2, Dietz 3, and Monarch (Canyon) coal beds (Law and
others, 1979). These coal beds, including the Carney coal (more than 20 ft below
the Monarch or Canyon coal), were extensively mined by underground methods
(Taff, 1909; Dunrud and Osterwald, 1980).
These coal beds merge, split, or pinch out into mudstone, siltstone, and sandstone.
These rocks are undifferentiated in the cross sections. The Fort Union rocks are
displaced by numerous northeast-southwest-trending normal faults.
The coal beds are interbedded with carbonaceous shale, mudstone, siltstone, and
sandstone as seen in the highwalls of the Big Horn coal mine (figs. PH-1 and PH-
2). Here, the sandstone is fining-upward, shows an erosional base, and contains
trough crossbeds that indicate a fluvial channel deposit (fig. PH-3). The sandstone
is interbedded with, and laterally grades into, a tabular, rippled silty sandstone,
which in turn is interbedded with mudstone and siltstone; these rocks are crevasse
splay and floodplain deposits (fig. PH-4). The fluvial deposits are interbedded with
the Dietz and Monarch (Canyon) coal beds (fig. PH-5) that accumulated in raised
swamps and total as much as 54 ft in thickness.
The Wyodak-Anderson coal zone of the Tongue River Member is in the west-
northwest part of the Sheridan coalfield near the city of Sheridan, Wyoming.
Clinker, resulting from burned coal and related rocks of this zone, is well developed
northwest of Sheridan (Kanizay, 1978).
The Anderson, Dietz, and Canyon (Monarch) coal beds of the Wyodak-Anderson
coal zone were mined from 20 underground mines from 1894 to 1976 (Dunrud and

PH-3
Osterwald, 1980). Surface subsidence pits and troughs mark locations of these
abandoned underground mine workings.
These coal beds were strip mined in the Big Horn mine (see fig. PH-1) from 1962
to present. Annual mine production from 1989 to 1997 has declined from 106,000
to 43,000 short tons (Resource Data International, Inc., 1998).
DEPOSITIONAL SETTING
The stratigraphic variation, thickness, distribution, and shape of the Wyodak-
Anderson coal zone (see cross sections; fig. PH-6) reflect its deposition in raised
mires formed in meandering and anastomosed fluvial systems.
WYODAK-ANDERSON COAL ZONE—SHERIDAN COALFIELD
SHERIDAN COALFIELD STRUCTURAL CROSS SECTION A-A’
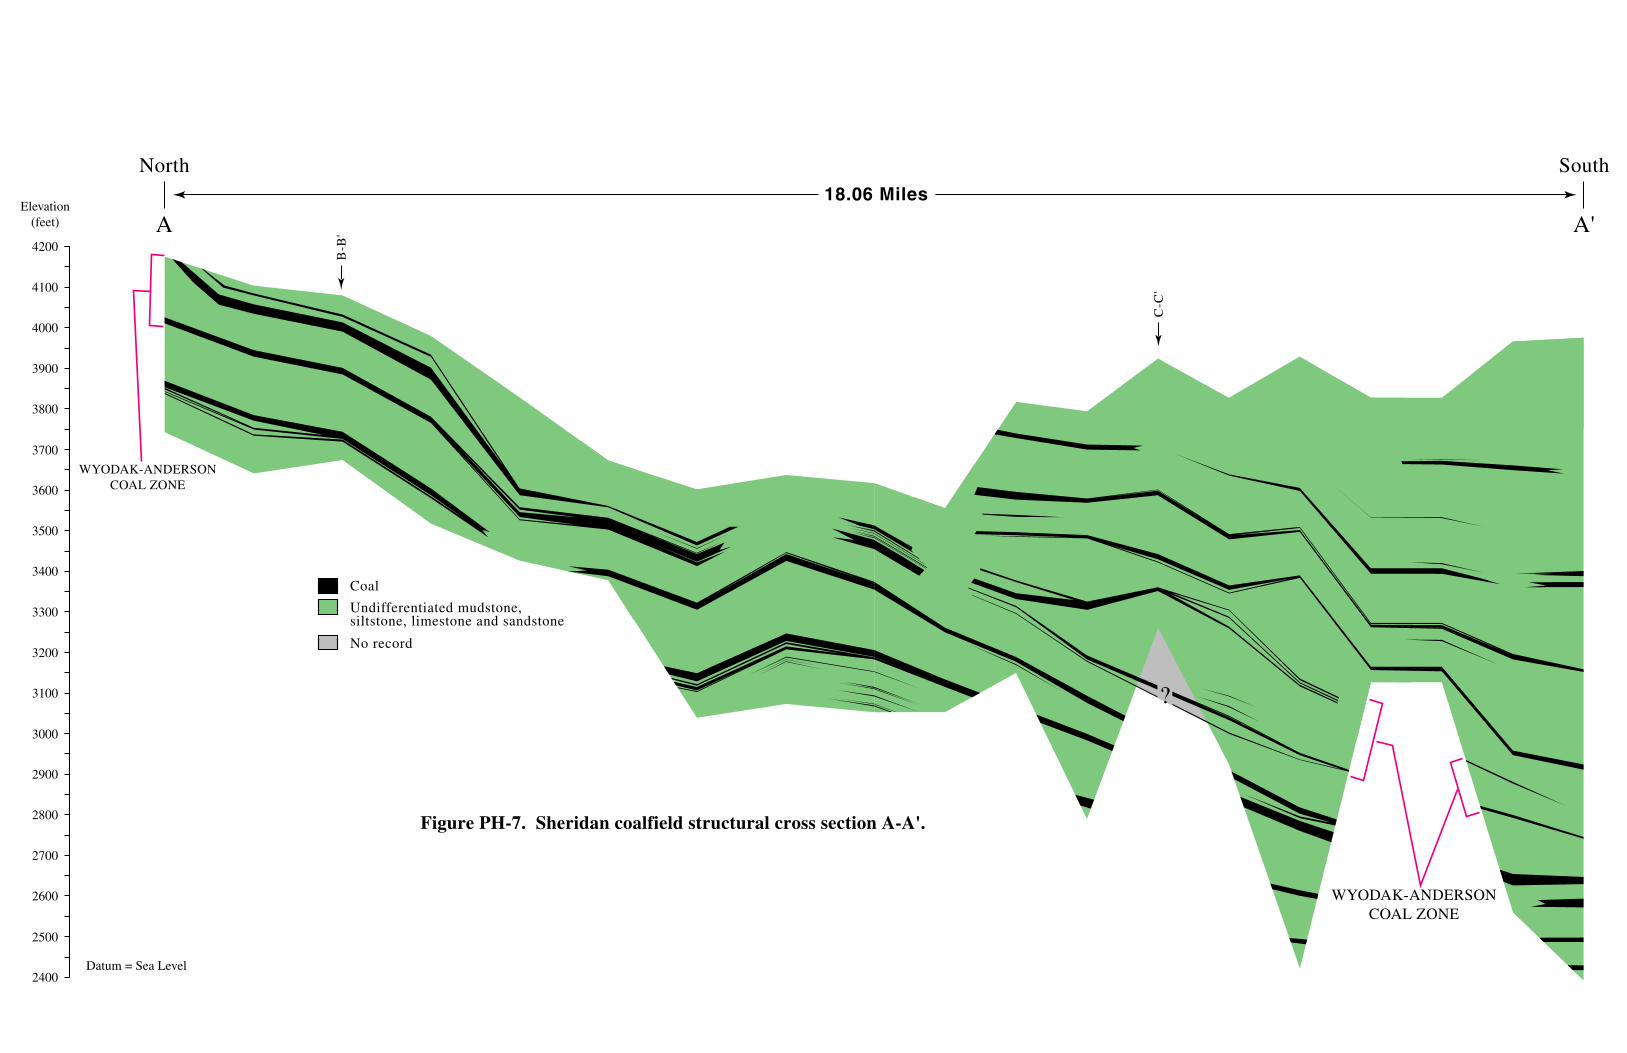
• The north-south oriented structural cross section A-A’ (fig. PH-7) is more than
18 mi long. The Wyodak-Anderson coal zone, which is 300-ft thick, shows
merging and splitting of as many as five coal beds. The coal beds dip south-
southeast. This cross section was drawn using data from 19 drill holes, which
are not labeled on the cross section.
• The coal beds of the Wyodak-Anderson coal zone are interbedded with, and split
by, undifferentiated mudstone, siltstone, and sandstone (shown in green) that
were deposited in floodplains, crevasse splays, and fluvial channels.
PH-4
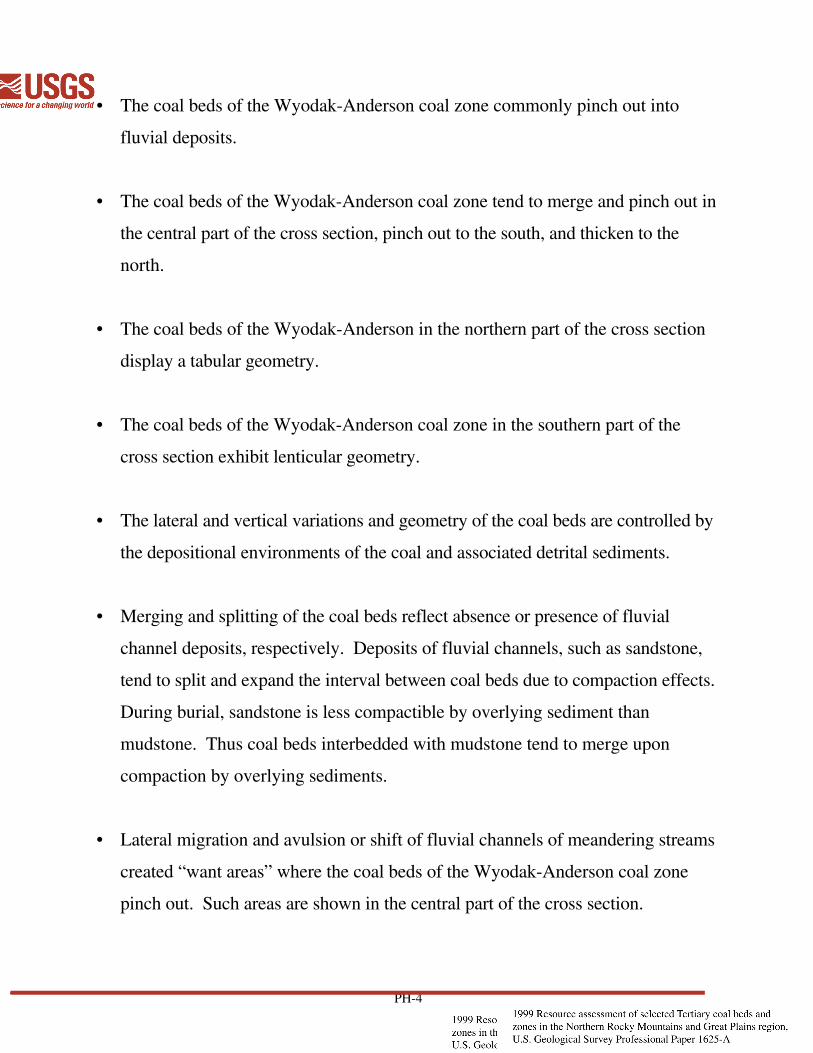
• The coal beds of the Wyodak-Anderson coal zone commonly pinch out into
fluvial deposits.
• The coal beds of the Wyodak-Anderson coal zone tend to merge and pinch out in
the central part of the cross section, pinch out to the south, and thicken to the
north.
• The coal beds of the Wyodak-Anderson in the northern part of the cross section
display a tabular geometry.
• The coal beds of the Wyodak-Anderson coal zone in the southern part of the
cross section exhibit lenticular geometry.
• The lateral and vertical variations and geometry of the coal beds are controlled by
the depositional environments of the coal and associated detrital sediments.
• Merging and splitting of the coal beds reflect absence or presence of fluvial
channel deposits, respectively. Deposits of fluvial channels, such as sandstone,
tend to split and expand the interval between coal beds due to compaction effects.
During burial, sandstone is less compactible by overlying sediment than
mudstone. Thus coal beds interbedded with mudstone tend to merge upon
compaction by overlying sediments.
• Lateral migration and avulsion or shift of fluvial channels of meandering streams
created “want areas” where the coal beds of the Wyodak-Anderson coal zone
pinch out. Such areas are shown in the central part of the cross section.
PH-5
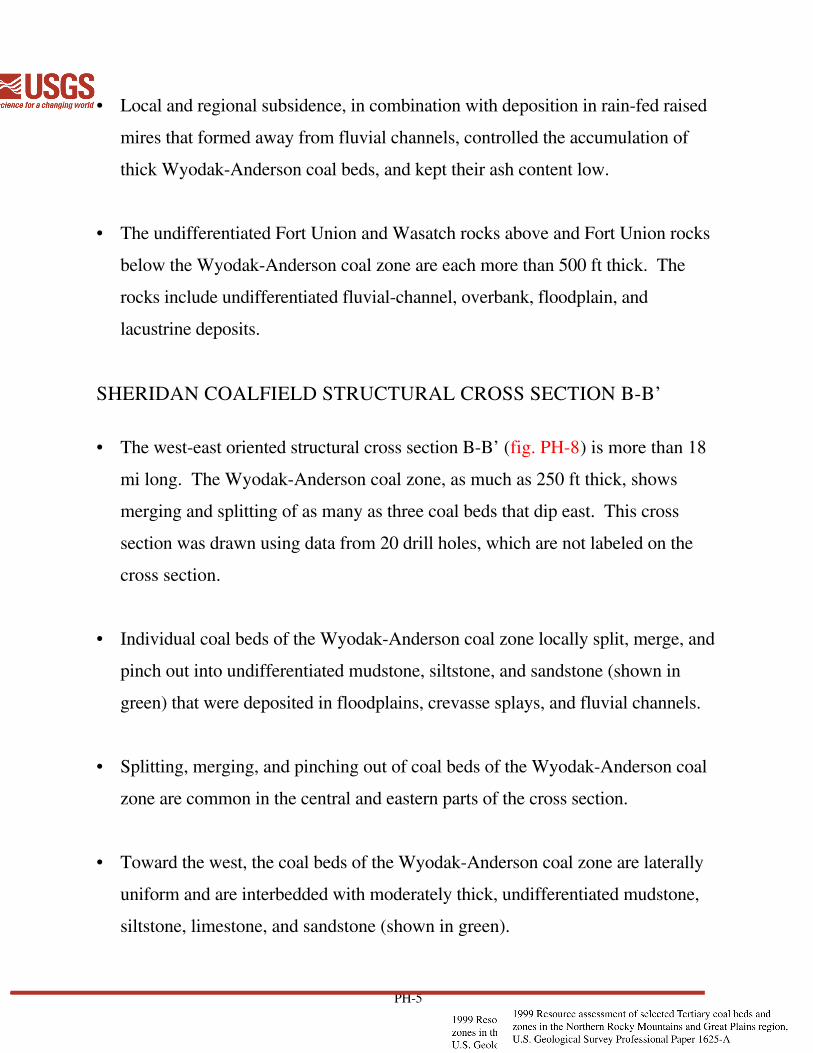
• Local and regional subsidence, in combination with deposition in rain-fed raised
mires that formed away from fluvial channels, controlled the accumulation of
thick Wyodak-Anderson coal beds, and kept their ash content low.
• The undifferentiated Fort Union and Wasatch rocks above and Fort Union rocks
below the Wyodak-Anderson coal zone are each more than 500 ft thick. The
rocks include undifferentiated fluvial-channel, overbank, floodplain, and
lacustrine deposits.
SHERIDAN COALFIELD STRUCTURAL CROSS SECTION B-B’
• The west-east oriented structural cross section B-B’ (fig. PH-8) is more than 18
mi long. The Wyodak-Anderson coal zone, as much as 250 ft thick, shows
merging and splitting of as many as three coal beds that dip east. This cross
section was drawn using data from 20 drill holes, which are not labeled on the
cross section.
• Individual coal beds of the Wyodak-Anderson coal zone locally split, merge, and
pinch out into undifferentiated mudstone, siltstone, and sandstone (shown in
green) that were deposited in floodplains, crevasse splays, and fluvial channels.
• Splitting, merging, and pinching out of coal beds of the Wyodak-Anderson coal
zone are common in the central and eastern parts of the cross section.
• Toward the west, the coal beds of the Wyodak-Anderson coal zone are laterally
uniform and are interbedded with moderately thick, undifferentiated mudstone,
siltstone, limestone, and sandstone (shown in green).

PH-6
• The coal beds and the Wyodak-Anderson coal zone are uniformly thick from
west to east. This indicates the absence of major fluvial-channel deposits that
would disrupt and expand the interval.
• The lateral and vertical variations and geometry of the coal beds are controlled by
the depositional environments of the coal and associated detrital sediments.
• The uniform distribution of the coal beds and coal zone suggests that precursor
peat accumulated on interchannel raised mires, which probably occupied
abandoned fluvial-channel and floodplain deposits.
• The undifferentiated Fort Union and Wasatch rocks above and Fort Union rocks
below the Wyodak-Anderson coal zone are as much as 600 ft thick and more
than 400 ft thick, respectively. The intervals are composed of undifferentiated
fluvial-channel sandstone and overbank, floodplain, lacustrine mudstone, and
siltstone.
SHERIDAN COALFIELD STRUCTURAL CROSS SECTION C-C’
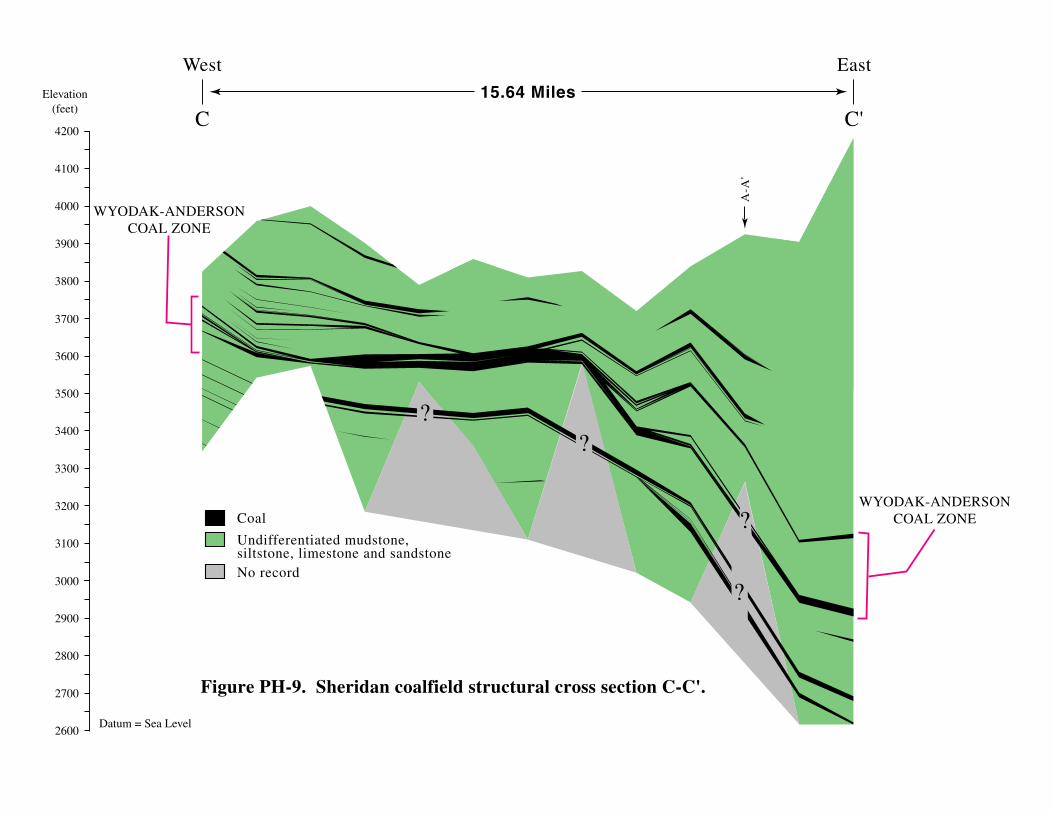
• The west-east oriented structural cross section C-C’ (fig. PH-9) is more than 15
mi long. The Wyodak-Anderson coal zone, as much as 250 ft thick, contains
merging and splitting coal beds that dip eastward. This cross section was drawn
using data from 13 drill holes, which are not labeled on the cross section.
• The coal beds merge in the central part of the cross section to form a bed about
50 ft thick.

PH-7
• Toward the west and east, the coal beds of the Wyodak-Anderson coal zone are
interbedded with and split by undifferentiated mudstone, siltstone, and sandstone
(shown in green) that was deposited in floodplains and floodplain lakes, fluvial
channels, and crevasse splays.
• The coal beds of the Wyodak-Anderson coal zone thin and pinch out toward the
west, suggesting the extent of the raised mire in which the coal formed.
• The peat probably accumulated in an interchannel raised mire flanked by fluvial
channels and/or crevasse splays. The thickening of detrital sediments associated
with the split and pinched out coal beds may represent levee, overbank, or
crevasse deposits that periodically intruded the adjoining mire.
• The undifferentiated Fort Union and Wasatch rocks above and Fort Union rocks
below the Wyodak-Anderson coal zone are as much as 1,100 ft thick and more
than 450 ft thick, respectively. The rocks consist of interbedded fluvial-channel
sandstone, and overbank, floodplain, and lacustrine mudstone.
COAL QUALITY
Actively mined coal in the Sheridan coalfield, Powder River Basin, Wyoming is
considered to be a “clean coal.” Coal from the Sheridan coalfield is developed from
one mine and utilized for electric power generation. The coal is a low-contaminant,
compliant, subbituminous coal resource.
The Sheridan coalfield has one assessment unit, the Wyodak-Anderson coal zone.
This coal zone has the following arithmetic mean values (on an as-received basis)
PH-8
for coal that is not presently being mined or under lease to be mined in the future:
moisture–20.40%, ash yield–5.30%, total sulfur–0.70%, calorific value–9,540
(Btu/lb), lb SO2 per million Btu–1.48, and moist, mineral-matter-free
Btu–10,120. Arithmetic mean concentration (in parts per million and on whole-coal
and remnant-moisture basis) of elements of environmental concern for the Wyodak-
Anderson coal zone are: antimony–0.24, arsenic–3.2, beryllium–0.21,
cadmium–0.09, chromium–3.6, cobalt–1.2, lead–1.8, manganese–21,
mercury–0.08, nickel–4.8, selenium–0.45, and uranium–0.58. Table PH-1 is a
summary of coal quality in this coalfield.
Summary data for the 18 variables mentioned in the previous paragraph were
calculated for the Wyodak-Anderson coal zone. A common problem in statistical
summaries of trace-element data arises when element values are below the limits of
detection. This results in a censored distribution. To compute unbiased estimates of
censored data for the elements in this table, we adopted the protocol of reducing all
“less than” values by 50 percent to generate a real value for these data. Summary
statistics of range (minimum and maximum value) and arithmetic means were
generated using the modified data. Moisture values are reported on an as-received
basis (American Society for Testing and Materials, 1994b, designation D3180-89).
Because no equilibrium moisture values are available for this report, apparent ranks
can not reliably be determined.
Between 1974 and 1994, the U.S. Geological Survey analyzed samples of coal for
contents of major-, minor-, and trace-elements. Prior to performing the analyses,
most of the coal samples were dried at room temperature and humidity for as much
as 80 hours. However, some samples may have been dried only long enough to
allow grinding (to less than 100 mesh). Moisture content in the samples is
PH-9
unknown, although moisture contents were probably similar to that which would
remain after air-dry loss determination (American Society for Testing and Materials,
1994c, D3302-91). Since the actual moisture content of the samples analyzed
between 1974 and 1994 is unknown, the elemental analysis of the samples cannot
be converted to any other moisture basis. In addition, these analyses can only
provide an approximation of load factors (such as, pounds of mercury per trillion
Btu).
The locations of public data points used in the summary table are shown in figure
PH-10. When more than one analysis was available per location, the analytical
values were weight averaged on coal sample thickness. Figures PH-11 through PH-
26, show values of the variables listed in the summary table for coal in the Wyodak-
Anderson coal zone, except for calorific value and moisture content. For ash yield
(fig. PH-11) and total sulfur content (fig. PH-12), the values are coded to low,
medium, and high, following guidelines established in U.S. Geological Survey
Circular 891 (Wood and others, 1983). For moist, mineral-matter-free Btu
(apparent rank) (fig. PH-13), the apparent rank designations established by
American Society for Testing and Materials, (1994a), designation D388-92a were
utilized. For pounds of sulfur dioxide per million Btu (lbSO2) (fig. PH-14), values
are coded according to the U.S. Environmental Protection Agency’s Phase I (low),
Phase II (medium), and non-compliant (high) limits for sulfur emission from coal-
fired power plants (U.S. Environmental Protection Agency, 1996).
No guidelines have been established for the elements of environmental concern (also
referred to as “hazardous air pollutants” or “HAPs”). Analytical values for these
elements (fig. PS-15 to PS-26) are color keyed based on the following parameters:
(1) each element of environmental concern was ranked from the lowest to highest

PH-10
value for all data in the northern Rocky Mountains and Great Plains region; and (2)
quartiles were established for each element. Low represents those values that are
less than the .25 quartile (also known as the lower quartile or the 25 th percentile).
Medium represents those values that are within the .25 to .75 quartiles (two quartiles
representing 50 percent of the values or between the 25th to 75th percentile). High
represents those values that are in the upper .25 quartile (or greater than the 75th
percentile).
COAL RESOURCES—WYODAK-ANDERSON COAL ZONE
RESOURCE ESTIMATES—AN OVERVIEW
• Coal resources are calculated using the specific gravity of the coal calculated from
apparent coal rank, which is the weight of coal per unit volume, net coal
thickness, and areal extent of the coal.
• Resource tables for the Wyodak-Anderson coal zone in the Sheridan coalfield
include coal and overburden thickness categories from Wood and others (1983),
which are based on apparent coal rank. Additional categories have been added to
provide more detail in this area. Resources are also reported by Federal coal and
surface ownership, and 7.5-minute quadrangle.
• Following USGS published guidelines (Wood and others, 1983); coal resource
estimates are divided into measured, indicated, and inferred categories according
to relative abundance and reliability of data.
• Where data are widely spaced, a hypothetical resource is extrapolated.

PH-11
• Measured resources are tonnage estimates of coal in the coal zone within a radius
of 0.25 mi of a control point where the net thickness of coal is measured.
• Indicated resources are tonnage estimates of coal that is within a radius of 0.25-
0.75 mi of a control point where the net thickness of the coal is measured.
• Inferred resources are tonnage estimates of coal that is within a radius of 0.75-3
mi of a control point where the net thickness of the coal is measured.
• Hypothetical resources are tonnage estimates of coal that is beyond a radius of 3
mi of a control point where the net thickness of coal is measured.
• These resource categories assume a high to low degree of geologic certainty. A
statistical method, which measures levels of uncertainty (confidence limits) for
the Wyodak-Anderson resource estimates in the Sheridan coalfield, is also
included in this study.
• Resource estimates are reported in millions of short tons with two significant
figures.
WYODAK-ANDERSON COAL RESOURCES
The western extent (study limit) of the Wyodak-Anderson coal zone in the Sheridan
coalfield is based on the Wyodak-Anderson outcrop or the Tertiary/Cretaceous
contact from published maps by Baker (1929), Love and Christiansen (1985), and
Green and Drouillard (1994). The western study limit was generalized in some areas

PH-12
to include small areas of coal outside of the main boundary. The eastern boundary
was placed at the 106-degree, 45-minute longitude line; the southern boundary was
delineated by the 44-degree, 45-minute latitude line; and the northern boundary was
placed at the Montana/Wyoming state line. The total study area is 161,898 acres
(65,518 hectares) in size.
Wyodak-Anderson coal resources in the Powder River Basin of Wyoming and
Montana were calculated using several software packages and custom programs.
Details of the methodology used are given in Ellis and others (1999, in press).
To calculate the Wyodak-Anderson coal resources in the Sheridan coalfield we
compiled data in a StratiFact* (GRG Corporation, 1996) relational database. The
coal beds in the Wyodak-Anderson coal zone, including the Anderson, Dietz,
Canyon, and Monarch beds (see the explanation of coal bed nomenclature in chapter
PS of this CD-ROM), were correlated in the database. We used a custom program
to calculate the net coal thickness at each data point (drill hole or measured section)
location.
The net coal thickness and overburden were gridded, and isopach maps were
produced using EarthVision* (Dynamic Graphics, Inc., 1997) software. The grids
were made using an isopach grid option (special handling of 0 values and terminated
data) with a grid spacing of 200 x 200-meters.
The spatial parameters for querying the coal resources, for example 7.5-minute
quadrangle map area (fig. PH-27, U.S. Geological Survey National Mapping
Division unpublished data, undated), Federal coal and surface ownership (fig. PH-
28, Biewick and others, 1998), net coal thickness (fig. PH-29), and overburden

PH-13
categories (fig. PH-30)) were created on individual layers as ARC/INFO* (ESRI,
1998a) polygon coverages. The coverages were unioned to make one polygon
coverage with many attributes for each polygon. The polygons in the union
coverage were edited in ARC/INFO* and ArcView* (ESRI, 1998b).
Coal resources were calculated using the EarthVision* (EV) volumetrics tool,
which calculates tonnages in each polygon in the union coverage using the net coal
thickness grid, the area of each polygon, and a conversion factor of 1,770 short tons
per acre-ft for subbituminous rank coal (Wood and others, 1983). Data from the EV
volumetrics report and the union coverage polygon attribute table were combined in
Excel* (Microsoft, 1997) spreadsheet software. Data for polygons containing
Wyodak-Anderson clinker (fig. PH-31) (Kanizay, 1978), Wyodak-Anderson mine
or lease areas (fig. PH-31) (Dunrud and Osterwald, 1980), or areas of net coal less
than 2.5 ft in thickness were deleted from the data set. Lease areas may include
public and/or state leases in addition to Federal leases. Resource tables were created
using data from the remaining polygons (tables PH-1 through PH-3). The final
resource area (fig. PH-31) (area that met all coal resource criteria) was 149,662 acres
(60,566 hectares) in area.
*Commercial software package.
CONFIDENCE LIMITS FOR WYODAK-ANDERSON COALRESOURCES IN THE SHERIDAN COALFIELD
A confidence interval is a statistic designed to capture uncertainty associated with a
point value estimate. In this study we computed 90-percent confidence intervals on
the volume (total resource in millions of short tons) of coal in the Wyodak-
Anderson coal zone in the measured, indicated, inferred, and hypothetical categories.

PH-14
The three main potential sources of error that might bias the confidence intervals are
preferential sampling, measurement errors, and model fitting. The probabilistic
interpretation of a confidence interval is based upon a random sample, which does
not apply in this situation, because there is preferential sampling in those areas
deemed to be minable. Measurement error can be caused by an error in recording
the coal bed thickness or in the definition of coverage areas. Modeling fitting
variability and bias result from the choice of models and fitting procedures.
Confidence limits for coal resources of the Wyodak-Anderson coal zone in the
Sheridan coalfield were calculated by J.H. Schuenemeyer and H.C. Power
(University of Delaware). The data set that they used contained net coal
measurements from 193 locations. This data set only included locations that
contained Wyodak-Anderson coal (no 0 coal thickness values) and data that were
representative of the entire coal zone (no terminated holes)).
The confidence limits were derived through a complex series of steps. These steps
included modeling coal thickness trends and removing the coal thickness trends
using a nonparametric regression algorithm called loess (with span=0.5). Spatial
correlation, as determined from the semivariogram of residual thickness, was
negligible. Standard deviation of coal thickness was computed from residual
thickness. Differences in point densities were compensated for by calculating
sample size, called a pseudo n, within each reliability category and calculating the
variability of volume for each of the reliability categories. Volumes of Wyodak-
Anderson coal were then calculated at a 90-percent confidence interval with
measurement error. Some of the parameters used and results of the confidence
interval calculations are shown in tables PH-5 and PH-6. A detailed description of

PH-15
the methodology used is given in Schuenemeyer and Power (in press), and in Ellis
and others (1999; in press).

PH-16
REFERENCES
American Society for Testing and Materials, 1994a, Annual book of ASTM
Standards, Section 5, Petroleum products, lubricants and fossil fuels, vol.
05.05 Gaseous fuels; coal and coke; section D388-92a; Standard
Classification of Coal by Rank: American Society for Testing and Materials,
Philadelphia, Pennsylvania, p. 168-171.
1994b, Annual book of ASTM Standards, Section 5, Petroleum products, lubricants
and fossil fuels, vol. 05.05 Gaseous fuels; coal and coke; section D3180-89;
Standard Practice for Calculating Coal and Coke Analysis from As-
Determined to Different Bases: American Society for Testing and Materials,
Philadelphia, Pennsylvania, p. 318-320.
_____1994c, Annual book of ASTM Standards, Section 5, Petroleum products,
lubricants and fossil fuels, vol. 05.05 Gaseous fuels; coal and coke; section
D3302-91; Standard Test Method for Total Moisture in Coal: American
Society for Testing and Materials, Philadelphia, Pennsylvania, p. 330-336.
Baker, A.A., 1929, The northward extension of the Sheridan coal field, Big Horn
and Rosebud Counties, Montana: U.S. Geological Survey Bulletin 806-B, p.
15-67.
Barnum, B.E., 1974, Preliminary geologic map and coal resources of the
Ranchester quadrangle, Sheridan County, Wyoming, and Big Horn County,
Montana: U.S. Geological Survey Open-File Report 74-35, 4 p., 2 sheets.
_____1975, Geologic map and coal resources of the Ranchester quadrangle,
Sheridan County, Wyoming, and Big Horn County, Montana: U.S.
Geological Survey Coal Investigations Series Map C-75, scale 1:24,000.
Biewick, Laura R.H., Urbanowski, Shayne R., Cain, Sheila, and Neasloney, Larry,
1998, Land status and Federal mineral ownership in the Powder River Basin,

PH-17
Wyoming and Montana: a digital data set for geographic information
systems: U.S. Geological Survey Open-File Report 98-108, coverage scale
1:100,000.
Bragg, L.J., Oman, J.K., Tewalt, S.J., Oman, C.L., Rega, N.H., Washington, P.M.,
and Finkleman, R.B, 1994, U.S. Geological Survey Coal Quality (Coalqual)
Database: Version 1.3: U.S. Geological Survey Open-File Report 94-205,
CD-ROM.
Culbertson, W.C., 1975, Preliminary geologic map and coal sections of the Wyarno
quadrangle, Sheridan County, Wyoming: U.S. Geological Survey
Miscellaneous Field Studies Map MF-723, scale 1:24,000.
Culbertson, W.C., and Mapel, W.J., 1976, Coal in the Wasatch Formation,
northwest part of the Powder River basin near Sheridan, Sheridan County,
Wyoming: Wyoming Geological Association, 28th Annual Field
Conference, p. 193-201.
Dunrud, C.R. and Osterwald, F.W., 1980, Effects of coal mine subsidence in the
Sheridan, Wyoming area: U.S. Geological Survey Professional Paper 1164,
p.7, figure 4.
Dynamic Graphics, Inc., 1997, EarthVision, v.4, 1015 Atlantic Ave., Alameda, CA
94501.
Ebaugh, W.F., 1976, Preliminary surficial and bedrock geologic map of the Big
Horn quadrangle, Sheridan County, Wyoming: U.S. Geological Survey
Miscellaneous Field Studies Map MF-801, scale 1:24,000.
Ellis, M.S., Gunther, G.L., Flores, R.M., Ochs, A.M., Stricker, G.D., Roberts,
S.B., Taber, T.T., Bader, L.R., and Schuenemeyer, J.H., 1999, Preliminary
report on coal resources of the Wyodak-Anderson coal zone, Powder River
Basin, Wyoming and Montana: U.S. Geological Survey Open-File Report
98-789A.

PH-18
Ellis, M.S., Gunther, G.L., Flores, R.M., Stricker, G.D., and Ochs, A.M., in press,
Preliminary report on methodolgy for calculating coal resources of the
Wyodak-Anderson coal zone in the Powder River Basin, Wyoming and
Montana: U.S. Geological Survey Open-File Report 98-789B.
ESRI-Environmental Systems Research Institute, Inc., 1998a, ARC/INFO, v. 7.1.1,
380 New York Street, Redlands, CA 92373, USA.
_____1998b, ArcView, v.3.0a, 380 New York Street, Redlands, CA 92373, USA.
Green G.N. and Drouillard, P.H., 1994, The digital geologic map of Wyoming in
ARC/INFO format: U.S. Geological Survey Open-File Report 94-0425.
GRG Corporation, 1996, StratiFact, relational database software, v. 4.5: GRG
Corporation, 4175 Harlan Street, Wheatridge, CO 80033-5150, USA.
Kanizay, S.P., 1978, Preliminary geologic map of the Sheridan area, northwestern
Powder River Basin, Wyoming: U.S. Geological Survey Miscellaneous
Field Studies Map MF-1043, scale 1:50,000.
Law, B.E., Barnum, B.E., and Wollenzien, T.P., 1979, Coal bed correlations in the
Tongue River Member of the Fort Union Formation, Monarch, Wyoming,
and Decker Montana, areas: U.S. Geological Survey Miscellaneous
Investigations Series Map I-1128.
Love, J.D., and Christiansen, A.C., 1985, Geologic map of Wyoming: U.S.
Geological Survey, scale 1:500,000.
Microsoft, 1997, Excel spreadsheet software, v. Office 97: Microsoft Corporation,
1 Microsoft Way, Redman, WA 98052.
Resource Data International, Inc., 1998, COALdat coal database: Resource Data
International, Inc., 1320 Pearl St., Suite 300, Boulder, Colorado 80302.
Schuenemeyer, J. H. And Power H., in press, Uncertainty Estimation For Resource
Assessment—An Application To Coal: Mathematical Geology.

PH-19
Taff, J.A., 1909, The Sheridan coal field: U.S. Geological Survey Bulletin 341, p.
123-150.
U.S. Environmental Protection Agency, 1996, Standards of Performance for New
Stationary Sources, 40CFR, Part 60.43, Standards for Sulfur Dioxide:
Environmental Protection Agency, 27 p.
Wood, G.H., Jr., Kehn, T.M., Carter, M.D., and Culbertson, W.C., 1983, Coal
resource classification system of the U.S. Geological Survey: U.S.
Geological Survey Circular 891, 65 p.

Figure PH-1. Geologic map of the
Sheridan coalfield, Powder River Basin.
45°00'
106°45'107°00'107°15'
44°45'
Powder RiverBasin (part)
Sheridan
Sheridan Coalfield
MontanaWyoming
Sheridan County
Railroad
Road
Quaternary alluvium
Tertiary Wasatch Formation
Tertiary Tongue River Member of the Fort Union Formation
Tertiary Lebo Shale Member of the Fort Union Formation
TertiaryTullock Member of the Fort Union Formation
Qal
Tw
Tw
Tw
Tw
Tftr
Tftr
Tftr
Tftr
Tft
Tft
Tft
Tft
Tft
UndifferentiatedFort Union Formation
Tfu
Tfu
Tfu
Tfl
Tfl
Tfl
Explanation
Big Horn mine (surface mine)
Clinker
Abandoned underground mines
Qal
Qal
Qal
010 10 Miles

Figure PH-2. Coal beds of the Wyodak–Anderson coal zone and overlying carbonaceous shale, mudstone, siltstone, and sandstone in the highwall of the Big Horn mine. Photograph by R.M. Flores.

Figure PH-3. Fluvial channel sandstone above the Wyodak–Anderson coal zone in the highwall of the Big Horn mine. Photograph by R.M. Flores.

Figure PH-4. Interbedded mudstone, siltstone, and sandstone deposited in crevasse splay and floodplain environments in the highwall of the Big Horn mine. Photograph by R.M. Flores.

Figure PH-5. The Wyodak–Anderson coal zone consisting of the Dietz and Monarch coal beds in the highwall of the Big Horn mine. Photograph by R.M. Flores.

Figure PH-6. Index map showinglocations of Sheridan coalfield crosssections and mines.
Cross section with nonproprietarydrill holes
Big Horn mine (surface mine)
Abandoned underground mines
A A'
45°00'
106°45'107°00'107°15'
44°45'
Powder RiverBasin (part)
Sheridan
Sheridan Coalfield
MontanaWyoming
Sheridan County
AB
C
A'
B'
C'
010 10 Miles
?
Coal
Undifferentiated mudstone,siltstone, limestone and sandstone
No record
South
A'
North
A
WYODAK-ANDERSONCOAL ZONE
WYODAK-ANDERSONCOAL ZONE
Elevation(feet)
3600
3500
3400
3300
3200
3100
3000
4200
4100
4000
3900
3800
3700
2400
2900
2800
2700
2600
2500
Datum = Sea Level
18.06 Miles
Figure PH-7. Sheridan coalfield structural cross section A-A'.
C-C
'
B-B
'

?
??
?
East
B'
West
B
WYODAK-ANDERSONCOAL ZONE
WYODAK-ANDERSONCOAL ZONE
Coal
Undifferentiated mudstone,siltstone, limestone and sandstoneNo record
3800
Elevation(feet)
4100
3600
4000
3400
3900
3200
3800
3000
3700
2800
3600
2600
3500
4700
4800
4600
4600
4500
4400
4400
4200
4300
4000
4200
2900
2800
2700
2600
3400
4600
3300
4400
3200
3100
3000
Datum = Sea Level
18.39 Miles
A-A
'
Figure PH-8. Sheridan coalfield structural cross section B-B'.
??
?
?
3800
Elevation(feet)
3600
3600
3500
3400
3400
3200
3300
3000
3200
2800
3100
2600
3000
4200
4800
4100
4600
4000
4400
3900
4200
3800
4000
3700
4800
2900
4600
2800
4400
2700
4200
2600Datum = Sea Level
Figure PH-9. Sheridan coalfield structural cross section C-C'.
A-A
'
15.64 Miles
East
C'
West
C
WYODAK-ANDERSONCOAL ZONE
WYODAK-ANDERSONCOAL ZONE
Coal
Undifferentiated mudstone,siltstone, limestone and sandstoneNo record

Rosebud
Big Horn
Sheridan
Montana
Wyoming
Sheridan Coalfield
Montana
Wyoming
North Dakota
South Dakota
Nebraska
o107 15' 107 00'o106 45'o 106 45'o
45 15'o
45 00'o
45 45'o
N
Figure PH-10. Index map showing coal quality data distribution in the Wyodak-Anderson coal zone, Sheridan coalfield, Powder River Basin, Wyoming.
7 14 Miles0Data point location

Rosebud
Big Horn
Sheridan
Montana
Wyoming
Sheridan Coalfield
( < 8 % )( 8 - 15 % )
( > 15 % )
LowMedium High
Montana
Wyoming
North Dakota
South Dakota
Nebraska
o107 15' 107 00'o106 45'o 106 45'o
45 15'o
45 00'o
45 45'o
N
Figure PH-11. Ash yield in the Wyodak-Anderson coal zone, Sheridan coalfield, Powder River Basin, Wyoming.
7 14 Miles0

Rosebud
Big Horn
Sheridan
107 15 107 106 45 106 3045 15'
45
44 45
Montana
Wyoming
North Dakota
South Dakota
Nebraska
N
00'
Figure PH-12. Sulfur content in the Wyodak-Anderson coal zone, Sheridan coalfield, Powder River Basin, Wyoming.
Montana
Wyoming
Sheridan Coalfield
( < 8 % )( 8 - 15 % )
( > 15 % )
LowMedium High
7 14 Miles0
Rosebud
Big Horn
Sheridan
Montana
Wyoming
Sheridan Coalfield
Figure PH-13. Moist, mineral-matter-free Btu/lb in the Wyodak-Anderson coal zone, Sheridan coalfield, Powder River Basin, Wyoming.
( < 8,300 )( 8,300 - 10,500 )
( > 10,500 )
LigniteSubbituminous Bituminous
Montana
Wyoming
North Dakota
South Dakota
Nebraska
o107 15' 107 00'o 106 45'o 106 45'o
45 15'o
45 00'o
45 45'o
N
7 14 Miles0

Rosebud
Big Horn
Sheridan
o107 15' 107 00'o 106 45'o 106 45'o
45 15'o
45 00'o
45 45'o
Montana
Wyoming
Sheridan Coalfield
( < 1.2 )( 1.2 - 2.4 )
( > 2.4 )
LowMedium High
Montana
Wyoming
North Dakota
South Dakota
Nebraska
N
Figure PH-14. Pounds of sulfur dioxide per million btu in the Wyodak-Anderson coal zone, Sheridan coalfield, Powder River Basin, Wyoming.
7 14 Miles0

Rosebud
Big Horn
Sheridan
Montana
Wyoming
Sheridan Coalfield
( < 0.2 ppm )( 0.2 - 0.5 ppm )
( > 0.5 ppm )
LowMedium High
Montana
Wyoming
North Dakota
South Dakota
Nebraska
N
o107 15' 107 00'o 106 45'o 106 45'o
45 15'o
45 00'o
45 45'o
Figure PH-15. Antimony concentration in the Wyodak-Anderson coal zone, Sheridan coalfield, Powder River Basin, Wyoming.
7 14 Miles0
Rosebud
Big Horn
Sheridan
Montana
Wyoming
Sheridan Coalfield
( < 1.4 ppm )( 1.4 - 6.1 ppm )
( > 6.1 ppm )
LowMedium High
7 14 Miles0
Montana
Wyoming
North Dakota
South Dakota
Nebraska
o107 15' 107 00'o 106 45'o 106 45'o
45 15'o
45 00'o
45 45'o
N
Figure PH-16. Arsenic concentration in the Wyodak-Anderson coal zone, Sheridan coalfield, Powder River Basin, Wyoming.

Rosebud
Big Horn
Sheridan
Montana
Wyoming
Sheridan Coalfield
( < 0.23 ppm )( 0.23 - 0.73 ppm )
( > 0 .73 ppm )
LowMedium High
Montana
Wyoming
North Dakota
South Dakota
Nebraska
o107 15' 107 00'o 106 45'o 106 45'o
45 15'o
45 00'o
45 45'o
N
Figure PH-17. Beryllium concentration in the Wyodak-Anderson coal zone, Sheridan coalfield, Powder River Basin, Wyoming.
7 14 Miles0

Rosebud
Big Horn
Sheridan
Montana
Wyoming
Sheridan Coalfield
( < 0.052 ppm )( 0.052 - 0.13 ppm )
( > 0.13 ppm)
LowMedium High
Montana
Wyoming
North Dakota
South Dakota
Nebraska
o107 15' 107 00'o 106 45'o 106 45'o
45 15'o
45 00'o
45 45'o
N
Figure PH-18. Cadmium concentration in the Wyodak-Anderson coal zone, Sheridan coalfield, Powder River Basin, Wyoming.
7 14 Miles0

Rosebud
Big Horn
Sheridan
o107 15' 107 00'o 106 45'o 106 45'o
45 15'o
45 00'o
45 45'o
Montana
Wyoming
Sheridan Coalfield
( < 3.0 ppm )( 3.0 - 8.2 ppm )
( > 8.2 ppm )
LowMedium High
7 14 Miles0
Montana
Wyoming
North Dakota
South Dakota
Nebraska
N
Figure PH-19. Chromium concentration in the Wyodak-Anderson coal zone, Sheridan coalfield, Powder River Basin, Wyoming.

Rosebud
Big Horn
Sheridan
Montana
Wyoming
Sheridan Coalfield
7 14 Miles0( < 0.87 ppm )( 0.87 - 1.9 ppm )
( > 1.9 ppm )
LowMedium High
Montana
Wyoming
North Dakota
South Dakota
Nebraska
o107 15' 107 00'o 106 45'o 106 45'o
45 15'o
45 00'o
45 45'o
N
Figure PH-20. Cobalt concentration in the Wyodak-Anderson coal zone, Sheridan coalfield, Powder River Basin, Wyoming.

Rosebud
Big Horn
Sheridan
o107 15' 107 00'o 106 45'o 106 45'o
45 15'o
45 00'o
45 45'o
Montana
Wyoming
Sheridan Coalfield
7 14 Miles0( < 1.8 ppm )( 1.8 - 4.2 ppm )
( > 4.2 ppm )
LowMedium High
Montana
Wyoming
North Dakota
South Dakota
Nebraska
N
Figure PH-21. Lead concentration in the Wyodak-Anderson coal zone, Sheridan coalfield, Powder River Basin, Wyoming.
Rosebud
Big Horn
Sheridan
Montana
Wyoming
Sheridan Coalfield
( < 12 ppm )( 12 - 49 ppm )
( > 49 ppm )
LowMedium High
7 14 Miles0
Montana
Wyoming
North Dakota
South Dakota
Nebraska
o107 15' 107 00'o 106 45'o 106 45'o
45 15'o
45 00'o
45 45'o
N
Figure PH-22. Manganese concentration in the Wyodak-Anderson coal zone, Sheridan coalfield, Powder River Basin, Wyoming.

Rosebud
Big Horn
Sheridan
Montana
Wyoming
Sheridan Coalfield
( < 0.06 ppm )( 0.06 - 0.13 ppm )
( > 0.13 ppm )
LowMedium High
Montana
Wyoming
North Dakota
South Dakota
Nebraska
o107 15' 107 00'o 106 45'o 106 45'o
45 15'o
45 00'o
45 45'o
N
Figure PH-23. Mercury concentration in the Wyodak-Anderson coal zone, Sheridan coalfield, Powder River Basin, Wyoming.
7 14 Miles0

Rosebud
Big Horn
Sheridan
o107 15' 107 00'o 106 45'o 106 45'o
45 15'o
45 00'o
45 45'o
Montana
Wyoming
Sheridan Coalfield
( < 1.9 ppm )( 1.9 - 4.2 ppm )
( > 4.2 ppm )
LowMedium High
7 14 Miles0
Montana
Wyoming
North Dakota
South Dakota
Nebraska
N
Figure PH-24. Nickel concentration in the Wyodak-Anderson coal zone, Sheridan coalfield, Powder River Basin, Wyoming.

Rosebud
Big Horn
Sheridan
o107 15' 107 00'o 106 45'o 106 45'o
45 15'o
45 00'o
45 45'o
Montana
Wyoming
Sheridan Coalfield
( < 0.5 ppm )( 0.5 - 1.1 ppm )
( >1.1 ppm )
LowMedium High
7 14 Miles0
Montana
Wyoming
North Dakota
South Dakota
Nebraska
N
Figure PH-25. Selenium concentration in the Wyodak-Anderson coal zone, Sheridan coalfield, Powder River Basin, Wyoming.
Rosebud
Big Horn
Sheridan
Montana
Wyoming
Sheridan Coalfield
7 14 Miles0( < 0.61 ppm )( 0.61 - 1.6 ppm )
( > 1.6 ppm )
LowMedium High
Montana
Wyoming
North Dakota
South Dakota
Nebraska
o107 15' 107 00'o 106 45'o 106 45'o
45 15'o
45 00'o
45 45'o
N
Figure PH-26. Uranium concentration in the Wyodak-Anderson coal zone, Sheridan coalfield, Powder River Basin, Wyoming.
1
0 2 4 6 8
0 2 4 Miles
Kilometers
Wyodak-Anderson coal extent
Sheridan coalfield
Powder River Basin (part)
Quadrangle boundary
107
45
44 45'
106 45'o
o o
o
2 3 4
5 6 7
1 RANCHESTER2 MONARCH3 ACME4 BAR N DRAW5 WOLF6 HULTZ DRAW7 SHERIDAN8 WYARNO
7.5-minute quadrangle maps
1
Figure PH-27. Location of 7.5-minute quadrangle maps in the Sheridan coalfield.
8
MontanaWyoming

0 2 4 6 8 10
0 2 4 6 Miles
Kilometers
107
45
44 45'
106 45'o
o o
o
Federal Coal = Federal subsurface management of all minerals, coal only, or oil, gas, and coal
Federal Surface = Federal surface ownership
No Federal coal or surface
Federal coal, but no Federal surface
Federal coal and surface
Powder River Basin (part)
Figure PH-28. Federal coal and Federal surface ownership in the Sheridan coalfield.
Wyodak-Anderson coal extent (part)
Sheridan coalfield study limit
Wyoming
Montana
Net coal thickness (ft)
02.55
10
20
30
40
50
60
70
80
90
100
110
Wyodak-Andersoncoal extent (part)
Sheridan Coalfield
Figure PH-29. Wyodak-Anderson net coal isopach map in the Sheridan coalfield.
0 2 4 6 8 10
0 2 4 6 Miles
Kilometers
107
45
44 45'
106 45'
o
o o
o
Powder River Basin (part)
0
100
200
300
400
500
600
700
800
900
1000
1100
1200
1300
1400
Wyodak-Andersoncoal extent (part)
Sheridan Coalfield
107
45
44 45'
106 45'
o
o o
o
Powder River Basin (part)
Faults
Overburden thickness (ft)
Figure PH-30. Wyodak-Anderson overburden isopach map in the Sheridan coalfield.
0 2 4 6 8 10
0 2 4 6 Miles
Kilometers

107
45
44 45'
106 45'
o
o o
o
Wyodak-Anderson coal extent (part)
Mine and lease areas
Wyodak-Anderson clinker
Faults
0 2 4 6 8 10
0 2 4 6 Miles
Kilometers
Resource area
Sheridan Coalfield
Powder River Basin (part)
(does not include areas of Wyodak-Anderson mines, leases, clinker, or net coal < 2.5 ft thick)
Figure PH-31. Wyodak-Anderson mine and lease areas, clinker, and resource area in the Sheridan coalfield.
Montana
Index map showing area included in
resource calculations
Wyoming

Table PH-1. Summary data for Wyodak-Anderson coal zone in the Sheridan coalfield, Powder River Basin,Wyoming. Modified from unpublished U.S. Geological Survey coal quality database (USCHEM), February, 1992;Bragg and others (1994); and proprietary source(s)
Variable Number Range Mean
of samples Minimum Maximum
Moisture 1 1 20.40 20.40 20.40Ash 1 1 5.30 5.30 5.30
Total Sulfur 1 1 0.70 0.70 0.70Calorific Value 2 1 9,540 9,540 9,540lb SO2
3 1 1.48 1.48 1.48MMMFBtu 4 1 10,120 10,120 10,120Antimony 5 2 0.23 0.25 0.24Arsenic 5 2 3.1 3.3 3.2Beryllium 5 2 0.20 0.23 0.21Cadmium 5 2 0.09 0.10 0.09Chromium 5 2 3.6 3.7 3.6Cobalt 5 2 1.1 1.2 1.2Lead 5 2 1.5 2.1 1.8Manganese 5 2 11 30 21Mercury 5 2 0.08 0.09 0.08Nickel 5 2 4.3 5.4 4.8Selenium 5 2 0.40 0.50 0.45Uranium 5 2 0.41 0.75 0.58
1 Values are in percent and on an as-received basis.2 Value is in British thermal units (Btu).3 Value is in pounds per million Btu and on an as-received basis.4 Value is in British thermal units on a moist, mineral-matter-free basis.5 Values are in parts per million (ppm) on a whole-coal and as-received basis

Table PH-2. Wyodak-Anderson coal resources in the Sheridan coalfield, Sheridan County, Wyoming reported byoverburden thickness (fig. PH-30), net coal thickness (fig. PH-29), and reliability categories. Resources are shownin millions of short tons (MST) and with two significant figures. Zeros (0) indicate that no coal resources werecalculated within those categories. The table does not include resources in mine or lease areas, or areas containingWyodak-Anderson clinker. Columns and rows will not sum due to independent rounding
Overburden Net Reliability categories (distance from data point) Totalthickness coal thickness Measured
(<1/4 mi)Indicated
(1/4-3/4 mi)Inferred
(3/4-3 mi)Hypothetical
(>3 mi)(MST)
0-100 ft 2.5-5 ft 0.16 7.6 39 0 475-10 ft 5.4 33 140 7.7 19010-20 ft 17 120 220 5.1 36020-30 ft 7.2 83 56 0 15030-40 ft 11 36 3.6 0 5140-50 ft 29 34 0 0 6350-100 ft 38 20 34 0 92
0-100 ft total 110 330 490 13 940100-200 ft 2.5-5 ft 0.20 5.0 1.6 0 6.8
5-10 ft 4.4 40 41 0 8510-20 ft 17 85 120 7.5 23020-30 ft 38 190 84 0 31030-40 ft 55 100 3.0 0 16040-50 ft 79 76 2.1 0 16050-100 ft 100 170 12 0 280
100-200 ft total 290 660 260 7.5 1,200200-300 ft 2.5-5 ft 0.11 2.5 0.57 0 3.1
5-10 ft 3.3 14 6.4 0 2410-20 ft 29 68 78 8.9 18020-30 ft 56 160 130 0.75 35030-40 ft 34 140 56 0 23040-50 ft 15 120 9.8 0 15050-100 ft 150 640 53 0 840100-150 ft 0 9.6 0 0 9.6
200-300 ft total 280 1,200 330 9.6 1,800

Table PH-2. Wyodak-Anderson coal resources, Sheridan coalfield, Powder River Basin—continued
Overburden Net Reliability categories (distance from data point) Totalthickness coal thickness Measured
(<1/4 mi)Indicated
(1/4-3/4 mi)Inferred
(3/4-3 mi)Hypothetical
(>3 mi)(MST)
300-400 ft 2.5-5 ft 0.061 1.1 0 0 1.25-10 ft 8.3 16 10 0 3410-20 ft 15 62 47 2.3 13020-30 ft 36 150 230 2.2 42030-40 ft 36 210 190 0.8 43040-50 ft 16 120 58 0 19050-100 ft 220 610 78 0 900100-150 ft 9.3 5.0 0 0 14
300-400 ft total 340 1,200 610 5.3 2,100400-500 ft 2.5-5 ft 0.22 0.76 0 0 0.98
5-10 ft 9.2 36 4.2 0 4910-20 ft 11 100 73 3.7 19020-30 ft 14 85 220 8.5 32030-40 ft 17 50 140 5.6 21040-50 ft 14 55 41 0 11050-100 ft 54 250 72 0 370100-150 ft 4.1 2.5 0 0 6.6
400-500 ft total 120 580 540 18 1,300500-1,000 ft 2.5-5 ft 1.5 2.2 0 0 3.7
5-10 ft 4.6 9.7 0 0 1410-20 ft 15 140 170 0.16 33020-30 ft 15 95 300 22 43030-40 ft 7.7 80 190 16 29040-50 ft 22 110 220 35 39050-100 ft 100 480 670 13 1,300
500-1,000 ft total 170 9 10 1,500 86 2,700
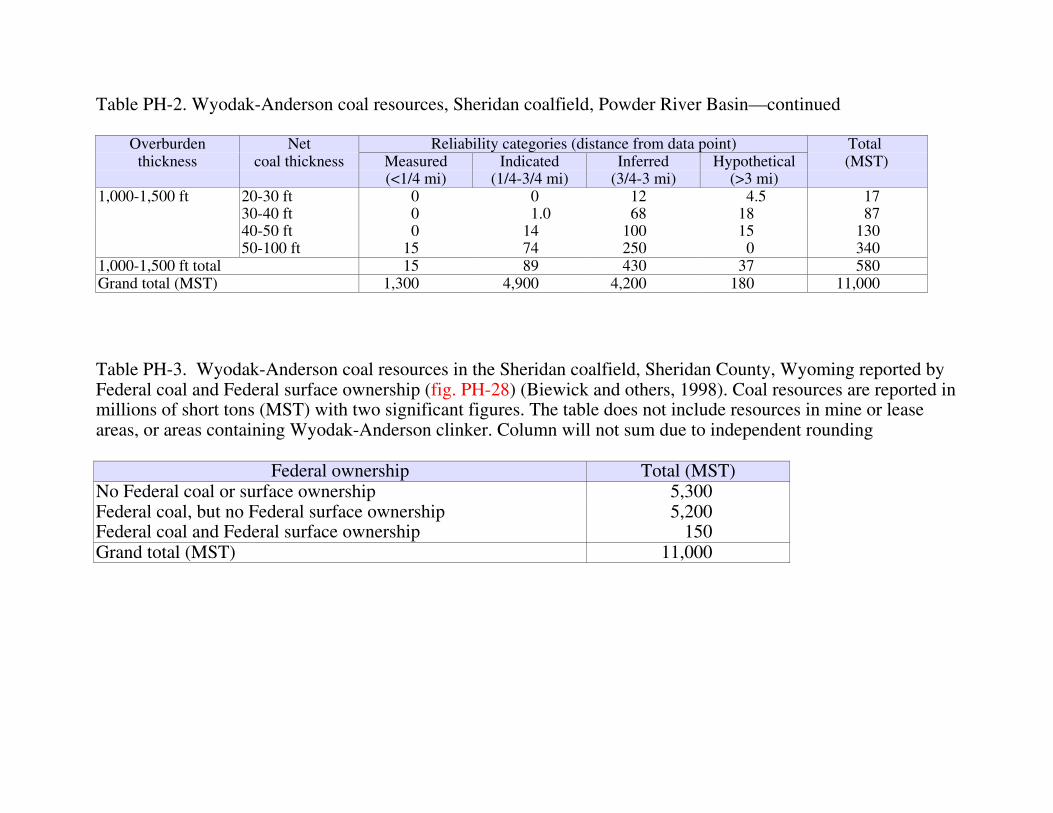
Table PH-2. Wyodak-Anderson coal resources, Sheridan coalfield, Powder River Basin—continued
Overburden Net Reliability categories (distance from data point) Totalthickness coal thickness Measured
(<1/4 mi)Indicated
(1/4-3/4 mi)Inferred
(3/4-3 mi)Hypothetical
(>3 mi)(MST)
1,000-1,500 ft 20-30 ft 0 0 12 4.5 1730-40 ft 0 1.0 68 18 8740-50 ft 0 14 100 15 13050-100 ft 15 74 250 0 340
1,000-1,500 ft total 15 89 430 37 580Grand total (MST) 1,300 4,900 4,200 180 11,000
Table PH-3. Wyodak-Anderson coal resources in the Sheridan coalfield, Sheridan County, Wyoming reported byFederal coal and Federal surface ownership (fig. PH-28) (Biewick and others, 1998). Coal resources are reported inmillions of short tons (MST) with two significant figures. The table does not include resources in mine or leaseareas, or areas containing Wyodak-Anderson clinker. Column will not sum due to independent rounding
Federal ownership Total (MST)No Federal coal or surface ownership 5,300Federal coal, but no Federal surface ownership 5,200Federal coal and Federal surface ownership 150Grand total (MST) 11,000

Table PH-4. Wyodak-Anderson coal resources in the Sheridan coalfield, Sheridan County, Wyoming reported by7.5-minute quadrangle map area (fig. PH-27). Coal resources are reported in millions of short tons (MST) and withtwo significant figures. The table does not include resources in mine or lease areas, or areas containing Wyodak-Anderson clinker. Column will not sum due to independent rounding
7.5-minute quadrangle map Total (MST)ACME 2,700BAR N DRAW 2,900HULTZ DRAW 280MONARCH 650RANCHESTER 98SHERIDAN 1,300WOLF 42WYARNO 2,700Grand total (MST) 11,000
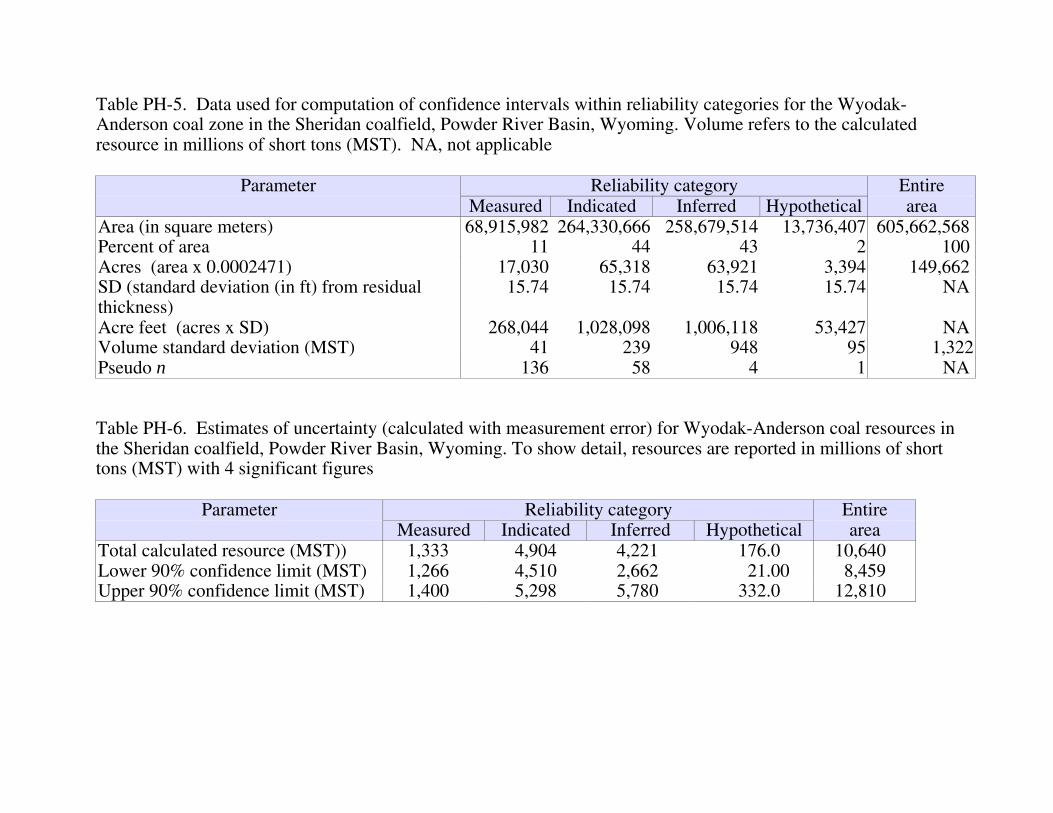
Table PH-5. Data used for computation of confidence intervals within reliability categories for the Wyodak-Anderson coal zone in the Sheridan coalfield, Powder River Basin, Wyoming. Volume refers to the calculatedresource in millions of short tons (MST). NA, not applicable
Parameter Reliability category EntireMeasured Indicated Inferred Hypothetical area
Area (in square meters) 68,915,982 264,330,666 258,679,514 13,736,407 605,662,568Percent of area 11 44 43 2 100Acres (area x 0.0002471) 17,030 65,318 63,921 3,394 149,662SD (standard deviation (in ft) from residualthickness)
15.74 15.74 15.74 15.74 NA
Acre feet (acres x SD) 268,044 1,028,098 1,006,118 53,427 NAVolume standard deviation (MST) 41 239 948 95 1,322Pseudo n 136 58 4 1 NA
Table PH-6. Estimates of uncertainty (calculated with measurement error) for Wyodak-Anderson coal resources inthe Sheridan coalfield, Powder River Basin, Wyoming. To show detail, resources are reported in millions of shorttons (MST) with 4 significant figures
Parameter Reliability category EntireMeasured Indicated Inferred Hypothetical area
Total calculated resource (MST)) 1,333 4,904 4,221 176.0 10,640Lower 90% confidence limit (MST) 1,266 4,510 2,662 21.00 8,459Upper 90% confidence limit (MST) 1,400 5,298 5,780 332.0 12,810