Embed Size (px)
Citation preview

Chapter SevenActivity-Based Costing and
Management
Chapter SevenActivity-Based Costing and
Management
COPYRIGHT © 2012 Nelson Education Ltd.

COPYRIGHT © 2012 Nelson Education Ltd.COPYRIGHT © 2012 Nelson Education Ltd.
Learning ObjectivesLearning Objectives
1. Explain why functional-based costing approaches may produce distorted costs
2. Explain how an activity-based costing system works for product costing
3. Describe activity-based customer and supplier costing
4. Explain how activity-based management can be used for cost reduction
7-2

OBJECTIVE OBJECTIVE 11
Explain why functional-based costing
approaches may produce distorted costs

COPYRIGHT © 2012 Nelson Education Ltd.
Functional-Based Costing SystemsFunctional-Based Costing Systems
• Functional-based systems – Based on volume measures, such as
• Direct labour hours• Machine hours
– Two types:• Plantwide rates• Departmental rates
• Often produce average costs that over- or understate individual product costs
7-4
COPYRIGHT © 2012 Nelson Education Ltd.COPYRIGHT © 2012 Nelson Education Ltd.
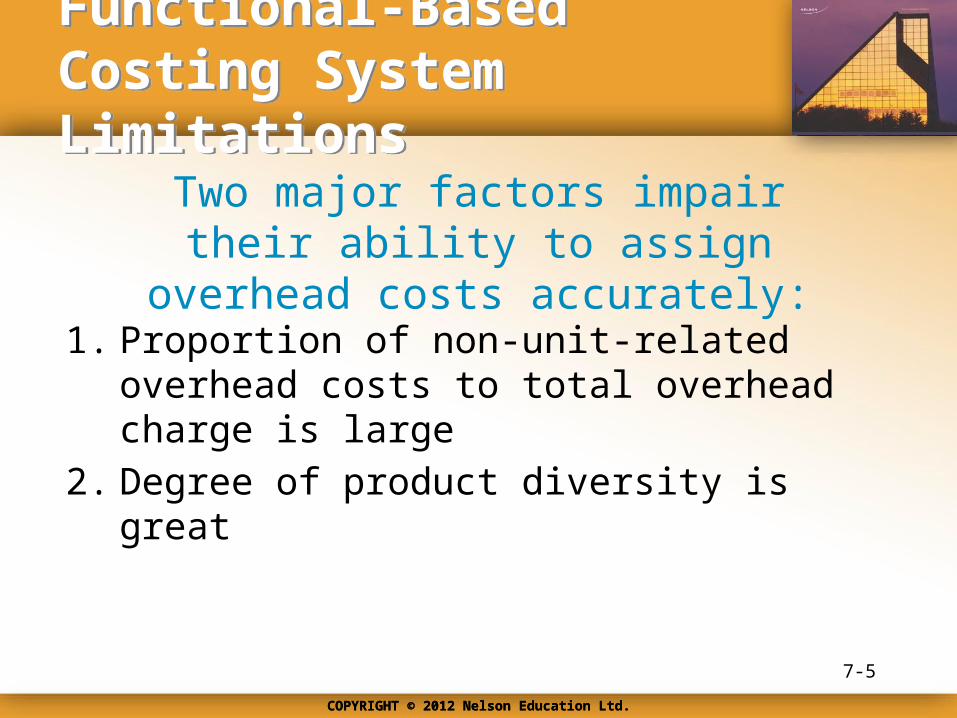
Functional-Based Costing System LimitationsFunctional-Based Costing System Limitations
1. Proportion of non-unit-related overhead costs to total overhead charge is large
2. Degree of product diversity is great
Two major factors impair their ability to assign overhead costs accurately:
7-5

COPYRIGHT © 2012 Nelson Education Ltd.COPYRIGHT © 2012 Nelson Education Ltd.
Unit and Non-Unit ActivitiesUnit and Non-Unit Activities
Activities performed each time a unit is produced
From the viewpoint of the subsequent process, transferred-in costs are a type of raw material cost
Unit-level-activities ---
Non-unit-level-activities ---
7-6

COPYRIGHT © 2012 Nelson Education Ltd.COPYRIGHT © 2012 Nelson Education Ltd.
Non-Unit-Related Overhead CostsNon-Unit-Related Overhead Costs
What is needed for accurate cost assignment of non-unit-level activities?
Non-unit-level activity drivers
Factors that measure the consumption of non-unit-level activities by products
and other cost objects
7-7

COPYRIGHT © 2012 Nelson Education Ltd.COPYRIGHT © 2012 Nelson Education Ltd.
Product DiversityProduct Diversity
Proportion of each activity consumed by a product
Consumption Ratio ---
Products consume overhead activities in systematically different proportions
7-8

COPYRIGHT © 2012 Nelson Education Ltd.COPYRIGHT © 2012 Nelson Education Ltd.
Example: Cornerstone 7-1Example: Cornerstone 7-1
Regular
Prime costs
Setup hours
$800
Number of moves
Total
$8,000
3 1 4
4 10
Deluxe
Activity Usage Measures
Units produced 10 100 110
$8,800
Direct labour hours 20 80 100
Machine hours 10
6
40 50
7-9
How to Calculate Consumption Ratios

COPYRIGHT © 2012 Nelson Education Ltd.COPYRIGHT © 2012 Nelson Education Ltd.
ExampleExample
Setting up equipment
Assembly
Total
Activity Cost
500
$4,000
Activity
Activity Cost Data
$1,200
Moving goods 800
Machining 1,500
7-10

COPYRIGHT © 2012 Nelson Education Ltd.COPYRIGHT © 2012 Nelson Education Ltd.
ExampleExample
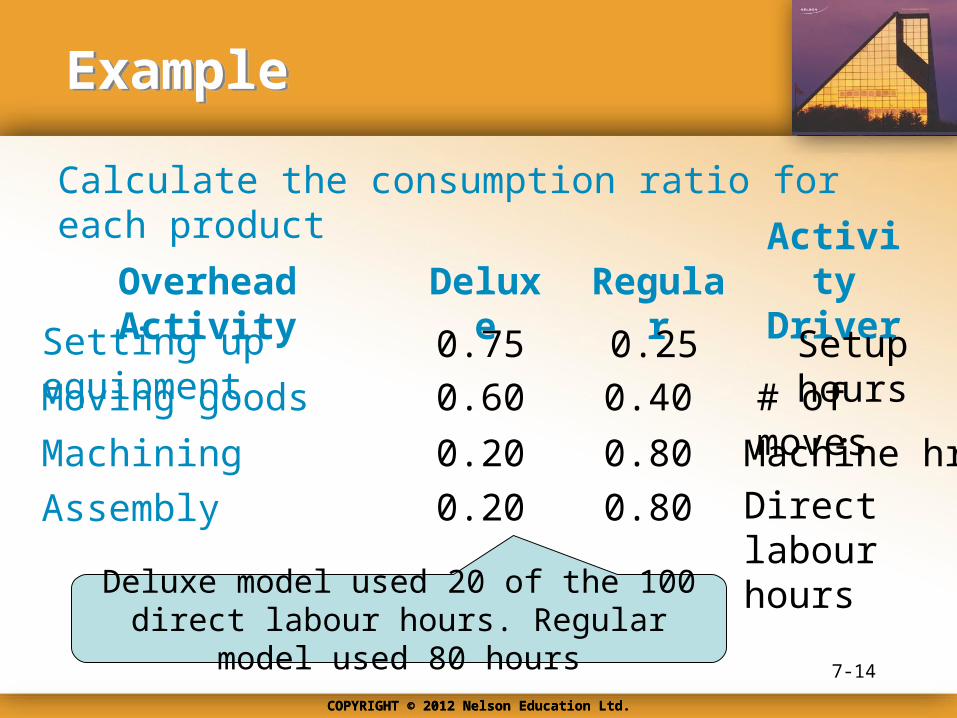
Calculate the consumption ratio for each product
Overhead Activity
Setting up equipment 0.75
DeluxeActivity Driver
One of four hours was spent on the Regular model
Regular
Setup hours0.25
7-11
Three of four hours were spent setting up the Deluxe
Model ¾ or 0.75

COPYRIGHT © 2012 Nelson Education Ltd.COPYRIGHT © 2012 Nelson Education Ltd.
ExampleExample
Calculate the consumption ratio for each product
Overhead Activity
Setting up equipment 0.75
DeluxeActivity Driver
6 of the 10 moves were for the Deluxe model, 4 of the 10 were for the Regular model
Regular
Setup hours0.25
Moving goods 0.60 0.40 # of moves
7-12

COPYRIGHT © 2012 Nelson Education Ltd.COPYRIGHT © 2012 Nelson Education Ltd.
ExampleExample
Calculate the consumption ratio for each product
Overhead Activity
Setting up equipment 0.75
DeluxeActivity DriverRegular
Setup hours0.25
Moving goods 0.60 0.40 # of moves
Machining 0.20 0.80 Machine hrs
7-13
Deluxe model used 10 of the 50 machine hours, while the Regular model used 40 hours
COPYRIGHT © 2012 Nelson Education Ltd.COPYRIGHT © 2012 Nelson Education Ltd.
ExampleExample
Calculate the consumption ratio for each product
Overhead Activity
Setting up equipment 0.75
DeluxeActivity DriverRegular
Setup hours0.25
Moving goods 0.60 0.40 # of moves
Machining 0.20 0.80 Machine hrs
Assembly 0.20 0.80 Direct labour hours
7-14
Deluxe model used 20 of the 100 direct labour hours. Regular model used 80 hours

COPYRIGHT © 2012 Nelson Education Ltd.COPYRIGHT © 2012 Nelson Education Ltd.
ExampleExample
Calculate the consumption ratio for each product.
Overhead Activity
Setting up equipment 0.75
DeluxeActivity DriverRegular
Setup hours0.25
Moving goods 0.60 0.40 # of moves
Machining 0.20 0.80 Machine hrs
Assembly 0.20 0.80 Direct labour hours
7-15
Deluxe model had Consumption Ratios ranging from 0.75 to 0.20

COPYRIGHT © 2012 Nelson Education Ltd.COPYRIGHT © 2012 Nelson Education Ltd.
How to Calculate Activity Ratios
Example: Cornerstone 7-2Example: Cornerstone 7-2
Activity Activity Cost
Setting up equipment
Moving goods
Machining
$1,200
1,500
500
Information:
800
Assembly
7-16

COPYRIGHT © 2012 Nelson Education Ltd.COPYRIGHT © 2012 Nelson Education Ltd.
ExampleExample
Driver Driver Quantity
Setup hours
Number of moves
Machine hours
4
50
100
Information:
10
Direct labour hours
7-17

COPYRIGHT © 2012 Nelson Education Ltd.COPYRIGHT © 2012 Nelson Education Ltd.
ExampleExample
Required: Calculate activity rates
Setup rate $1,200/4 setup hours $300 per setup hour
Materials handling rate
Machining rate
Assembly rate
$800/10 moves $80 per move
$1,500/50 machine hours
$30 per machine hour
$500/100 machine hours
$5 per direct labour hour
7-18

COPYRIGHT © 2012 Nelson Education Ltd.COPYRIGHT © 2012 Nelson Education Ltd.
Example: Cornerstone 7-3Example: Cornerstone 7-3
Regular
Prime costs
Machine hours
$800
Direct labour hours
Activity Rate
$8,000
10 40 $ 3080 $ 5
Deluxe
Units produced per year 10 100
Setup hours 3 1 $300Number of moves 6
20
4 $ 80
Information:
7-19
How to Calculate Activity-Based Unit Costs

COPYRIGHT © 2012 Nelson Education Ltd.COPYRIGHT © 2012 Nelson Education Ltd.
ExampleExample
Required: Calculate the unit cost for deluxe and regular models
Overhead costs:
Deluxe Regular
$8,000
Setups 900
Prime costs $800
$300 per setup ×1 setup
300
7-20
$300 per setup × 3 setups

COPYRIGHT © 2012 Nelson Education Ltd.COPYRIGHT © 2012 Nelson Education Ltd.
ExampleExample
Required: Calculate the unit cost for deluxe and regular models
Overhead costs:
Deluxe Regular
$8,000
Setups 900
Prime costs $800
$80 per move × 4 moves
300Moving materials 480 320
7-21
$80 per move × 6 moves

COPYRIGHT © 2012 Nelson Education Ltd.COPYRIGHT © 2012 Nelson Education Ltd.
ExampleExample
Required: Calculate the unit cost for deluxe and regular models.
Overhead costs:
Deluxe Regular
$8,000
Setups 900
Prime costs $800
$30 per machine hour x 40 hours
300Moving materials 480 320Machining 300 1,200
7-22
$30 per machine hour x 10 hours
COPYRIGHT © 2012 Nelson Education Ltd.COPYRIGHT © 2012 Nelson Education Ltd.
ExampleExample
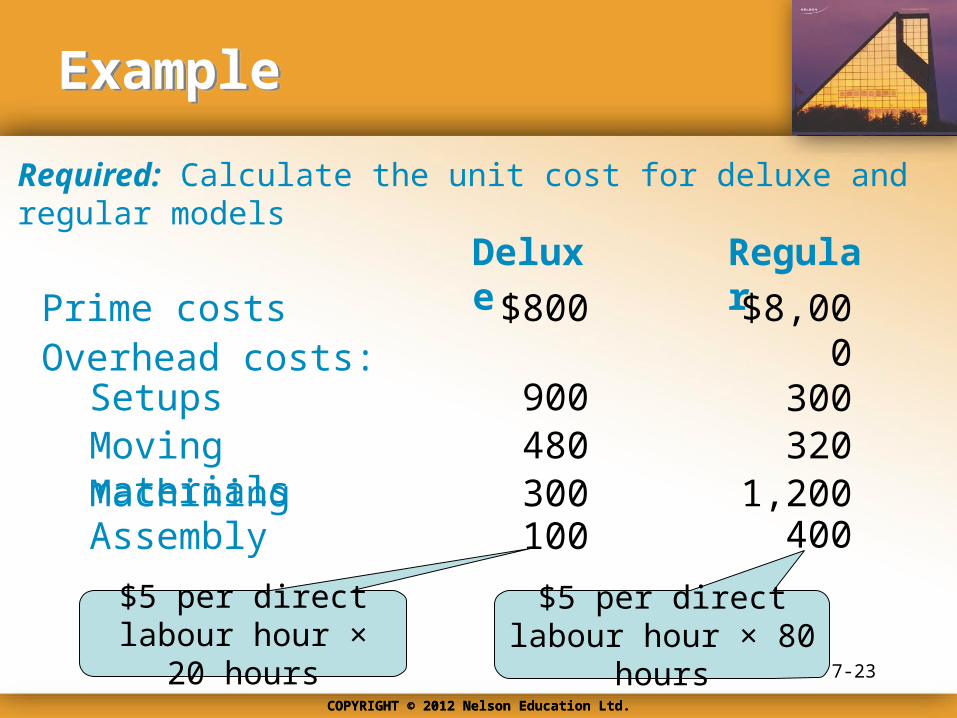
Required: Calculate the unit cost for deluxe and regular models
Overhead costs:
Deluxe Regular
$8,000
Setups 900
Prime costs $800
$5 per direct labour hour × 80 hours
300Moving materials 480 320Machining 300 1,200Assembly 100 400
7-23
$5 per direct labour hour × 20 hours

COPYRIGHT © 2012 Nelson Education Ltd.COPYRIGHT © 2012 Nelson Education Ltd.
ExampleExample
Required: Calculate the unit cost for deluxe and regular models
Overhead costs:
Deluxe Regular
$8,000
Setups 900
Prime costs $800
300Moving materials 480 320Machining 300 1,200Assembly 100 400
$2,580 $10,220Total manufacturing costs
$10,220 ÷ 100 units = $102.20 per unit 7-24
$2,580 ÷ 10 units = $258 per unit

OBJECTIVE OBJECTIVE 22
Explain how an activity-based costing system
works for product costing

COPYRIGHT © 2012 Nelson Education Ltd.COPYRIGHT © 2012 Nelson Education Ltd.
Identifying Activities and Their AttributesIdentifying Activities and Their Attributes
Activity Dictionary Lists the activities in an organization along with some critical activity attributes
Activity Attributes Financial and nonfinancial information items that describe individual items
7-26

COPYRIGHT © 2012 Nelson Education Ltd.COPYRIGHT © 2012 Nelson Education Ltd.
Key Questions to Identify ActivitiesKey Questions to Identify Activities
1.How many employees are in your department?
2.What do they do?
3.Do customers outside your department use any equipment?
4.What resources are used by each activity?
5.What are the outputs of each activity?
6.Who or what uses the activity output?
7.How much time do workers spend on each activity? Time on each activity by equipment?
7-27

COPYRIGHT © 2012 Nelson Education Ltd.
Assigning Costs to ActivitiesAssigning Costs to Activities
• Must determine how much it costs to perform each activity– Requires identification of resources being consumed
• labour, materials, energy, and capital– Cost of resources is found in general ledger– Resources must be assigned using driver tracing
• Work distribution matrix– Used to assign labour resources
7-28
COPYRIGHT © 2012 Nelson Education Ltd.COPYRIGHT © 2012 Nelson Education Ltd.
Resource DriversResource Drivers
Factors that measure the consumption of resources by activity
7-29
COPYRIGHT © 2012 Nelson Education Ltd.COPYRIGHT © 2012 Nelson Education Ltd.
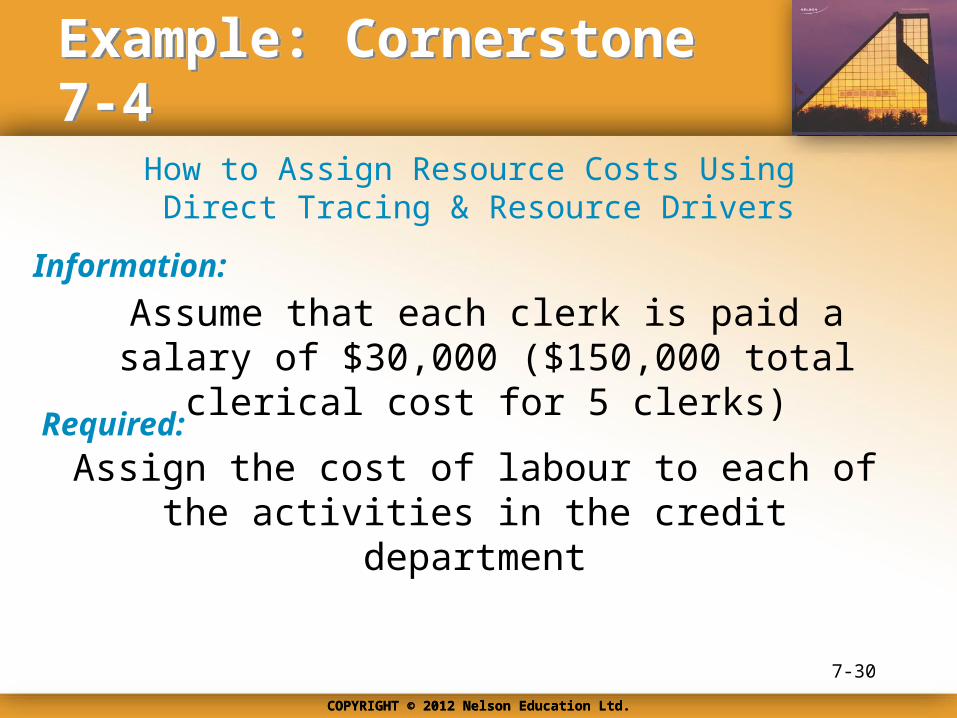
How to Assign Resource Costs Using Direct Tracing & Resource Drivers
Example: Cornerstone 7-4Example: Cornerstone 7-4
Assume that each clerk is paid a salary of $30,000 ($150,000 total clerical cost for 5 clerks)
Assign the cost of labour to each of the activities in the credit department
Information:
Required:
7-30
COPYRIGHT © 2012 Nelson Education Ltd.COPYRIGHT © 2012 Nelson Education Ltd.
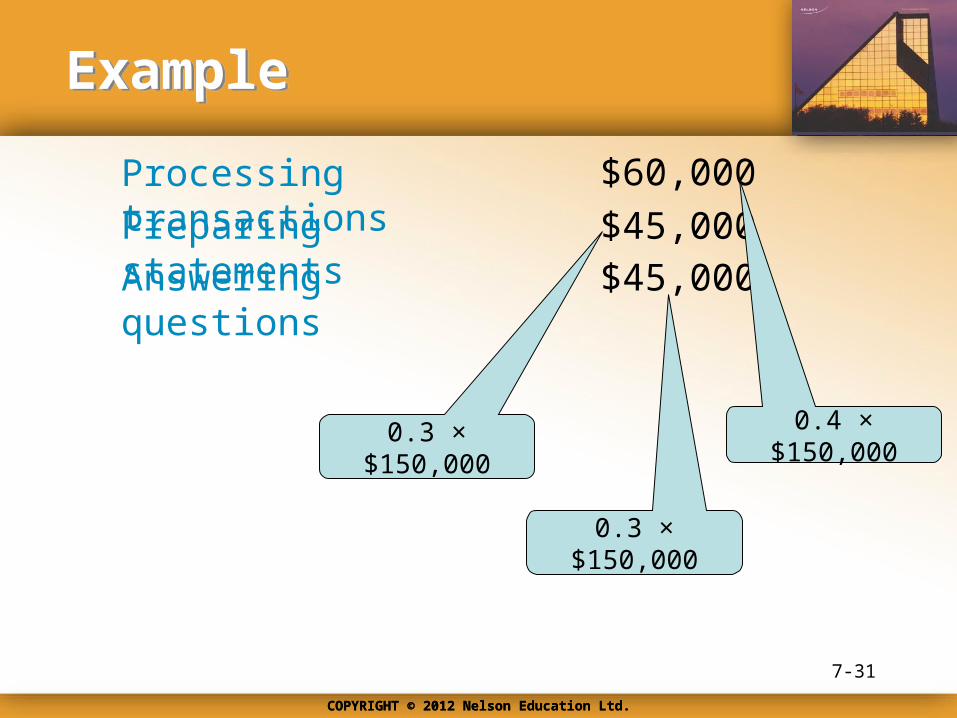
ExampleExample
Processing transactions $60,000
0.3 × $150,000
Preparing statements $45,000$45,000Answering questions
7-31
0.4 × $150,0000.3 × $150,000

COPYRIGHT © 2012 Nelson Education Ltd.COPYRIGHT © 2012 Nelson Education Ltd.
Assigning Costs to ProductsAssigning Costs to Products
Predetermined activity rate x
Usage of the activity (as measured by activity drivers)
To calculate this rate, the practical capacity of each activity must be
determined
7-32

OBJECTIVE OBJECTIVE 33
Describe activity-based customer and
supplier costing

COPYRIGHT © 2012 Nelson Education Ltd.
Activity-Based Customer CostingActivity-Based Customer Costing
• Customers are cost objects of fundamental interest
• Customer management can produce significant gains in profit
• Customers can consume customer-driven activities in different proportions
• Assigning costs of customer service to customers the same as assigning manufacturing costs to products
7-34

COPYRIGHT © 2012 Nelson Education Ltd.COPYRIGHT © 2012 Nelson Education Ltd.
HOW TO Calculate Activity-Based Customer Costs
Example: Cornerstone 7-5Example: Cornerstone 7-5
• Milan Company produces precision parts for 11 major buyers– One large customer
• Accounts for 50% of sales
– Ten smaller customers • Account for 50% of sales• Each purchases parts in roughly equal quantities• Parts orders placed are similar in size
Information:
7-35
COPYRIGHT © 2012 Nelson Education Ltd.COPYRIGHT © 2012 Nelson Education Ltd.
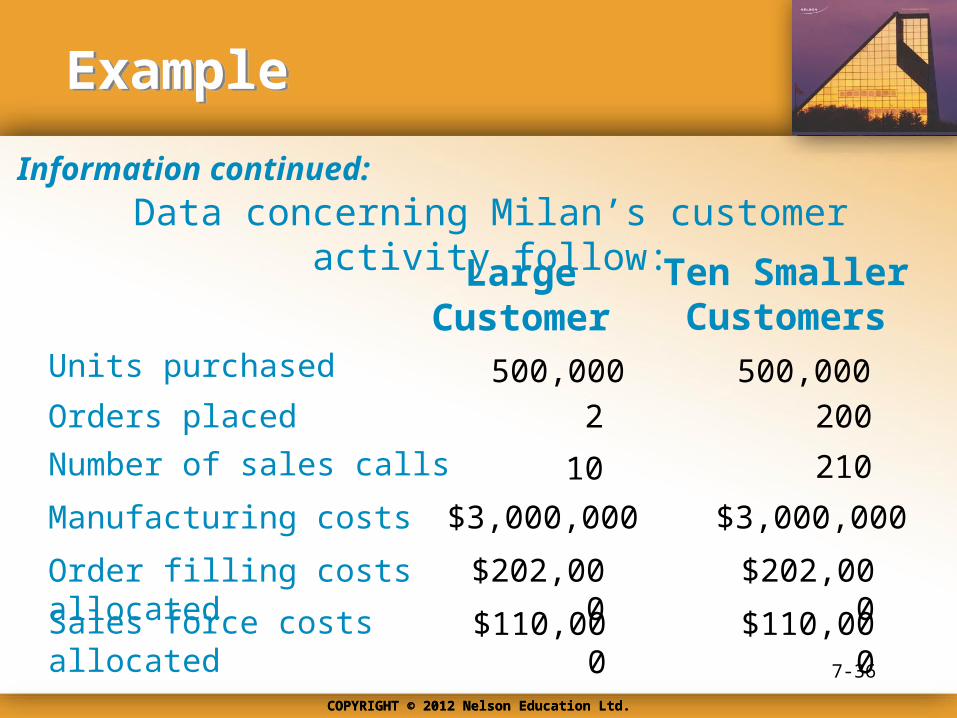
ExampleExample
Data concerning Milan’s customer activity follow:Information continued:
Large Customer
Ten Smaller Customers
Units purchased 500,000 500,000
Orders placed 2 200
Number of sales calls 10 210
Manufacturing costs
Order filling costs allocated
Sales force costs allocated
$3,000,000 $3,000,000
$202,000 $202,000
$110,000 $110,0007-36

COPYRIGHT © 2012 Nelson Education Ltd.COPYRIGHT © 2012 Nelson Education Ltd.
ExampleExample
Activity Rates
Assign costs to customers using an ABC approach
Required:
$404,000/202 orders = $2,000 per order
$220,000/220 calls = $1,000 per call
7-37
COPYRIGHT © 2012 Nelson Education Ltd.COPYRIGHT © 2012 Nelson Education Ltd.
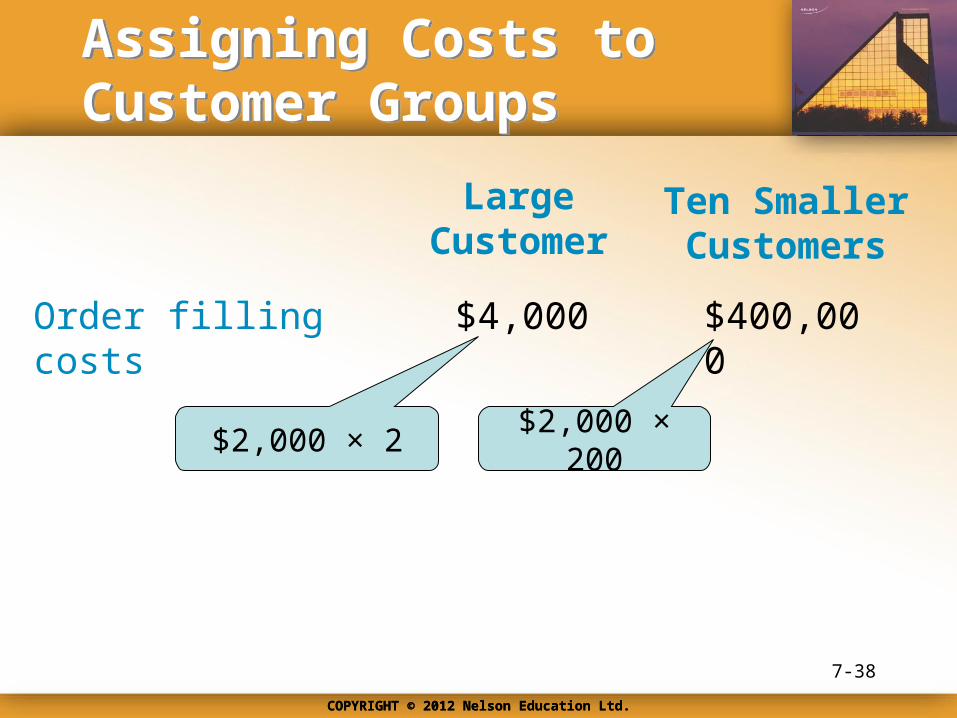
Assigning Costs to Customer GroupsAssigning Costs to Customer Groups
Large Customer
Ten Smaller Customers
Order filling costs $4,000
$2,000 × 200
$400,000
7-38
$2,000 × 2

COPYRIGHT © 2012 Nelson Education Ltd.COPYRIGHT © 2012 Nelson Education Ltd.
Assigning Costs to Customer GroupsAssigning Costs to Customer Groups
Large Customer
Ten Smaller Customers
Order filling costs $4,000 $400,000Sales force costs 10,000
$1,000 × 210
210,000
7-39
$1,000 × 10

COPYRIGHT © 2012 Nelson Education Ltd.COPYRIGHT © 2012 Nelson Education Ltd.
Assigning Costs to Customer GroupsAssigning Costs to Customer Groups
Large Customer
Ten Smaller Customers
Order filling costs $4,000 $400,000Sales force costs 10,000
The large customer costs much less to service that the smaller customers.
210,000
$14,000 $610,000
7-40

COPYRIGHT © 2012 Nelson Education Ltd.
Supplier Costing MethodologySupplier Costing Methodology
• Cost of a supplier is much more than purchase price of the components or materials acquired
• Assigning cost to suppliers is similar to cost assignments for products and customers
7-41

COPYRIGHT © 2012 Nelson Education Ltd.
Example: Cornerstone 7-6Example: Cornerstone 7-6
• Purchasing manager uses two suppliers as sources of Part A1 and Part B2– Murray Inc.– Plata Associates
• Consider two activities:– Repairing products
• Because of part failure (bought from supplier)– Expediting products
• Because supplier is late
Information:
7-42
How to Calculate Activity-Based Supplier Costs

COPYRIGHT © 2012 Nelson Education Ltd.COPYRIGHT © 2012 Nelson Education Ltd.
ExampleExample
Activity cost information and other data needed for supplier costing follow:
Information continued:
I. Activity costs caused by suppliers
Activity Costs
Repairing Products $800,000
Expediting Products $200,000
7-43

COPYRIGHT © 2012 Nelson Education Ltd.COPYRIGHT © 2012 Nelson Education Ltd.
ExampleExample
Information continued:
Murray, Inc. Plata Assoc.II. Supplier data
$20Unit purchase price
80,000Units purchased
Part A1 Part B2 Part A1 Part B2
$52 $24 $56
40,000 10,000 10,000
Failed units
60
380 10 10
Late shipments
1,600
40 0 0
7-44

COPYRIGHT © 2012 Nelson Education Ltd.COPYRIGHT © 2012 Nelson Education Ltd.
ExampleExample
Activity Rates
Determine the cost of each supplier using ABC
Required:
$800,000/2,000 $400 per failed part
Repair rate =
Total failed units1,600 + 380 + 10 +10
=
7-45

COPYRIGHT © 2012 Nelson Education Ltd.COPYRIGHT © 2012 Nelson Education Ltd.
ExampleExample
Activity Rates
Determine the cost of each supplier using ABC
Required:
$200,000/100= = $2,000 per late delivery
Expediting rate
Total late shipments 60 + 40
$800,000/2,000 $400 per failed part
Repair rate ==
7-46

COPYRIGHT © 2012 Nelson Education Ltd.COPYRIGHT © 2012 Nelson Education Ltd.
ExampleExample
Murray, Inc.
$1,600,000Purchase costPart A1 Part B2
$2,080,000
$20 × 80,000 $52 × 40,000
7-47

COPYRIGHT © 2012 Nelson Education Ltd.COPYRIGHT © 2012 Nelson Education Ltd.
ExampleExample
Plata Associates
$240,000Purchase costPart A1 Part B2
$560,000
$24 × 10,000 $56 × 10,000
7-48
COPYRIGHT © 2012 Nelson Education Ltd.COPYRIGHT © 2012 Nelson Education Ltd.
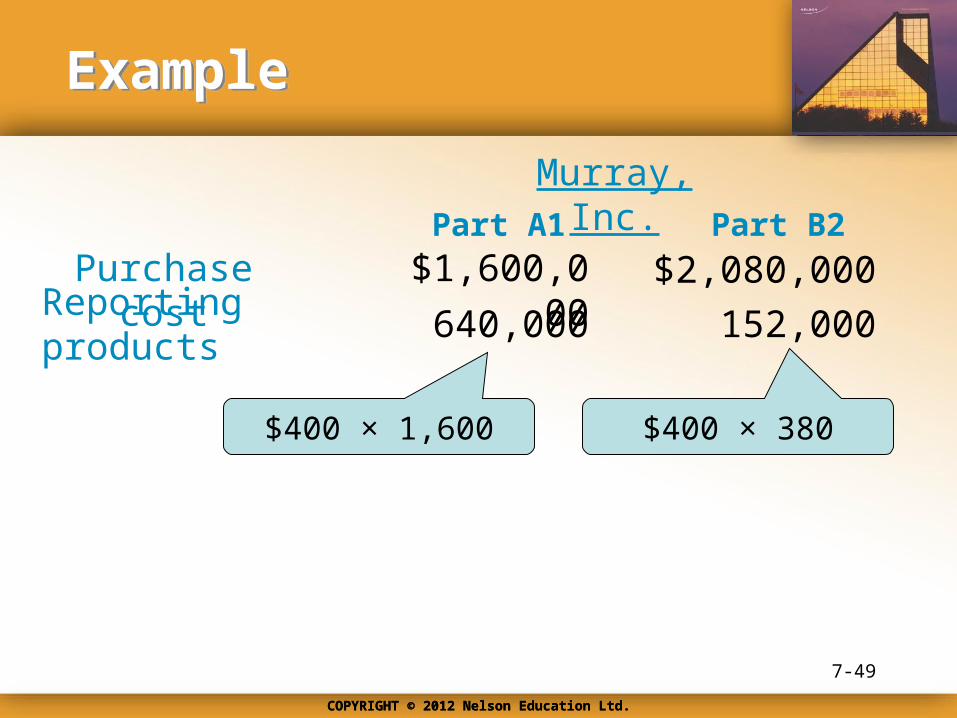
ExampleExample
Murray, Inc.
$1,600,000Purchase costPart A1 Part B2
$2,080,000
$400 × 1,600 $400 × 380
640,000Reporting products 152,000
7-49
COPYRIGHT © 2012 Nelson Education Ltd.COPYRIGHT © 2012 Nelson Education Ltd.
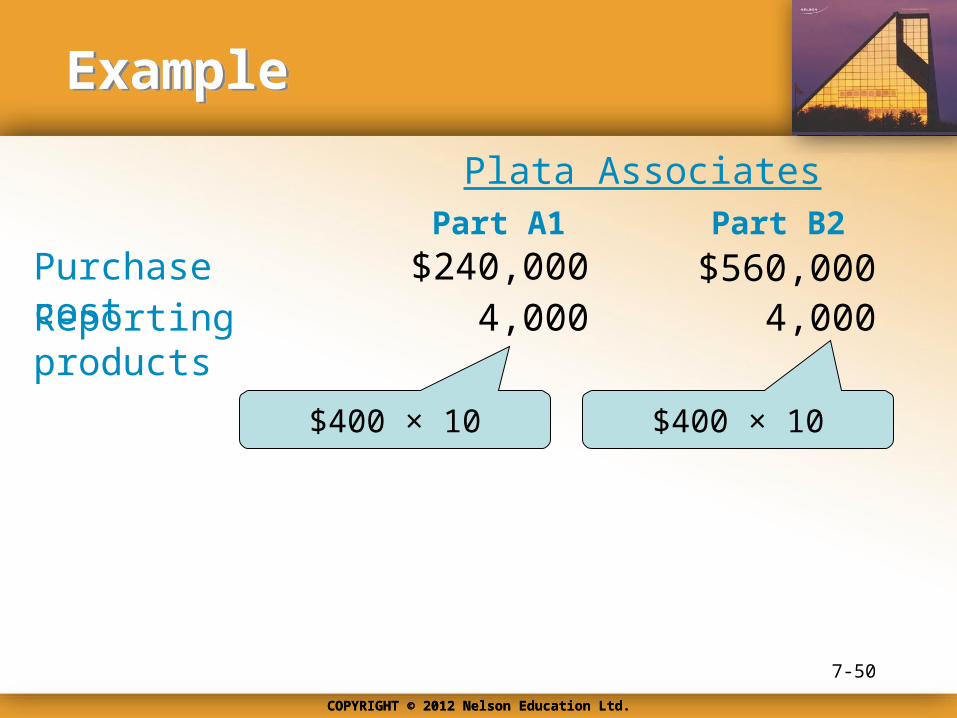
ExampleExample
Plata Associates
$240,000Purchase costPart A1 Part B2
$560,000
$400 × 10 $400 × 10
4,000Reporting products 4,000
7-50

COPYRIGHT © 2012 Nelson Education Ltd.COPYRIGHT © 2012 Nelson Education Ltd.
ExampleExample
Murray, Inc.
$1,600,000Purchase costPart A1 Part B2
$2,080,000
$2,000 × 60 $2,000 × 40
640,000Reporting products 152,000
120,000Expediting products 80,000
7-51

COPYRIGHT © 2012 Nelson Education Ltd.COPYRIGHT © 2012 Nelson Education Ltd.
ExampleExample
Plata Associates
$240,000Purchase costPart A1 Part B2
$560,0004,000Reporting products 4,000
Expediting products 0 0
Plata does not deliver parts late, therefore there are no expediting costs with Plata
7-52

COPYRIGHT © 2012 Nelson Education Ltd.COPYRIGHT © 2012 Nelson Education Ltd.
ExampleExample
Murray, Inc.
$1,600,000Purchase costPart A1 Part B2
$2,080,000
640,000Reporting products 152,000
120,000Expediting products 80,000
$2,360,000 $2,312,000Total costs
Units ÷ 80,000 ÷ 40,000Total unit cost $29.50 $57.80
7-53

COPYRIGHT © 2012 Nelson Education Ltd.COPYRIGHT © 2012 Nelson Education Ltd.
ExampleExample
Plata Associates
$240,000Purchase costPart A1 Part B2
$560,0004,000Reporting products 4,000
Expediting products 0 0
Plata is the better choice with the lowest total unit cost
$244,000Total costs
UnitsTotal unit cost
÷ 10,000
$564,000
÷ 10,000$24.40 $56.40
7-54

OBJECTIVE OBJECTIVE 44
Explain how activity-based management can be used
for cost reduction

COPYRIGHT © 2012 Nelson Education Ltd.
Process-Value AnalysisProcess-Value Analysis
• Focuses on cost reduction instead of cost assignment
• Maximization of system-wide performance– Driver analysis– Activity analysis– Performance measurement
7-56

COPYRIGHT © 2012 Nelson Education Ltd.COPYRIGHT © 2012 Nelson Education Ltd.
Activity Inputs and OutputsActivity Inputs and Outputs
Activity Inputs Resources consumed by the activity in producing its output
Activity Outputs Result or product of an activity
7-57

COPYRIGHT © 2012 Nelson Education Ltd.COPYRIGHT © 2012 Nelson Education Ltd.
Driver Analysis: The Search for Root CausesDriver Analysis: The Search for Root Causes
Activity Output Measure
Number of times activity is performed
Driver Analysis Effort expended to identify those factors that are the root causes of activity costs
7-58

COPYRIGHT © 2012 Nelson Education Ltd.
Activity AnalysisActivity Analysis
• Process of identifying, describing, and evaluating the activities
• It should produce four outcomes:– What activities are done– How many people perform the activities– Time and resources required to perform
the activities– Assessment of the value of the activities
to the organization
7-59
COPYRIGHT © 2012 Nelson Education Ltd.
Value-Added ActivitiesValue-Added Activities
• Activities necessary to remain in business
• Two types:– Value-added by mandate
• Necessary to comply with legal mandate
– Discretionary activities
7-60

COPYRIGHT © 2012 Nelson Education Ltd.COPYRIGHT © 2012 Nelson Education Ltd.
Discretionary Value-Added ActivitiesDiscretionary Value-Added Activities
1. Produces a change of state
2. Change of state was not achievable by preceding conditions
3. Enables other activities to be performed
Three conditions must be met simultaneously for the activity to be
classified as value added:
7-61

COPYRIGHT © 2012 Nelson Education Ltd.COPYRIGHT © 2012 Nelson Education Ltd.
Non-Value Added ActivitiesNon-Value Added Activities
All activities other than those that are absolutely essential to remain in business
Examples:Scheduling
MovingWaiting
Inspecting
Storing
Challenge of activity analysis is to find ways to produce the good without using
any of these activities7-62

COPYRIGHT © 2012 Nelson Education Ltd.COPYRIGHT © 2012 Nelson Education Ltd.
Cost ReductionCost Reduction
Four Ways:
1. Activity elimination
2. Activity selection
3. Activity reduction
4. Activity sharing
7-63

COPYRIGHT © 2012 Nelson Education Ltd.COPYRIGHT © 2012 Nelson Education Ltd.
Example: Cornerstone 7-7Example: Cornerstone 7-7
• Performing warranty work, cost: $120,000• Warranty cost of the most efficient competition is $20,000• Purchasing components, cost: $200,000 (10,000
purchase orders)• Benchmarking study reveals that the most efficient level
would use 5,000 purchase orders and entail a cost of $110,000
Information:Consider the following two activities:
7-64
How to Assess Non-Value Added Costs

COPYRIGHT © 2012 Nelson Education Ltd.COPYRIGHT © 2012 Nelson Education Ltd.
ExampleExample
Determine the non-value-added cost of each activity
Is the activity non value-added or value-added?
Performing warranty work is a non value-added activity
Warranty work
How much is the non value-added cost?
$120,000
7-65

COPYRIGHT © 2012 Nelson Education Ltd.COPYRIGHT © 2012 Nelson Education Ltd.
ExampleExample
Determine the non-value-added cost of each activity
Is the activity non value-added or value-added?
Competitor
Cost of the competitor is a non value-added activity
How much is the non value-added cost?
$200,000 - $110,000 = $90,000
Because the activity is not performed efficiently7-66

COPYRIGHT © 2012 Nelson Education Ltd.COPYRIGHT © 2012 Nelson Education Ltd.
ExampleExample
Determine the non-value-added cost of each activity
Purchasing components is necessary (value-added) but it is not performed efficiently
Actual cost – benchmark study $200,000 - $110,000
$90,000 in non-value added cost
7-67

COPYRIGHT © 2012 Nelson Education Ltd.COPYRIGHT © 2012 Nelson Education Ltd.
Activity Performance MeasurementActivity Performance Measurement
• Assess how well an activity was performed and the results achieved
• Measures are both financial and nonfinancial• Three dimensions:
1. Efficiency
2. Quality
3. Time
7-68

COPYRIGHT © 2012 Nelson Education Ltd.COPYRIGHT © 2012 Nelson Education Ltd.
Efficiency, Quality, & TimeEfficiency, Quality, & Time
Focuses on the relationship of activity inputs to activity outputs
Efficiency
Quality Concerned with doing the activity right the first time
Time Longer times usually mean more resource consumption and less ability to respond to customer demands
7-69

COPYRIGHT © 2012 Nelson Education Ltd.COPYRIGHT © 2012 Nelson Education Ltd.
Example: Cornerstone 7-8Example: Cornerstone 7-8
Assume that a company takes 10,000 hours to produce 20,000 units of a product
What is the velocity?
Velocity = 20,000/10,000 = 2 units per hour
7-70
How to Calculate Cycle Time and Velocity
What is the cycle time?Cycle Time = 10,000/20,000 = ½ hour

COPYRIGHT © 2012 Nelson Education Ltd.COPYRIGHT © 2012 Nelson Education Ltd.
Just-in-Time SystemsJust-in-Time Systems
7-71
• Goods pushed through system by present demand rather than on a fixed schedule based on anticipated demand
• Each operation produces only what is necessary to satisfy the demand of the succeeding operation
• Reduces all inventories to very low levels• Reduces inventory carrying costs

COPYRIGHT © 2012 Nelson Education Ltd.COPYRIGHT © 2012 Nelson Education Ltd.
Environmental Cost ManagementEnvironmental Cost Management
• Environmental costs are also known as environmental quality costs
• Environmentally linked activities are activities performed because poor environmental quality may exist
• Costs are associated with two subcategories: • control activities • failure activities
7-72