Embed Size (px)
Citation preview

Chapter Six
WITHIN CASE ANALYSIS: PART-III
WEST COAST REFINERY AND EMBEDDED CASE OF
ELECTRICAL MAINTENANCE DEPARTMENT
Contents
6.1. CASE FIVE: UPCL, WEST COAST REFINERY (WCR) .................. 196
6.1.1. Status of BSC Implementation in WCR ..................................................... 197
6.1.2. Challenges- The Leaders’ Perspective ....................................................... 200
6.1.3. Challenges-The Employees’ Perspective ................................................... 208
6.1.4. Challenges- The Facilitators’ Perspective .................................................. 215
6.1.5. Factors Driving Employee Buy-in for BSC ............................................... 219
6.1.6. Outcomes of BSC Implementation in WCR .............................................. 220
6.2. CASE SIX: UPCL, WEST COAST REFINERY – ELECTRICAL .........
MAINTENANCE DEPARTMENT (WCR-EMD) ................................ 225
6.2.1. Status of BSC Implementation in WCR-EMD .......................................... 226
6.2.2. Challenges- The Leader’s Perspective ....................................................... 228
6.2.3. Challenges- The Employees’ Perspective .................................................. 235
6.2.4. Challenges – The Facilitators’ Perspective ................................................ 242
6.2.5. Factors Driving Employee Buy-in of BSC ................................................ 246
6.2.6. Outcomes of BSC Implementation ............................................................ 246
6.3. Summary .................................................................................................... 253

196
Chapter Six
WITHIN CASE ANALYSIS: PART-III
WEST COAST REFINERY AND EMBEDDED CASE OF
ELECTRICAL MAINTENANCE DEPARTMENT
West Coast Refinery (WCR) is a Strategic Business Unit (SBU) of UPCL. The refinery
head supported BSC and made considerable effort to implement it in this SBU. Though
WCR achieved only partial success, the Electrical Maintenance Department (EMD) of
WCR achieved considerable success and derived the benefits of BSC. This chapter
discusses implementation of BSC in WCR and, because of significance of successful
implementation, its EMD. The EMD experience gives useful insights into BSC
implementation.
6.1. CASE FIVE: UPCL, WEST COAST REFINERY (WCR)
UPCL’s West Coast Refinery had been striving to augment its refining capacity from
6.5 MMTPA to 9 MMTPA. It continuously enhances capacity by critically analysing its
process and executing various de-bottlenecking projects. On account of its continuous
developmental endeavors, the product mix from WCR has increased from five in 1954
to over thirty at present that includes fuels, lube oil base stocks and other specialty
petroleum products. Nevertheless, there exists a gap between the marketing volumes
and what refinery produces. It needs to step up its production to match with the
aggressive plans of the marketing SBUs. Accordingly, the refining strategy developed
by UPCL has following three basic themes:
1. Increase product sufficiency: Bridge gap between refining and marketing volumes
2. Improve profitability of existing refineries
3. Focus on environmental stewardship
At the time of study, WCR was staffed with 600 managerial and 1000 non-managerial
employees. This average age of the workforce was about 43 years. 64 percent of the
officers had risen from non-managerial ranks. Only 36 percent were qualified
engineers. The functioning of the refinery operations was structured as shown in Figure
6.1. The Figure also includes departments in Maintenance functions. Out of these three

197
departments, one department was found to be doing very good with BSC
implementation, and this department was studied as an embedded case.
Figure 6.1
Organisation Structure of West Coast Refinery
Source: Adapted from the Manual of Organisation Charts Maintained by HR Department
at UPCL
6.1.1. Status of BSC Implementation in WCR
WCR was introduced to BSC in 2005. The consultants, KPMG, designed the scorecards
for the refinery head, function heads, and department heads. The consultants provided
the implementation support by tabulating data and conducting strategic reviews for the
first year. After the consultants left, BSC implementation process almost came to a
standstill. It was revived in the year 2008, with the initiative of the then C&MD and
support of the BSC facilitator. The revised scorecard of the SBU was developed by the
refinery top management team. Functional teams, too, redesigned their scorecards in
line with the revised refinery strategy and scorecards. The scorecards were revised
Head-West Coast Refinery
Head-
Operations
Head-
Maintenance
Head-
Materials
Head-
Technical
Head-
Projects
Head-
HR
Head-
Finance
Head-
Information
Systems
Confidential Secretary
Head –
Refinery
Safety
Head Electrical
(WCR-EMD)
Head Instrumentation Head Rotary
198
again after the annual review. The performance drivers and causal relationships were
better understood after a year’s use. Accordingly, the SBU strategy map for the year
2010-11, as shown in Figure 6.2 was a modified version of the BSC.
Figure 6.2
Balanced Scorecard of West Coast Refinery
Boundary
Management
Enabling
Work Environment
Product Quality,
Quantity, Availability
Value
Additions
Strategic
Themes2. PROFITABILITY
Project
Management
Customer
Financial /
Fiduciary
Internal
Processes
Capability
Building
Technical & EI - Competencies
Enhanced Plant
Reliability
Accident Free
Refinery
Benchmarking
Key Processes
1. SHE 3. CSR – Refinery
Leadership
Development
SHE
Compliance
Supply & Operations
Management
Contract
Management
F1 F2
L2
L4
L1
Refinery
Image
F3
C1
IT / Technology
Integration
L3
P3 P4
P7P6
P5
P2P1
Source: Adapted with permission from BSC documents maintained with SBU
Head of West Coast Refinery
The refinery scorecard was cascaded to the levels of department/team heads. It was
observed that, at the team level, scorecard implementation was better executed with a
committed team leader than in a team which had a less dedicated head. Leadership
failure meant that the scorecards below that level could not be properly implemented.
The study of BSC implementation in this refinery was based on inputs received by
SBU head, BSC facilitator, 14 leaders and another 19 employee responses. Employee
responses were captured in 10 in-depth interviews, 2 group interviews of 3 and 4
employees each 2 FGDs counted as one response each. FGDs consisted of 10 and 8
employees in two different groups. In addition to these inputs, various documents such

199
as regular refinery MIS, review presentations to the governing council (GC) of the
refinery and various reports on accidents, production, emissions etc. were studied. The
stage wise status of BSC implementation as understood from triangulation of data and
information from the inputs, observations, documents and reports is given in Table 6.1.
Table 6.1
Status of BSC implementation in WCR
Mile Stone BSC Implementation Status
I Pre-Implementation Stage : BSC Awareness and Buy-in
1 Awareness about the BSC Concept
Awareness about BSC was good at senior and middle levels. Junior employees were aware of BSC being implemented and that their performance is related to BSC, however, not all of them were confident about designing their scorecards.
2 Leaders Buy-in In spite of the SBU head’s commitment, not all the functional and department heads were in favor of BSC. Some felt it was another management fad that would die its natural death once the C&MD retires. However, a few department heads took it seriously and implemented it in their respective teams.
3 Employee Buy-in Employees were not very enthusiastic about BSC, except those whose department head were committed.
II BSC Implementation Stage: BSC Designing, Cascading, Aligning and Reviewing
1 Designing Strategy Map & BSC Template
SBU and function scorecards were designed with the help of the BSC facilitator. Interested department heads also sought the help of facilitator and designed their scorecards as cascading from the SBU scorecards.
2 Cascading Technically, refinery scorecard was cascaded to line and support functions, and to the department heads and KPIs of the team members followed from the department BSC with some variations.
3 Alignment with Vision & Strategy
Owing to the emphasis placed by the SBU head on BSC and regular quarterly reviews, strategy was often discussed and necessary modifications in alignments were made.
4 BSC Review The SBU head conducted regular quarterly reviews in which all functions including support functions participated. These reviews evaluated the strategic performance and paved the way for future approach.
P
P
S
S
S
P
P

200
Mile Stone BSC Implementation Status
III Post BSC Implementation – Sustenance Stage
1 Adapting BSC to Modified Strategy
Irrespective of the fact that some leaders were not truly convinced with BSC, all of them adapted their respective scorecards to the modified strategy at the yearend as the SBU head was serious and committed to BSC implementation.
2 Integrating BSC as an Ongoing Management Process
BSC could get integrated in the functions and teams in which the heads took the initiative to implement it. In other cases, the implementation was more of transactional nature.
Successful Partially Successful Not Successful
Source: Triangulated information from BSC documents, presentations, and from
interviews of leaders, facilitators and employees.
6.1.2. Challenges- The Leaders’ Perspective
WCR refinery had a full cycle of implementation- from designing of the scorecard,
through regular reviews to annual strategic reviews. Though everyone seem to
appreciate the concept of BSC, some leaders and employees believed that, in the given
culture of the company, it was not possible to implement BSC in its true spirit. Some
teams however, could do well with BSC implementation. Nevertheless, they too faced
several challenges. Table 6.2 lists the set of challenge faced by the leaders at WCR.
Table 6.2
BSC Implementation Challenges – The Perspective of Leaders in WCR
Challenge Category Challenging Factors Severity
I Developing an Appropriate WCR Business Strategy
1 Understanding Macro Business Scenario
2 Identifying Strategic Objectives
3 Identifying Strategic Competencies
4 Business Foresight
5 Resource Availability
6 Understanding and Designing of Scorecards
S
P
S P N
L
M
L
M
M
L

201
Challenge Category Challenging Factors Severity
II Designing Balanced Scorecard, Cascading and Aligning
7 Competence and Commitment of the BSC Facilitator
8 Involvement and Support of BSC Facilitator
9 Dissemination and Cascading of Scorecards
10 Bringing Alignment to Become Strategy Focused
11 Strategic Networking
III Structural Inadequacies of BSC
12 Validating Causal Relationships
13 Finding BSC Framework Not Enough for Achieving Objectives
IV Inspiring and Engaging the Leaders and Employees in the Pursuit of Business Results
14 Personal Involvement – Leaders’ Own Buy-In for Strategy and BSC
15 Managing Employee Buy-In
16 Instilling Hope and Optimism
17 Appealing to Intrinsic Motivation
18 Developing and Nurturing Relationships
19 Developing Positive Work Environment
20 Institutionalising Work Systems
21 Employee Placements
22 Transfers
23 Objectivity in Performance Reviews
24 Coaching and Mentoring Leaders and Employees
25 Ensuring Value Based Management
26 Political Interferences
N
N
M
M
M
L
H
H
H
H
H
H
H
M
M
M
M
M
H
M

202
Challenge Category Challenging Factors Severity
V Developing Internal Business Capabilities
27 Proactive Learning Initiatives linked with Strategy to Build People Competencies
28 Adopting New Technologies Proactively
VI BSC Reviews 29 Ongoing Parallel Reviews
30 Avoiding BSC Format for Reviews
VII Change Management 31 Structures and Policies
32 Being a PSU
33 Managing Resistance to Change
High Challenge Moderate Challenge Low Challenge No Challenge
1. Developing an Appropriate WCR Business Strategy
1. Understanding the Business Scenario: WCR’s top management had a very clear
vision which they shared with team heads and employees. According to their
strategy, internal business processes needed improvements to enhance the
operational efficiency of the refinery.
2. Identifying Strategic Objectives: In view of the macro refinery scenario, four
strategic objectives were identified: increasing product sufficiency, improving
profitability, environmental stewardship and world class R&D.
3. Identifying Strategic Competencies: Identification of required strategic
competencies for achieving operational excellence was done by the leaders
themselves based on their experience and use of competency mapping tools.
4. Business Foresight: Senior and middle management discussed business scenarios
and strengths and weaknesses of the refinery. They endeavored to take timely and
prudent decisions accordingly.
5. Resource Availability: Required resources for strategy implementation were
identified and made available in spite of the low profits generated by WCR.
N H M L
M
M
M
M
H
H
H

203
II. Designing Balanced Scorecard, Cascading and Alignment
6. Understanding and Designing of Scorecards: The refinery top management team
developed good understanding of the concept with the help of the facilitator.
7. Competence of the BSC Facilitator: The competence, commitment and drive of
the facilitator were acknowledged by all. One of the leader mentioned:
She has put in immense amount of effort conducting workshops, clarifying
doubts, and helping every person gain confidence in the concepts. She not
only educated us but also created enthusiasm for BSC.
8. Commitment and Support of BSC Facilitator: BSC design workshops were
conducted for all the teams and the facilitator encouraged them take ownership and
responsibility for the process. A function head mentioned:
One very good thing she did was that even though she allowed us all the
flexibility of choosing our objectives and targets; she would question us
about how this would help us achieve refinery strategic objectives. She did
not allow the focus to waver even for a second.
9. Dissemination and Cascading of Scorecards: The leaders could implement
cascading and implementation of BSC one level below them. Further, it depended
upon the leader in the next level to take BSC forward with his team members. In
certain teams cascading happened till the last officer, however, in most teams
cascading was not explicitly done. Only relevant goals and targets passed on to the
employees for setting yearly goals and targets.
10. Bringing Alignment to become Strategy Focused: The scorecards of all
employees were technically aligned with refinery strategy. The support functions
also were suitably aligned. In reality, however, issues did come up with respect to
interdependencies and internal conflicts.
11. Strategic Networking: The Leaders understood the necessity and importance of
upgrading knowledge, networking and benchmarking. Committees were formed
comprising members from across the industry, for example, to share best practices
and resources for refinery maintenance.

204
II. Structural Inadequacies of BSC
12. Validating Causal Relationships: Lead and lag objectives were carefully chosen
based on experiential knowledge of the senior people and in the context of the
current situation. Even then, the need was felt for understanding the variables better.
13. Finding BSC Framework Not Enough for Achieving Objectives: The Leaders
felt that it was necessary to think beyond the framework to make the tool more
impactful.
III. Inspiring and Engaging the Leaders and Employees in the Pursuit
of Business Results
14. Personal Involvement – Leaders’ Own Buy-In for Strategy and BSC: Some of
the leaders could not be completely convinced about the feasibility of implementing
BSC even though they found the concept appealing. They even doubted if the ‘top
management themselves really believed in the strategy’ that they were talking about.
15. Managing Employee Buy-In: Talking about approaches adopted by the leaders to
get the employees involved in BSC implementation, one of the team heads who
implemented BSC said:
Selling the concept to employees was difficult. What we did is that we
conducted workshops with the help of our BSC facilitator, and also involved
them in the designing of the team scorecard. While each one participated,
they felt their opinion, knowledge and experience were being valued and
they were part of decision making. They felt good about it, and that’s how
we tried selling the concept to them.
16. Instilling Hope and Optimism: Some leaders at WCR were highly negative about
the successful implementation considering the current cultural realties and other PSU
specific constraints. Some others opined that it may take a long wait and much
perseverance. However, a few of them believed that implementing BSC can be the
way out from the problems they were facing. These leaders along with their team
created a plausible vision and introduced many initiatives which increased hope and
enthusiasm within the team.
17. Appealing to Intrinsic Motivation: Very few leaders could actually appeal to
employees’ intrinsic motivation to implement BSC. The one who succeed fairly said:

205
A leader can inspire his team only when he himself is self motivated and is
leads from the front. One has to dirty his own hands to see to it that all
other people are also working.
18. Developing and Nurturing Relationships: Leaders seemed to be burdened under
work pressures and could not really invest much time in developing bonds. Besides,
it needed an emotional adeptness to develop strong relationships. One leader
explained:
In order to create an enabling and happy work environment, I became
conscious about my emotional quotient. Workshops on Emotional
Intelligence really helped.
19. Developing Positive Work Environment: It was a challenge for the leaders.
Gradually, they started taking initiatives and some positive changes were visible.
The SBU heads observed that:
The workplace was ridden with conflicts […]. It was difficult to expect
support from the others. […]. The joint reviews were initially dominated
by debates, discussions, excuses and blames when the team could not
achieve its objectives. Gradually, thoughtfully coordinated discussions,
helped them realise and appreciate each others’ difficulties and enhanced
intra-team collaboration.
20. Work Systems: Indicating the existing lacunae in some of the systems, a leader
mentioned:
BSC highlighted the existing gaps in the systems and the need to strengthen
them.
21. Employee Placements: Leaders felt they had little choice in deciding the
composition of their team. Also, some of the employees were working in shifts for
several years and were not exposed to recent development and changes.
22. Transfers: Leaders were apprehensive when the employees they trusted the most
and coordinated with were transferred. They had to groom the new entrants and
make effort to get the buy-in of the newcomers.
23. Objectivity in Performance Reviews: Ensuring objective reviews and specific
accountabilities was a challenge when it required team work and especially when
people worked in shifts. It was not easy to assign accountability. A leader explained
this problem with a real life example. He said:

206
When officers are working in shifts, it becomes very difficult to evaluate
and hold an individual accountable for a success or failure. For example,
if an officer does not handle his shift well, may be the ill effect of it would
follow in the next shift. The officer in the next shift would be struggling to
solve the problem. The productivity in his shift would be minimal. Thus, if
the measure of performance for the officer is productivity in his shift, then
the officer who tried to resolve the problems that actually originated in an
earlier shift at the cost of his own output would actually get a lower rating
than the officer who didn’t even look after preventive measures during his
shift. It is wrong and unfair
24. Coaching and Mentoring Leaders and Employees: There were no formal
coaching and mentoring processes. In the absence of any guidance, employees and
managers tried to resolve issues in their ways. A department heads observed that:
Counseling and coaching were intangible benefits that came out of BSC
implementation.
25. Ensuring Values Based Management: Practicing values in day to day
transactions and interactions is an important prerequisite for developing faith in
leadership and an enabling work culture. This challenge is obvious in the following
remark of a senior leader:
With complete faith in the top management and commitment to BSC
implementation, I shared all problems in my function and expected that
jointly a solution would be worked out. […]. However, when people use
these data and problems for settling scores with other colleagues and
seniors, it feels like a breach of trust. In such a situation how can one be
completely honest during reviews?
26. Political Interferences: Some of the function heads highlighted that at times they
felt they could not take prudent business decisions especially when they were
bound by government guidelines to engage only certain government-approved
vendors who usually did not perform well. He said:
First of all there are very few good contractors and vendors in a job like
this. Over and above that if some ministry starts interfering in our
decisions, how can I give a guarantee of when the project would be
completed? At times this kind of interference becomes frustrating.
V. Developing Internal Business Capabilities
27. Building People Competencies Proactively in Line with Strategy & Expected
Business Scenario: With the advent of BSC, leaders could now realise the
competencies necessary for strategy implementation and the gaps that existed.

207
Accordingly, technical and behavioral trainings were organised. Internal
competencies were developed for many of the jobs that were earlier being
outsourced.
28. Adopting New Technologies Proactively: Certain objectives on the scorecard
required new technologies to be introduced. Leaders had to work upon this aspect
very diligently.
VI. BSC Reviews
29. Ongoing Parallel Reviews: While the BSC reviews were being conducted, the
earlier system of the General Council (GC) and Executive Council (EC) reviews
continued. This placed extra demand on time and more efforts from the teams.
30. Avoiding BSC Format for Reviews: BSC framework made it imperative to report
on every area irrespective of the degree of performance. People had been used to
presenting only the positive achievements and hence, they had a tendency to avoid
the format and present only what they wanted the management to see. The Leaders
faced the challenge of getting everyone to report in the required format only.
VII. Change Management
31. Structures and Policies: In view of the new perspectives and strategic objectives,
leaders now had to modify policies, manuals and introduce more relevant structures.
32. Being a PSU: Some leaders observed that the job security, a major characteristic of
PSU, at times worked as deterrent. One senior leader said:
Some people tend to think that they can work in a relaxed mode. Nothing
serious can happen even if they don’t work to their full capacity.
Another leader said that there are several stringent procedures and following it all
takes time. Hence:
In the entire process of planning, they would factor in all inefficiencies and
set their targets accordingly. In other words, if it takes two years to
complete a project in private organisation, a PSU would perhaps plan 4
years for it.
33. Managing Resistance to Change: Changing deeply ingrained habits, beliefs and
the usually accepted way of working was a formidable challenge for the leaders. For
example, over a period of time, people had come to believe that what is said in

208
meetings is not what is actually meant. Usually, only what was followed up was
done. Even in reviews, only the achievements were highlighted. Problems and issues
were never brought up for discussion. Leaders found it very difficult to deal with this
outlook.
6.1.3. Challenges-The Employees’ Perspective
During the interviews, managerial staff also cited several other challenges that they
viewed as impediments to BSC implementation. These are listed in Table 6.3.
Table 6.3
BSC Implementation Challenges – The Perspective of Employees in WCR
SN Challenge Category Challenging Factors Severity
I Understanding of the BSC Concept , Strategy Maps and BSC Template
1 Understanding BSC perspectives - Putting Thoughts in the BSC Format
2 Identification of Strategic Objectives
3 Quantifying Intangibles
4 Forced Irrelevant Objectives & Targets
II Leaders’ Competence, Commitment and Involvement
5 Technical Expertise at Senior Positions
6 Leaders’ Engagement Levels-(Discussing Vision, Strategy and Initiatives with Employees)
7 Supervisor Prioritising on Personal Goals
8 Faith in Leadership – (Perception of Leaders’ Accountability and Transparency )
9 Leaders’ Seriousness About Using BSC – BSC Just a Formality
III Facilitators’ 10 Facilitators’ Competence
H
M
M
M
N
M
N
L
L
N

209
SN Challenge Category Challenging Factors Severity
Competence, Commitment and Support
11 Facilitators’ Commitment and Support
12 Facilitators’ Knowledge of Business Complexities
IV Overall Alignment 13 Alignment of the Organisational Structure
14 Alignment of Support Functions / Other functions
15 Alignment of Policies: Employee Performance Management System (EPMS)
16 Alignment of Training & Development Initiatives
17 Alignment of Budget and Resources
18 Alignment of Rewards and Incentives
V Review Related Challenges
19 Data and Information Availability
20 Time Constraints
21 IT or BSC Software
22 Representation of Operational Complexities
23 Comprehensive Representation of all Work Done
24 Consistent Performance Feedback
VI Cultural and Other Organisation Specific Challenges
25 Communication
26 Information Sharing
27 Decision Making
28 Conflict Resolutions
N
L
H
H
H
M
M
M
H
M
M
M
M
M
H
H
L
M

210
SN Challenge Category Challenging Factors Severity
29 Work Systems
30 Employee Morale
31 Dissemination of BSC to Non-management Staff
32 Perception about Organisational Care
33 Perception about Top Management Sponsorship
34 Perception about Supervisor Dominance
35 Ownership and Responsibility
36 Role Clarity
High Challenge Moderate Challenge Low Challenge No Challenge
As BSC was being implemented, the officers in junior cadre of management came
under tremendous pressure from senior management to give performance. On the other
hand, performance of the non-managerial staff was not regulated through BSC.
Management staff talked about the attitude of the non-managerial staff i.e. technicians
on the field and the administrative assistants. The non-managerial staff disowned
responsibility and accountability and had devised several ways of not being available
during working hours. However, ‘they happily did the job, when on overtime.’ When
the frontline supervisors reported of this challenge, usually they were reprimand by
their seniors for failing in managerial abilities. This was an extremely dilemmatic
position particularly for the frontline officers and managers.
I. Understanding of BSC Concept, Strategy Maps and BSC Template
1. Understanding BSC Perspectives -Putting Thoughts in the BSC Format:
Referring to the understanding of the concept, employees mentioned, ‘Initially it
appeared something really tough, but our facilitator made it very simple and
interesting’
N H M L
N
H
H
M
M
M
M
M

211
2. Identification of Strategic Objectives: During workshop sessions, employees
debated and collectively decided strategic objectives. Arriving at consensus often
took time. Junior Officers however stated that ‘the objectives and targets on their
HRD were selected as advised by their bosses.’
3. Quantifying Intangibles: Deciding how the objectives would be measured was
another challenge. Employees were not used quantitative evaluations and would not
believe that everything could be measured.
4. Forced Irrelevant Objectives and Targets: While objectives were discussed at
senior and middle levels, junior managers had to accept the targets decided by their
seniors. At the same time, the necessity and significance of meeting targets was not
explained to them. Therefore, they carried the impression that the targets were forced
upon them.
II. Leaders’ Competence, Commitment and Involvement
5. Technical Expertise at Senior Positions: Employees observed that their leaders
were capable and had wide experience in refining processes and technology.
6. Leaders’ Engagement Levels- Discussing Vision, Strategy and Initiatives with
Employees: Senior leaders spoke about the SBU vision and strategic objectives.
However, these were not referred to by middle and junior managers.
7. Supervisor Prioritising on Personal Goals: None of the employees interviewed
raised this subject. What was clear was their understanding that, ‘Goals and targets
of employees were clearly derived from the SBU and team balanced scorecard.’
8. Faith in Leadership – Perception of Leaders’ Accountability and Transparency:
Some of the respondents observed that their faith in the leadership was misused.
However, such cases were very few.
9. Leaders’ Seriousness About Using BSC – BSC Just a Formality or a Way of
Doing Things: Except for a few leaders who were extremely negative about BSC,
most leaders attempted BSC implementation. Only a few out of them could actually
do it well and achieve success.

212
III. Facilitators’ Competence, Commitment and Support
10. Facilitators’ Competence: Employees found the facilitator as a very competent
person who could clarify all issues and doubts.
11. Facilitators’ Commitment and Support: The following quote summarises the
common observation of employees:
The facilitator was deeply involved, committed and very competent. She
was approachable and in a position to facilitate important discussions
with top management. She was the bridge between the top management &
the juniors.
12. Facilitators’ Knowledge of Business Complexities: In spite of not having a
technical background, the facilitator worked hard to understand the technicalities and
the complexities of the operations. Thus, she was able to address issues and
problems effectively.
IV. Overall Alignment
13. Alignment of Organisational Structure: Employees mentioned overlapping of
responsibilities. Some teams had to be restructured to better align them with
strategic objectives.
14. Alignment of Support / Other Functions: Though the support functions were
technically aligned with SBU BSC; in practice, support was not up to the
expectations. Contractors, vendors and even non-managerial staff were not
sufficiently in step, and hence, each activity took prolonged time and a number of
follow ups were required.
15. Alignment of Policies - Employee Performance Management System (EPMS):
KPIs goals and targets template was aligned to have goals ‘in line with the SBU
and team scorecard.’ However, the system of moderating performance ratings
caused confusion and led to employee dissatisfaction as they were unable to
understand why their performance ratings were downgraded even when their
supervisors considered it good. There was no reward mechanism.
The appraisal and bell curve has vitiated the reward & incentive program completely.
16. Alignment of Training & Development Initiatives: Understanding of the causal
relationship between the lead and lag factors facilitated the identification of relevant

213
trainings that the team members shall receive in order to bridge the competency
gaps.
17. Alignment of Budget and Resources: Though budgets and other resources were
aligned, they were not easily available. Competent and experienced manpower, an
important resource was an issue in certain departments, especially projects.
18. Alignment of Rewards and Incentives: Technically, employee incentives and
performance related pay was linked to the employee performances rating and thus,
aligned with the EPMS. Employees perceived reward mechanism as biased.
V. Review Related Challenges
19. Data and Information Availability: The scorecard manager had to follow
constantly to acquire the data required for reporting. The reporting involved a
considerable amount of data and information collation outside the existing ERP and
Maximo systems as many new measurement parameters particularly with respect to
measuring non-tangible objectives in L&G perspective, had come up on account of
BSC which were not already being measured through these software.
20. Time Constraints: The employees found that the task of information gathering and
collating took a lot of time which put pressure on their already tight schedules. ‘This
ate into a lot of their working hours.’
21. IT or BSC Software: Employees strongly felt that BSC should have been
automated. Having a real time data flow and a dashboard could have got them more
focused. Their time and energy they spend collating data and preparing
presentations could then have been invested in improving process and implementing
initiatives necessary for strategy implementation.
22. Representation of Operational Complexities: Usually, the attempt of the
presenter in all the reviews was to highlight the positives only as they knew that a
negative report would impact their performance appraisals. Hence, problems and
issues were hidden most of the time. Only a few leaders presented their reports in
the spirit that BSC had intended.
23. Comprehensive Representation of all Work Done: Employees felt that they had
achieved a lot more than what they were required to as listed in their scorecards.
24. Consistency in Performance Feedback: There were mixed opinions on employee
performance reviews. A junior officer, who had joined recently, said:

214
I receive no feedback on my KPIs, targets, goals. I do not know from my
appraisal what my strong points are and where I have to improve.
On the other hand some of the other officers, who too had joined recently,
mentioned that ‘The performance feedback serves mostly as a coaching exercise
and helps to improve our job performance’. It was observed that the teams wherein
the team head had ensured cascading of BSC to the last employee; they had also
ensured regular review and performance feedback.
VI. Cultural and Other SBU Specific Challenges
25. Communication: Generally, communication and sharing of information was an
issue across the hierarchy.
26. Information Sharing: Information flow happened only during review meetings. It
seemed to be a big challenge. An employee’s frustration is evident from his
response mentioned below:
If so much is to be achieved in such a less time, why is it that is our bosses
are not talking about it every day. We are coming to know about it through
this workshop, and why not them. My team has such a big role in this, but
we cannot achieve it by the given deadline as we have had no
communications on the subject and we have not started any work on this
by now.
27. Decision Making: The projects team was unhappy with the frequent and large
changes in the scope of the project even when the projects had made substantial
progress. It actually depended a lot on the leadership.
28. Conflict Resolutions: The following employee response summarises the general
feelings of the employees about follow up on jobs and conflicts:
Almost fifty percent of our time goes in following up and resolving
conflicting situations.
29. Work Systems: Even though the work systems were clearly defined, they were not
always strictly followed.
30. Employee Morale: In the face of conflicts and usually on account of EPMS,
employee morale used to get affected adversely.
31. Dissemination of BSC to Non-Management Staff: Non-managerial staff was not
involved in BSC implementation till then. Hence, they could not relate to the
importance of strategic vision and objectives. Additionally, they were unionised
215
staff and had the tendency to bargain for or negotiate the terms for any work that
they were asked to do. Consequently, the officers who were working in various
operational positions, particularly junior managers, found it difficult to get the
cooperation of unionised staff. A change of outlook was essential.
32. Perception about Organisational Care: EPMS, extra workload and managers’
approach at times made employees feel that they were not being respected and
looked after. This however, started changing gradually, with the introduction of
BSC.
33. Perception about Top Management Sponsorship: At times, the employees
wondered if the top management was actually sincere about BSC implementation.
There were delays and there was no monitoring and follow up action.
34. Perception about Supervisor Dominance It was not domination by the boss, but
more of the employees’ respect for him that was evident from the following quote:
Opposition to the authority seemed not very much acceptable in the
culture of UPCL. They waited for instructions from top. Only that which
was being followed up from the top was getting done.
35. Ownership and Responsibility: Very few employees regarded this quality and
when it came to BSC implementation, the ownership was usually shifted to the BSC
facilitator.
36. Role Clarity: Roles were clearly defined in the teams implementing BSC. In other
groups, the personnel acted on the instructions of their boss. There were overlaps
and at times, ownership was absent. Some managers intentionally did not clearly
define responsibilities so that their subordinates were kept in a state of uncertainty
and work could be allocated per the whims of the manager.
When implementation got the support of the leader, the employees, too, were
productively engaged in the pursuit of strategic objectives.
6.1.4. Challenges- The Facilitators’ Perspective
The implementation facilitator worked enthusiastically, and spared no effort to
communicate and educate the leaders and employees about BSC. This facilitator’s reach

216
and effectiveness was the best in the team of facilitators. The facilitator listed her
challenges as mentioned in Table 6.4.
Table 6.4
BSC Implementation Challenges The Perspective of BSC Facilitator for WCR
Challenge Category Challenging Factors Severity
I Team Structure and Size
1 Size of the Team
2 Work Load
3 Location of the Team
4 Reporting of the BSC Team
5 Hierarchical Issues
II Role Clarity 6 Accountabilities of the BSC Team
7 Role and Accountabilities of Scorecard Managers
III Competency Development
8 Training of Scorecard Managers
9 Training of Facilitators on BSC Concept and Implementation
10 Competencies to Conduct Training and Workshops
11 Knowledge of Business Complexities
IV Commitment and Ownership
12 Commitment of BSC facilitator
13 Commitment of SBU Heads
14 Leaders’ and Employee Buy-in
V Cultural 15 Communications
16 Enforcement of Decisions
17 Culture of Appeasing the Boss
18 Willingness for the Change
VI BSC Review 19 Reviewing Abilities of the Leaders
20 BSC Software for Information Collation
H
L
H
N
L
N
H
H
L
H
H
H
L
H
M
M
M
M
H
H

217
Challenge Category Challenging Factors Severity
21 Time and Data Constraints
VII Employee Transfers 22 Integrating New Incumbents into BSC
23 Change in Leadership Approach to BSC
High Challenge Moderate Challenge Low Challenge No Challenge
I. Team Structure and Size
1. Size of the Team: The team of BSC facilitators constituted of just five people to
look implementation across the organisation. It was a small team.
2. Work Load: Considering the work required disseminating BSC concepts, train
leaders, etc., more facilitators were required.
3. Location of the Team: BSC team was located at HQO. The facilitator for WCR
chose to base herself in the refinery as it was in the same city as HQO. This helped
her to better manage the implementation.
4. Reporting of the BSC Team: The BSC team reported to the office of Director -
Marketing. The facilitator attached to the refinery also had to intervene in the issues
faced by the marketing division.
5. Hierarchical Issues: The BSC facilitator was a deputy manager and she was
responsible for coordinating with officers who were senior to her- EDs, Directors,
GMs and other senior managers. Often, hierarchical issues became a roadblock.
Nevertheless, she persevered and could overcome the impediments with the
confidence and clarity that she could bring to her work.
II. Role Clarity
6. Accountabilities of the BSC Team: BSC team conducted workshops to build BSC
awareness, explain the concepts and help SBUs design the scorecards. However,
there seemed less clarity about whose accountability it was to ensure BSC
implementation. Most SBU heads and leaders expected BSC teams to take initiatives
and be accountable for BSC implementation.
7. Role and Accountabilities of Scorecard Managers: The role was not clearly
defined and formalised. The understanding was that the facilitator was expected to
collate data and information for the BSC reviews.
N H M L
H
H
M

218
III. Competency Development
8. Training of Scorecard Managers: The scorecard manager was not confident about
BSC. He did not think it necessary to be properly trained as he thought it was not
a part of his regular duties.
9. Training of Facilitators on BSC Concept and Implementation: Facilitator was
given necessary training. She increased her knowledge base by studying on her own.
10. Competencies to Conduct Training and Workshops: Several leaders and
employees had the opinion that the facilitator was ‘too good’ in explaining BSC
concepts.
11. Knowledge of Business Complexities: In spite of her non-technical background,
she familiarised herself with the technicalities and complexities of refinery
operations. Thus she was able to communicate better with the refinery teams and
also properly designed scorecards.
IV. Commitment and Ownership
12. Commitment of BSC Facilitator: The facilitator was fully committed.
13. Commitment of SBU Heads: The SBU head of WCR ensured regular BSC
reviews and encouraged leaders and employees.
14. Leaders and Employee Buy-in: In words of the facilitator:
Team heads and the employees did not seem to be taking enough initiatives
on their own to learn and implement the BSC concept. It appeared that they
did not considerate to be their responsibility to ensuring BSC
implementation. To make sure that people know about BSC seem to be the
accountability of BSC facilitator.
An uninterested team leader can de-motivate even interested and dedicated
employees.
V. Cultural
15. Communications: The facilitator made every effort to reach and educate
employees. She employed various channels to communicate, and even placed all
scorecards and updates on the employee portal. However, she regretted saying:
The employees did not open the BSC websites to update themselves on the
latest happenings’
219
16. Enforcement of Decisions: All decisions taken in the review meets had to be
followed up several times to make sure they get executed.
17. Culture of Appeasing Boss: Even though employees would personally endorse the
concepts of BSC, they would work on it only if they were appropriately instructed by
their immediate boss. Hence, if the team leader was satisfied with superficial results,
nothing could be done to achieve transformational effects.
18. Willingness for the Change: BSC required people to think and do things
differently. Resistance (mostly of the passive kind) on account of fear, unwillingness
to give up the status quo, etc., was evident. The facilitator faced the challenge of
breaking down resistance getting the people to change their way of thinking.
VI. BSC Review
19. Reviewing Abilities of the Leaders: The facilitator and the SBU head brought in
many changes in the review meetings. The SBU head endeavored to change his
reviewing approach and theme wise reviews were put in place wherein the team
together explored the root causes of the problematic areas and contemplated upon the
ways to correct the same.
20. BSC Software for Information Collation: Automating BSC would have resulted
in saving of time and also accurate real time data.
21. Time and Data Constraints: Employees felt the pressure to manage both work
and data flow. Due to manpower constraints, employees were overloaded and
obtaining data in time for the reviews was difficult.
VII. Transfers
22. Integrating New Incumbents into BSC: The facilitator had to put in extra efforts
to train and ensure the buy-in of the new incumbents.
23. Change in Leadership Approach to BSC: When the leaders were transferred,
continuation of BSC implementation depended entirely on the buy-in of the new
leader. Here, too, the facilitator had to put in extra effort to train the new leader.
6.1.5. Factors Driving Employee Buy-in for BSC
It is evident from the above discussions that, while employee buy-in was achieved in
some pockets, overall, there was a considerable degree of skepticism and lack of
220
interest. The study of this case revealed the following factors guiding the employee
buy-in for BSC in the teams that attempted implementation:
1. The leaders’ initiatives to implement BSC ensured that the employees were given the
necessary exposure and training. The leaders’ initiative also motivated employees to
adopt BSC.
2. Employee acceptance and buy-in was easier when they realised the usefulness of the
tool which could help in fair division of work.
3. The employees understood that this tool could bring in necessary improvements in
their working environment. An expectation of positive change was another factor.
4. The most common leading factor for employee buy-in was the employees’
expectation that BSC would bring objectivity in their performance reviews and a just
and fair distribution of rewards and incentives.
6.1.6. Outcomes of BSC Implementation in WCR
a) Transitions in the Working Environment and Employee Behviours
The teams in which leaders were committed and employees followed BSC exhibited a
high degree of enthusiasm and ownership. These teams were optimistic of success.
Transitions as shared by employees in these teams were as under:
1. Leaders and employees referred to Refinery’s strategy more frequently to guide them
in their work.
2. The leaders also began to expect timely work completion and better job performance
from their team members.
3. With the implementation of BSC, employees now have better clarity about their
roles and job deliverables.
4. The team discussed departmental issues during reviews and developed a better
understanding of their issues. Gradually, the business operations were aligned to the
strategic objectives. A sense of direction, purpose and togetherness was achieved. As
one of the respondent mentioned:
We are able to know how our individual jobs are related to objective of our SBU
objective. It gives us a high. Makes us feel better.

221
5. Employees developed better understanding of the contributions of their peers and
were more appreciative of their difficulties as well.
6. The team members appreciated the need and the significance of timely strategy
execution and the necessity to have motivated leaders and employees.
7. Problems were getting resolved at a faster pace.
8. Timely decisions were taken; however this is not true of all teams and for all the
times.
9. Employees were encouraged to improve professional skills, and develop their
competencies in relevant areas.
10. Team spirit was fostered. Team members collaborated in pursuit of their objectives.
The positive transitions however, were evident in very small number of teams. These
teams (e.g. LOBS projects and EMD) also reaped benefits in terms of improved
performance of their team. Such positive transitions at the workplace motivated
employees to work harder and achieve the strategic objectives. The employees also
pointed out that a friendly and amiable work environment, wherein their dignity and
respect was valued, their opinions and involvement was sought, and which was ‘just
and fair’ motivated them to give their best performance.
One of the senior leaders pointed out the importance of leaders’ ability to develop a
complete understanding of the employees and engaging them in the following manner:
Superiors need to know the pulse of their team members […]. A good
understanding of the individuals, knowing what motivates them and how they
react to different stimuli is important. These are essential to getting the
employees engaged and things done.
b) Business Performance Outcomes
Regular reviews of performance and objectives contributed greatly to make WCR a
strategy- focused SBU. The biggest achievements of projects getting complete within
stipulated time and reduction in cost happened because of regular reviews. Delays
reduced from 24 months to on-time completion. Reviews highlighted the problematic
issues and they were dealt with in accordance of the strategic priorities.
Several projects in the refinery were executed at an exceptional pace. Allocation of
work improved and the training modules for skills development was completely

222
overhauled to develop the competencies needed for strategy implementation. Table 6.5
gives the status of achievement against scorecard objectives after two years of
implementation. As the implementation was at a nascent stage, many objectives were
only partially achieved. The transitions had begun to create conditions for the better
performance.
The overall performance of refinery however, did not show significant improvement.
Out of fourteen objectives, only four objectives could be achieved and another five
were partially achieved. Major financial objectives and the two important learning and
growth objectives were not achieved.
Table 6.5
Status on Achievement of Strategic Objectives of WCR (as of December, 2011)
SN Strategic
Theme
Strategic Outcomes Status
1 Accident Free Refinery
Against the target of nil fatal incidents and 80% reduction in number of incidents over the previous year only 46% percent reduction could be achieved.
2 Value Addition by Enhancing GRM and Performance Optimisation
Targeted 1GRM = 0.5$/bbl Achieved = 0.4$/bbl. Deviation by 2back casted value was planned within 5%, which was much more. Similarly, 3MBN value over last year was planned to be improved by10% but actually achieved was much less.
3 Refinery Image WCR was expected to undertake a survey to explore the areas wherein work can be done to build refinery image. A year end survey was to be conducted to assess the outcomes of the image building endeavors. This post implementation survey was to be conducted in quarter four and hence performance details were not available.
1 GRM: Gross Refinery Margin (GRM) is used for measuring the performance of refinery. It is
calculated as the difference between the total value of the petroleum products produced by refinery and the total cost of crude oil and other raw materials.
2 Back Casting Value: Long term planning and daily scheduling of operations in refinery is
done using Linear Programming (LP) model. Back casting on LP model explains the impact of deviations from scheduling in terms of $ value. Also, it helps focus areas that need to be prioritised.
3 MBN Value: In India, the energy performance of refineries is expressed in terms of specific
energy consumptions measured as million BTUs (British Thermal Units) per barrel per Energy Factor (MTBU/BBL/NRGF).
N
P
N

223
SN Strategic
Theme
Strategic Outcomes Status
4 Product Quantity, Quality and Availability
The target was zero deviations in quality and +/-5% in planned supplies. There were complaints about quality and oversupply of LPG, ATF, MS-III and Bulk Bitumen and lower than committed supplies of HSD. Shipments of LSHS were lower due to logistical constraints.
5 Safety, Health and Environment (SHE) Compliance
Target of 100% compliance was met as regards the effluent norms, emission norms and disposal of hazardous wastes.
6 Enhanced Plant Reliability
The target was reduction by 50% of the past five years’ best in the number of power interruptions. This was achieved. Plant Service factors of the manufacturing units was planned to be greater than 95% and the achieved percentage was nearly 98.
7 Project Management
As regards the project management, time and cost overruns were planned to be within 5%. Close review of project progress reduced delays and almost all projects were in time.
8 Contract and Vendor Management
To attract the best vendors, it was decided to engage the best contractors for at least 75% of the contracts. Besides, average time for the entry of contractors was to be reduced to 30 minutes. Arbitration issues or adverse comments from the IEMs were to become zero. All targets were achieved. Entry time became 15 minutes and 91% of the jobs were given to top ten vendors in the field. There were nil adverse comments or arbitration issues.
9 Supply and Operations Management
Refinery plans intermittent shutdown to attend to te maintenance of various refining units. In addition to the plan, sometimes, unplanned shutdowns are decided to attend to an emergent issue. These are usually short duration shutdowns to attend to some specific problem. In a process industry every related person is to be informed about these shutdowns to enable them plan their work accordingly.
Unplanned shutdowns were informed immediately as against the target of 48 hours. However, planned shutdowns could be informed only about 20-25 days in advance whereas the target was to inform 2 months in advance. Besides, two processes could be benchmarked against the target of three.
10 Boundary Management
There were zero adverse reports about the refinery from any statutory authority. WCR had targeted at least five positive media reports; it got seven. There were also frequent interactions with the media.
N
S
S
S
P
S
S

224
SN Strategic
Theme
Strategic Outcomes Status
11 Enabling Work Environment
Another objective was a 10% reduction in the average time taken by support functions to resolve logged issues with the support functions. Limited success success could be achieved. Average response time to logged calls was reduced to 5.19 hours and 99.9% uptime of LAN & WAN was achieved. Suggestions from employees received attention but were not acted upon quickly.
12 Leadership Development
In order to develop leadership skills, it was planned to give challenging assignments to 10% of officers in middle management against which only two assignments were given.
13 IT/Technological Integration
Three manual processes were automated against a target of four. Two new technological know- how were adopted as targeted.
14 Technical and EI Competencies
• 22 employees were trained on Maximo and JDE against the target number of 31.
• As targeted all the 45 identified officers were trained in process simulation (Rector, Energy Analyser and HYSIS/TASC)4.
• 20 officers from operations were trained in OTS against target to cover 100%
• No officer could be certified for project or the API.
• 20% of the officers could be trained on EI against the target of 15%.
Successful Partially Successful Not Successful
Source: Adapted with permission from BSC documents maintained by SBU Head of
West Coast Refinery
There were many small successes; however, the overall performance of refinery did not
show significant improvement. The objectives in the financial perspectives were not
met. Improvements in processes started showing up with partial successes. Out of
fourteen objectives, only four objectives could be achieved completely and another five
were partially achieved.
4 HYSIS: It is refinery process simulation software.
TASC: It is also refinery process simulation software specifically for Heat
Exchangers.
S P N
N
N
P
P

225
6.2. CASE SIX: UPCL, WEST COAST REFINERY – ELECTRICAL
MAINTENANCE DEPARTMENT (WCR-EMD)
At WCR, the Electrical Maintenance Department (EMD) succeeded in disseminating
BSC up till the junior most officers in the management cadre. The team head had just
begun to percolate it to the non-management staff, when he was transferred upon
promotion, and the process reached stagnation.
This team of 15 management and 60 non management skilled workmen comprised of
only a handful of professionally qualified engineers. The average age of the team was
44 years. It operated in all three shifts in looked after all the units of refinery. Figure 6.3
shows how the team was organised:
Figure 6.3
Organisation Structure of Electrical Maintenance Department
Source: Adapted from the Manual of Organisation Charts Maintained by HR Department
at UPCL
Specific personnel were dedicated to look after both the refinery units i.e. Lube
Refinery (LR) which produced lubricants, and Fuel Refinery (FR) which is mainly
concerned with production of petrol and diesel. Separate personnel were assigned for
the maintenance of the Captive Power Plant (CPP) within WCR. CPP generated
Head EMD
Head Electrical -FR Sr.Mgr.-
Electrical
(GFEC)
Head Electrical –
Onsite /CPP
Head Electrical-
DHDS/lighting-
Executive-
DHDS/lighting
Manager -
Electrical
Executive-
Electrical
Executive-
Electrical
Executive-CPP
Executive-
Electrical
Manager-
LR/CPP Maint.

226
electricity in-house in addition to the required power supply from Tata Power. EMD
personnel also looked after the power requirements of Diesel Hydro De-Sulphurisation
(DHDS) unit and Green field Emission Control (GFEC) unit. Both these units are
important from the environmental perspective. DHDS reduces the sulphur content from
effluents and GFEC controls the level of gaseous emissions to protect the environment.
6.2.1. Status of BSC Implementation in WCR-EMD
The team leader applied BSC as a tool to engage his team in pursuit of team objectives.
With the facilitator’s support, he organised several workshops in which, the employees
were involved in developing team vision, objectives and initiatives. Figure 6.4 shows
the scorecard designed by the team.
Figure 6.4
Balanced Scorecard of Electrical Maintenance Department
.
Strategic Objectives - Head Elect Maint
Benchmark
Processes
Statu & EnvirCompliance
Developing Domain & Behavioural
skills
End user
Satisfaction
Safety at Work
Leveraging IT / Maximo
Strategic
Themes
Power Reliability Equipment
Reliability
Inventory
Management
Customer
Fiduciary
Internal
Processes
Capability
Building
Enabling Work Environment
Enhanced Electr
Reliability
Interruption Free
Power supply
GHK /Aesthetics
Maintenance
Cost Reduction
Ensure SHEVendor Mgmt
Vendor
Satisfaction
First Pass Rate
Power Cost
Reduction
Source: Adapted with permission from BSC documents maintained with Team Head of
Electrical Maintenance Department at WCR (now transferred)
The team scorecard was then cascaded to individual scorecards. Brainstorming among
the employees resulted in a number of initiatives being proposed which were then
prioritised on the basis of necessity and available resources. A few of these initiatives
were then selected for implementation. The team leader took upon him the onus of
227
ensuring availability of resources necessary to achieving strategic objectives. He also
ensured training for developing employee competencies and team capabilities.
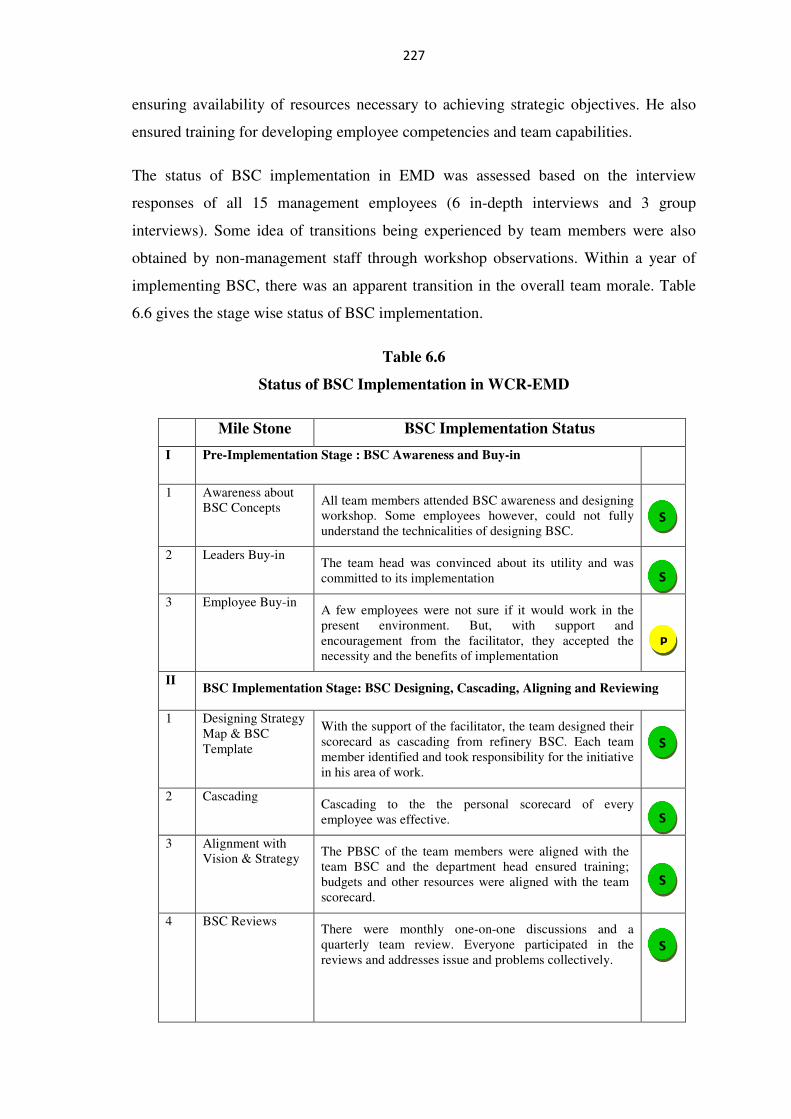
The status of BSC implementation in EMD was assessed based on the interview
responses of all 15 management employees (6 in-depth interviews and 3 group
interviews). Some idea of transitions being experienced by team members were also
obtained by non-management staff through workshop observations. Within a year of
implementing BSC, there was an apparent transition in the overall team morale. Table
6.6 gives the stage wise status of BSC implementation.
Table 6.6
Status of BSC Implementation in WCR-EMD
Mile Stone BSC Implementation Status
I Pre-Implementation Stage : BSC Awareness and Buy-in
1 Awareness about BSC Concepts
All team members attended BSC awareness and designing workshop. Some employees however, could not fully understand the technicalities of designing BSC.
2 Leaders Buy-in The team head was convinced about its utility and was committed to its implementation
3 Employee Buy-in A few employees were not sure if it would work in the present environment. But, with support and encouragement from the facilitator, they accepted the necessity and the benefits of implementation
II BSC Implementation Stage: BSC Designing, Cascading, Aligning and Reviewing
1 Designing Strategy Map & BSC Template
With the support of the facilitator, the team designed their scorecard as cascading from refinery BSC. Each team member identified and took responsibility for the initiative in his area of work.
2 Cascading Cascading to the the personal scorecard of every employee was effective.
3 Alignment with Vision & Strategy
The PBSC of the team members were aligned with the team BSC and the department head ensured training; budgets and other resources were aligned with the team scorecard.
4 BSC Reviews There were monthly one-on-one discussions and a quarterly team review. Everyone participated in the reviews and addresses issue and problems collectively.
S
S
S
S
S
S
P
228
Mile Stone BSC Implementation Status
III Post BSC Implementation – Sustenance Stage
1 Adapting BSC to Modified Strategy
With the transfer of the team head, the process of BSC implementation got disrupted.
2 Integrating BSC as an Ongoing Management Process
During implementation, the team developed a systematic approach to planning their goals based on the team scorecard. This approach continued but the reviews of BSC were suspended.
Successful Partially Successful Not Successful
Source: Triangulated information from BSC documents, presentations, and from
interviews of leaders, facilitators and employees.
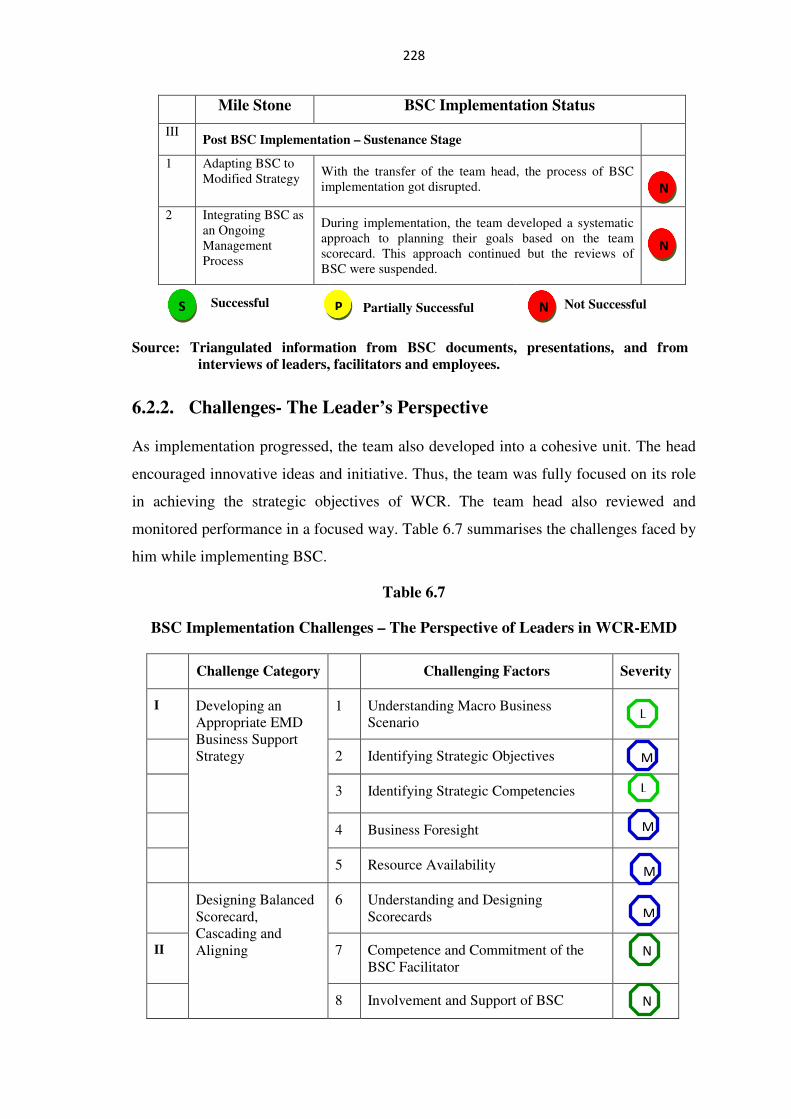
6.2.2. Challenges- The Leader’s Perspective
As implementation progressed, the team also developed into a cohesive unit. The head
encouraged innovative ideas and initiative. Thus, the team was fully focused on its role
in achieving the strategic objectives of WCR. The team head also reviewed and
monitored performance in a focused way. Table 6.7 summarises the challenges faced by
him while implementing BSC.
Table 6.7
BSC Implementation Challenges – The Perspective of Leaders in WCR-EMD
Challenge Category Challenging Factors Severity
I Developing an Appropriate EMD Business Support Strategy
1 Understanding Macro Business Scenario
2 Identifying Strategic Objectives
3 Identifying Strategic Competencies
4 Business Foresight
5 Resource Availability
Designing Balanced Scorecard, Cascading and Aligning
6 Understanding and Designing Scorecards
II 7 Competence and Commitment of the BSC Facilitator
8 Involvement and Support of BSC
N
N
S P N
L
M
L
M
M
M
N
N

229
Challenge Category Challenging Factors Severity
Facilitator
9 Dissemination and Cascading of Scorecards
10 Bringing Alignment to Become Strategy Focused
11 Strategic Networking
III Structural Inadequacies of BSC
12 Validating Causal Relationships
13 Finding BSC Framework Not Enough for Achieving Objectives
IV Inspiring and Engaging the Leaders and Employees in the Pursuit of Business Results
14 Personal Involvement – Leaders’ Own Buy-In for Strategy and BSC
15 Managing Employee Buy-In
16 Instilling Hope and Optimism
17 Appealing to Intrinsic Motivation
18 Developing and Nurturing Relationships
19 Developing Positive Work Environment
20 Institutionalising Work Systems
21 Employee Placements
22 Transfers
23 Objectivity in Performance Reviews
24 Coaching and Mentoring Leaders and Employees
25 Ensuring Value Based Management
26 Political Interferences
V Developing Internal Business Capabilities
27 Proactive Learning Initiatives linked with Strategy to Build People Competencies
28 Adopting New Technologies Proactively
L
L
H
M
L
H
N
H
M
M
L
H
M
M
M
M
H
N
M
H

230
Challenge Category Challenging Factors Severity
VI BSC Reviews 29 Ongoing Parallel Reviews
30 Avoiding BSC Format for Reviews
VII Change Management 31 Structures and Policies
32 Being a PSU
33 Managing Resistance to Change
High Challenge Moderate Challenge Low Challenge No Challenge
I. Developing an Appropriate EMD Business Strategy
1. Understanding Macro Business Scenario: Being responsible for maintenance, the
EMD team was always busy attending to plant operations-related issues. They had
little idea of the overall business environment.BSC gave them to opportunity to
understand the broader issues involved. Once they had understood the WCR
strategy, they came up with initiatives that would help them achieve their goals.
2. Identifying Strategic Objectives: Identifying strategic objectives was difficult
considering the education profile of the team. Seventy percent of the managerial staff
in EMD were diploma holders in a particular trade and had no formal exposure to
managerial or supervisory skills. They had come up in the management cadre by
way of internal promotions.
3. Identifying Strategic Competencies: The team head took initiatives to identify the
competency gaps in the teams that had to be addressed to meet team deliverables.
4. Business Foresight: The team learnt about the importance of foresight and business
prudence in the BSC workshops. The team head admitted that the BSC
implementation has added to his business knowledge.
5. Resource Availability: The leader managed issues related to resource availability.
He could get the required resources with proper planning and justification.
N H M L
M
H
H
H
H

231
II. Designing Balanced Scorecard, Cascading and Aligning
6. Understanding and Designing of Scorecards: Team head observed that, ‘defining
the measures, particularly for the intangibles, was a little difficult task’. Confidence
in designing could be gained after participation in the various workshops conducted
by the facilitator.
7. Competence of the BSC Facilitator: The team head described the facilitator’s
competence and commitment in the following words:
Actually, BSC has been a success in our team because of the perseverance
and initiative of our facilitator. She has put in a lot of effort to clear doubts,
helped people even at the individual levels, encouraged them to overcome
their mental blocks and instilled everyone with enthusiasm and hope […].
The whole team thanks her for giving us such a wonderful tool. Even during
the reviews she helped by ensuring right formats for reviews and guidance
on the right kinds of review questions. In fact, she was more like a coach
and mentor and her guidance was of immense value to us.
8. Commitment and Support of BSC Facilitator: The facilitator was more of a team
member. Not only did she provide support to understand the technicalities of the
concepts, she also helped the team to become more cohesive and enthusiastic.
9. Dissemination and Cascading of BSC: Once the team members understood the
concepts of BSC and its importance, disseminating of the scorecards was not a big
challenge.
10. Bringing Alignment to Become Strategy Focused: The team head worked hard to
his team aligned with strategy by educating the team and getting them focused and
engaged in the pursuit of strategy.
11. Strategic Networking: EMD team head started reaching out to other oil companies
to know the benchmarks in electrical maintenance function and learn new things.
He initiated a forum of maintenance engineers and managers of refineries and
petrochemical companies in the vicinity with a view to collaborate on resolving
issues pertaining to refinery maintenance. As it was the first ever time he was
attempting to network on industry basis, he experienced challenges which he
overcame with effort on self development and support from his function head.

232
III. Structural Inadequacies of BSC
12. Validating Causal Relationships: The leader and facilitator promoted debate and
selected of objectives which were based on experience.
13. Finding BSC Framework Not Enough for Achieving Objectives: The team
leader opined that there must be commitment to the framework of BSC. Without
commitment, no benefits would be derived from the exercise.
IV. Inspiring and Engaging the Leaders and Employees in the Pursuit
of Business Results
14. Personal Involvement – Leaders’ Own Buy-In for Strategy and BSC: The
extent of personal involvement varied in the beginning. But, after a while, when he
was convinced of the benefits and assured of support from the facilitator, he was
firmly committed.
15. Managing Employee Buy-In: As the majority of team members in the team were
old, the team average age being 44 years. About 70 percent of the managerial staff
had risen through the ranks there was some initial difficulty in making the concepts
understood and to obtain their buy-in. The facilitator’s workshops helped them to
understand BSC better and overcome their al apprehensions. The EMD team
members were also impressed by the sincerity of their leader.
16. Instilling Hope and Optimism: Hope and Optimism were instilled by making the
employees see how results and benefits could be achieved by working together to
achieve team objectives. They were also being provided the necessary technical
training to improve their skill sets.
17. Appealing to Intrinsic Motivation: The team head aimed to motivate employees
by raising their self- esteem, increasing satisfaction levels, and comfort.
Accordingly, he endeavored to bring about necessary changes in the functioning of
the department and leaders approach to handling work and people for which he
personally started coaching them. He faced challenges of time and knowledge on
employee coaching.
18. Developing and Nurturing Relationship: Maintaining personal bonds with every
member of the team was challenging. Nevertheless, the team head ensured personal
bonds with all managers and executives. He showed interest in their development.

233
19. Developing Positive Work Environment: With his commitment to building a
positive work environment, s interactions with his team members were regular. He
mentored and guided them to the extent possible. Although he made every effort to
maintain a positive work environment, this was not always in his control.
20. Work Systems: Work systems were put in place and they made it easier to work.
The employees immediately adhered to the systems and followed procedures. The
team head had involved the team members in finalising and setting up the work
systems. Thus, everyone had a stake in following systems.
21. Employee Placements: Although the team leader felt that he had little choice in
selecting his team, he did his best to see that his people were properly deployed.
However, he had no say the hiring process and, nor could he initiate action against
an underperformer.
22. Transfers: The team head was transferred when the results of BSC implementation
had just begun to show.
23. Objectivity in Performance Reviews: Regular performance became the hallmark
of this team. Narrating the difficulties of executing reviews, he said:
Initially, I tried to review performance through monthly e-mails from each
member giving a review of their individual BSC. It didn’t work well as it
was difficult to understand what they intended to say. What they had
written and what they meant was not coming out properly. Now, we have
changed to weekly personal reviews, one- on- one basis; and monthly
reviews which are conducted jointly.
24. Coaching and Mentoring Leaders and Employees: The team head and the
leaders in the team observed that implementation aspect of BSC required them to
coach and guide the employees on technical, behavioral and attitudinal fronts. The
team head felt the need for formal training on coaching for him and other managers
in the team. He pointed out that ‘formal professional inputs’ about coaching and
mentoring the team were the need of the hour.
25. Ensuring Values Based Management: The importance of ‘values’ were
emphasised in the workshops. Since personal values were addressed by the team
head, there was not much challenge in this respect. But some employees felt that
more transparency was required in the moderation process of EPMS.
234
26. Political Interferences: EMD did not face political interferences. Their relation
with the external environment was to the extent of having to fulfill statutory
requirements and timely reporting in that regard.
V. Developing Internal Business Capabilities
27. Proactive Learning Initiatives for Building People: EMD team frequently
referred refinery strategy and scorecard. Accordingly, they prioritised upon the
deliverables of EMD and the necessary capabilities that needed to be developed
among the team members. The knowledge sharing sessions and mentoring by
managers helped the junior officers to enhance their technical skills, health and
behavior related aspects. The team head observed,
Having someone nominated as coach to work with employees and with their
motivation, beliefs and mental models would have been a good idea.
28. Adopting New Technologies Proactively: Procurement of new technology was
not difficult. After some training, the Officers could use it. However, technicians
were reluctant to accept and had to be cajoled to work with new technologies.
VI. BSC Reviews
29. Ongoing Parallel Reviews: Parallel reviews meant more reviews, and the leaders
felt that a lot of productive time was going into participating in so many reviews.
30. Avoiding BSC Format for Reviews: During the initial phases, team members
attempted to avoid using the format and work with the formats they were familiar
with. With time and repeated insistence by management, the reviews began to be
based on BSC format.
VII.Change Management
31. Structures and Policies: The leader introduced structural changes in EMD. He
formed area wise teams that consisted of managerial and non- managerial staff.
Better understanding between the two groups resulted following which
accountabilities were properly defined.
32. Being a PSU: The non- managerial staff-which was unionised- had a mindset
typical of PSU culture. Overcoming this was a problem. The leaders and managers
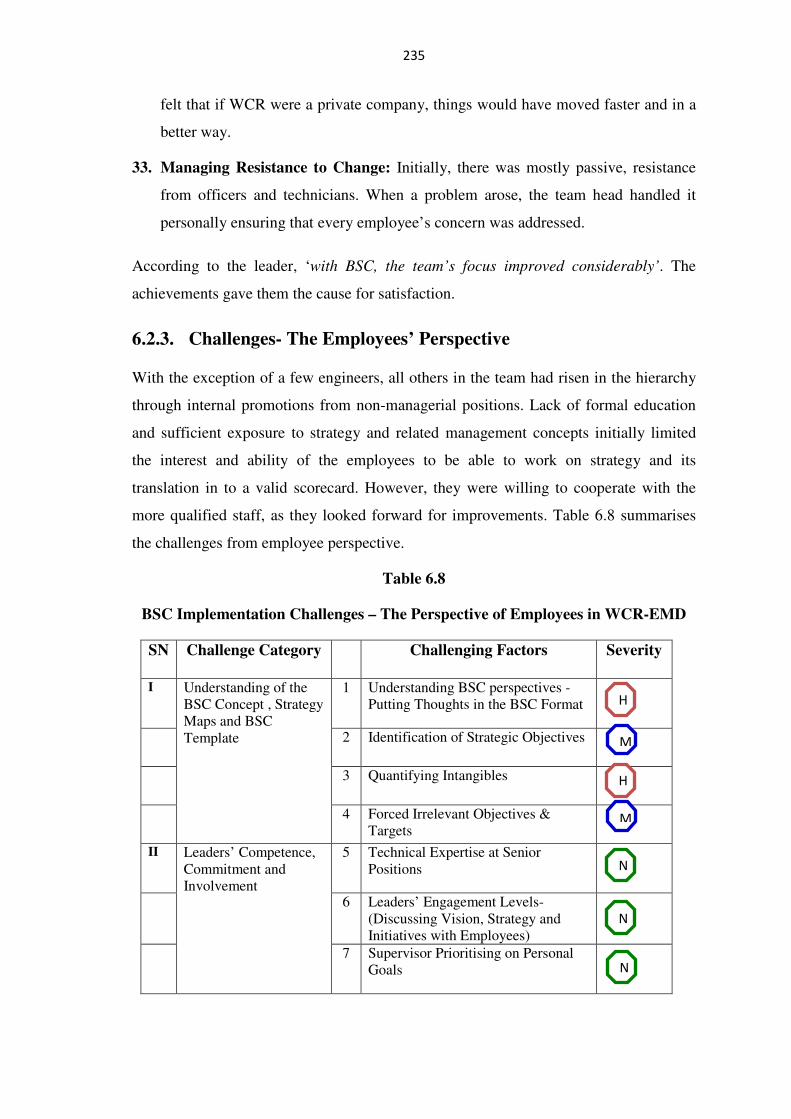
235
felt that if WCR were a private company, things would have moved faster and in a
better way.
33. Managing Resistance to Change: Initially, there was mostly passive, resistance
from officers and technicians. When a problem arose, the team head handled it
personally ensuring that every employee’s concern was addressed.
According to the leader, ‘with BSC, the team’s focus improved considerably’. The
achievements gave them the cause for satisfaction.
6.2.3. Challenges- The Employees’ Perspective
With the exception of a few engineers, all others in the team had risen in the hierarchy
through internal promotions from non-managerial positions. Lack of formal education
and sufficient exposure to strategy and related management concepts initially limited
the interest and ability of the employees to be able to work on strategy and its
translation in to a valid scorecard. However, they were willing to cooperate with the
more qualified staff, as they looked forward for improvements. Table 6.8 summarises
the challenges from employee perspective.
Table 6.8
BSC Implementation Challenges – The Perspective of Employees in WCR-EMD
SN Challenge Category Challenging Factors Severity
I Understanding of the BSC Concept , Strategy Maps and BSC Template
1 Understanding BSC perspectives - Putting Thoughts in the BSC Format
2 Identification of Strategic Objectives
3 Quantifying Intangibles
4 Forced Irrelevant Objectives & Targets
II Leaders’ Competence, Commitment and Involvement
5 Technical Expertise at Senior Positions
6 Leaders’ Engagement Levels-(Discussing Vision, Strategy and Initiatives with Employees)
7 Supervisor Prioritising on Personal Goals
H
M
M
N
N
N
H

236
SN Challenge Category Challenging Factors Severity
8 Faith in Leadership – (Perception of Leaders’ Accountability and Transparency )
9 Leaders’ Seriousness About Using BSC – BSC Just a Formality
III Facilitators’ Competence, Commitment and Support
10 Facilitators’ Competence
11 Facilitators’ Commitment and Support
12 Facilitators’ Knowledge of Business Complexities
IV Overall Alignment 13 Alignment of the Organisational Structure
14 Alignment of Support Functions / Other functions
15 Alignment of Policies: Employee Performance Management System (EPMS)
16 Alignment of Training & Development Initiatives
17 Alignment of Budget and Resources
18 Alignment of Rewards and Incentives
V Review Related Challenges
19 Data and Information Availability
20 Time Constraints
21 IT or BSC Software
22 Representation of Operational Complexities
23 Comprehensive Representation of all Work Done
24 Consistent Performance Feedback
VI Cultural and Other Organisation Specific Challenges
25 Communication
26 Information Sharing
27 Decision Making
28 Conflict Resolutions
N
N
L
H
H
H
M
M
M
L
M
M
M
M
M
H
L
M
N
N
H
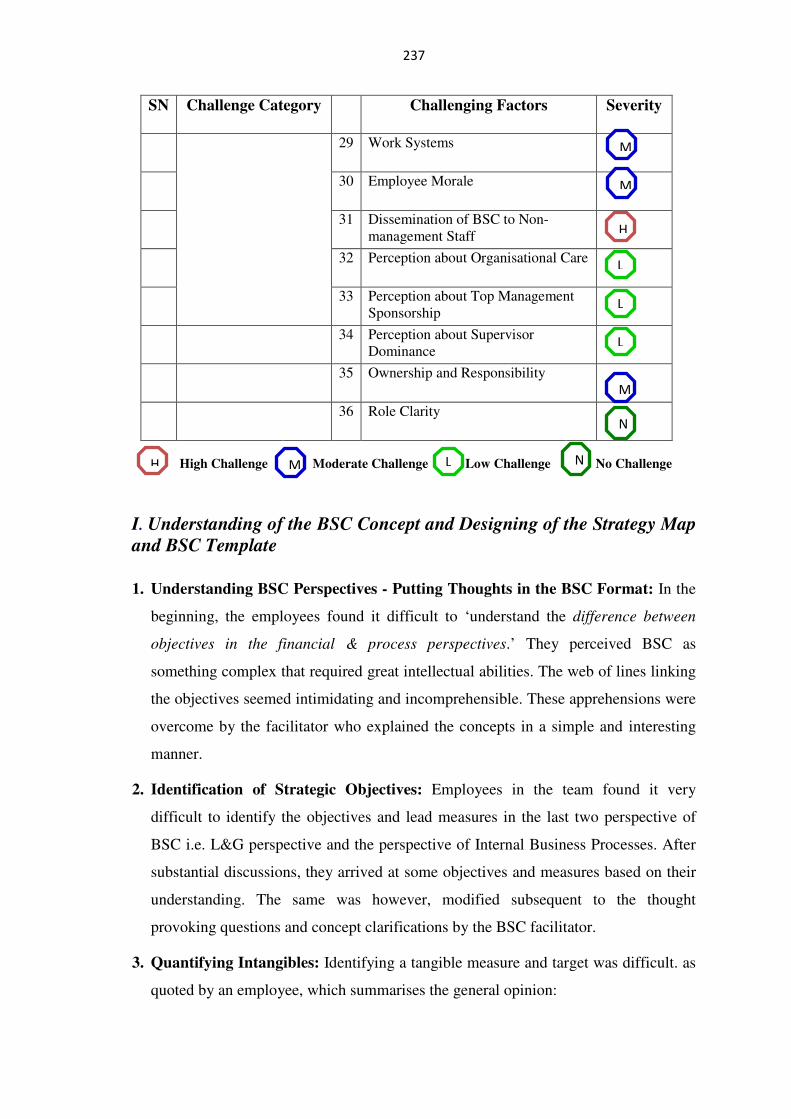
237
SN Challenge Category Challenging Factors Severity
29 Work Systems
30 Employee Morale
31 Dissemination of BSC to Non-management Staff
32 Perception about Organisational Care
33 Perception about Top Management Sponsorship
34 Perception about Supervisor Dominance
35 Ownership and Responsibility
36 Role Clarity
High Challenge Moderate Challenge Low Challenge No Challenge
I. Understanding of the BSC Concept and Designing of the Strategy Map
and BSC Template
1. Understanding BSC Perspectives - Putting Thoughts in the BSC Format: In the
beginning, the employees found it difficult to ‘understand the difference between
objectives in the financial & process perspectives.’ They perceived BSC as
something complex that required great intellectual abilities. The web of lines linking
the objectives seemed intimidating and incomprehensible. These apprehensions were
overcome by the facilitator who explained the concepts in a simple and interesting
manner.
2. Identification of Strategic Objectives: Employees in the team found it very
difficult to identify the objectives and lead measures in the last two perspective of
BSC i.e. L&G perspective and the perspective of Internal Business Processes. After
substantial discussions, they arrived at some objectives and measures based on their
understanding. The same was however, modified subsequent to the thought
provoking questions and concept clarifications by the BSC facilitator.
3. Quantifying Intangibles: Identifying a tangible measure and target was difficult. as
quoted by an employee, which summarises the general opinion:
N H M L
L
L
L
N
M
M
M
H

238
Selecting appropriate lead indicators was a challenge. We solved it by
discussion with in team and with the help of facilitator.
4. Forced Irrelevant Objectives and Targets: Objectives and targets were decided by
consensus after internal discussions. But the employees also felt that the leader
tended to stretch the targets.
II. Leaders’ Competence, Commitment and Involvement
5. Technical Expertise at Senior Positions: The team members had a very high
regard for their leader. He was an acknowledged expert in his area of work.
6. Leaders’ Engagement Levels-Discussing Vision, Strategy and Initiatives with
Employees: This did not happen in EMD. In fact leader’s commitment to company
vision was the driving factor for the team to adopt BSC and bring in improvements.
7. Supervisor Prioritising on Personal Goals: Implementation was monitored
regularly by the team head. He ensured that team objectives were placed before
personal goals. At the same time, he gave due respect to the interests and aptitude of
his people. To the extent possible he assigned work keeping these in mind.
8. Faith in Leadership – Perception of Leaders’ Accountability and Transparency:
The team head as well as the other managers were perceived as committed, fair and
transparent.
9. Leaders’ Seriousness About Using BSC – BSC Just a Formality or a Way of
Doing Things: Employees in EMD believed that the team head was genuinely
committed to implementing BSC.
III. Facilitators’ Competence, Commitment and Support
10. Facilitators’ Competence: The employees were impressed with the approach of
the facilitator, as one of them puts it:
Our facilitator brought an infectious enthusiasm to her work and with her
expertise she made the concept seem so simple and interesting to work on. She would follow up with all of us and help us in execution as well.
11. Facilitators’ Commitment and Support: This was not a challenge. Rather, the
facilitators’ commitment and support worked as a motivator.

239
12. Facilitators’ Knowledge of Business Complexities: In the employees’ perception,
the facilitator had a very good understanding of the working of the SBU. She could
interlink all aspects of the refinery business and worked towards making the team
see a clear picture ahead.
IV. Overall Alignment
13. Alignment of Organisational Structure: The leader restructured the department
into area wise teams, and employees found this structure better aligned with the
objectives of the team.
14. Alignment of Support / Other Functions: Though, among themselves the team
members were well aligned to corporate vision, they experienced difficulties with
other teams who were not so committed.
15. Alignment of Policies: Employee Performance Management System (EPMS):
Organisation wide EPMS was aligned with BSC. Employees HRD template was
like their individual BSC template. Some employees expressed dissatisfaction. They
observed that ‘performance ratings are not linked to actual performance.’
16. Alignment of Training and Development Initiatives: As the team became more
and more focused on the strategic objectives, the learning and development needs of
the team also became clear. Training initiatives were undertaken accordingly.
Hundred percent of the managerial staff was trained on ‘emotional intelligence’ as
the team head focused on building a cohesive team and develop managerial and
supervisory skills in them. Such training was not even thought of prior to
introducing BSC.
17. Alignment of Budget and Resources: The team was concerned with manpower
constraints and also over the aging facilities and infrastructure. Other resources as
such were made available by the leader, especially to build employee competencies.
18. Alignment of Rewards and Incentives: The team would expect only those rewards
and incentives as specified in refinery policy. The team head believed in
appreciation for achievement and effort and rebuke for indolence and indiscipline.

240
V. Review Related Challenges
19. Data and Information Availability: Data availability and collection were
persistent problems, especially when they were dependent on other departments:
Data becomes an issue. The leisurely response of other engineers, delays
our targets as well.’ This would affect their preparedness for reviews.
20. Time Constraints: The general belief is that while BSC ushered in benefits and
initiatives, it also increased the workload on the personnel placing demands for data.
21. IT or BSC Software: This was major constraint. The team desired a suitable BSC
Software. This was planned but has taken considerable time to be developed.
22. Representation of Operational Complexities: The scorecard was designed by the
team members and it represented operational complexities adequately. It was owned
and understood by the team. Hence, they were motivated to implement it.
23. Comprehensive Representation of all Work Done: Though most of the work and
initiative followed from scorecards, employees observed that ‘Many times other
work is assigned which is not in the set goals. This poses difficulty in the review’.
The employees were not clear about how to report the additional work they did as
the BSC templates or their HRD template did not have a provision for this.
24. Consistent Performance Feedback: Employee performance feedback was given
regularly through review meetings and personal interactions during which team head
performed as coach and counselor to the employees.
VI. Cultural and Other SBU Specific Challenges
25. Communication: Prior to BSC implementation the communication among
members was minimal. There was also very little top down communication. BSC
implementation resulted in improved communications.
26. Information Sharing: Earlier, data and information were held on to by individual
employees for personal advantage. BSC implementation resulted in the sharing of
information. Frequent team meetings, brainstorming, problem-solving sessions
made sure that information was available to everyone who needed it. This was also
included in the key performance indicators (KPIs) of the employees.

241
27. Decision Making: Employees did not view it as a challenge within the team.
However, they felt that decision making was a slow process in the organisation.
28. Conflict Resolutions: As was to be expected there were conflicts during the
implementation process. Earlier, there was no mechanism by which conflicts could
be resolved. The implementation process actually helped in conflict resolution.
This, in turn, increased enthusiasm and motivation.
29. Work Systems: Employees participated in modifying and improving the work
systems. They started coming up with innovative ideas for improvement.
30. Employee Morale: There were occasions, too, when there were unanticipated
problems and impediments. These would challenge employee morale and
motivation levels.
31. Dissemination of BSC to Non-management Staff: The following observation
from an employee resonates the general feeling of the management staff in the
team:
Discipline and responsibilities of non- managerial staff needs to improve
[…]. This will help employees to be more engaged in the process.
32. Perception about Organisational Care: Employees felt that some of the policies,
especially EPMS should ensure justice and HR policies should be more sensitive.
Within the team the leader showed considerable care and sensitivity, so there were
no issues.
33. Perception about Top Management Sponsorship: Employees saw their leader’s
commitment as a reflection of top management’s support.
34. Perception about Supervisor Dominance: The team head encouraged
participation and the employees did not get the feeling that he was dominating
them. However, the leader was firm that the team should set stretch targets.
35. Ownership and Responsibility: With the implementation of BSC, accountabilities
were clear and responsibilities were owned.
36. Role Clarity: Role clarity was defined during the scorecard design stage. This
eliminated the possibility of confusion and overlapping of roles during
implementation.
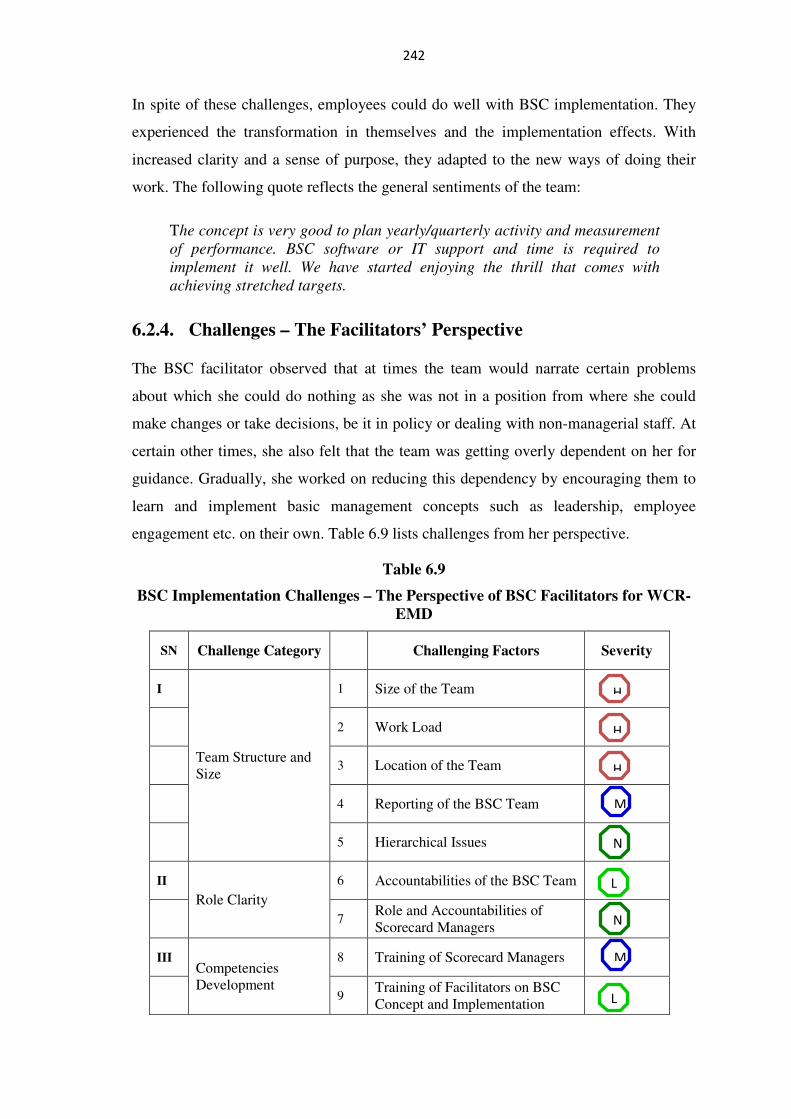
242
In spite of these challenges, employees could do well with BSC implementation. They
experienced the transformation in themselves and the implementation effects. With
increased clarity and a sense of purpose, they adapted to the new ways of doing their
work. The following quote reflects the general sentiments of the team:
The concept is very good to plan yearly/quarterly activity and measurement
of performance. BSC software or IT support and time is required to
implement it well. We have started enjoying the thrill that comes with
achieving stretched targets.
6.2.4. Challenges – The Facilitators’ Perspective
The BSC facilitator observed that at times the team would narrate certain problems
about which she could do nothing as she was not in a position from where she could
make changes or take decisions, be it in policy or dealing with non-managerial staff. At
certain other times, she also felt that the team was getting overly dependent on her for
guidance. Gradually, she worked on reducing this dependency by encouraging them to
learn and implement basic management concepts such as leadership, employee
engagement etc. on their own. Table 6.9 lists challenges from her perspective.
Table 6.9
BSC Implementation Challenges – The Perspective of BSC Facilitators for WCR-
EMD
SN Challenge Category Challenging Factors Severity
I
Team Structure and Size
1 Size of the Team
2 Work Load
3 Location of the Team
4 Reporting of the BSC Team
5 Hierarchical Issues
II
Role Clarity
6 Accountabilities of the BSC Team
7 Role and Accountabilities of Scorecard Managers
III Competencies Development
8 Training of Scorecard Managers
9 Training of Facilitators on BSC Concept and Implementation
H
H
H
L
L
N
N
M
M

243
SN Challenge Category Challenging Factors Severity
10 Competencies to Conduct Training and Workshops
11 Knowledge of Business Complexities
IV
Commitment and Ownership
12 Commitment of BSC facilitator
13 Commitment of SBU / Dept. Head
14 Leaders’ and Employee Buy-in
V
Cultural
15 Communications
16 Enforcement of Decisions
17 Culture of ‘Appeasing Boss’
18 Willingness for the Change
VI
BSC Review
19 Reviewing Abilities of the Leaders
20 BSC Software for Information Collation
21 Time and Data Constraints
VII
Employee Transfers
22 Integrating New Incumbents into BSC
23 Change in Leadership Approach to BSC
High Challenge Moderate Challenge Low Challenge No Challenge
I. Team Structure and Size
1. Size of the Team: The facilitator felt that having more people in her team would
have given her the flexibility to devote more time in supporting BSC
implementation in EMD.
2. Work Load: She coordinated BSC implementation and conducted workshops for a
few other SBU’s also.
3. Location of the Team: It was not a problem as the EMD was located in the same
city.
4. Reporting of the BSC Team: The BSC team reported to the marketing head;
hence, refinery related matters received secondary attention.
N
L
N
L
H
N
L
N
N
N
N H M L
M
M
M
M

244
5. Hierarchical Issues: Although the team head was senior to her, she had no
problems in guiding or coaching him. He was not only receptive, but also frequently
constantly sought her advice and ideas.
II. Role Clarity
6. Accountabilities of the BSC Team: The facilitator made it clear to the leader about
his accountability and the manner by which she would support him.
7. Role and Accountabilities of Scorecard Managers: There was no scorecard
manager in EMD.
III. Competency Development
8. Training of Scorecard Managers: The leader also performed the role of the
scorecard manager. The facilitator trained him appropriately.
9. Training of Facilitators on BSC Concept and Implementation: The facilitator
was suitably trained. But she also went beyond the training she received to learn on
her own.
10. Competencies to Conduct Training and Workshops: Leaders and employees
acknowledge her competence.
11. Knowledge of Business Complexities: She spent considerable time with the team,
and visited theirs work areas to better understand the nature of their work and its
complexities.
IV. Commitment and Ownership
12. Commitment of BSC Facilitator: The facilitator was fully committed to her work
and responsibilities.
13. Commitment of SBU Heads: She observed that the SBU head was committed to
the implementation process and acknowledged his support.
14. Leaders’ and Employee Buy-in: Buy-in from leader took very little time.
However, employee buy-in took longer.

245
V. Cultural
15. Communications: Prior to BSC implementation, team communications were poor.
Implementation of BSC necessitated improvements in communication.
16. Enforcement of Decisions: Since the leader always ensured that decisions taken in
the meetings get implemented, the facilitator did not face any issues or challenges in
this regard.
17. Culture of ‘Appeasing Boss’: EMD team did not have this problem.
18. Willingness for the Change: Resistance to change came mostly from the older
employees who were promoted from the ranks. It was passive and subtle in nature.
However, the facilitator made efforts to convince them about the importance and
benefits and eventually, their resistance was also overcome.
VI. BSC Review
19. Reviewing Abilities of the Leaders: The leader believed in continuous learning.
He got the necessary guidance from the facilitator and continuously improved his
capability to conduct reviews.
20. BSC Software for Information Collation: Having BSC software would have
certainly made the implementation easier and more enjoyable experience. Not
having BSC software created difficulties. Employees struggled to collate data and
manually update all review parameters. It was a time consuming and cumbersome
process.
21. Time and Data Constraints: Initially, both time and data availability was
constraints. The team slowly developed the files and systems to capture relevant
data. Time however, remained a constraint. BSC implementation required that more
initiatives had to be taken and people had to devote more of their time to their
assigned tasks.
VII. Transfers
22. Integrating New Incumbents into BSC: The fact that there were no transfers
during the implementation period helped the team remain settled.
23. Change in Leadership Approach to BSC: The leader remained the same during
the period of study, the leader remained the same.

246
6.2.5. Factors Driving Employee Buy-in of BSC
The team head credited the success to the facilitator and said, ‘But for her inspiration,
continuous support and encouragement, I wouldn’t have even considered BSC.’ In
addition to the facilitator, the other contributory factors as evident from employee
responses were as under:
1. The leader’s interest BSC and commitment to implementation.
2. Continuous encouragement and support from the leader and facilitator.
3. The facilitator brought in clarity of concepts and engaged the participants in the
workshops.
4. Employees’ desire to find a purpose and meaning in their jobs so that
organisational interests are served.
5. Enhanced role clarity and problem resolution
6. Expectation of objectivity and fairness in performance reviews.
7. An understanding of the concepts of BSC led some employees to appreciate the
BSC approach. This facilitated their adoption.
8. Some employees adopted it because others in the team had done so.
9. Most of them believed that BSC would bring about improvements in the overall
working environment and that it should get implemented on a big scale.
10. According to the explanation of the team head, everyone in EMD believed that
implementing BSC would enable them improves the department’s performance and
overcome several of the problems that they were dealing with.
6.2.6. Outcomes of BSC Implementation
a) Transitions in Working Environment and Employee Behaviours
The team experienced several positive transitions while implementing BSC. Initially
there were issues pertaining to knowledge sharing and collaboration, which seemed to
have been overcome as a consequence of BSC implementation. The leader mentioned:
Overall culture of the team improved. There is more collaboration and
better bonding among members.

247
Besides, achieving eleven out of fourteen objectives on the scorecard, the team
achieved much more in terms of employee engagement. Some of these transitions as a
result of BSC implementation were:
1. Enhanced Role Clarity: Employees had better understanding of their job
deliverables and accountabilities. They could appreciate their individual
contribution in the bigger context of organisational objectives.
2. Enhanced Self Esteem: Employees felt themselves to be significant, responsible
individuals who were valued by the organisation. They started taking pride in their
job.
3. Empowerment, Initiative and Enthusiasm: Instead of merely following their boss’s
instructions, they started taking initiatives to diagnose problems, analyse the root
causes and resolve them.
4. Ownership and Accountability: They took active interest in the team activities, and
took responsibility for meeting the targets.
5. Creativity and Innovative Ideas: Employees started coming up with innovative
ideas to resolve problems and improve processes.
6. Enhanced Supervisor Involvement: Supervisors took active interest and reviewed
daily performance. Issues were recognised, discussed, brainstormed if necessary,
and resolved.
7. Resource Availability: The team leader ensured that the necessary resources were
available for the employees to continue working on their initiatives.
8. Enhanced Focus on Competency Development: Competency gaps were now
identified in the context of the strategic objectives and the necessary training was
provided.
9. Enhanced Vigour: With clarity of objectives, everyone seemed to have the drive
and enthusiasm to work on their goals.
10. Enhanced Communication and Information Sharing: Communication and
information sharing improved significantly.
11. Team Cohesiveness: Interpersonal relationships improved significantly, conflicts
were reduced, and collaborative efforts were visible.
12. Enhanced Focus on Performance: Employees became more focused and
performance oriented as they had to demonstrate progress during the periodic BSC
reviews.
248
13. Objective Assessment of Performance: BSC reviews ensured objective evaluation
of the performance against targets. The team head accordingly assigned their
individual performance ratings. As a result, employees got a sense of just and fair
treatment.
14. Performance Linked Incentives and Rewards: The organisation had linked the
productivity incentive to the performance ratings of the employees. Besides, the
team leader publicly acknowledged and appreciated employees for significant
achievements and nominated deserving employees for outstanding achievement
awards.
15. Public Recognition: As a team they received praise from senior management as
they resolved several problems and achieved most of their strategic objectives.
b) Business Performance Outcomes
The team initially faced several problems related to frequent power interruptions which
impacted overall refinery performance. With implementation of BSC, as of December
2011, out of thirty seven measures and targets, the team achieved twenty seven, seven
were achieved partially, and three could not be achieved at all. They achieved success
in increased reliability, interruption- free power supply and reduction in maintenance
cost. Housekeeping improved many fold and the team started benchmarking the major
processes with the best in industry. Some of the leading initiatives under each
perspective that made it possible to happen were:
1. Close follow up with finance for clearing bills of vendors, particularly of those who
are not familiar with UPCL procedures.
2. Installed winding & bearing temperature measurement system for critical Main Air
Blower of FCCU, thus improving predictive analysis.
3. Improved cable terminations of compressors C-302 & C-101 to increase reliability.
4. Trouble shooting completed for complicated GFEC failures, thereby reducing plant
tripping.
5. Utilised own cable tracing equipment to identify all 3.3 KV/ 6.6KV / 22 KV FR
cables. New Auto Cad drawings completed. Installed innovative route markers for
easy identification.
6. Team visited joint manufacturers and made recommendations to improve quality of
material and workmanship.
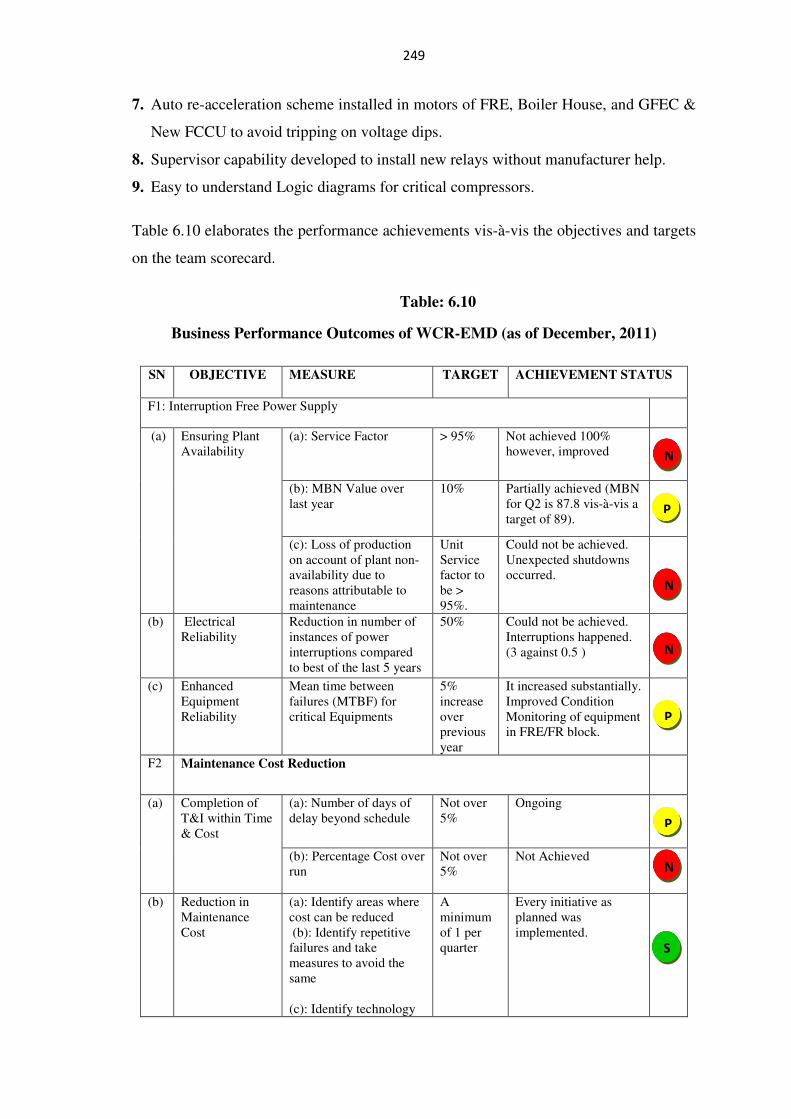
249
7. Auto re-acceleration scheme installed in motors of FRE, Boiler House, and GFEC &
New FCCU to avoid tripping on voltage dips.
8. Supervisor capability developed to install new relays without manufacturer help.
9. Easy to understand Logic diagrams for critical compressors.
Table 6.10 elaborates the performance achievements vis-à-vis the objectives and targets
on the team scorecard.
Table: 6.10
Business Performance Outcomes of WCR-EMD (as of December, 2011)
SN OBJECTIVE MEASURE TARGET ACHIEVEMENT STATUS
F1: Interruption Free Power Supply
(a) Ensuring Plant Availability
(a): Service Factor > 95% Not achieved 100% however, improved
(b): MBN Value over last year
10% Partially achieved (MBN for Q2 is 87.8 vis-à-vis a target of 89).
(c): Loss of production on account of plant non-availability due to reasons attributable to maintenance
Unit Service factor to be > 95%.
Could not be achieved. Unexpected shutdowns occurred.
(b) Electrical Reliability
Reduction in number of instances of power interruptions compared to best of the last 5 years
50% Could not be achieved. Interruptions happened. (3 against 0.5 )
(c) Enhanced Equipment Reliability
Mean time between failures (MTBF) for critical Equipments
5% increase over previous year
It increased substantially. Improved Condition Monitoring of equipment in FRE/FR block.
F2 Maintenance Cost Reduction
(a) Completion of T&I within Time & Cost
(a): Number of days of delay beyond schedule
Not over 5%
Ongoing
(b): Percentage Cost over run
Not over 5%
Not Achieved
(b) Reduction in Maintenance Cost
(a): Identify areas where cost can be reduced (b): Identify repetitive failures and take measures to avoid the same (c): Identify technology
A minimum of 1 per quarter
Every initiative as planned was implemented.
S
P
N
P
N
N
N
P
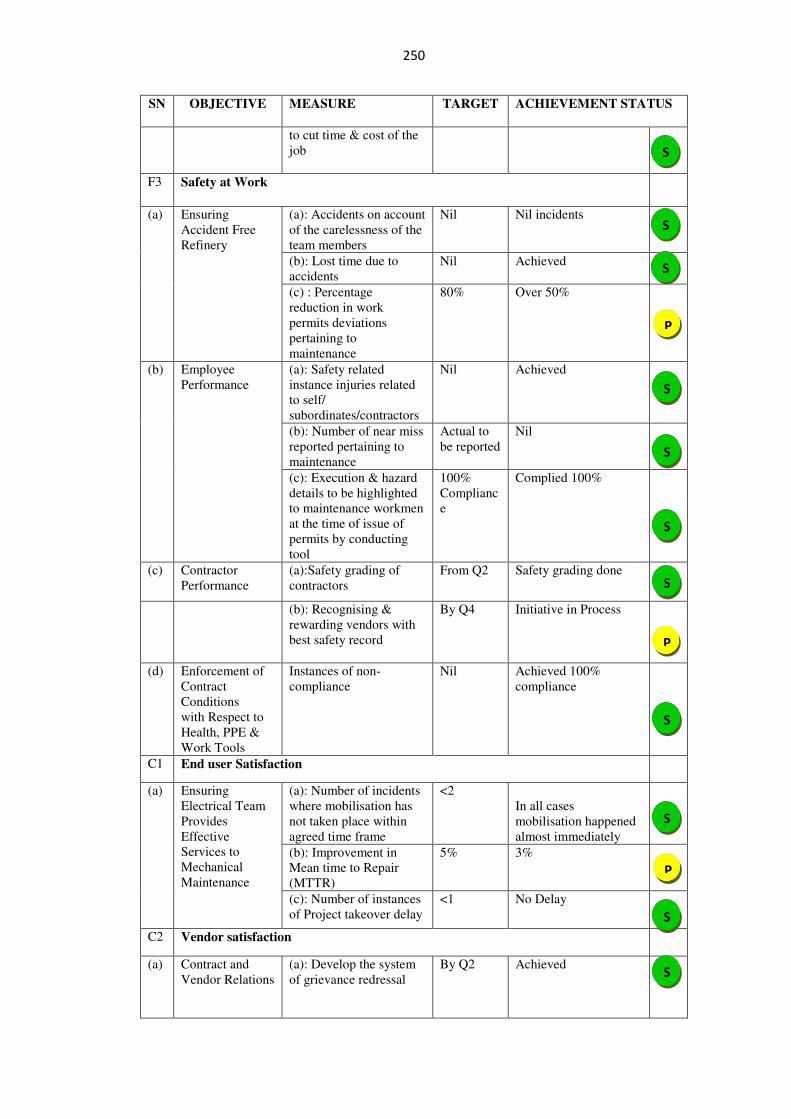
250
SN OBJECTIVE MEASURE TARGET ACHIEVEMENT STATUS
to cut time & cost of the job
F3 Safety at Work
(a) Ensuring Accident Free Refinery
(a): Accidents on account of the carelessness of the team members
Nil Nil incidents
(b): Lost time due to accidents
Nil Achieved
(c) : Percentage reduction in work permits deviations pertaining to maintenance
80% Over 50%
(b) Employee Performance
(a): Safety related instance injuries related to self/ subordinates/contractors
Nil Achieved
(b): Number of near miss reported pertaining to maintenance
Actual to be reported
Nil
(c): Execution & hazard details to be highlighted to maintenance workmen at the time of issue of permits by conducting tool
100% Compliance
Complied 100%
(c) Contractor Performance
(a):Safety grading of contractors
From Q2 Safety grading done
(b): Recognising & rewarding vendors with best safety record
By Q4 Initiative in Process
(d) Enforcement of Contract Conditions with Respect to Health, PPE & Work Tools
Instances of non-compliance
Nil Achieved 100% compliance
C1 End user Satisfaction
(a) Ensuring Electrical Team Provides Effective Services to Mechanical Maintenance
(a): Number of incidents where mobilisation has not taken place within agreed time frame
<2 In all cases mobilisation happened almost immediately
(b): Improvement in Mean time to Repair (MTTR)
5% 3%
(c): Number of instances of Project takeover delay
<1 No Delay
C2 Vendor satisfaction
(a) Contract and Vendor Relations
(a): Develop the system of grievance redressal
By Q2 Achieved
S
S
S
S
P
P
S
S
S
S
P
S
S
S

251
SN OBJECTIVE MEASURE TARGET ACHIEVEMENT STATUS
(b): Handle contractors grievances
Within 5 days
Achieved
(c): Approval of MRR/JCR within stipulated schedule
>90% Achieved
(b) . Ensure Boundary Management
(a): redressal of adverse reports from Statutory agencies w.r.t Maintenance
Within specified Timelines
Achieved
(b): Satisfactory response to complaints
complaints to be attended within one month
Achieved
P1 Enhance electrical Reliability
(a) Ensuring Plant Availability
(a): Number of RCA initiated within stipulated time frame
90% Achieved
(b): Number of recommendations of RCA on which action has been taken within specified time frame for equipments within sphere of operation
90% Achieved with a few exceptions on account of valid reasons
(a): Implement all recommendations up to 2008
100% In process
P2 Inventory Management
(a) Review of Stocking Norms for High Value Items
% of electrical items reviewed
10% Annual
Reviewed about 5% in first two quarters
P3 Housekeeping & aesthetics of Substations
(a) Housekeeping (a): Number of instances when customer requests for housekeeping were not met within agreed time frame
Within 5% Achieved
(b): Number of instances of deviation from agreed schedule of scrap hand over
Within 2 No such instance
P4 Statutory & Environmental Compliance
Priority to Safety Related Jobs
(a): Number of instances when a safety related job is held up beyond stipulated time
Within 5%
Nil such instance
Compliance to Safety Norms
(b): Compliances to all safety norms while handling maintenance
100% Achieved complete compliance
S
S
S
S
P
P
P
S
S
S
S
S

252
SN OBJECTIVE MEASURE TARGET ACHIEVEMENT STATUS
jobs
P5 Identification and benchmarking processes
(a): Develop norms for major maintenance activities
By end of Q1
Identified 5 processes. Discussions going on to prioritise the two
(b):Processes benchmarked
3 process Achieved ISO taken for the testing group Shop job handbook made on procedures
P6 First Pass Rate
Quality of Workmanship
Number of instances where a breakdown has taken place due to poor workmanship
<5% Nil such instance
P7 Power Cost reduction to Refinery
Reduction in Power Cost
Number of new schemes to reduce power costs
2 per year Implemented
LEARNING & GROWTH PERSPECTIVE
L1 Develop Electrical & Behavioural Skills
Emotional Intelligence Training
% of supervisors trained on emotional intelligence
100% 100% trained
L2 Enabling Work Environment
Recognising Contribution
Number of new schemes to recognise contribution
2 per year Achieved
L3 Leveraging IT / Maximo
Work Order Completion Rates
% compliance
90% Achieved
Successful Partially Successful Not Successful
Source: Data collected and compiled from the information provided by the Team Head,
EMD, performance reports and presentations made to the Refinery Head and
the Senior Management of Refinery
The BSC facilitator played a pivotal role in clarifying the concepts, designing
scorecards and facilitating implementation of the same. The department thus
implemented BSC in spite of not having very qualified people; and they even succeeded
S P N
S
S
S
S
S
S
P

253
to a great extent. This case study emphasises the crucial role played by the leader and
the facilitator in ensuring the success of BSC implementation.
6.3. Summary
The study of these two cases indicates that the commitment of the leader to implement
BSC should get reflected in his actions, decisions, behavior and priorities. If the team
head persists for BSC implementation, the team will adapt. Even small successes of
implementing BSC shall be shared with employees. This shall motivate employees and
build their belief in BSC. As is evident in cases studied in the previous chapter, cases
studied in this chapter too lay emphasis on the importance of buy-in and initiative by
leaders at the lower levels of the hierarchy. Also highlighted is the importance of
adapting a better way to conduct qualitative reviews, and hence, the need for the leaders
to ‘review’ the reviewing processes itself.