Embed Size (px)
Citation preview
CHAPTER TEN
GAMMA RAY
1 Introduction
Camma ray logs are used for three main purposes:
correlation
evaluation of the shale content of a formation
mineral analysis
The gamma ray log measures the natural gamma ray emissions from radioactive formations. Since
many gamma rays can pass through steel casing, the log can be run in both open and cased holes. In
related applications, induced gamma rays are measured (i.e., pulsed neutron logging), but these are not
discussed in this section.
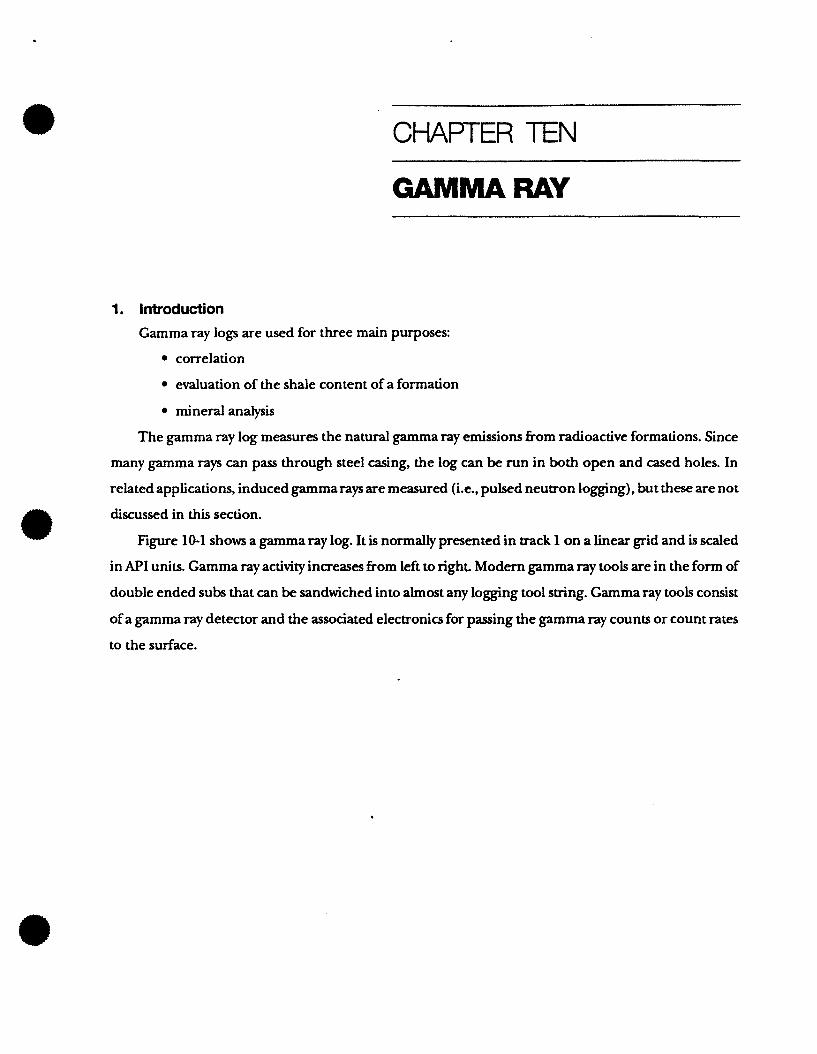
Figure 10-1 shows a gamma ray log. It is normally presented in uack 1 on a linear grid and is scaled
in API units. Gamma ray activity increases from left to right Modern gamma ray tools are in the form of
double ended subs that can be sandwiched into almost any logging tool string. Gamma ray tools consist
of a gamma ray detector and the associated electronics for passing the gamma ray counts or count rates
to the surface.
Chapter 10: Gamma Ray /ILs
GAMMA RAY
Fgure 10- 1. Gamma ray log.
10-2

Chapter 10: Gamma Ray f f k s 2. Origin of Natural Gamma Rays
Gamma rays originate in three sources in nature. These are the radioactive elements of the
Uranium Group, the Thorium Group, and potassium. Uranium 235, uranium 238 and thorium 232 dl
decay, via long chains of daughter products, to stable lead isotopes as illustrated in Figure 10-2.
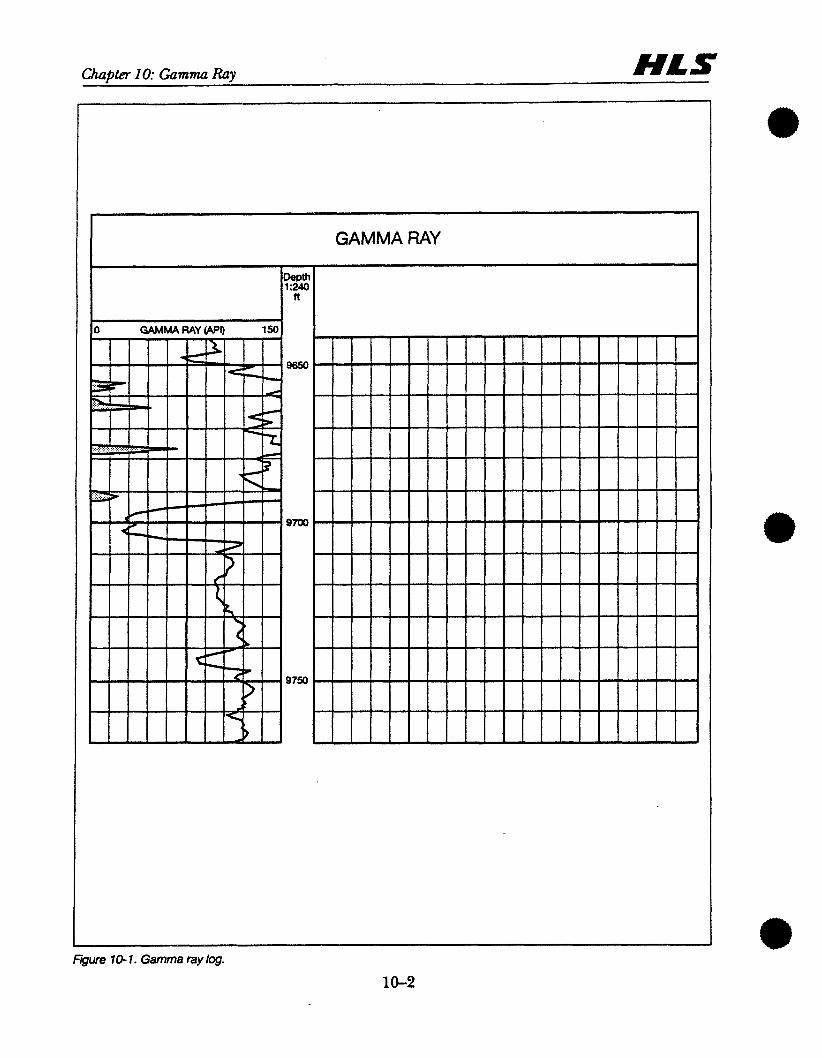
An isotope of potassium, 4%, decays to argon and emits a gamma ray as shown in Figure 10-3. It
should be noted that each type of decay is characterized by a gamma ray of a specific energy (wave
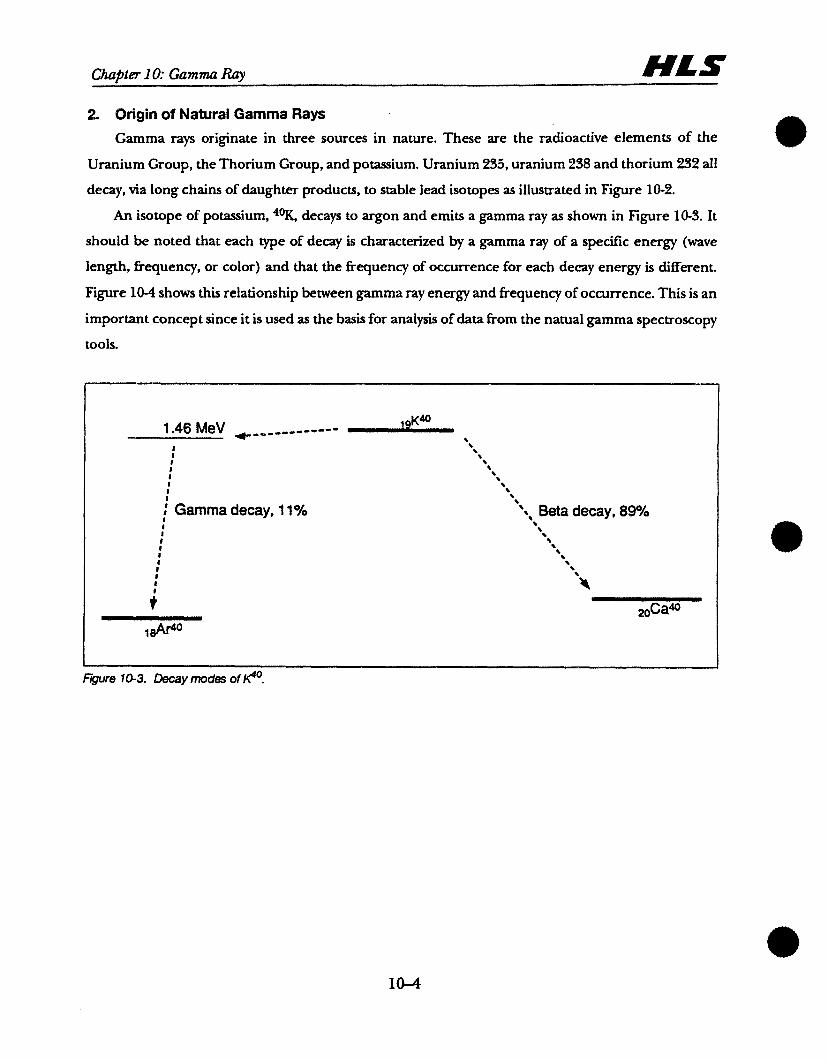
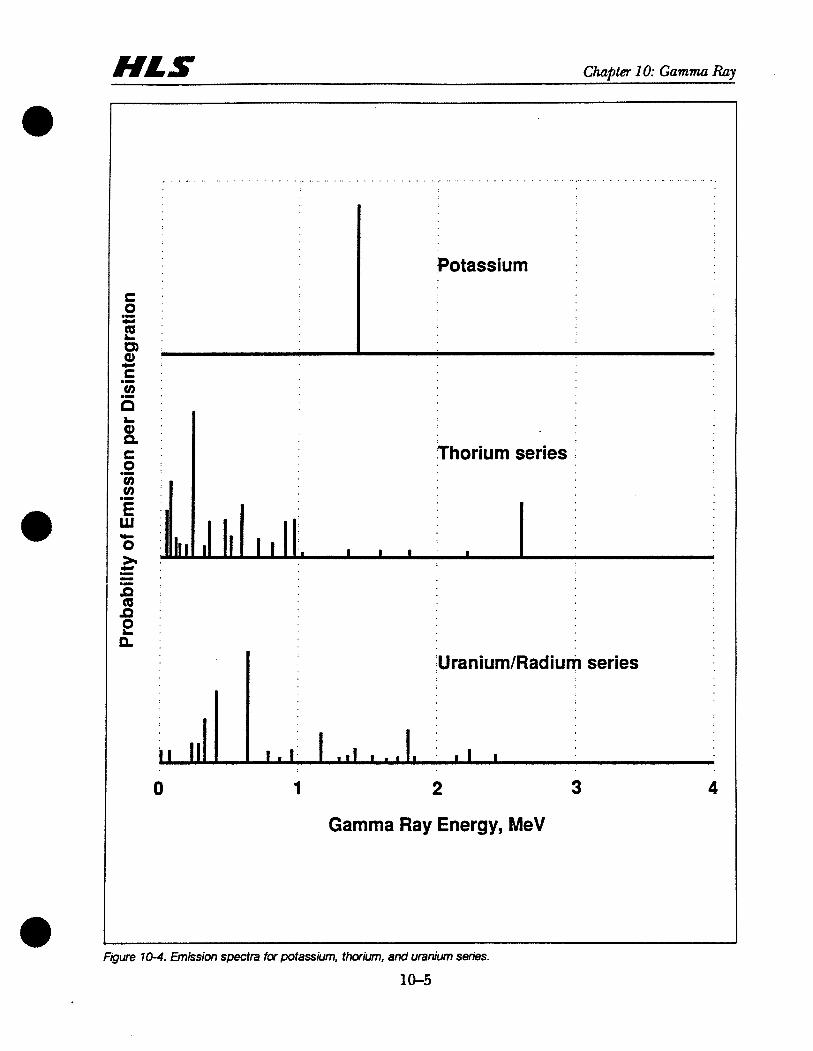
length, frequency, or color) and that the frequency of occurrence for each decay energy is different.
Figure 10-4 shows this relationship between gamma ray energy and frequency of occurrence. This is an
important concept since it is used as the basis for analysis of data from the natual gamma spectroscopy
tools.
I I
Fgure 10-3. Decay modes of K"O.
ChuDter 10: Gamma Ray
Figure 70-4. Emission spectra for potassium, thorium, and uranium series.
10-5
, . . . . . . . . . . . . . . . . . . . . . . . . . . . . . . . . . . . . . . . . . . . . . . . . . . . . . . . . . . . .
s . 0 : .- C '
0 : 6
Potassium
0) ICI
: .I
.2 : n : L '
0 ) : a :Thorium series i s .
0 i .- a u a : .- E :
I1 W .
I . I I I I I I C I . .I 111 '
5 : 0 9 : g : a :
Jl 11
llJraniumJRadium series
1 m 1 . I I
0 1 2 3 4
Gamma Ray Energy, MeV
Chapter 10: Gamma Ray /ILS 3. Abundance of Naturally Occurring Radioactive Minerals
An "averagew shale contains 6 ppm uranium, 12 ppm thorium and 2% potassium. Since the various
gamma ray sources produce different numbers and energies of gamma rays, it is more informative to
consider this mix of radioactive materials on a common basis by refemng to potassium equivalents (the
amount of potassium that would produce the same number of gamma rays per unit of time). Reduced
to a common denominator, the average shale contains uranium equivalent to 4.3% potassium, thorium
equivalent to 3.5% potassium, and 2% potassium. This "averagew shale is a rare find. Ashale is a mixture
of clay minerals, sand, silts and other extraneous materials; thus, there can be no "standardw gamma ray
activityfor shale. Indeed, the main day minerals vary enormously in their natural radioactivity. Kaolinite
has almost no potassium whereas illite contains between 4% and 8% potassium. Montmorillonite
contains less than 1% potassium. Natural radioactivity may also be due to the presence of dissolved
potassium or other salts in the water contained in the pores of the shale.
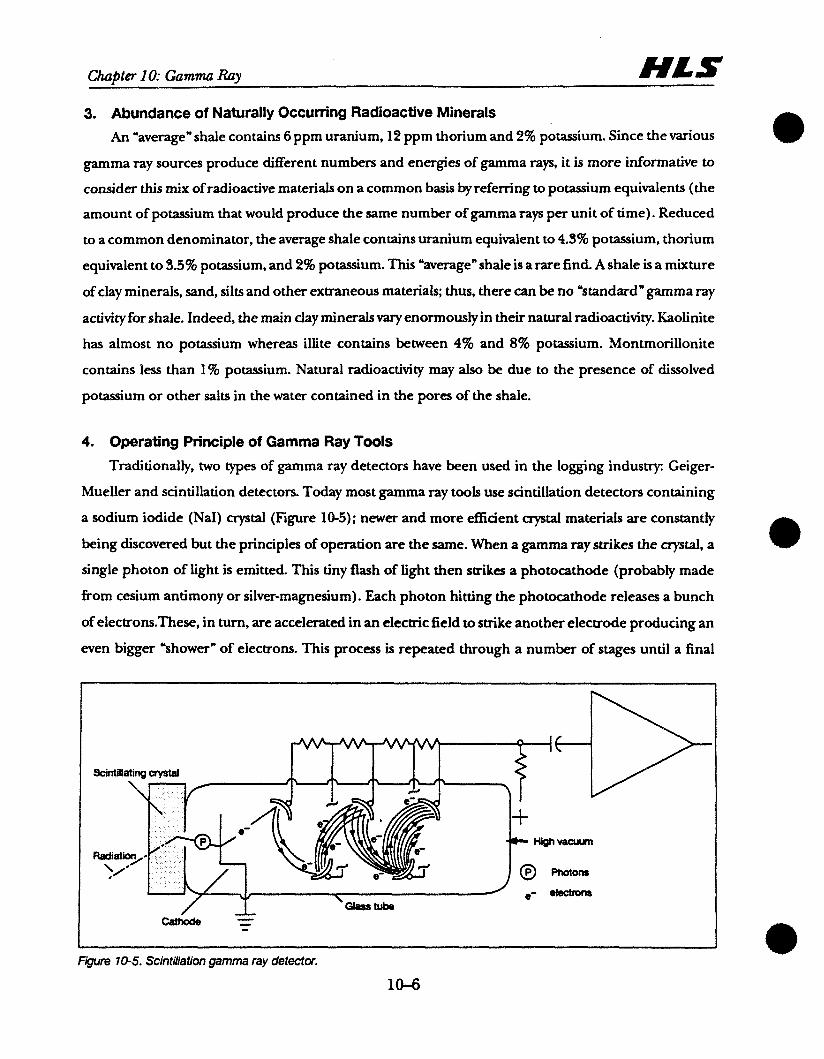
4. Operating Principle of Gamma Ray Tools
Traditionally, two types of gamma ray detectors have been used in the logging industry Geiger-
Mueller and scintillation detectors. Today most gamma ray tools use scintillation detectors containing
a sodium iodide (NaI) crystal (Figure 10-5); newer and more efficient crystal materials are constantly
being discovered but the principles of operation are the same. When a gamma ray strikes the crystal, a
single photon of Light is emitted. This tiny flash of light then strikes a photocathode (probably made
from cesium antimony or silver-magnesium). Each photon hitting the photocathode releases a bunch
of electrons.These, in turn, are accelerated in an electric field to strike another electrode producing an
even bigger "showerw of electrons. This process is repeated through a number of stages until a final
Fgure 10-5. Scintillation gamma ray detector.
10-6
Chafiter 10: Gamma R a y
Neat Portland cement
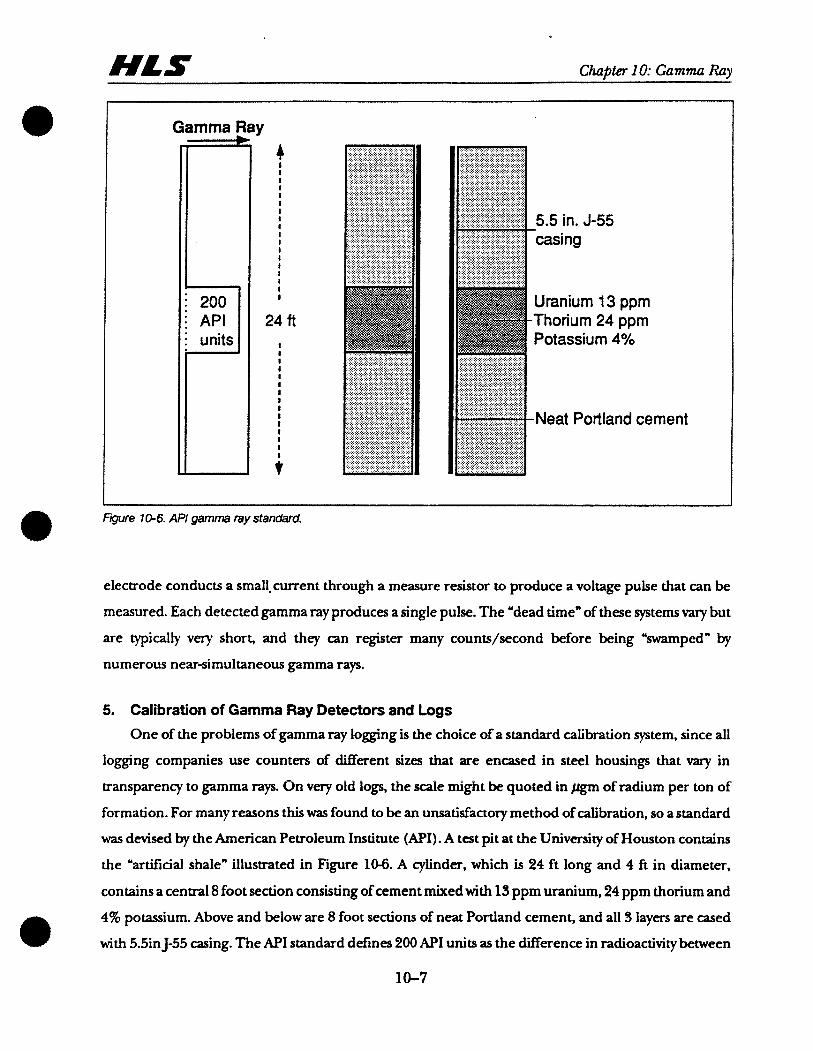
Figure 106. API gamma ray standard.
electrode conducts a smal!current through a measure resistor to produce a voltage pulse that can be
measured. Each detected gamma ray produces a single pulse. The "dead timew of these systems vary but
are typically very short, and they can register many counts/second before being "swampedw by
numerous near-simultaneous gamma rays.
5. Calibration of Gamma Ray Detectors and Logs
One of the problems of gamma ray logging is the choice of a standard calibration system, since all
logging companies use counters of different sizes that are encased in steel housings that vary in
transparency to gamma rays. On very old iogs, the scale might be quoted in ~ l g m of radium per ton of
formation. For many reasons this was found to be an unsatisfactory method of calibration, so a standard
was devised by the American Petroleum Institute (API). A test pit at the University of Houston contains
the "artificial shalew illustrated in Figure 10-6. A cylinder, which is 24 ft long and 4 fi in diameter,
contains a central 8 foot seaion consisting of cement mixed with 13 ppm uranium, 24 ppm thorium and
4% potassium. Above and below are 8 foot sections of neat Portland cement, and all 3 layers are cased
with 5.5inJ-55 casing. The API standard defines 200 API units as the difference in radioactivity between
Chapter 10: Gamma Ray WLS the neat cement and the radioactively doped cement Any logging service company may place its tool in
this pit to make a calibration.
Field calibration is performed using a portable jig or blanket that contains a radioactive source,
usually asmall amount of PP6Ra or fSqh . The source produces a known increase in radioactivity over the
background count rate. This increase is equivalent to a known number of API units.
6. Time Constants and Block Filtering All radioactive processes are subject to statistical variations. For example, ifa source of gamma rays
emits an average of 100 gamma rays per second over a period of hours, the source will emit 360,000
gamma rays (100/second x 60 seconds x 60 minutes). However, if the count is measured for any one
particular second, the actual count might be less than 100 or more than 100. Gamma rays can be
counted for averyshort interval of time, resulting in a poor estimate of the real count rate, or the gamma
rays can be counted for a long time resulting in a more accurate estimate. In well logging, long
measurement times mean slow logging speeds, since the amount of time a detector is opposite a point
is inversely related to tool velocity.
Most computerized logging units make records of measurements from 2 to 120 times per foot. A
gamma ray tool moving at 1800 ft/hr (30 ft/min) will sample 6 inches of formation each second; it will
"lookw at each 3 inch interval for only 1/2 second (if sampled 4 times per foot, and leaving aside
consideration of the physical length of the detector). If plotted as measured, this data will produce an
extremely statistical or "noisyw gamma ray log.
The original method for handling the statistics inherent to nuclear data was to average the data over
1 to 4 seconds, depending on the logging speed. These "time constantsw smoothed the gamma ray log
nicely to a usable form, albeit with some loss of vertical resolution and slight changes in effective
measure point With the advent of computerized logging units, a similar method was employed: the
gamma ray data is block filtered over several samples above and below the measure point. The result is
a more usable and repeatable gamma ray log at the proper depth, with slightly less bed boundary
resolution.
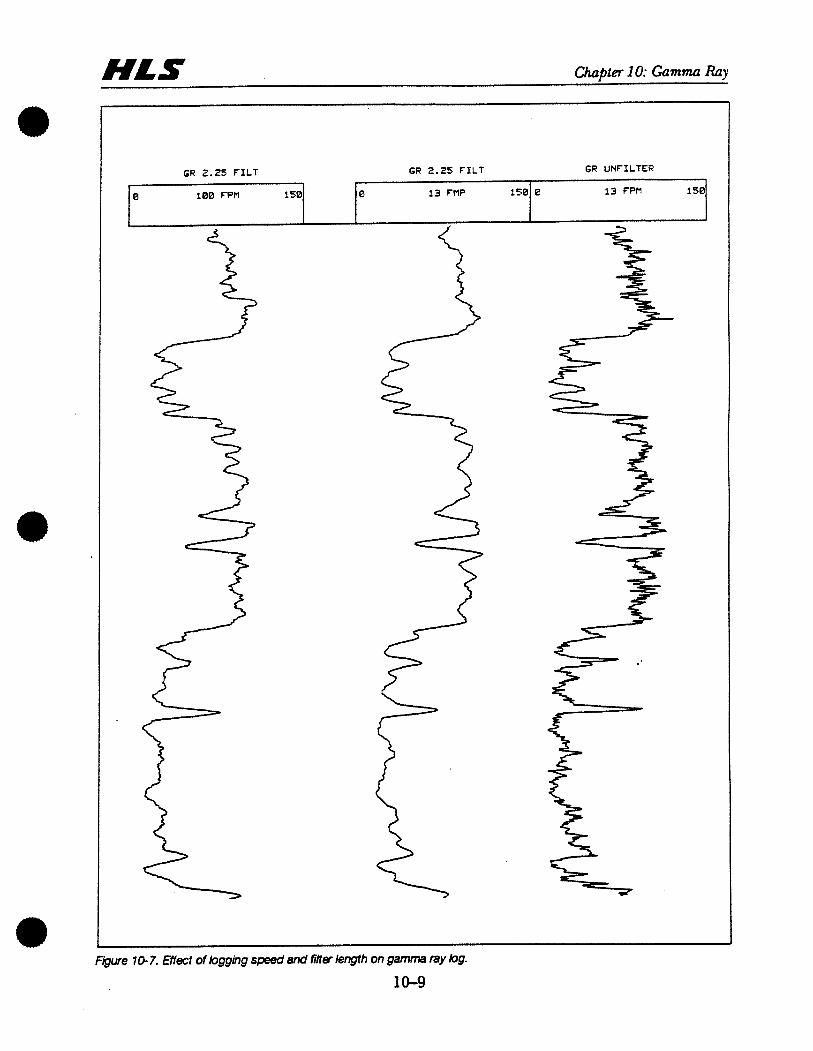
If the logging speed is doubled, the amount of time the detector %eesW a given point is reduced in
half; there is a corresponding increase in statistical effects. To achieve the same repeatability as with the
slower logging speed, one must increase the length of the block filter. Figure 10-7 shows the effects of
changing logging speed and filter lengths on a gamma ray log.
W f S Chapter 10: Gamma Ray
GR 2.25 FILT GR 2.25 FILT tR UNFILTER
Fgure 70.7. Effect of logging speed and fitter length on gamma ray bg.
10-9
Chap& 10: Gamma Ray H..s 7. Perturbing Effects on Gamma Ray Logs
Gamma ray logs are subject to a number of perturbing effects including:
sonde position in the hole (centering/eccentering);
hole size;
mud weight;
casing size and weight; and
cement thickness.
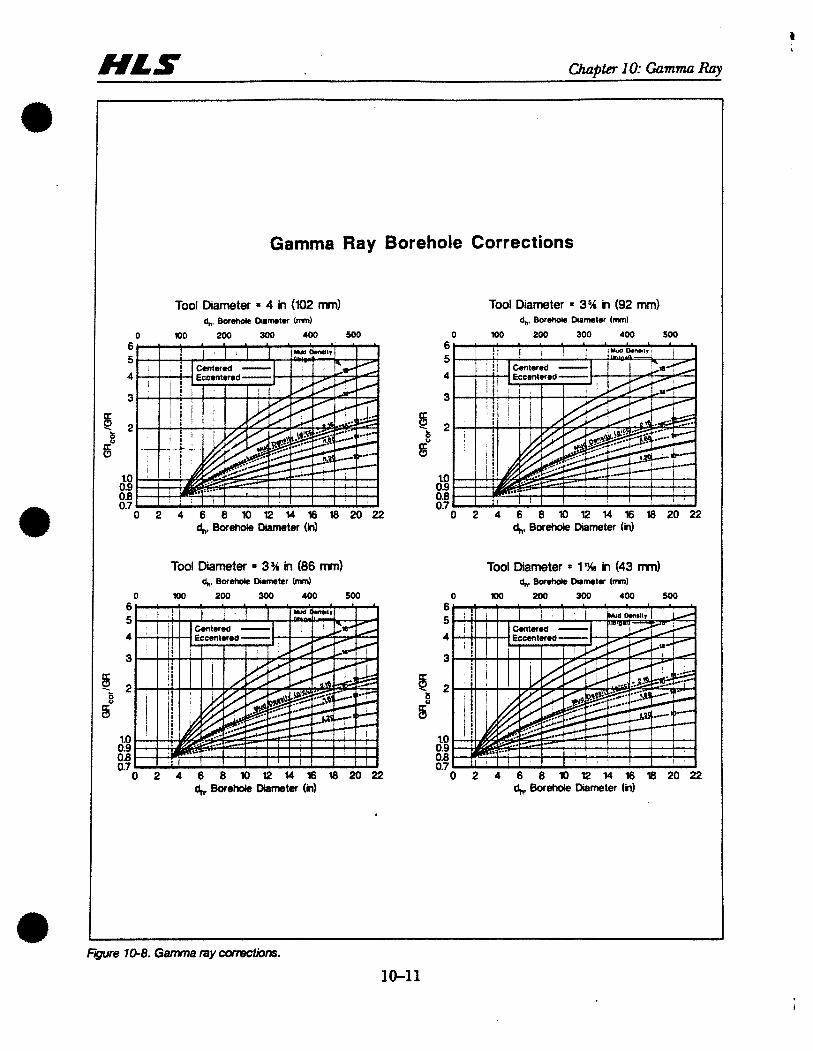
Since there are innumerable combinations of hole size, mud weights and tool positions, logging
service companies publish charts to correct their gamma ray logs back to a Standard" set of conditions
(3-5/8 in. tool, centered in a water-filled 8 in. hole). Figure 1 0 8 applies to logs run in open hole and
corrects for hole size and mud weight.
Question # 1 Use Figure 1 0 8 to estimate GEL,, under the following conditions:
GI+, - 67API
Holesize 5 8inches
Mud weight = 16 lbs/gal
Tool is centered.
Note that if a gamma ray log is run with a neutron and density, it is run usually eccentered; if it is run
with a laterolog it is usually centered; if it is run with an induction log it is usually nearcentered.
Chai&r 10: Gamma R a y
+
Gamma Ray Borehole Corrections
Tool Diameter = 4 in (lO2 m) Tool Diameter = 3% h (92 mm) 4, ewehole Dumetu hm) d,,. B o r W f>iameter (mnl
0 lo0 200 300 400 5DO 0 SO 200 300 400 500 6 6 5 5 4 4
3 3 a a 2 2
e" -: 8
10 10 0.9 0.9 0.8 0.8 0.7 0.7
0 2 4 6 8 I O l 2 l 4 b l 8 2 0 2 2 d,,, Borehde Diameter (in) d,,, Borehole Diameter (in)
Tod Diameter = 3% in (86 mm) Tod Diameter = 1 l)6 in (43 m d 4, Borehole Dumeter hn) d,,. Bor.Me Diameter (mn)
0 mo 200 300 400 5DO 0 100 200 300 400 500 6 6 5 5 4 4
3 3
l.0 10 0.9 0.9 0.8 0.8 0.7 0.7
0 2 4 6 8 l O l 2 I 4 l 6 l 8 2 0 2 2 0 2 4 6 8 l O P l 4 l 6 b 2 0 2 2 d,,, Borehob Diameter t i d,,, Borehole Diameter (in)
Chapter 10: Cammu ~ a y WLS 8. Estimating Shale Content from Gamma Ray Logs
Since radioactive isotopes are often associated with the clay minerals in shales, it is a commonly
accepted practice to use the relative gamma ray deflection as a shale volume indicator. The simplest
procedure is to scale the gamma ray between its minimum and maximum values from 0 to 100% shale.
The Gamma Rqy Index is defined as a linear scaling of the GR between G k i , and GQ, such that:
GR - G b i , Gamma Ray Index = (Eq. 10-1)
G b a x - G b i "
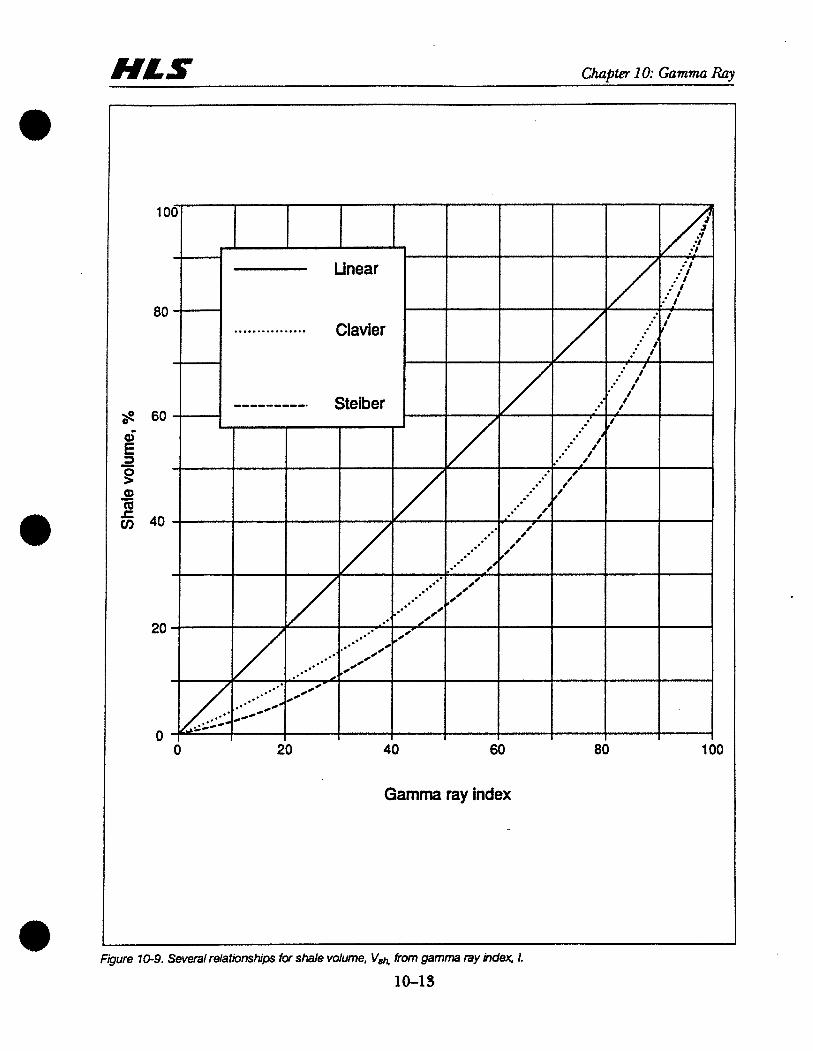
A number of studies have shown that this is not necessarily the best method and have proposed
modifications. If this index is called I, then the alternative relationships can be stated in terms of I:
Relationship Equation
Linear V* = I
Clavier V* = 1.7 - [3.38 - (1 + .7)4]1/2
Steiber V,, = I/ [N-(N-1 ) I] (general form)
V& = 0.5 I/ [1.5 - I] (if N = 3)
Bateman vA I I(I + CEctor)
where the GRfiCtOr is a number (1.2-1.7) chosen to force the result to imitate the behavior of either the
Clavier or the Steiber relationship. Figure 10.9 illustrates comparatively the difference between these
alternative relationships.
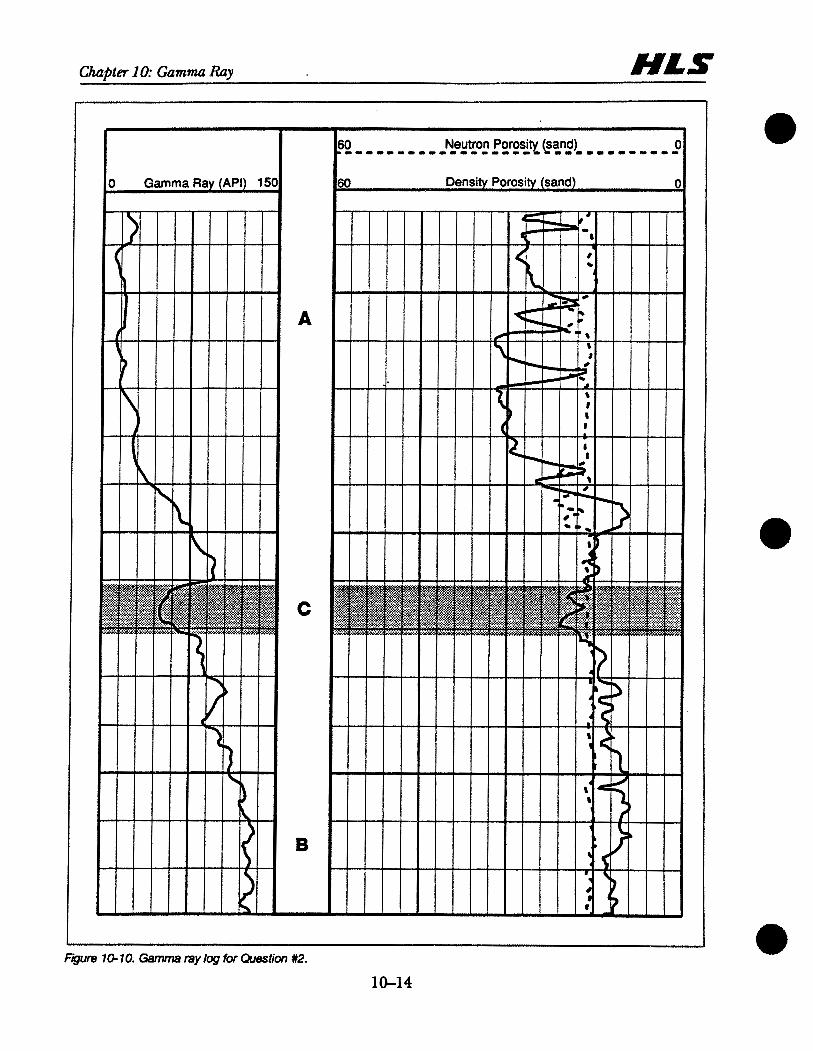
Question # 2
On the gamma ray log shown on Figure 10.10, choose a value for G k b , GR,,,, and
then compute xh in Sand C using the Linear, Clavier and Steiber (N = 3) methods.
*..............*
Gamma ray index
Figure 10-9. Severalrelationships for shale volume, Vsq from gamma ray index, I.
10-13
Chapter 10: Gamma Ray WLS
Fgure 10.10. Gemma my log for Ouestion #2.
10-14
Chdfiter 10: Gamma Rav
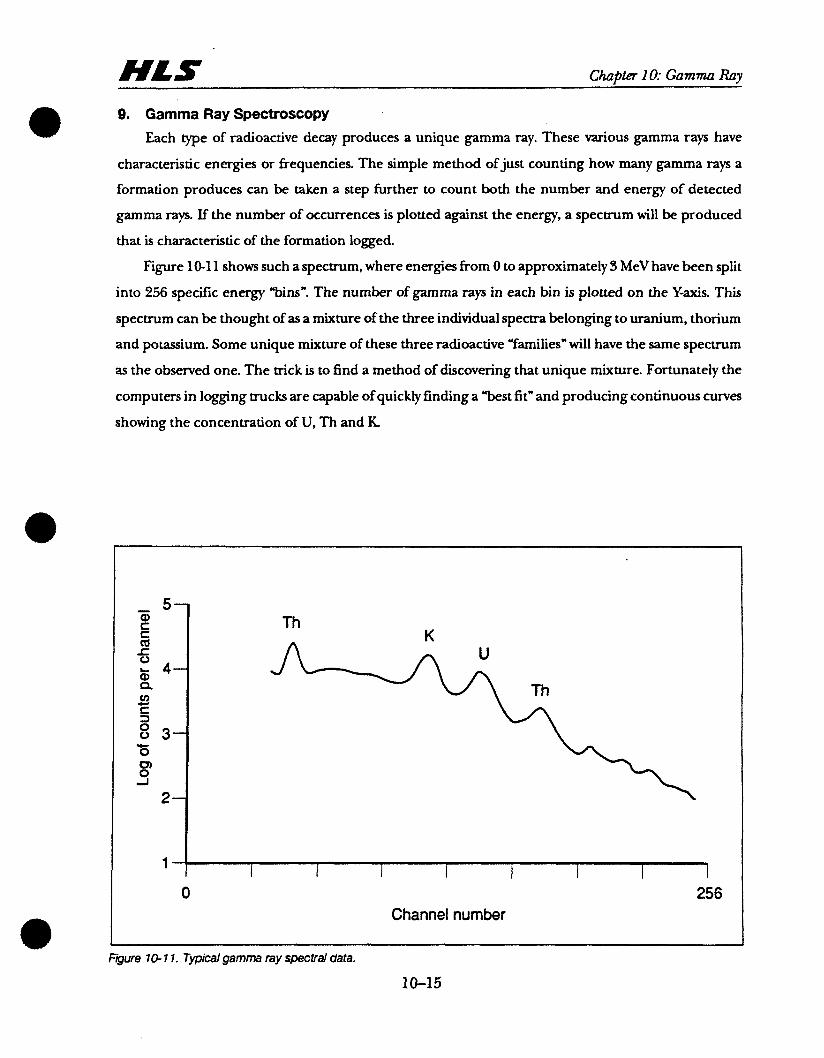
9. Gamma Ray Spectroscopy Each type of radioactive decay produces a unique gamma ray. These various gamma rays have
characteristic energies or frequencies. The simple method of just counting how many gamma rays a
formation produces can be taken a step further to count both the number and energy of detected
gamma rays. If the number of occurrences is plotted against the energy, a spectrum will be produced
that is characteristic of the formation logged.
Figure 10.1 1 shows such a spectrum, where energies from 0 to approximately 3 MeV have been split
into 256 specific energy "bins". The number of gamma rays in each bin is plotted on the Y-axis. This
spectrum can be thought of as a mixture of the three individual spectra belonging to uranium, thorium
and potassium. Some unique mixture of these three radioactive "familiesw will have the same spectrum
as the observed one. The trick is to find a method of discovering that unique mixture. Fortunately the
computers in logging trucks are capable of quickly finding a "best fit" and producing continuous curves
showing the concentration of U, Th and K.
Figure 1 0 1 1. Typical gamma ray spectcal data.
I
- Q,
5- c c m -5 rii 4- n V) C c 3
8 3- .c 0 m 0 a
2-
1
Th K
I 1 I I 1 I I 0 256
Channel number
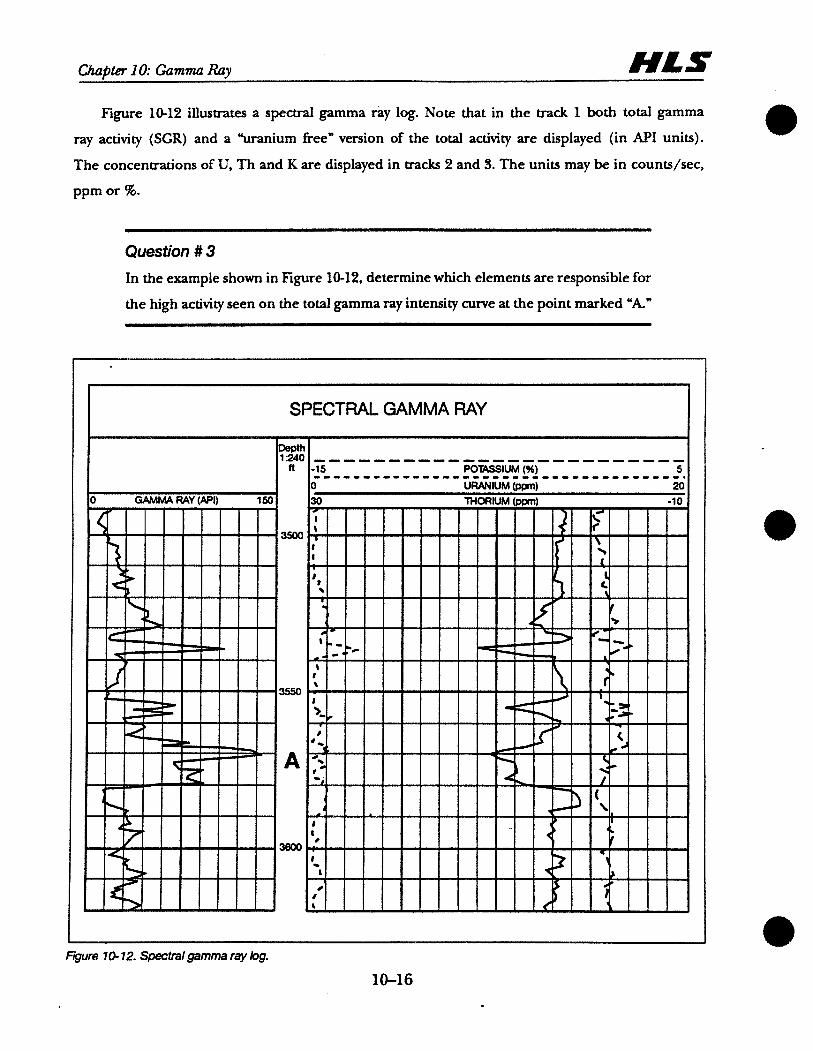
Figure 10-12 illustrates a spectral gamma ray log. Note that in the track 1 both total gamma
ray activity (SGR) and a "uranium keen version of the total activity are displayed (in API units).
The concentrations of U, Th and K are displayed in tracks 2 and 3. The units may be in counts/sec,
ppm or %.
Question # 3
In the example shown in Figure 10-12, determine which elements are responsible for
the high activity seen on the total gamma ray intensity curve at the point marked "A"
SPECTRAL GAMMA RAY
--------- -------- ---- - - - - - - - - -
Fgure 10- 12. Spectral gamma ray bg.
10-16

Chapter 10: Gamma Ray
10. Interpretation of Spectral Gamma.Ray Logs Two general techniques are in use for the interpretation of spectral natural gamma ray logs. One
is the use of the uranium curve (or the ratios U/Th, U/K, and Th/K) as an indicator of hctures.
Another technique is to apply the U, Th and K concentrations with other log data to determine
mineralogy and clay type.
Figure 10-13 illustrates the Miiation of the Th/K ratio in minerals ranging from K-feldspar to
bauxite. Figure 10-14 'mapsw a number of radioactive minerals as a function of their thorium and
potassium contents.
K-feldspar ----- Glauconite
- - - - o m
Illite, Muscovite ------I
Mixed layer clays (illite-montmorillonite) --------- Kaolinite-chlorite .-.-.-----.
Bauxite -I.------.-
I I J
1 10 100
Th/K ratio x 1 04
Figure 7 0 73. Thorium/potassium ratio ranges for several minerats.
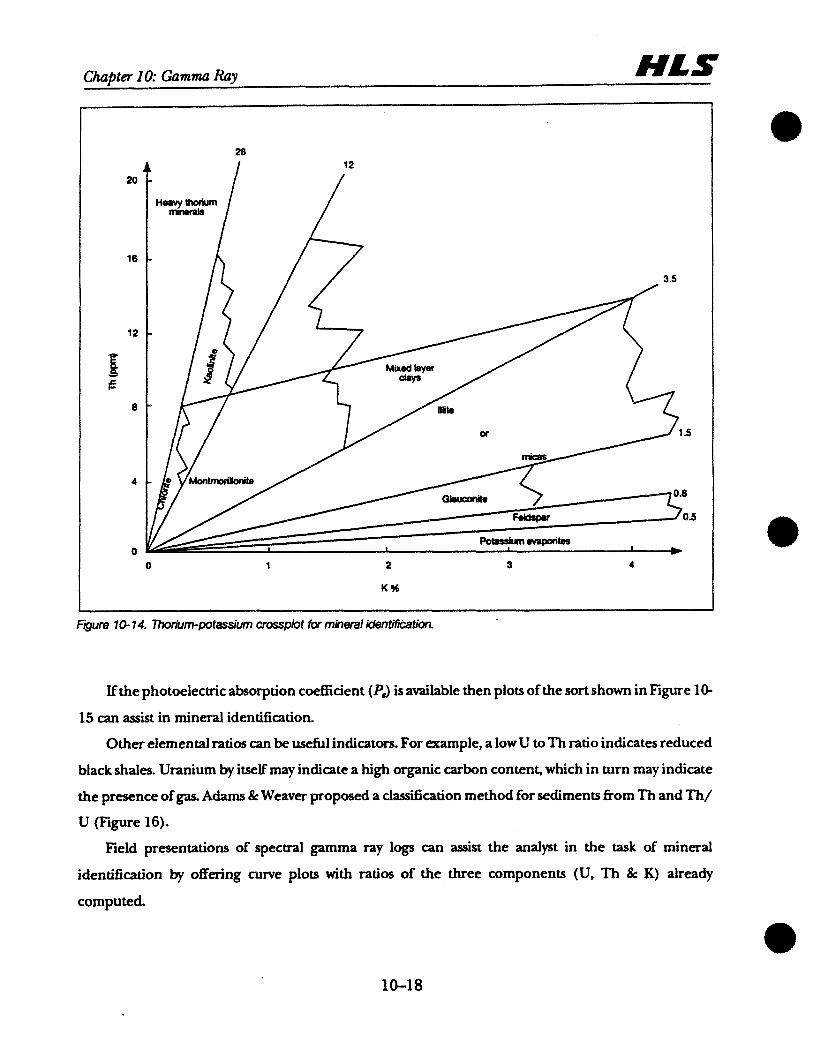
Fgure 10.14. IRonirrn-potassim crosspk,? for mri7eraf identification.
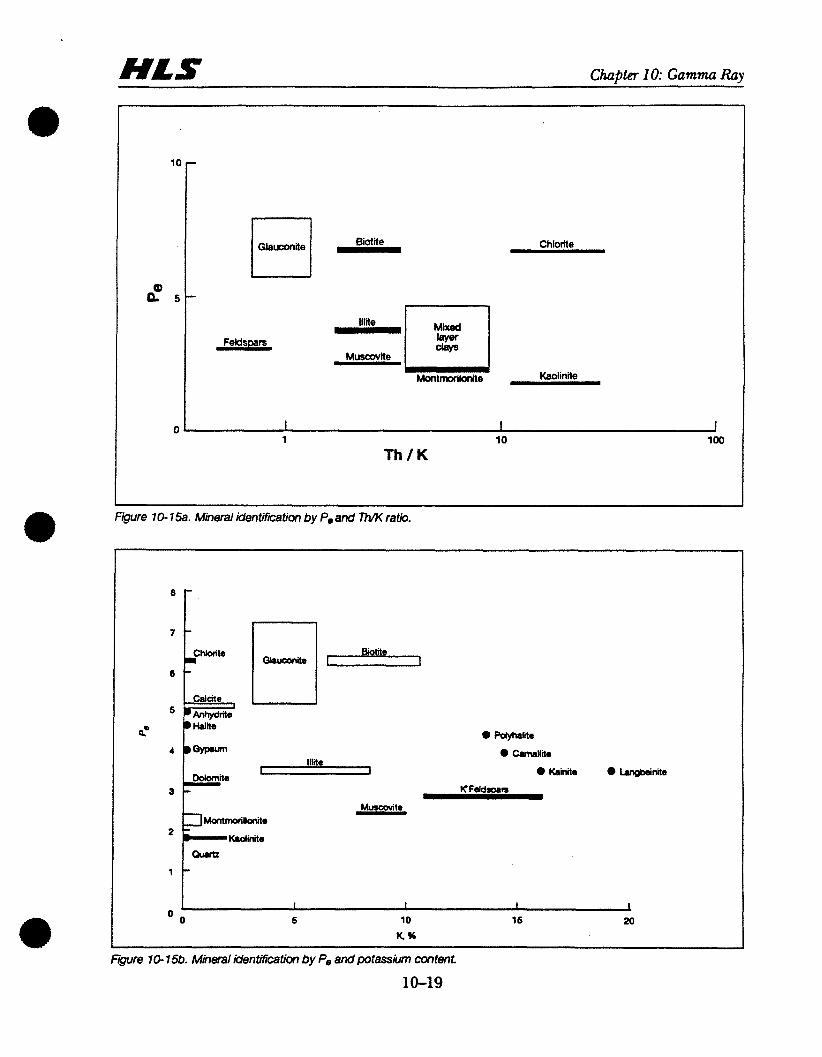
If the photoelecuic absorption coefficient (P,) is available then plots of the sort shown in Figure 10-
15 can assist in mineral identification.
Other elemental ratios can be usehl indicators. For example, a low U to Th ratio indicates reduced
black shales. Uranium by itself may indicate a high organic carbon content, which in turn may indicate
the presence of gas. Adarns &Weaver proposed a classification method for sediments fiom Th and Th/
U (Figure 16).
Field presentations of spectral gamma ray logs can assist the analyst in the task of mineral
identification by offering curve plots with ratios of the three components (U, Th & K) already
computed.
Biotite - Chlorite
Figure 10- 15a. Mineral identifition by Pe and 7NK ratio.
Figure 10- 1%. Miherat identification by Pe and potassium content
10-19
8
7
6
a" 4
3
2
1
O 0
'
-
Calcite 7) CWhpMe B* Halite
l Pdyhdite
DGMuvn l Cmuni i
Ddomiie c z d k = l e r n e eLurgkinite
- KFddspam
Muscovite - =J~artmociuOnite -
w i o
Quub - I I I 1 5 10 15 20
y n
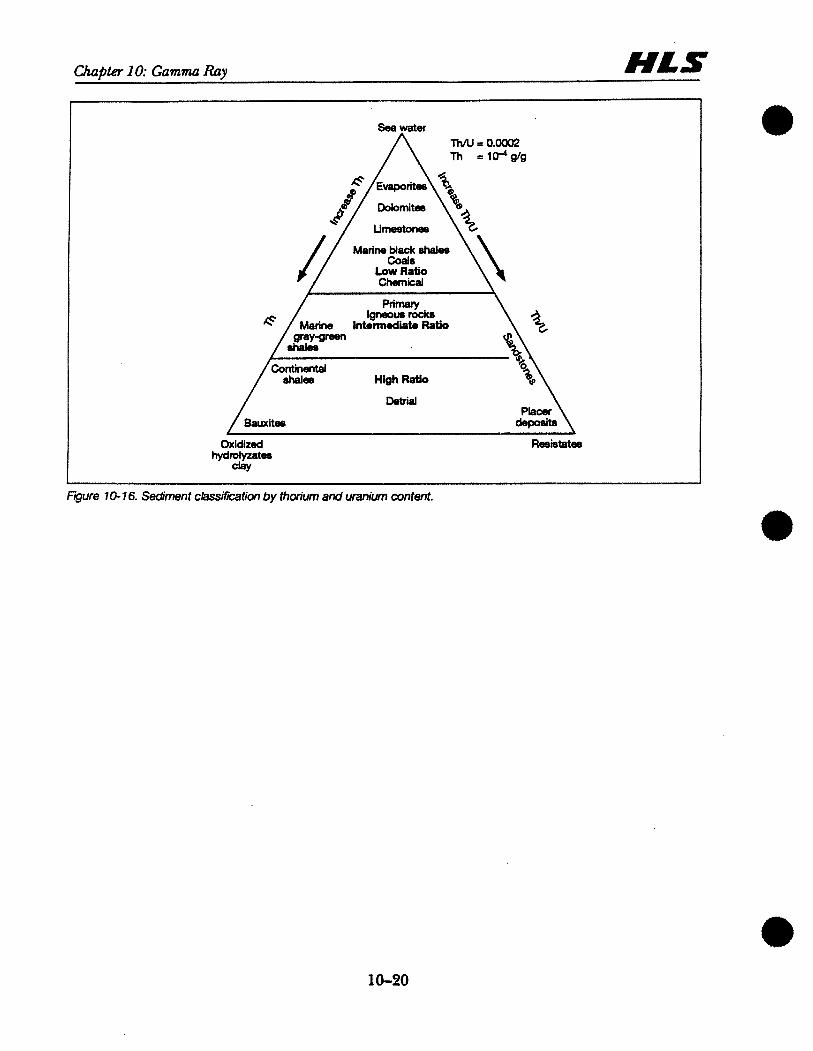
Chapter 10: Gamma Ray #us
Fgure 10- 16. Sediment classif~cation by thcvium and uranium content.

Appendix A
Potassium, Uranium, and Thorium in Rocks and Minerals
Chapter 10: A#mdix A HLS
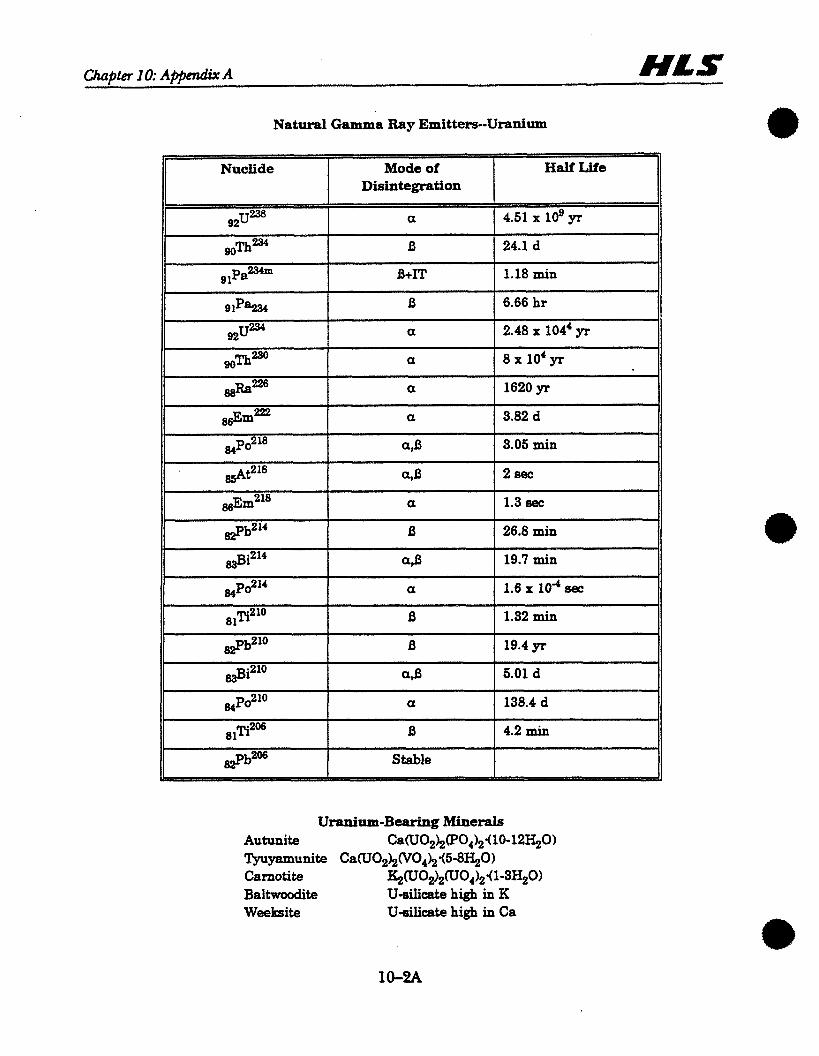
Natural Gamma Ray Emitters--Uranium
- --
Disintegration
Uranium-Bearing Minerals Autunite Ca(U02&CP04)2<10-12~O) Tyuyamunite Ca(U02&(V04)2<5-8~0) Carnotite Ic;W02>zcV04>z.Cl-3~O> Baltwoodite U-eilicate high in K Weeksite U-silicate high in Ca
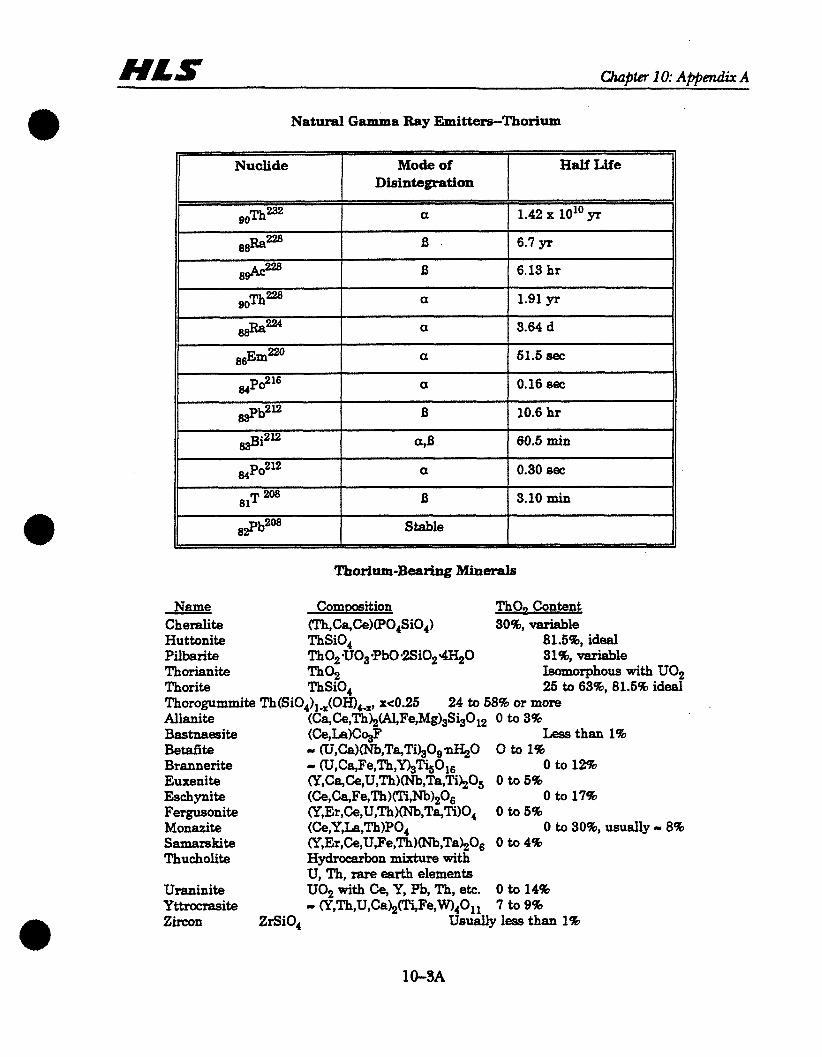
N a t d ~ a & a Ray bitters-Thorium
Thorium-Bearing Minerals
Disintegration
Name Commsition T h a - Content Cheralite (Th,Ca,Ce)B04Si04) 30%, variable Huttonite ThSiO, 81.596, ideal Pilbarite Thoz-U03 Pb0.2Si02 q 0 81%, variable Thorianite Th% Isoxnorphous with U02 Thorite ThSiO, 25 to 63%, 81.5% ideal Thorogummite Th(Si04)l,(OH)4,, xe0.25 24 to 58% or mom Allanite (Ca,Ce,ThhW,Fe,MgI3Si30,, 0 to 3% Bastnaesite CCe,h)Cg Less than 1% B e M ~ t e - CLJ,Ca)RJb,Ta,Ti&09pKz0 0 to 1% Brannerite - ~~,c%Fe,7'~,%'&5O,6. 0 to 12% Euxenite CY,Ca,Ce,U,Th)RJb,Ta,?kh05 0 to 5% Esch ynite (Ce,Ca,Fe,Th)CTT,Nb)20c 0 to 17% Fergusonite W,Er,Ce,U,Th)(Nb,Ta,'lS)04 0 to 5% Monazite (Ce,Y,La,Th)P04 0 to 308, usually - 8% Samarskite CY,Er,Ce,uTe,Th)Qub,Taho6 0 to 4% Thucholite Hydrocarbon mixture with
U, Th, rare earth elements Uraninite UO, with Ce, Y, Pb, Th, etc. 0 to 14% Yttrorrasite - CY,Th,U,Ca)z(Ti,Fe,w)4011 7 to 9% Zircon ZrSi04 Usually less than 1%
s s ~ a ~ ~ ~
8 s ~ m ~ ~ ~
,po216
sspb2*
s i 2 *
,PO,*
81T 208
&b208
a
a
a
B
a$
a
B
Stable
3.64 d
51.5 sec
0.16 sec
10.6 hr
60.5 min
0.30 sec
3.10 min
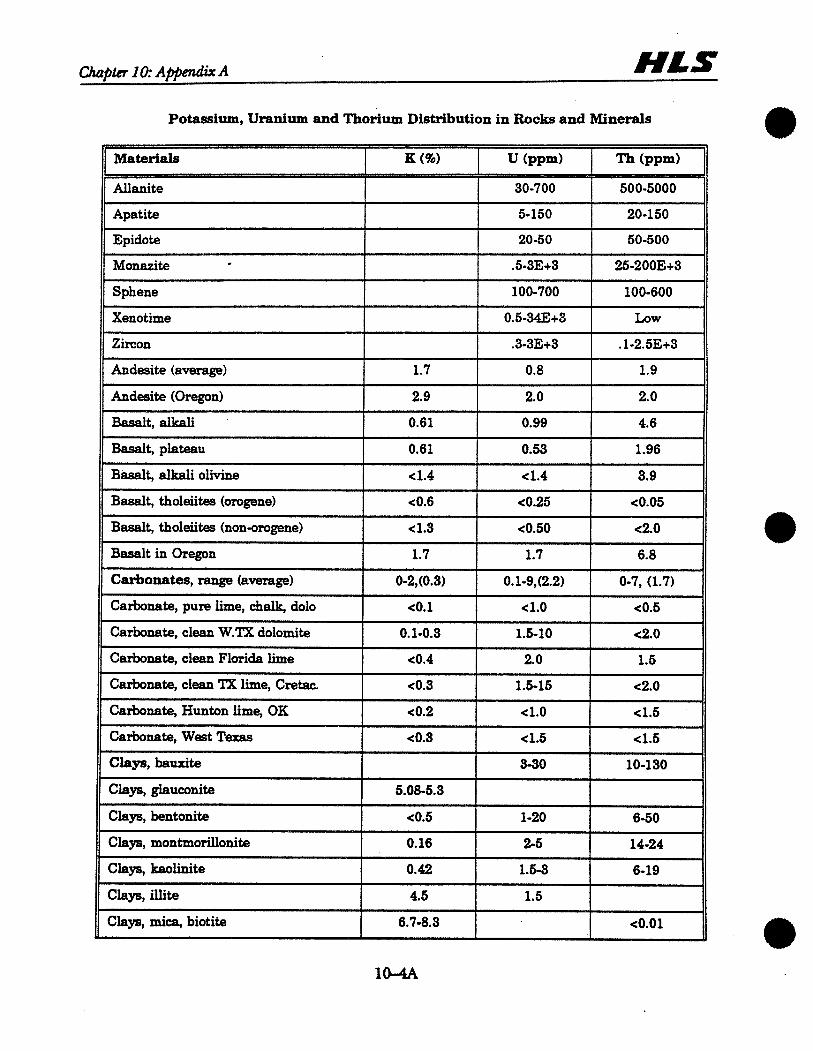
Potassium, Uranium and Thorium Distribution in Rocks and Minerals
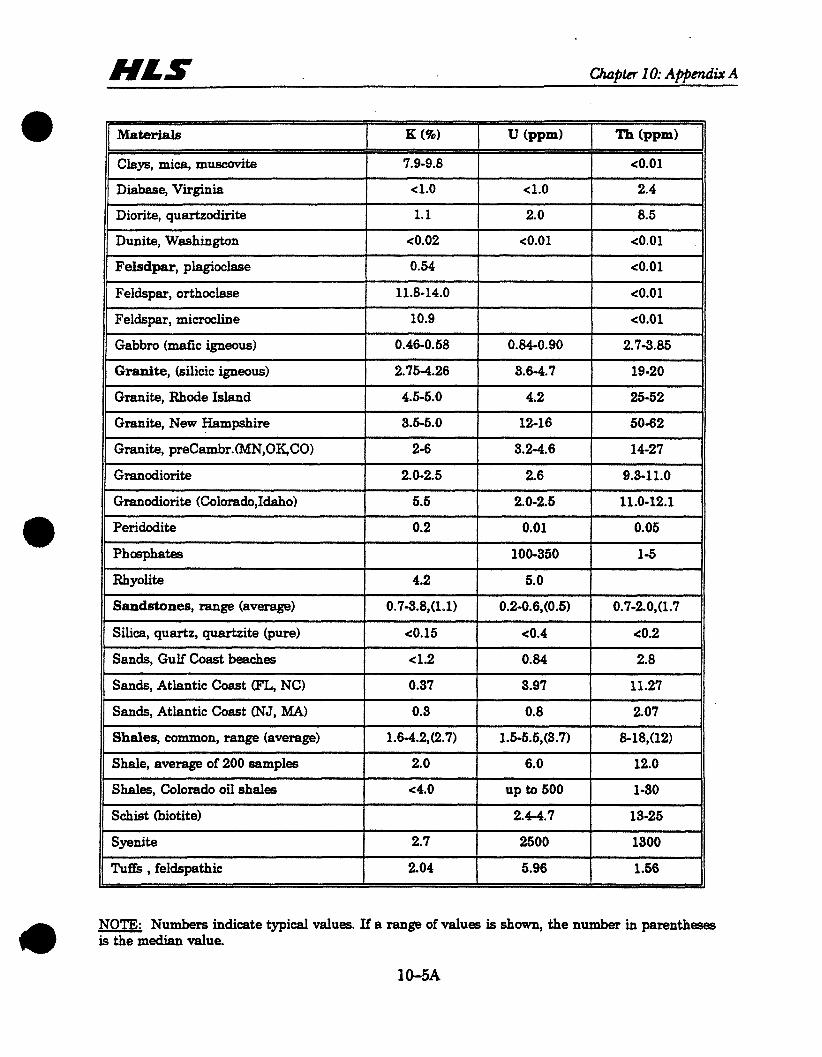
NOTE: Numbers indicate typical values. If a range of values is shown, the number in parentheses - is the median value.
10-5A
Materials
Clays, mica, muscovite
Diabase, Virginia
Diorite, quartzodirite
Dunite, Washington
Felsdpar, plagioclase
Feldspar, orthoclase
Feldspar, microcline
Gabbro (mafic igneous)
Granite, (silicic igneous)
Granite, Rhode Island
Granite, New Hampshire
Granite, preCambr. (MN,OK,CO)
Granodiorite
Granodiorite (Colorado,Idaho)
Peridodite
Phosphates
Rhyolite
Sandstones, range (average)
Silica, quartz, quartzite (pure)
Sands, Gulf Coast beaches
Sands, Atlantic Coast CFL, NC)
Sands, Atlantic Coast (NJ, MA)
Shales, common, range (average)
Shale, average of 200 samples
Shales, Colorado oil shales
Schist (biotite)
Syenite
Tuffs , feldspathic
Th (ppm)
cO.01
2.4
8.5
c0.01
c0.01
c0.01
c0.01
2.7-3.85
19-20
2652
50-62
14-27
9.8-11.0
11.0-12.1
0.05
1-5
0.7-2.0,(1.7
cO.2
2.8
11.27
2.07
8-18,(12)
12.0
1-30
13-25
1300
1.56
K (%I
7.9-9.8
c1.0
1.1
c0.02
0.54
11.8-14.0
10.9
0.46-0.58
2.75-4.26
4.5-5.0
3.5-5.0
2-6
2.0-2.5
5.5
0.2
4.2
0.7-3.8,(1.1)
40.15
4 . 2
0.37
0.3
1.6-4.2,(2.7)
2.0
c4.0
2.7
2.04
U (ppm)
c1.0
2.0
c0.01
0.84-0.90
3.64.7
4.2
12-16
3.2-4.6
2.6
2.0-2.6
0.01
100-350
5.0
0.2-0.6,(0.5)
cO.4
0.84
3.97
0.8
1.5-5.5,(3.7)
6.0
up to 500
2.4-4.7
2500
5.96