Embed Size (px)
Citation preview

Chapter Three – Phosphate stabilisation experiments
Chapter Three
Phosphate stabilisation experiments
3.1 Introduction
Kinetic column leaching experiments using phosphate coating solutions were
considered by this study to be the most suitable experimental method to
achieve the primary research objective. Column leaching experiments are a
common kinetic test utilised in the mining industry to determine oxidation rates
and geochemical reactions that occur in typical mine waste materials (Morin
and Hutt, 1997). Column leach experiments can be manipulated to promote
specific mechanisms, such as the stabilisation of sulphide mine wastes by
phosphate coatings, and was the experimental method chosen by many
researchers (Evangelou, 2001; Matlock et al., 2003; Nyavor and Egiebor, 1995;
Vandiviere and Evangelou, 1998).
The experimental set-up was devised after an extensive review of the previous
research. Phosphate stabilisation was chosen in preference to the use of
silicates (Fytas et al., 1999; Zhang and Evangelou, 1998) and organic ligands
(Belzile et al., 1997; Chen et al., 1999; Matlock et al., 2003) due to the ease and
safety of handling, cost efficiency and commercial availability of phosphate
stabilisers. The majority of previously published research into phosphate
stabilisation has concentrated on pure iron sulphide samples, pyritic coal
wastes or Pb-contaminated soils. The unpublished work of Woltmann (2001)
demonstrated the ability of the phosphate stabilisation technique to reduce acid
generation and metal release from samples consisting of pure chalcopyrite and
arsenopyrite. Three column leaching experiments were contrived to investigate
the potential of the phosphate stabilisation technique to prevent acid generation
and metal release in: a) polyminerallic, sulphidic mine waste and, b) partly
oxidised, polyminerallic mine waste, using liquid and solid phosphate stabilisers
on a laboratory scale.
51

Chapter Three – Phosphate stabilisation experiments
• Experiment 1 – polyminerallic, unoxidised, sulphidic mine waste using
liquid phosphate stabiliser.
• Experiment 2 – partly oxidised, polyminerallic mine waste using liquid
phosphate stabiliser.
• Experiment 3 – partly oxidised, polyminerallic mine waste using liquid
and solid phosphate fertilisers.
Chapter 3 contains the methodology and results for the three phosphate
stabilisation experiments. The overall column design and experimental and
analytical procedures that were identical for all three experiments are described
in a separate experimental methods section after the introduction (Section 3.2).
The specific aims, methods and results of each experiment are dealt with in
separate sections. The experimental sections are arranged chronologically,
allowing observations and conclusions drawn from earlier experiments to be
applied to later experiments. A summary of the overall results of the three
experiments concludes the chapter.
3.2 Experimental methods
3.2.1 Column Design
All three phosphate stabilisation experiments were conducted as kinetic column
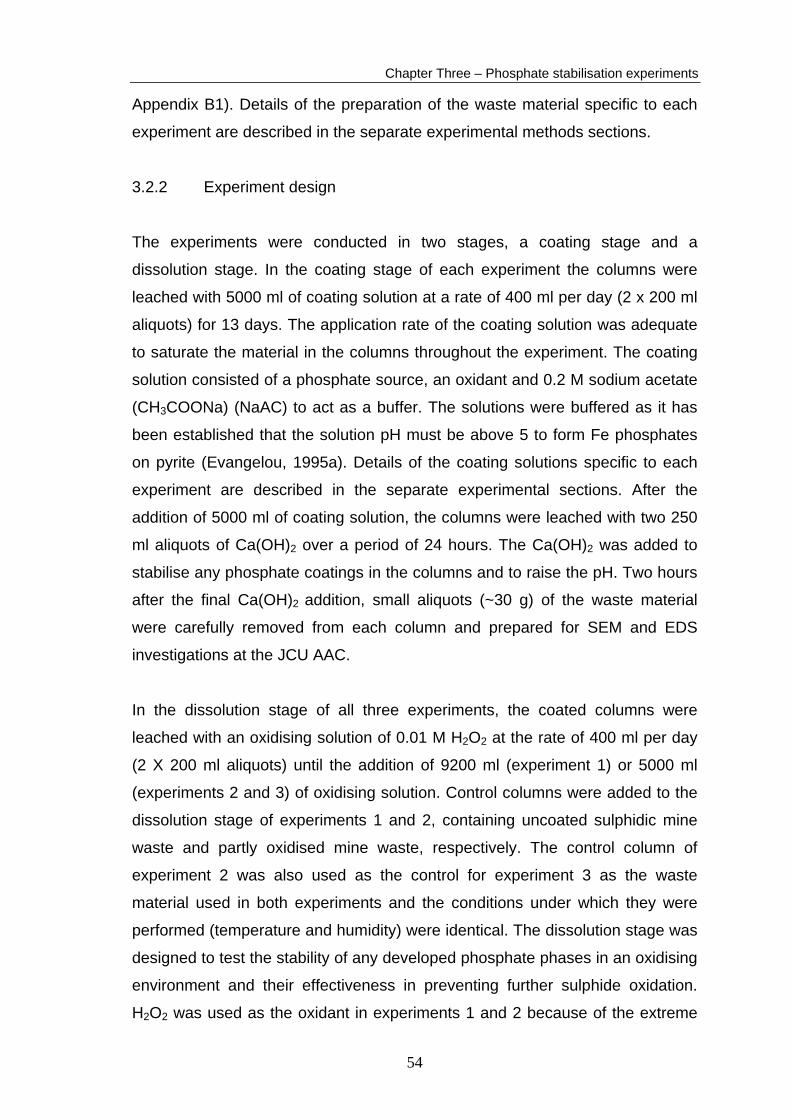
leaching experiments using identical column designs (Fig. 3.1). Columns were
constructed using polyvinyl chloride pipes of approximately 50 cm length and
5.7 cm internal diameter. Two layers of nylon gauze (grid size 180 μm) and a 2
cm thick layer of glass wool were inserted into the bottom of each column. A
layer of pure quartz sand, approximately 2 cm thick, was placed over the glass
wool. Plastic funnels were glued to the base of the columns to guide the
leachate into 800 ml beakers. Approximately 400 g of the sulphide/sand mixture
(experiment 1) or partly oxidised mine waste (experiments 2 and 3) were
scooped into the column. Finally, another 2 cm thick layer of pure quartz sand
was placed at the top of the column. The layers of quartz sand were placed
52

Chapter Three – Phosphate stabilisation experiments
above and below the mine waste to prevent the development of preferential flow
channels in the columns. The quartz sand was washed with 1 M HCl to ensure
purity and then flushed repeatedly with distilled water to rinse out the HCl before
being placed into the columns.
5.7 cm
mine waste
quartz sand
quartz sand
glass wool 2 cm
leachate
oxidising solution: 0.01 M H2O2 9200 ml (experiment 1) 5000 ml (experiments 2 and 3) applied at 2 x 200ml/day
nylon gauze
coating solution: phosphate oxidant buffer 5000 ml applied at 2 x 200 ml/day
Figure 3.1. Diagram of the column design used in the phosphate stabilisation experiments.
Mine waste material used in the columns was sourced from the abandoned
Montalbion silver mine, far north Queensland (Chapter 2). Random sulphide-
rich grab samples and composite mine waste samples were collected from
waste dump faces (Fig. 2.1). The waste material was crushed in a steel jaw
crusher and sieved, with the >2 mm and <10 mm fraction being retained. The
waste material was then mixed thoroughly until homogeneity was achieved and
quartered to ensure the material in each column was, for all practical purposes,
identical. Representative samples of the waste material were pulverised in a
chrome-steel mill and split, with one fraction being analysed by X-ray
fluorescence spectrometry (XRF), the other by XRD at the JCU AAC (results in
53
Chapter Three – Phosphate stabilisation experiments
Appendix B1). Details of the preparation of the waste material specific to each
experiment are described in the separate experimental methods sections.
3.2.2 Experiment design
The experiments were conducted in two stages, a coating stage and a
dissolution stage. In the coating stage of each experiment the columns were
leached with 5000 ml of coating solution at a rate of 400 ml per day (2 x 200 ml
aliquots) for 13 days. The application rate of the coating solution was adequate
to saturate the material in the columns throughout the experiment. The coating
solution consisted of a phosphate source, an oxidant and 0.2 M sodium acetate
(CH3COONa) (NaAC) to act as a buffer. The solutions were buffered as it has
been established that the solution pH must be above 5 to form Fe phosphates
on pyrite (Evangelou, 1995a). Details of the coating solutions specific to each
experiment are described in the separate experimental sections. After the
addition of 5000 ml of coating solution, the columns were leached with two 250
ml aliquots of Ca(OH)2 over a period of 24 hours. The Ca(OH)2 was added to
stabilise any phosphate coatings in the columns and to raise the pH. Two hours
after the final Ca(OH)2 addition, small aliquots (~30 g) of the waste material
were carefully removed from each column and prepared for SEM and EDS
investigations at the JCU AAC.
In the dissolution stage of all three experiments, the coated columns were
leached with an oxidising solution of 0.01 M H2O2 at the rate of 400 ml per day
(2 X 200 ml aliquots) until the addition of 9200 ml (experiment 1) or 5000 ml
(experiments 2 and 3) of oxidising solution. Control columns were added to the
dissolution stage of experiments 1 and 2, containing uncoated sulphidic mine
waste and partly oxidised mine waste, respectively. The control column of
experiment 2 was also used as the control for experiment 3 as the waste
material used in both experiments and the conditions under which they were
performed (temperature and humidity) were identical. The dissolution stage was
designed to test the stability of any developed phosphate phases in an oxidising
environment and their effectiveness in preventing further sulphide oxidation.
H2O2 was used as the oxidant in experiments 1 and 2 because of the extreme
54

Chapter Three – Phosphate stabilisation experiments
oxidising environment it creates, thus allowing relatively short-term dissolution
experiments to simulate much longer oxidation periods under natural conditions
(Georgopoulou et al., 1996). At the completion of the dissolution stage, the
columns were dismantled and a sample (~50 g) from each column was
prepared for investigation with SEM and EDS at the JCU AAC.
3.2.3 Analytical methods
Throughout both stages of all three experiments, the leachate temperature, pH
and conductivity of each 200 ml aliquot was measured. The pH was measured
in the receiving beaker using a Radiometer Copenhagen PHM210 pH meter
with an Ag/AgCl electrode whilst the sample was being stirred by a Variomag
magnetic stirrer and bead. The conductivity was measured using a Hanna
H98303 handheld conductivity meter with a 2000 μS/cm upper detection limit.
Dilution of the coating stage leachates by a factor of up to 50 times was
required due to high conductivities of the coating solution.
Leachate samples were stored under refridgeration at 4o C. Precipitates were
observed in several of the leachates, therefore selected samples were
decanted, but not filtered, before being analysed by ICP-MS and ICP-AES at
the JCU AAC, Townsville. Specific sampling regimes and elements analysed
are detailed in the separate experimental sections (Sections 3.3.2, 3.4.2 and
3.5.2). Detection limits of elements varied between experiments due to varying
dilution factors necessitated by the nature of the coating solutions.
The samples of waste material collected from the columns at the completion of
the two experimental stages were inspected underneath a binocular
microscope. Ten to 20 representative grains from each sample were chosen for
SEM and EDS investigation. The grains were mounted on SEM stubs and
carbon-coated to promote conductivity. Polished blocks were not investigated
as Woltmann (2001) ascertained that the phosphate phases formed were too
thin and/or fragile to survive the polished block making process. The lack of
grains with flat surfaces prevented quantitative EDS analysis, allowing only
general bulk chemistries of the analysed surficial phases to be determined.
55
Chapter Three – Phosphate stabilisation experiments
SEM observations were performed on a Jeol JSM-6300 scanning electron
microscope and EDS measurements were taken with a Moran Scientific V8.5
Multi Channel Analyser at the AAC, JCU, Cairns. Selected samples were gold-
coated for SEM photography, which was undertaken on a Jeol JSM-5410LV
scanning electron microscope at the AAC, JCU, Townsville.
3.3 Phosphate stabilisation of polyminerallic, sulphidic mine waste using liquid chemical stabilisers (experiment 1)
3.3.1 Aims
The aims of experiment 1 were:
a) to determine the morphologies and chemistries of any phosphate
phases formed by the interaction of polyminerallic, sulphidic (i.e.
unoxidised) mine waste with liquid phosphate stabilisers;
b) to determine the stability, metal attenuation ability and acid
generation inhibition ability of any phosphate phases formed by the
interaction of polyminerallic, sulphidic (i.e. unoxidised) mine waste
with liquid phosphate stabilisers.
3.3.2 Specific methodology
Sulphide-rich Montalbion mine waste material was handpicked to generate a
polyminerallic, sulphidic mine waste with representative ratios of the major
sulphide minerals present in the Montalbion waste dump (galena > sphalerite >
chalcopyrite > tetrahedrite > pyrite > arsenopyrite). The XRD trace of the
sulphidic mine waste revealed the presence of an appreciable amount of
anglesite (Appendix B1). In order to ensure the majority of the waste material
was comprised of sulphides and quartz, the columns were washed with 10 x
200 ml flushes of 1 M HCl, which removed the majority of any soluble
secondary oxidation products present in the waste material. Anglesite was
reduced to levels below detection by XRD (Appendix B1). However, SEM
observation of HCl-washed grains revealed a small number of euhedral
56

Chapter Three – Phosphate stabilisation experiments
anglesite crystals and traces of unidentified Cu and Fe sulphates. Residual
sulphates persisted due to kinetic factors, the short HCl residence time failing to
completely dissolve larger crystals. Following HCl washing, the columns were
then flushed with distilled water until all HCl was removed from the columns.
The HCl-washed sulphidic mine waste was mixed with pure HCl-washed quartz
sand at a 1:1 ratio to increase the porosity of the material.
The compositions and concentrations of the coating solutions used in
experiment 1 were prepared using the protocols of Fytas and Evangelou (1998)
(Table 3.1).
Table 3.1. Coating solutions used in the coating stage of experiment 1.
Oxidant Phosphate Buffer
Column A 0.01 M H2O2 0.2 M KH2PO4 0.2 M CH3COONa
Column B 0.01 M H2O2 0.4 M KH2PO4 0.2 M CH3COONa
Column C 0.1 M H2O2 0.4 M KH2PO4 0.2 M CH3COONa
Column D 0.2 M H2O2 0.2 M KH2PO4 0.2 M CH3COONa
Five litres of coating solution were added to the respective columns at a rate of
400 ml per day. During the coating stage, leachate samples were collected after
the addition of 1200 ml, 3000 ml and 5000 ml of coating solution. These
leachates were analysed for Ag (5 μg/l), Al (100 μg/l), As (1 μg/l), Ca (100 μg/l),
Cd (5 μg/l), Cu (0.1 μg/l), In (5 μg/l), Mg (10 μg/l), Mn (10 μg/l), Pb (0.05 μg/l),
Sb (0.1 μg/l), Se (100 μg/l), and Zn (5 μg/l ) by ICP-MS and for Fe (100 μg/l), K
(1 mg/l), Na (0.5 mg/l), S (1 mg/l) and Si (1 mg/l) by ICP–AES. Detection levels
are shown in brackets.
The results of Woltmann (2001) indicated a steady decrease in the coated
column leachate pH throughout the dissolution stage. In order to discover
whether leachate pH would stabilise or continue to decrease, the dissolution
stage of experiment 1 was run until the coated column leachate pH’s either
stabilised or decreased to the control column leachate pH. The dissolution
57
Chapter Three – Phosphate stabilisation experiments
stage was halted after the addition of 9200 ml of 0.01 M H2O2 at a rate of 400
ml per day. Leachate samples were collected after the addition of 400 ml and
then every 1200 ml addition until the addition of 9200 ml of oxidant. These
samples were analysed for As, Cu, Pb, Sb and Zn by ICP–MS and Fe and S by
ICP–AES (detection levels as above).
3.3.3 Coating stage results
The XRD and bulk XRF results for the sulphidic waste material used in the
columns of experiment 1 are tabulated in Appendix B1. Small quantities of off-
white precipitate were observed in initial coating stage leachates of all columns.
The precipitates were mostly fine-grained quartz sand particles, though some
iron precipitates were probably responsible for the discolouration. The leachates
became clear after ~1000 ml of coating solution addition. Complete chemical
results for the coating stage leachates are tabulated in Appendix B2.
Leachate chemistry
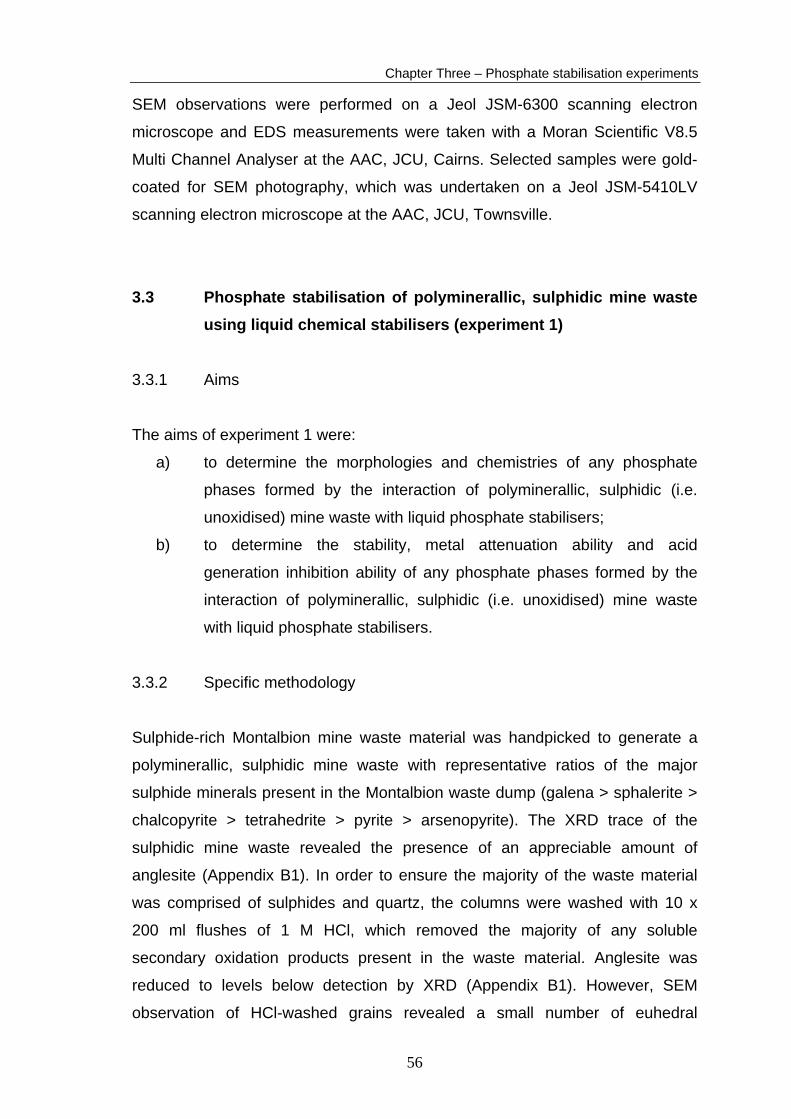
The column leachates were buffered to pH values of 5 to 5.7 throughout the
coating stage of the experiment (Fig. 3.2a). The coating solutions were
therefore above the minimum pH required for stable phosphate phases to form
(Evangelou, 1994). Several jumps in the leachate pH occurred during the
coating stage. Reference measurements of buffer solutions showed similar
jumps, proving that the jumps in the leachate pH readings were caused by
instrumental error. Despite these problems, pH drift for individual columns for
the duration of the coating stage was restricted to 0.4 of a pH unit. Instrumental
problems caused 0.2 pH units of that drift, therefore pH drift for each column
leachate was limited to 0.2 pH units during the coating stage (Fig. 3.2a). The pH
values of column B and C leachates were lower than column A and D leachates
as they contained twice the concentration of KH2PO4 (Table 3.1). This is a result
of acid production from KH2PO4 disassociation:
KH2PO4(aq) → K+(aq) + 2H+
(aq) + PO43-
(aq) (3.1)
58
Chapter Three – Phosphate stabilisation experiments
5.00
5.50
6.00
200
600
1000
1400
1800
2200
2600
3000
3400
3800
4200
4600
5000
cumulative leachate (ml)
pH
Column AColumn BColumn CColumn D
Figure 3.2a.
0
10000
20000
30000
40000
50000
60000
70000
80000
200
600
1000
1400
1800
2200
2600
3000
3400
3800
4200
4600
5000
cumulative leachate (ml)
cond
uctiv
ity ( μ
S/cm
)
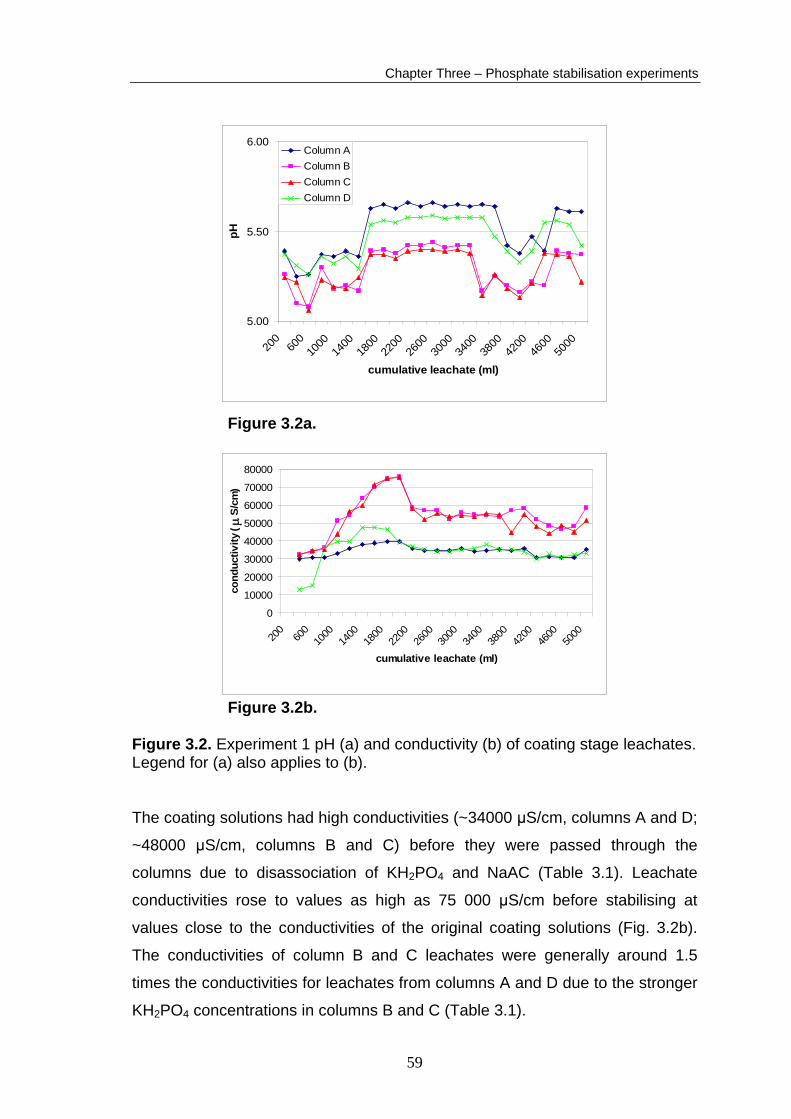
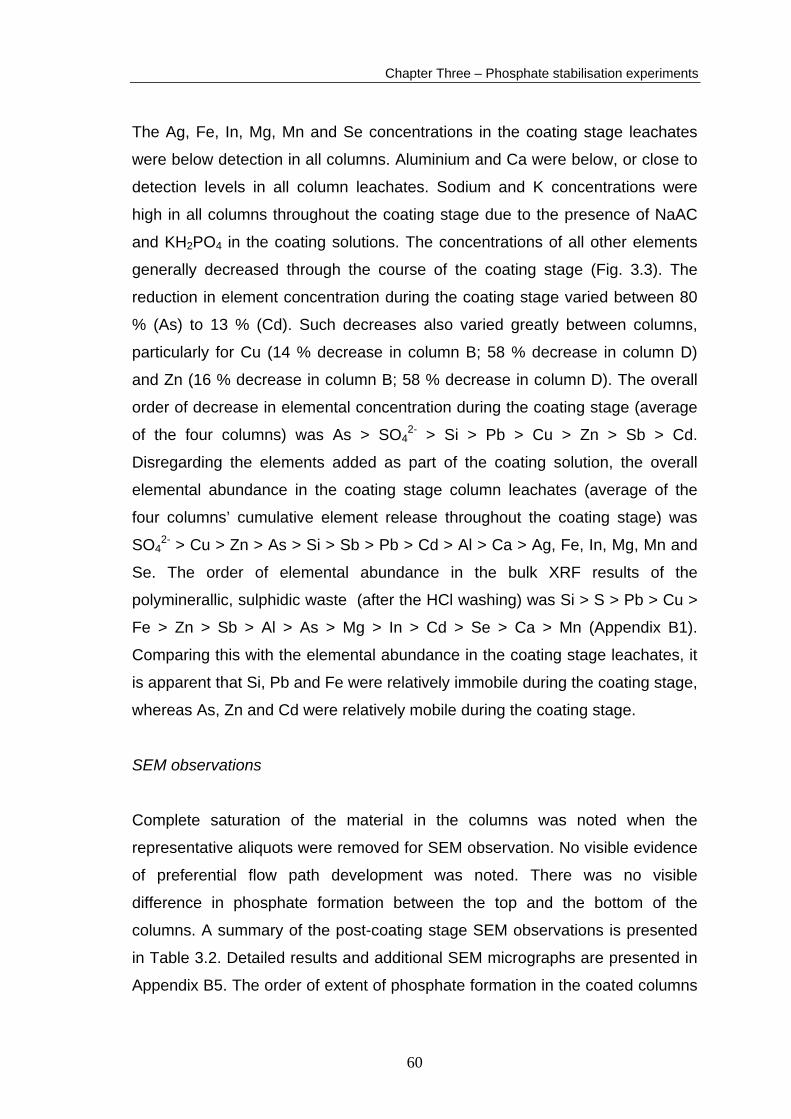
Figure 3.2b. Figure 3.2. Experiment 1 pH (a) and conductivity (b) of coating stage leachates. Legend for (a) also applies to (b). The coating solutions had high conductivities (~34000 μS/cm, columns A and D;
~48000 μS/cm, columns B and C) before they were passed through the
columns due to disassociation of KH2PO4 and NaAC (Table 3.1). Leachate
conductivities rose to values as high as 75 000 μS/cm before stabilising at
values close to the conductivities of the original coating solutions (Fig. 3.2b).
The conductivities of column B and C leachates were generally around 1.5
times the conductivities for leachates from columns A and D due to the stronger
KH2PO4 concentrations in columns B and C (Table 3.1).
59
Chapter Three – Phosphate stabilisation experiments
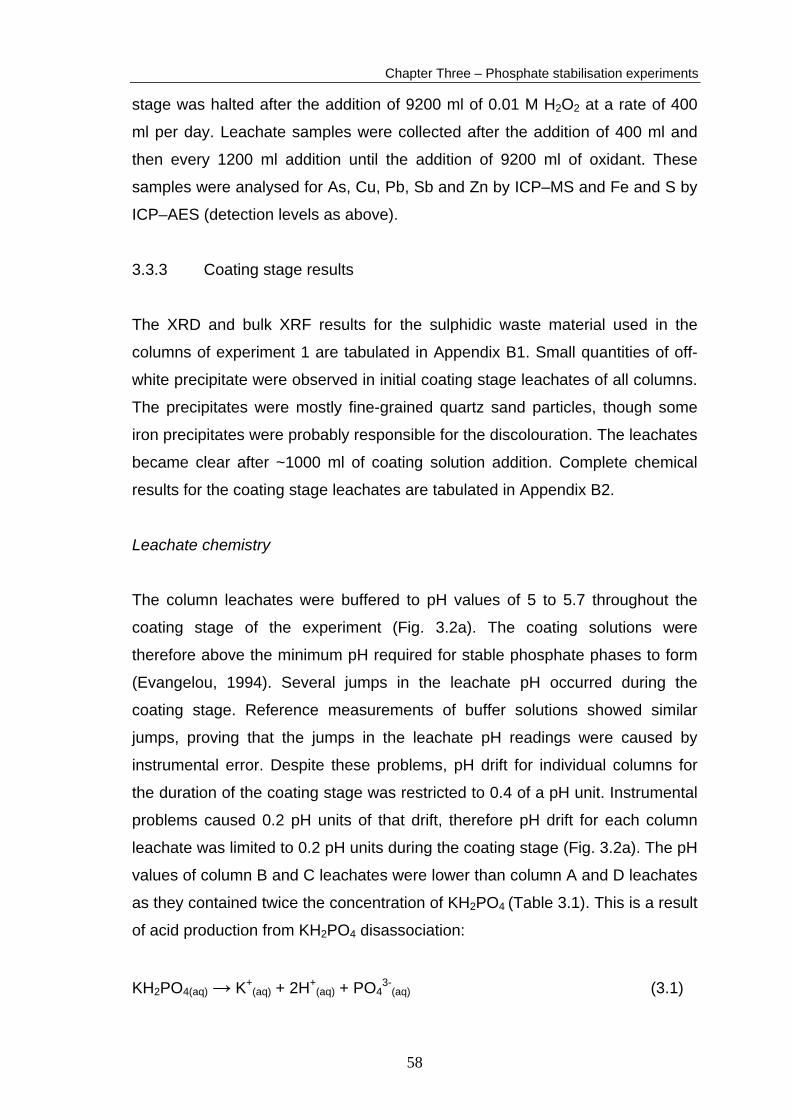
The Ag, Fe, In, Mg, Mn and Se concentrations in the coating stage leachates
were below detection in all columns. Aluminium and Ca were below, or close to
detection levels in all column leachates. Sodium and K concentrations were
high in all columns throughout the coating stage due to the presence of NaAC
and KH2PO4 in the coating solutions. The concentrations of all other elements
generally decreased through the course of the coating stage (Fig. 3.3). The
reduction in element concentration during the coating stage varied between 80
% (As) to 13 % (Cd). Such decreases also varied greatly between columns,
particularly for Cu (14 % decrease in column B; 58 % decrease in column D)
and Zn (16 % decrease in column B; 58 % decrease in column D). The overall
order of decrease in elemental concentration during the coating stage (average
of the four columns) was As > SO42- > Si > Pb > Cu > Zn > Sb > Cd.
Disregarding the elements added as part of the coating solution, the overall
elemental abundance in the coating stage column leachates (average of the
four columns’ cumulative element release throughout the coating stage) was
SO42- > Cu > Zn > As > Si > Sb > Pb > Cd > Al > Ca > Ag, Fe, In, Mg, Mn and
Se. The order of elemental abundance in the bulk XRF results of the
polyminerallic, sulphidic waste (after the HCl washing) was Si > S > Pb > Cu >
Fe > Zn > Sb > Al > As > Mg > In > Cd > Se > Ca > Mn (Appendix B1).
Comparing this with the elemental abundance in the coating stage leachates, it
is apparent that Si, Pb and Fe were relatively immobile during the coating stage,
whereas As, Zn and Cd were relatively mobile during the coating stage.
SEM observations
Complete saturation of the material in the columns was noted when the
representative aliquots were removed for SEM observation. No visible evidence
of preferential flow path development was noted. There was no visible
difference in phosphate formation between the top and the bottom of the
columns. A summary of the post-coating stage SEM observations is presented
in Table 3.2. Detailed results and additional SEM micrographs are presented in
Appendix B5. The order of extent of phosphate formation in the coated columns
60

Chapter Three – Phosphate stabilisation experiments
1
10
100
1000
10000
1200
5000
1600
4000
6400
8800
cumulative leachate (ml)
As
(g/
l)
0
1000
2000
3000
4000
5000
6000
1200
5000
1600
4000
6400
8800
cumulative leachate (ml)
Sb (
g/l)
Figure 3.3a. As Figure 3.3b. Sb
100
1000
10000
100000
1200
5000
1600
4000
6400
8800
cumulative leachate (ml)
Cu
(g/
l)
100
1000
10000
100000
1200
5000
1600
4000
6400
8800
cumulative leachate (ml)
Zn (
g/l)
Figure 3.3c. Cu Figure 3.3d. Zn
10
100
1000
10000
100000
1000000
1200
5000
1600
4000
6400
8800
cumulative leachate (ml)
Pb (
g/l)
0100200300400500600700800900
1000
1200
5000
1600
4000
6400
8800
cumulative leachate (ml)
Fe (
g/l)
Column AColumn BColumn CColumn DControl
Figure 3.3e. Pb Figure 3.3f. Fe
1
10
100
1000
10000
1200
5000
1600
4000
6400
8800
cumulative leachate (ml)
SO42-
(mg/
l)
Figure 3.3. Concentrations of elements in leachates of experiment 1. Legend for (f) applicable to all graphs. Vertical line represents addition of Ca(OH)2 and separates coating stage results (left of the line) from dissolution stage results (right of the line).
Figure 3.3g. SO42-
61
Chapter Three – Phosphate stabilisation experiments
was: column D > column C >> column B > column A (based on visual
estimation). This applied to all phosphate species observed. Two major forms of
phosphate phase were observed. Firstly, an “amorphous” (see definitions),
occasionally layered Fe–K+Cu phosphate, which formed a coating on
chalcopyrite (Fig. 3.4a,b,d) and, to a lesser extent, pyrite and arsenopyrite.
Secondly, metal + alkali phosphate crystals which formed isolated precipitates
or coalescences, usually on, but not restricted to, their parent sulphide (e.g. Pb
phosphate on galena (Fig. 3.4c); Zn phosphate on sphalerite (Fig. 3.4b)).
Galena hosted the most extensive precipitates in all columns, whereas
chalcopyrite was extensively coated by the amorphous Fe–K phosphates. In
contrast to previous research (cf. Evangelou, 1994, 1995b; Huang and
Evangelou, 1994), pyrite was rarely and poorly coated (Fig. 3.4a). Tetrahedrite
was uncoated and only rarely hosted phosphate precipitates. The phosphate
coatings, regardless of thickness, displayed a network of cracks which are
interpreted to be a result of desiccation during sample preparation or under the
vacuum of the SEM (Jones et al., 2003). Late Ca, Cu, Pb, Pb-As and Zn
sulphate precipitates were observed in columns C and D.
3.3.4 Dissolution stage results
Leachate chemistry
Complete chemical results for the dissolution stage leachates are tabulated in
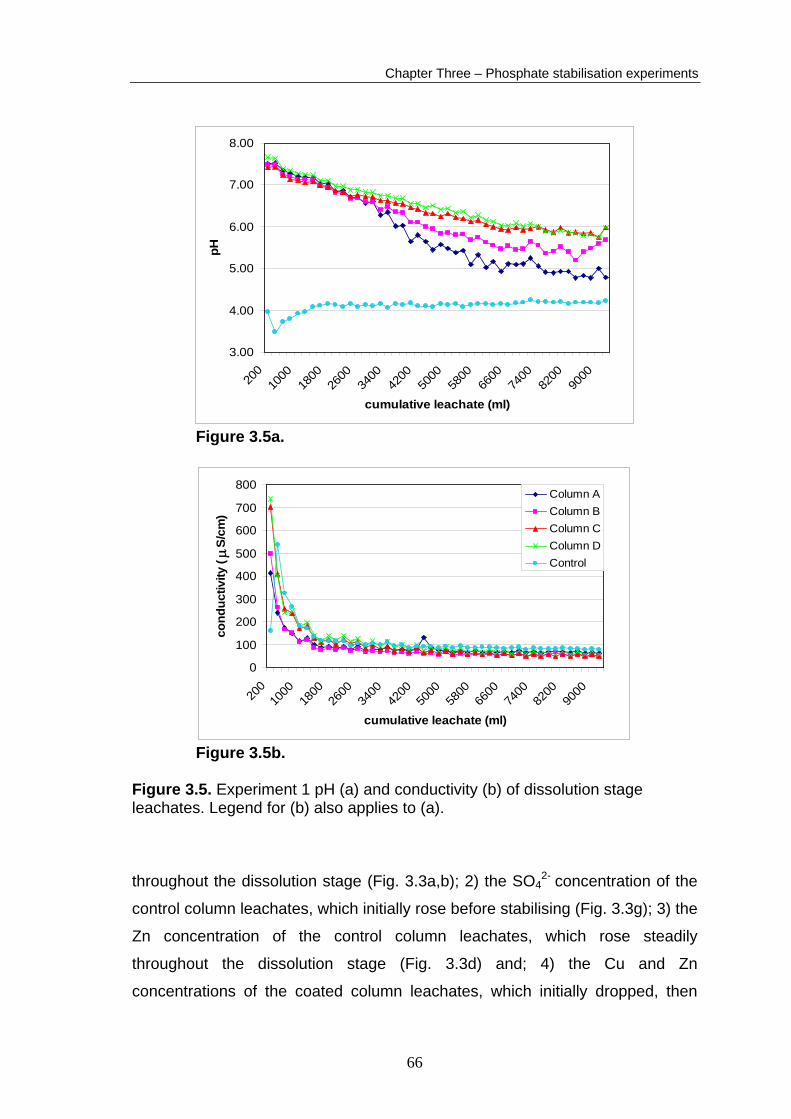
Appendix B2. The control column leachate pH initially dropped to 3.5, then
steadily rose, stabilising at a value of 4.15. This demonstrates the acidic nature
of the sulphidic waste material (Fig. 3.5a). The addition of Ca(OH)2 stabiliser
between the end of the coating stage and the start of the dissolution stage
raised the pH of the coated column leachates to around 7.5. The pH of the
coated column leachates dropped steadily until the rates of pH decline diverged
after 3000 ml of oxidising solution addition. The pH then declines more rapidly
in Column A and B leachates than in column C and D leachates. The column
leachates had stabilised by the conclusion of the experiment to approximate pH
values of: control column, 4.1; column A, 4.9; column B, 5.5; column C, 5.9;
column D, 5.9 (Fig. 3.5a).
62
Chapter Three – Phosphate stabilisation experiments
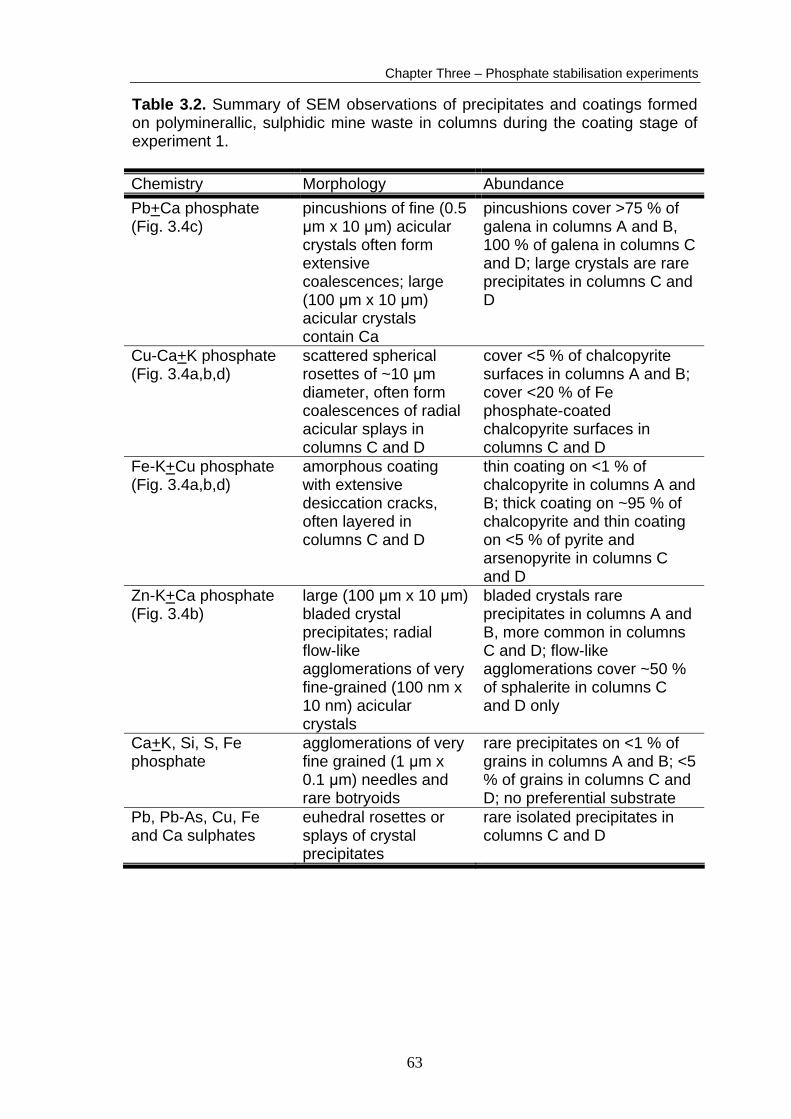
Table 3.2. Summary of SEM observations of precipitates and coatings formed on polyminerallic, sulphidic mine waste in columns during the coating stage of experiment 1. Chemistry Morphology Abundance Pb+Ca phosphate (Fig. 3.4c)
pincushions of fine (0.5 μm x 10 μm) acicular crystals often form extensive coalescences; large (100 μm x 10 μm) acicular crystals contain Ca
pincushions cover >75 % of galena in columns A and B, 100 % of galena in columns C and D; large crystals are rare precipitates in columns C and D
Cu-Ca+K phosphate (Fig. 3.4a,b,d)
scattered spherical rosettes of ~10 μm diameter, often form coalescences of radial acicular splays in columns C and D
cover <5 % of chalcopyrite surfaces in columns A and B; cover <20 % of Fe phosphate-coated chalcopyrite surfaces in columns C and D
Fe-K+Cu phosphate (Fig. 3.4a,b,d)
amorphous coating with extensive desiccation cracks, often layered in columns C and D
thin coating on <1 % of chalcopyrite in columns A and B; thick coating on ~95 % of chalcopyrite and thin coating on <5 % of pyrite and arsenopyrite in columns C and D
Zn-K+Ca phosphate (Fig. 3.4b)
large (100 μm x 10 μm) bladed crystal precipitates; radial flow-like agglomerations of very fine-grained (100 nm x 10 nm) acicular crystals
bladed crystals rare precipitates in columns A and B, more common in columns C and D; flow-like agglomerations cover ~50 % of sphalerite in columns C and D only
Ca+K, Si, S, Fe phosphate
agglomerations of very fine grained (1 μm x 0.1 μm) needles and rare botryoids
rare precipitates on <1 % of grains in columns A and B; <5 % of grains in columns C and D; no preferential substrate
Pb, Pb-As, Cu, Fe and Ca sulphates
euhedral rosettes or splays of crystal precipitates
rare isolated precipitates in columns C and D
63

Chapter Three – Phosphate stabilisation experiments
Figure 3.4a.
Figure 3.4b.
Figure 3.4c.
64

Chapter Three – Phosphate stabilisation experiments
Figure 3.4d. Figure 3.4. SEM micrographs of material removed from the coated columns after the coating stage of experiment 1. a) Fe-K phosphate on chalcopyrite with adjacent uncoated pyrite, column D. b) Flow like agglomeration of Zn-K phosphate precipitated on scattered Cu-K phosphate rosettes and Fe-K phosphate coating, column C. EDS trace of Zn-K phosphate in Appendix B8. c) Coalescence of Pb phosphate pincushions, column A. d) Layered Fe-K phosphate coating and isolated Cu-K phosphate rosettes, column D.
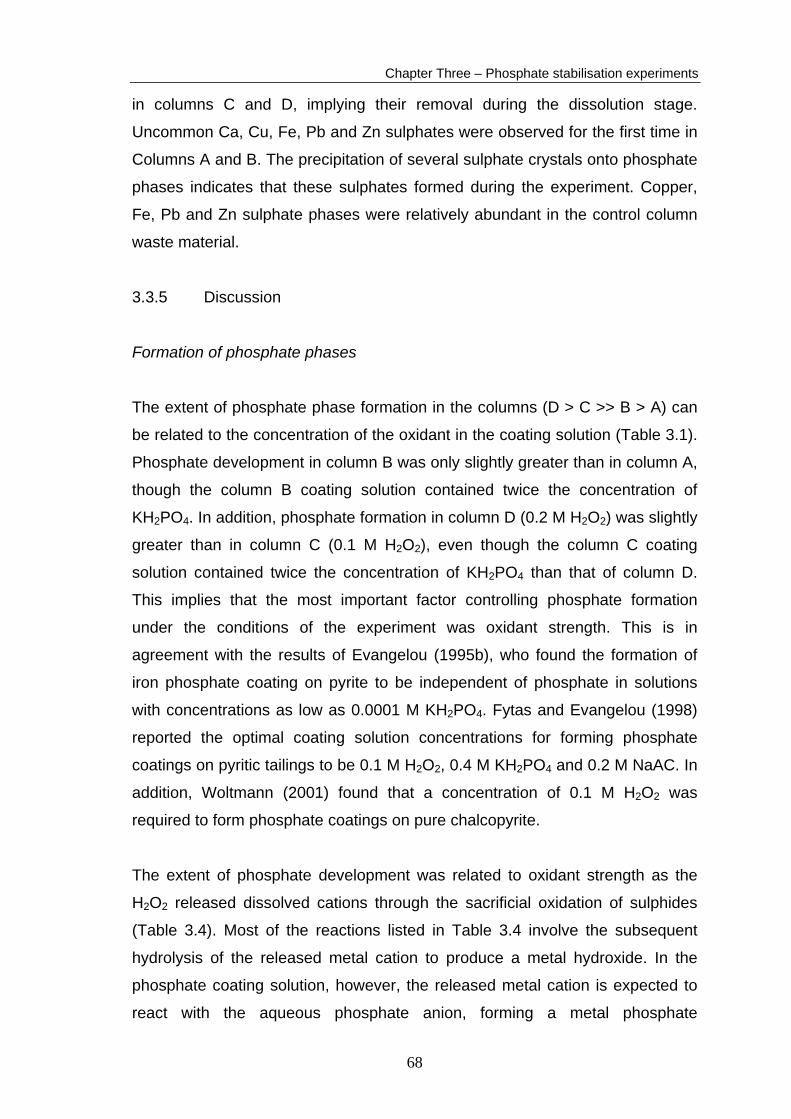
The coated column leachates initially had high conductivities (400–700 μS/cm)
(Fig. 3.5b). These values dropped rapidly, stabilising at values of 60-70 μS/cm
after the addition of 5000 ml of oxidising solution. The control column had an
initial conductivity of 160 μS/cm, which rose abruptly to 539 μS/cm before
dropping rapidly and stabilising at ~80 μS/cm, slightly higher than the coated
columns.
Two distinct trends were identified in the column leachate chemistry results.
Firstly, the base metal concentrations in the coated column leachates were
lower than the control column leachates, by two orders of magnitude in the case
of Pb (Fig. 3.3c,d,e). Secondly, the concentrations of As and Sb in the coated
column leachates were higher than the control column leachate As and Sb
concentrations (Fig. 3.3a,b). Generally, element concentrations were initially
relatively high in all column leachates and rapidly dropped before stabilising at
much lower values. There were four exceptions to this; 1) the As and Sb
concentrations of the control column leachates, which dropped steadily
65
Chapter Three – Phosphate stabilisation experiments
3.00
4.00
5.00
6.00
7.00
8.00
200
1000
1800
2600
3400
4200
5000
5800
6600
7400
8200
9000
cumulative leachate (ml)
pH
Figure 3.5a.
0
100
200
300
400
500
600
700
800
200
1000
1800
2600
3400
4200
5000
5800
6600
7400
8200
9000
cumulative leachate (ml)
cond
uctiv
ity ( μ
S/cm
)
Column AColumn BColumn CColumn DControl
Figure 3.5b. Figure 3.5. Experiment 1 pH (a) and conductivity (b) of dissolution stage leachates. Legend for (b) also applies to (a).
throughout the dissolution stage (Fig. 3.3a,b); 2) the SO42- concentration of the
control column leachates, which initially rose before stabilising (Fig. 3.3g); 3) the
Zn concentration of the control column leachates, which rose steadily
throughout the dissolution stage (Fig. 3.3d) and; 4) the Cu and Zn
concentrations of the coated column leachates, which initially dropped, then
66

Chapter Three – Phosphate stabilisation experiments
rose with additional oxidising solution addition, Cu steadily and Zn rapidly (Fig.
3.3c,d). Dissolved element concentration trends between the four coated
column leachates showed very little variation, except for column A [Zn], which
rose significantly higher than the other coated columns (Fig. 3.3d). The relative
elemental abundance in the dissolution stage column leachates (average of the
four columns’ cumulative element release throughout the coating stage) was
SO42- > Sb > Zn > Cu > As > Pb > Fe. This differs significantly from the relative
cumulative elemental abundance in the control column leachates, which was Pb
> SO42- > Cu > Zn > Fe > Sb > As.
The control column leachate [SO42-] appeared anomalously low in comparison
to the coated column leachate values (Fig. 3.3g). Analytical error was
suspected and a simple dissolution experiment was undertaken to test the
results. A 50 g sample of HCl-washed polyminerallic sulphidic mine waste was
immersed in 500 ml of 0.01 M H2O2 for 24 hours. The leachate was decanted
and duplicate samples were submitted to the Cairns Water Laboratory for
analysis by turbidometric spectroscopy. The duplicates both returned a
concentration of 41 mg/l SO42-, which was only slightly higher than the control
column leachate results in question (11–29 mg/l), proving the integrity of the
latter values.
SEM observations
A summary of the SEM observations (of the waste material removed from the
columns at the conclusion of the dissolution stage of the experiment) is
presented in Table 3.3. Detailed results and additional SEM micrographs are
presented in Appendix B5. The order of phosphate abundance observed in the
columns after the dissolution stage was the same as after the coating stage:
column D > column C >> column B > column A (based on visual estimations).
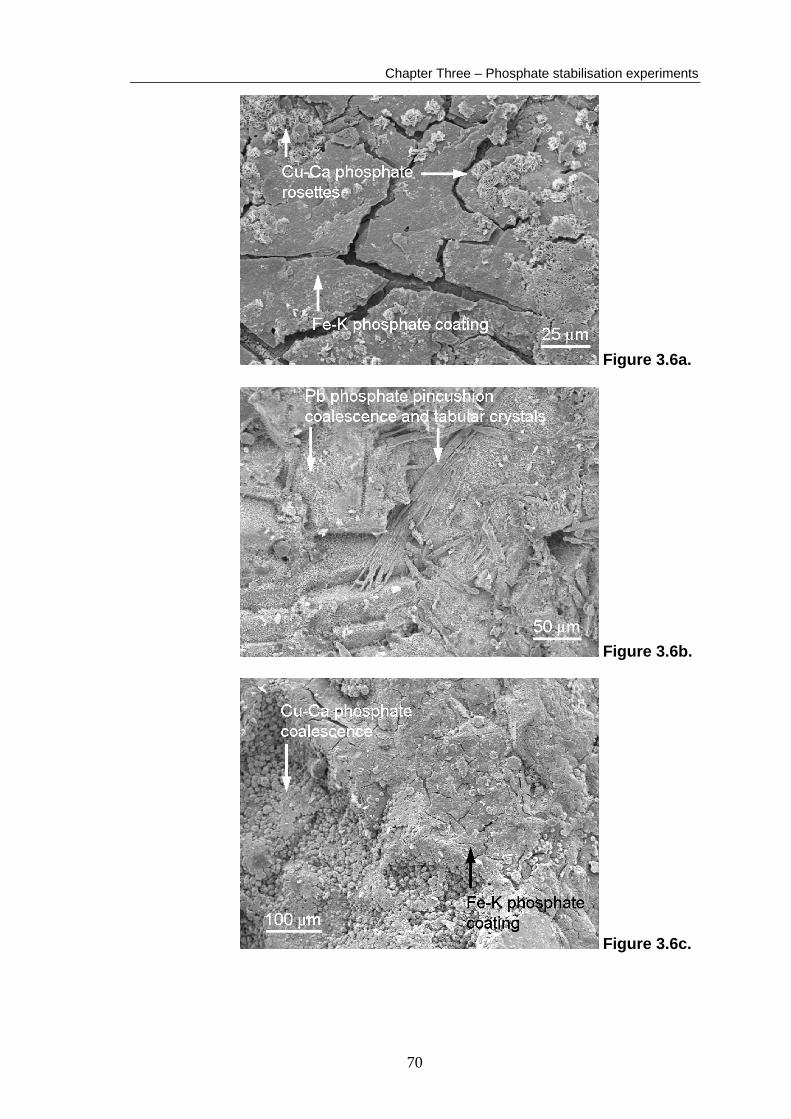
The amorphous Fe–K–(Cu) phosphate coating (Fig. 3.6a) and the various Pb
phosphate phases (Fig. 3.6b) were generally unchanged in appearance and
abundance, implying the phases were stable during the dissolution stage. In
contrast, the Cu, Zn and Ca phosphate phases were absent from column A
material, greatly reduced in abundance in column B and reduced in abundance
67
Chapter Three – Phosphate stabilisation experiments
in columns C and D, implying their removal during the dissolution stage.
Uncommon Ca, Cu, Fe, Pb and Zn sulphates were observed for the first time in
Columns A and B. The precipitation of several sulphate crystals onto phosphate
phases indicates that these sulphates formed during the experiment. Copper,
Fe, Pb and Zn sulphate phases were relatively abundant in the control column
waste material.
3.3.5 Discussion
Formation of phosphate phases
The extent of phosphate phase formation in the columns (D > C >> B > A) can
be related to the concentration of the oxidant in the coating solution (Table 3.1).
Phosphate development in column B was only slightly greater than in column A,
though the column B coating solution contained twice the concentration of
KH2PO4. In addition, phosphate formation in column D (0.2 M H2O2) was slightly
greater than in column C (0.1 M H2O2), even though the column C coating
solution contained twice the concentration of KH2PO4 than that of column D.
This implies that the most important factor controlling phosphate formation
under the conditions of the experiment was oxidant strength. This is in
agreement with the results of Evangelou (1995b), who found the formation of
iron phosphate coating on pyrite to be independent of phosphate in solutions
with concentrations as low as 0.0001 M KH2PO4. Fytas and Evangelou (1998)
reported the optimal coating solution concentrations for forming phosphate
coatings on pyritic tailings to be 0.1 M H2O2, 0.4 M KH2PO4 and 0.2 M NaAC. In
addition, Woltmann (2001) found that a concentration of 0.1 M H2O2 was
required to form phosphate coatings on pure chalcopyrite.
The extent of phosphate development was related to oxidant strength as the
H2O2 released dissolved cations through the sacrificial oxidation of sulphides
(Table 3.4). Most of the reactions listed in Table 3.4 involve the subsequent
hydrolysis of the released metal cation to produce a metal hydroxide. In the
phosphate coating solution, however, the released metal cation is expected to
react with the aqueous phosphate anion, forming a metal phosphate
68
Chapter Three – Phosphate stabilisation experiments
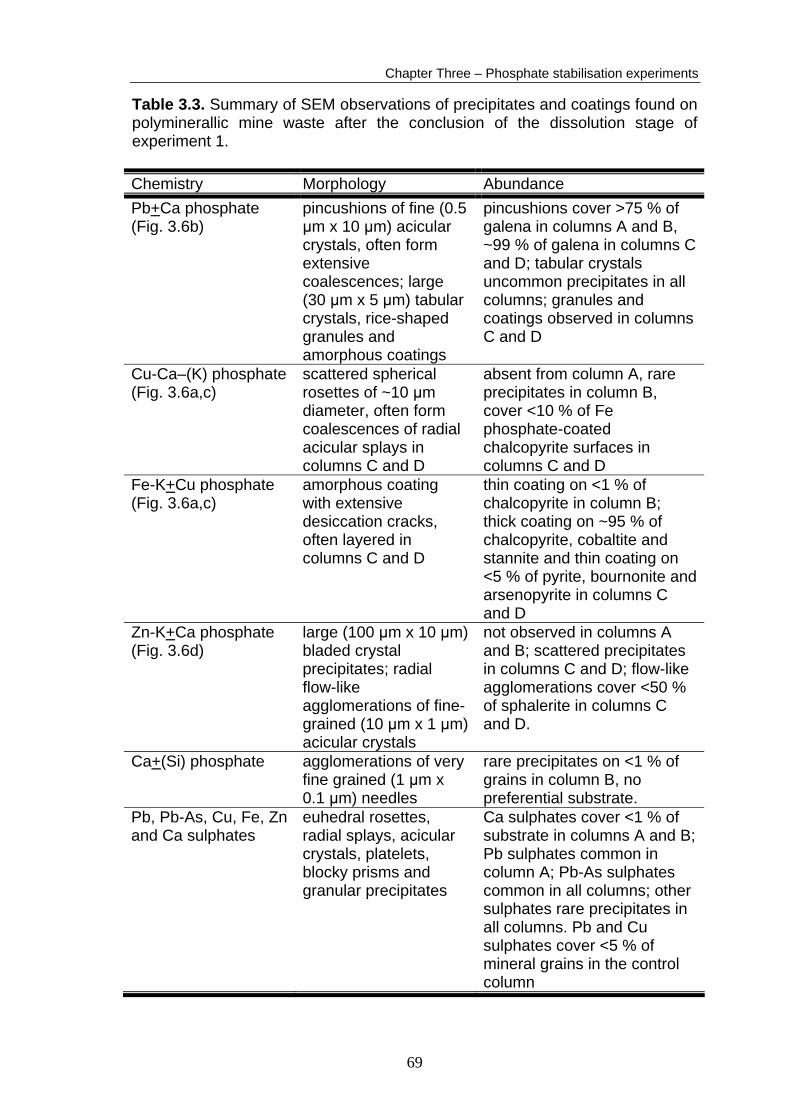
Table 3.3. Summary of SEM observations of precipitates and coatings found on polyminerallic mine waste after the conclusion of the dissolution stage of experiment 1. Chemistry Morphology Abundance Pb+Ca phosphate (Fig. 3.6b)
pincushions of fine (0.5 μm x 10 μm) acicular crystals, often form extensive coalescences; large (30 μm x 5 μm) tabular crystals, rice-shaped granules and amorphous coatings
pincushions cover >75 % of galena in columns A and B, ~99 % of galena in columns C and D; tabular crystals uncommon precipitates in all columns; granules and coatings observed in columns C and D
Cu-Ca–(K) phosphate (Fig. 3.6a,c)
scattered spherical rosettes of ~10 μm diameter, often form coalescences of radial acicular splays in columns C and D
absent from column A, rare precipitates in column B, cover <10 % of Fe phosphate-coated chalcopyrite surfaces in columns C and D
Fe-K+Cu phosphate (Fig. 3.6a,c)
amorphous coating with extensive desiccation cracks, often layered in columns C and D
thin coating on <1 % of chalcopyrite in column B; thick coating on ~95 % of chalcopyrite, cobaltite and stannite and thin coating on <5 % of pyrite, bournonite and arsenopyrite in columns C and D
Zn-K+Ca phosphate (Fig. 3.6d)
large (100 μm x 10 μm) bladed crystal precipitates; radial flow-like agglomerations of fine-grained (10 μm x 1 μm) acicular crystals
not observed in columns A and B; scattered precipitates in columns C and D; flow-like agglomerations cover <50 % of sphalerite in columns C and D.
Ca+(Si) phosphate agglomerations of very fine grained (1 μm x 0.1 μm) needles
rare precipitates on <1 % of grains in column B, no preferential substrate.
Pb, Pb-As, Cu, Fe, Zn and Ca sulphates
euhedral rosettes, radial splays, acicular crystals, platelets, blocky prisms and granular precipitates
Ca sulphates cover <1 % of substrate in columns A and B; Pb sulphates common in column A; Pb-As sulphates common in all columns; other sulphates rare precipitates in all columns. Pb and Cu sulphates cover <5 % of mineral grains in the control column
69
Chapter Three – Phosphate stabilisation experiments
Figure 3.6a.
Figure 3.6b.
Figure 3.6c.
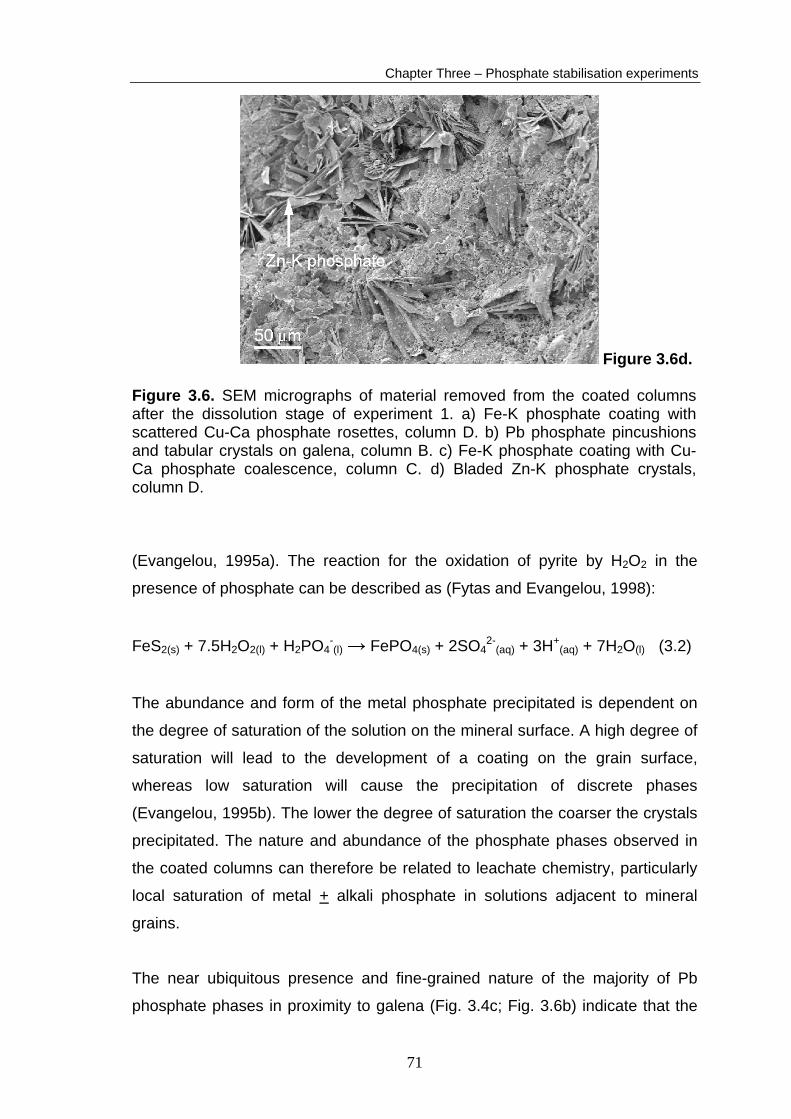
70
Chapter Three – Phosphate stabilisation experiments
Figure 3.6d. Figure 3.6. SEM micrographs of material removed from the coated columns after the dissolution stage of experiment 1. a) Fe-K phosphate coating with scattered Cu-Ca phosphate rosettes, column D. b) Pb phosphate pincushions and tabular crystals on galena, column B. c) Fe-K phosphate coating with Cu-Ca phosphate coalescence, column C. d) Bladed Zn-K phosphate crystals, column D.
(Evangelou, 1995a). The reaction for the oxidation of pyrite by H2O2 in the
presence of phosphate can be described as (Fytas and Evangelou, 1998):
FeS2(s) + 7.5H2O2(l) + H2PO4-(l) → FePO4(s) + 2SO4
2-(aq) + 3H+
(aq) + 7H2O(l) (3.2)
The abundance and form of the metal phosphate precipitated is dependent on
the degree of saturation of the solution on the mineral surface. A high degree of
saturation will lead to the development of a coating on the grain surface,
whereas low saturation will cause the precipitation of discrete phases
(Evangelou, 1995b). The lower the degree of saturation the coarser the crystals
precipitated. The nature and abundance of the phosphate phases observed in
the coated columns can therefore be related to leachate chemistry, particularly
local saturation of metal + alkali phosphate in solutions adjacent to mineral
grains.
The near ubiquitous presence and fine-grained nature of the majority of Pb
phosphate phases in proximity to galena (Fig. 3.4c; Fig. 3.6b) indicate that the
71
Chapter Three – Phosphate stabilisation experiments
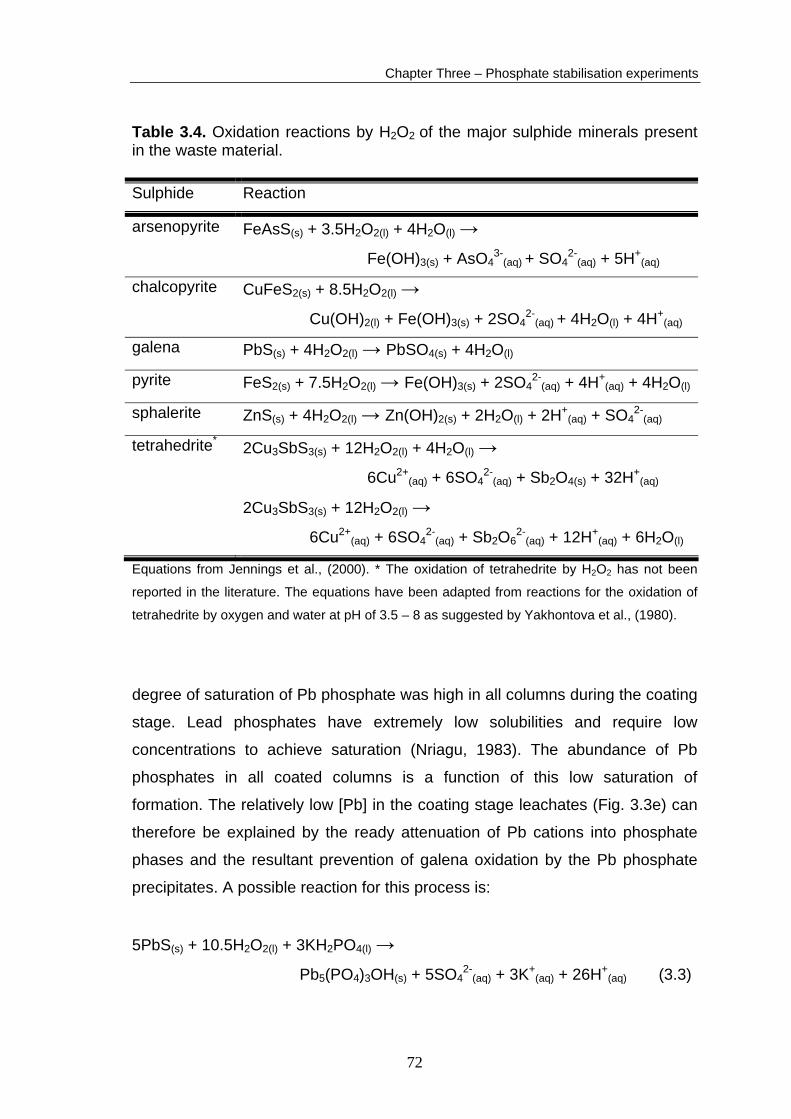
Table 3.4. Oxidation reactions by H2O2 of the major sulphide minerals present in the waste material. Sulphide Reaction
arsenopyrite FeAsS(s) + 3.5H2O2(l) + 4H2O(l) →
Fe(OH)3(s) + AsO43-
(aq) + SO4
2-(aq) + 5H+
(aq)
chalcopyrite CuFeS2(s) + 8.5H2O2(l) →
Cu(OH)2(l) + Fe(OH)3(s) + 2SO42-
(aq) + 4H2O(l) + 4H+
(aq)
galena PbS(s) + 4H2O2(l) → PbSO4(s) + 4H2O(l)
pyrite FeS2(s) + 7.5H2O2(l) → Fe(OH)3(s) + 2SO42-
(aq) + 4H+(aq) + 4H2O(l)
sphalerite ZnS(s) + 4H2O2(l) → Zn(OH)2(s) + 2H2O(l) + 2H+(aq) + SO4
2-(aq)
tetrahedrite* 2Cu3SbS3(s) + 12H2O2(l) + 4H2O(l) →
6Cu2+(aq) + 6SO4
2-(aq) + Sb2O4(s) + 32H+
(aq)
2Cu3SbS3(s) + 12H2O2(l) →
6Cu2+(aq) + 6SO4
2-(aq) + Sb2O6
2-(aq) + 12H+
(aq) + 6H2O(l)
Equations from Jennings et al., (2000). * The oxidation of tetrahedrite by H2O2 has not been
reported in the literature. The equations have been adapted from reactions for the oxidation of
tetrahedrite by oxygen and water at pH of 3.5 – 8 as suggested by Yakhontova et al., (1980).
degree of saturation of Pb phosphate was high in all columns during the coating
stage. Lead phosphates have extremely low solubilities and require low
concentrations to achieve saturation (Nriagu, 1983). The abundance of Pb
phosphates in all coated columns is a function of this low saturation of
formation. The relatively low [Pb] in the coating stage leachates (Fig. 3.3e) can
therefore be explained by the ready attenuation of Pb cations into phosphate
phases and the resultant prevention of galena oxidation by the Pb phosphate
precipitates. A possible reaction for this process is:
5PbS(s) + 10.5H2O2(l) + 3KH2PO4(l) →
Pb5(PO4)3OH(s) + 5SO42-
(aq) + 3K+(aq) + 26H+
(aq) (3.3)
72

Chapter Three – Phosphate stabilisation experiments
Reaction 3.3 presumes the precipitated phase to be hydroxypyromorphite,
which has been found in phosphate stabilised mine wastes by Eusden et al.,
(2002). The acicular pincushions observed in the coated columns bear similarity
to pyromorphites formed in several experiments which investigated the
phosphate stabilisation of Pb in contaminated soils (cf. Lower et al., 1998; Ma et
al., 1994; Zhang and Ryan, 1999a). The availability of OH- in the coating
solution, through NaAC addition, coupled with the rapid precipitation of
pyromorphite from solutions saturated in pyromorphite (Ma et al., 1993),
suggest that the Pb phosphate pincushions are possibly hydroxypyromorphite. However, the SEM/EDS evidence points to the existence of several Pb
phosphate phases (additional SEM micrographs in Appendix B5, representative
EDS trace in Appendix B8). Identification of the exact stoichiometry of the
precipitated phases requires more sensitive surficial analytical methods. The
formation of Pb phosphate appeared to be inhibited by the presence of pre-
existing anglesite (Fig. 3.7a). This may be due to the low solubility of anglesite
precluding the release of Pb ions for complexation with the phosphate anion.
The morphology of the amorphous Fe-K phosphate coatings observed in the
coated columns (Fig. 3.4a,b,d; Fig. 3.6a) was very similar to those previously
observed on pyrite (cf. Evangelou, 1994; Nyavor and Egiebor, 1995), pyrrhotite
(cf. Georgopoulou et al., 1996) and chalcopyrite (cf. Woltmann, 2001).
Evangelou (1994) and Georgopoulou et al., (1996) consider the coatings to be
FePO4, however they produce no results of any surficial chemical analyses. In
contrast, EDS spectra of coated pyrite (Nyavor and Egiebor, 1995) and
chalcopyrite (Woltmann, 2001) show the presence of significant K, sourced from
the KH2PO4 used in the coating solution. The presence of substantial alkalis
incorporated into the phosphate coatings observed in the phosphate
stabilisation experiments is probably typical of most phosphate coatings formed
in previous studies.
The poorly-developed nature of the amorphous Fe-K phosphate coating
observed in columns A and B was probably a function of the oxidant
concentration. The 0.01 M H2O2 used in columns A and B probably did not
oxidise chalcopyrite rapidly enough to release sufficient Fe2+ to reach iron
73

Chapter Three – Phosphate stabilisation experiments
phosphate saturation on all chalcopyrite grains. The relationship of the
amorphous coating with chalcopyrite suggests the following possible reaction:
3CuFeS2(s) + 12H2O2(s) + 4KH2PO4(l) →
(Fe3+,K)3(PO4)4(s) + 3Cu2+(aq) + K+
(aq) + 6SO42-
(aq) + 32H+(aq)
(3.4)
The EDS results indicate minor coprecipitation of Cu2+ and Ca2+ into the
(Fe,K)3(PO4)4 crystal lattice (Appendix B8). The formation of FePO4 requires
very low activities of Fe3+ (Evangelou, 1995b) and is probably
thermodynamically and kinetically favoured over CuPO4 formation. This may
explain the relative paucity of Cu in the amorphous coatings.
The below detection concentrations (<100 μg/l) of Fe in the coating stage
leachates cannot be explained solely by attenuation into the Fe-K phosphate
coatings as this phase was uncommon and poorly formed in columns A and B.
The formation of ferric hydroxide precipitates is the most likely explanation for
the low Fe concentrations as the coating solutions were buffered well above the
first hydrolysis constant for iron (pH 2.2) (Nordstrom and Alpers, 1999b).
Although Fe-rich precipitates were rarely observed on the grains of waste
material, very fine-grained (<1 μm), granular, unidentified precipitates were
observed on many sulphide grains when the material was gold-coated (Fig.
3.7b) (the gold coating allows better mineral surface definition at magnifications
of >5000x). It is likely that these precipitates were Fe-rich and at least partly
responsible for the low [Fe] in the coating stage column leachates.
The paucity of Fe-K phosphate coatings on pyrite (Fig. 3.4a) is contrary to the
observations of well-developed coatings on pyrite by Evangelou (1994; 1995b).
Pyrite has been observed to generally be more susceptible to oxidation than
chalcopyrite (Jambor, 1994) and should therefore form coatings more readily. A
possible explanation for the paucity of coating on the pyrite grains is the
galvanic protection of pyrite at the expense of chalcopyrite. It has been
established in experimental studies that pyrite acts cathodic to many other
sulphides, including chalcopyrite, when the minerals are in contact (Peters,
74
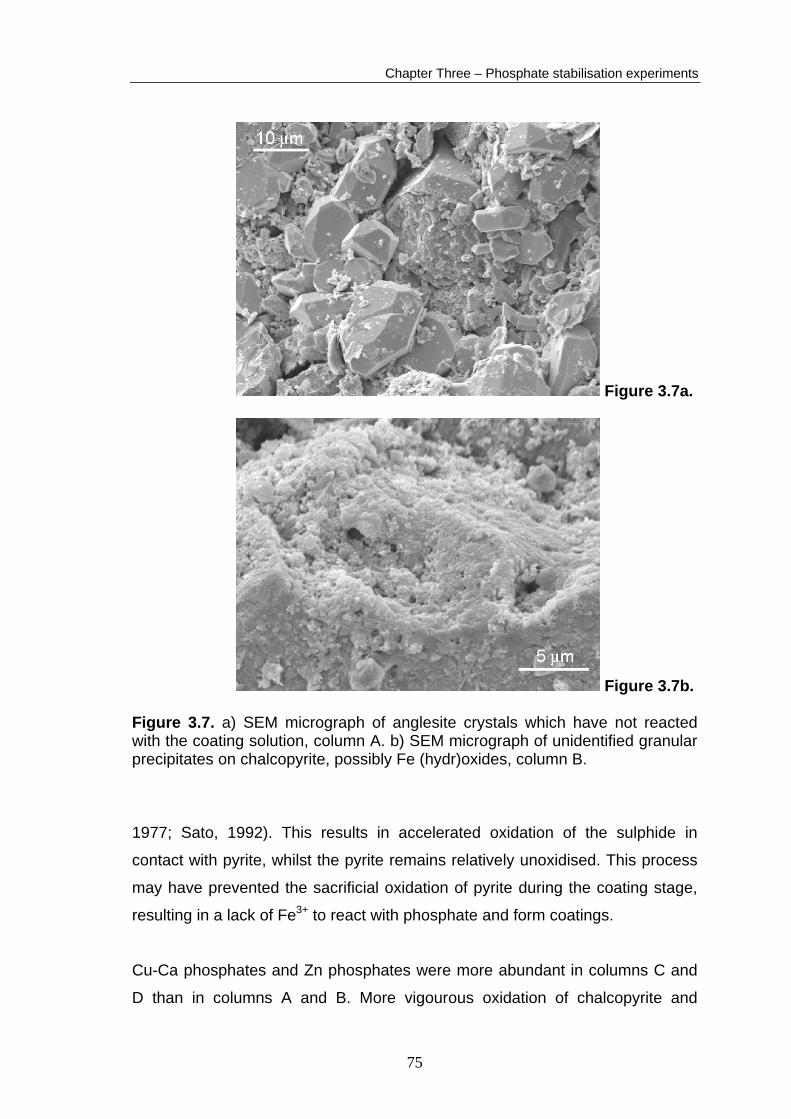
Chapter Three – Phosphate stabilisation experiments
Figure 3.7a.
Figure 3.7b. Figure 3.7. a) SEM micrograph of anglesite crystals which have not reacted with the coating solution, column A. b) SEM micrograph of unidentified granular precipitates on chalcopyrite, possibly Fe (hydr)oxides, column B.
1977; Sato, 1992). This results in accelerated oxidation of the sulphide in
contact with pyrite, whilst the pyrite remains relatively unoxidised. This process
may have prevented the sacrificial oxidation of pyrite during the coating stage,
resulting in a lack of Fe3+ to react with phosphate and form coatings.
Cu-Ca phosphates and Zn phosphates were more abundant in columns C and
D than in columns A and B. More vigourous oxidation of chalcopyrite and
75

Chapter Three – Phosphate stabilisation experiments
sphalerite, due to the stronger [H2O2], released sufficient Cu2+ and Zn2+ to attain
Cu and Zn phosphate saturation more commonly in columns C and D. This is
supported by the observed preferential association of the phosphates with
chalcopyrite and sphalerite and also explains the higher [Cu] and [Zn] in the
column C and D coating stage leachates (Fig. 3.3c,d). A possible reaction for
the formation of the Cu-Ca phosphate rosettes is:
3Ca(OH)2(l) + 3Cu2+(aq) + 4KH2PO4(l) →
(Cu,Ca)3(PO4)4(s) + 4K+(aq) + 2H+
(aq)+ 6H2O(l) (3.5)
The Cu2+ is sourced from Reaction 3.4. Higher [Cu2+] near chalcopyrite surfaces
allowed the precipitation of fine-grained rosettes, whereas on other minerals,
lower [Cu2+] led to the formation of isolated, coarser precipitates. Areas in
proximity to sphalerite grains in columns C and D had [Zn2+] high enough to
permit formation of fine-grained precipitates of Zn-K phosphate (Fig. 3.4b)
(representative EDS trace in Appendix B8). Late precipitates of identical
chemistry were coarser-grained due to lower [Zn2+]. A possible reaction for this
process is:
ZnS(s) + 2H2O2(l) + KH2PO4(l) → (Zn,K)PO4(s) + SO42-
(aq) + 6H+(aq)
(3.6)
Isolated precipitates of Zn phosphate tended to contain Ca rather than K,
implying late precipitation after the addition of Ca(OH)2:
3ZnS(s) + 3Ca(OH)2(l) + 3H2O2(l) + 4KH2PO4(l) →
(Zn,Ca)3(PO4)4(s) + 3SO42-
(aq) + 4K+(aq) + 20H+
(aq) (3.7)
The ubiquitous presence of Ca in the Cu-Ca phosphate rosettes suggests that
the rosettes did not form until the addition of Ca(OH)2 and the resultant pH rise
at the end of the coating stage. It is probable, however, that with Ca(OH)2
addition a layer of Cu-Ca phosphate precipitated on pre-existing Cu phosphate
crystals. Inspection of coated column material prior to the addition of Ca(OH)2 is
required to ascertain if this has occurred.
76

Chapter Three – Phosphate stabilisation experiments
Tetrahedrite showed an absence of phosphate coatings and a paucity of Cu-Ca
phosphate rosettes. The poor phosphate development cannot be explained by
slow oxidation and little resultant cation release as the high coating stage
leachate [Sb], particularly in columns C and D (Fig. 3.3b), indicate that
significant tetrahedrite oxidation occurred. In addition, the few studies published
on tetrahedrite oxidation state that it has a similar reactivity to chalcopyrite
(Yakhontova et al., 1980) or is more susceptible to oxidation than chalcopyrite
(Boyle, 1994; Brock, 1979). Iron phosphate coatings were not formed because
tetrahedrite lacks Fe. Dissolved Sb most likely existed as SbO3- within the
columns (Vink, 1996), which would not react with phosphate anions and should
be relatively mobile at pH 5–6. This explains the lack of Sb phosphates and the
high [Sb] in the coating stage leachates. It is unclear why Cu phosphate
rosettes did not form abundantly on tetrahedrite as appreciable Cu2+ should
have been released by tetrahedrite oxidation (Table 3.4) (Yakhontova et al.,
1980). The paucity of phosphates on tetrahedrite is not due to a lack of
phosphate, as the presence of Ca phosphate crystals in all columns indicates
that PO43- remained available at the conclusion of the coating stage.
The concentrations of As in the coating stage leachates decreased steadily but
significantly during the coating stage (Fig. 3.3a). This indicates depletion of the
source of the As. The oxidation of arsenopyrite and arsenian tetrahedrite are
the most likely sources of As. The oxidation of arsenopyrite may have been
partially inhibited by the formation of minor phosphate coatings during the
coating stage, particularly in columns C and D. The attenuation of As by Pb-As
sulphate precipitation would have also removed small quantities of As from
solution.
The SO42- concentrations in the coating stage leachates are probably a function
of SO42- release through sulphide oxidation, dissolution of sulphates which
survived the HCl washing and desorption from iron (hydr)oxides (Rose and
Elliot, 2000; Rose and Ghazi, 1997). The decrease in leachate SO42-
concentrations during the coating stage (Fig. 3.3g) is probably due to flushing of
mobile aqueous SO42- out of the columns, depletion of soluble sulphate
77

Chapter Three – Phosphate stabilisation experiments
minerals with continuing dissolution and inhibition of sulphide oxidation as a
result of the formation of phosphate coatings.
The abundance, location and morphology of phosphates formed during the
coating stage were controlled by the level of saturation of the metal + alkali
phosphate in the solution adjacent to mineral grains. The major factor
controlling the level of saturation was the coating solution oxidant strength and
subsequent cation release from sacrificial sulphide oxidation. Sulphide oxidation
also had an important affect on the leachate dissolved element concentrations.
Several other factors, such as the precipitation of iron (hydr)oxides,
sorption/desorption reactions of elements with secondary mineral surfaces and
the kinetics of all of the above processes may also have had a significant effect
on the leachate chemistry.
Stability of phosphate phases
The order of abundance of phosphate phases observed in the coated columns
after the conclusion of the dissolution stage matched the order of final pH in the
dissolution stage leachate (column D > column C >> column B > column A)
(Fig. 3.5a). This indicates that the extent of phosphate coating development
controls the pH through the inhibition of sulphide oxidation, particularly the
amorphous Fe-K phosphate coatings on chalcopyrite. The stability of the
amorphous Fe-K phosphate coatings was demonstrated by their persistence
through the dissolution stage (Fig. 3.6a,c), even when poorly-developed as in
columns A and B. The formation of an impervious phosphate coating on the
sulphides, particularly chalcopyrite, prevented the oxidant from accessing the
sulphide surface, halting oxidation (Evangelou, 1995b).
Unlike the pH, the [Fe] in the dissolution stage leachates was not controlled by
the amorphous Fe-K phosphate coatings as [Fe] was similar in all column
leachates, including the control (Fig. 3.3f). The low [Fe] in the control column
leachates throughout the majority of the dissolution stage was possibly a result
of attenuation by iron (hydr)oxide precipitation through rapid hydrolysis of Fe3+
at pH values above the first hydrolysis constant of iron (Nordstrom and Alpers,
78

Chapter Three – Phosphate stabilisation experiments
1999b). The increased [Fe] in the coated column dissolution stage leachates
was possibly a result of the iron precipitates formed during the coating stage
becoming unstable at the alkaline pH caused by the addition of Ca(OH)2.
The stability of the Pb phosphates was also demonstrated by their persistence
in all columns after the dissolution stage (Fig. 3.6b). The Pb phosphates
probably inhibited galena oxidation, reflected in the very low coated column
dissolution stage leachate [Pb] as compared with the control column leachate
[Pb] (Fig. 3.3e). The jump in coated column leachate Pb concentration at the
start of the dissolution stage is probably a result of mobilisation of Pb2+ as a
function of the pH rise through the Ca(OH)2 addition. The specific process
responsible for this increase in mobility is unknown.
The reduced abundance of Cu-Ca phosphate rosettes and Zn phosphates in all
coated columns after the dissolution stage indicates these phase were relatively
unstable in the oxidising solution. Dissolution of these phosphates probably
explains the steady rise in [Cu] and [Zn] in the coated column leachates during
the dissolution stage (Fig. 3.3c,d). Despite the phosphate dissolution,
concentrations of Cu and Zn in the coated column leachates remained well
below concentrations of Cu and Zn in the control column leachates throughout
the dissolution stage. With decreasing pH in the coated column leachates the
solubility of the Zn phosphate phases may have increased, resulting in greater
Zn release (Fig. 3.3d). The relatively high [Zn] in the column A dissolution stage
leachates is probably also a reflection of increased sphalerite oxidation due to
reduced inhibition from Zn phosphate precipitates.
The ability of the metal + alkali phosphates to reduce dissolved metal
concentrations in the coated column leachates, particularly Pb, is in agreement
with previous phosphate stabilisation studies of mine waste (cf. Eusden et al.,
2002) and metal contaminated soils (cf. Cotter-Howells and Caporn, 1996;
Ruby et al., 1994). It is possible that the reduced base metal concentrations in
the coated column leachates merely reflects reduced mobility at higher pH.
Further experiments are required to solve this issue by using a control column
which has added Ca(OH)2 to raise the pH but no added phosphate.
79
Chapter Three – Phosphate stabilisation experiments
The initial very high Cu and Pb concentrations in the control column leachates
(Fig. 3.3c,e) were probably due to flushing of metals mobilised through the
dissolution of remnant sulphates and desorption from mineral surfaces at low
pH (3.48). After depletion of the readily mobilised Cu and Pb, the concentrations
in the control column leachates stabilised, controlled by chalcopyrite and galena
oxidation. In contrast, there was no initial [Zn] peak in the control column
leachates (Fig 3.3d). This may indicate that all readily mobilised Zn was
removed from the control column by the HCl wash and sphalerite oxidation
controlled the [Zn] in the control column leachates from the start of the
dissolution stage.
The presence of fine-grained Cu, Fe, Pb, Pb-As and Zn sulphates precipitated
on phosphate phases in the coated columns indicates that some sulphate
formation occurred during the experiment. The major source of the sulphate
anion was probably the oxidation of sulphides, as the sulphate phases were
abundant in the control column and more common in column A and B than in
column C and D. However, the similar [SO42-] in the control and coated column
leachates is problematic as sulphide oxidation, and therefore SO42- release,
should have been much greater in the control column than the coated columns.
Control column leachate SO42- was possibly attenuated by metal/alkali sulphate
precipitation and adsorption of SO42- onto iron (hydr)oxides (Rose and Elliot,
2000; Rose and Ghazi, 1997). However, given that metal concentrations in the
control column leachates were far greater than in the coated column leachates
and Fe-rich precipitates were not observed in abundance in the control column
material, it seems unlikely that these processes could have removed sufficient
SO42- to reduce the control column [SO4
2-] to the values measured. Further work
is required to ascertain the behaviour of SO42- in the control column leachates.
The concentrations of As and Sb were consistently higher in the coated column
dissolution stage leachates than in the control column leachates (Fig. 3.3a,b).
This was probably related to the greater mobility of these elements in the higher
pH of the coated column leachates. The low metalloid concentrations in the
control column dissolution stage leachates were possibly due to As and Sb
80
Chapter Three – Phosphate stabilisation experiments
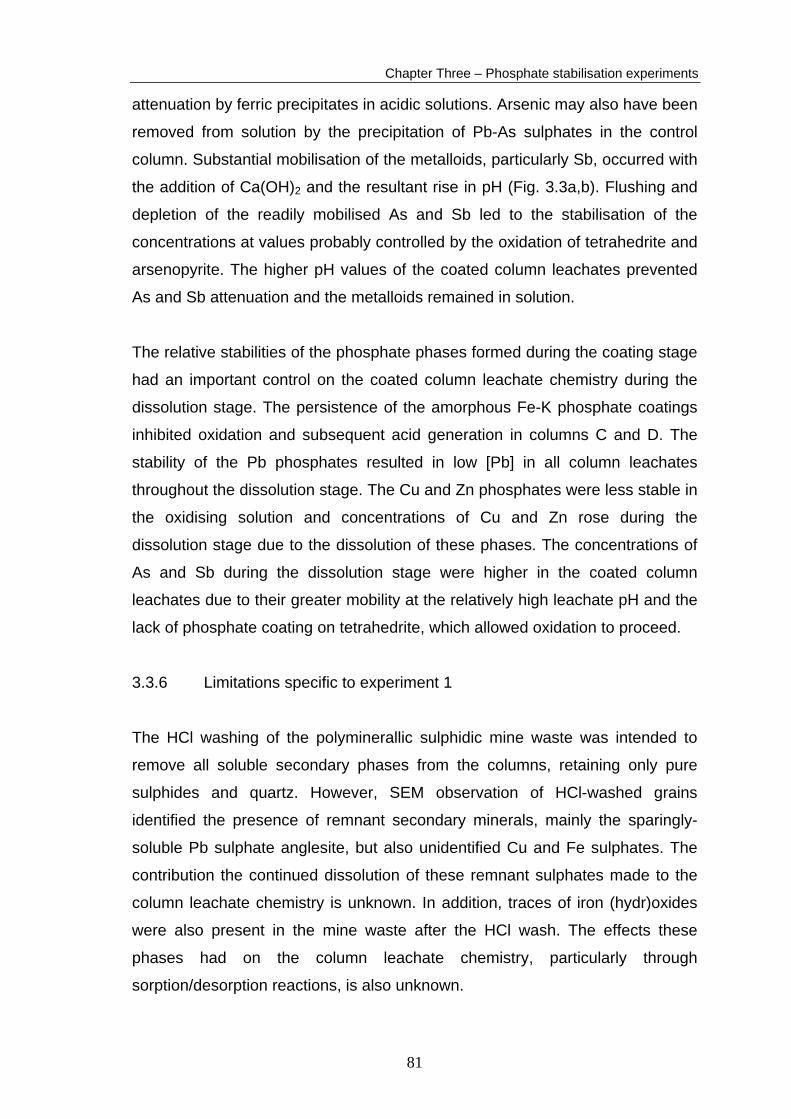
attenuation by ferric precipitates in acidic solutions. Arsenic may also have been
removed from solution by the precipitation of Pb-As sulphates in the control
column. Substantial mobilisation of the metalloids, particularly Sb, occurred with
the addition of Ca(OH)2 and the resultant rise in pH (Fig. 3.3a,b). Flushing and
depletion of the readily mobilised As and Sb led to the stabilisation of the
concentrations at values probably controlled by the oxidation of tetrahedrite and
arsenopyrite. The higher pH values of the coated column leachates prevented
As and Sb attenuation and the metalloids remained in solution.
The relative stabilities of the phosphate phases formed during the coating stage
had an important control on the coated column leachate chemistry during the
dissolution stage. The persistence of the amorphous Fe-K phosphate coatings
inhibited oxidation and subsequent acid generation in columns C and D. The
stability of the Pb phosphates resulted in low [Pb] in all column leachates
throughout the dissolution stage. The Cu and Zn phosphates were less stable in
the oxidising solution and concentrations of Cu and Zn rose during the
dissolution stage due to the dissolution of these phases. The concentrations of
As and Sb during the dissolution stage were higher in the coated column
leachates due to their greater mobility at the relatively high leachate pH and the
lack of phosphate coating on tetrahedrite, which allowed oxidation to proceed.
3.3.6 Limitations specific to experiment 1
The HCl washing of the polyminerallic sulphidic mine waste was intended to
remove all soluble secondary phases from the columns, retaining only pure
sulphides and quartz. However, SEM observation of HCl-washed grains
identified the presence of remnant secondary minerals, mainly the sparingly-
soluble Pb sulphate anglesite, but also unidentified Cu and Fe sulphates. The
contribution the continued dissolution of these remnant sulphates made to the
column leachate chemistry is unknown. In addition, traces of iron (hydr)oxides
were also present in the mine waste after the HCl wash. The effects these
phases had on the column leachate chemistry, particularly through
sorption/desorption reactions, is also unknown.
81

Chapter Three – Phosphate stabilisation experiments
3.3.7 Summary
The results of the experiment showed that phosphate coatings could be formed
to some extent on polyminerallic, sulphidic waste material. The extent and
morphology of phosphate species formed was dependent on the concentration
of oxidant used in the coating solution rather than the phosphate concentration.
The concentration of 0.01 M H2O2 used in columns A and B was insufficient to
release enough metal ions to form extensive coatings or coalescences on any
sulphide minerals except galena. The low saturation levels of Fe, Cu and Zn
phosphate only permitted the formation of discrete, isolated metal phosphate
crystals and occasional, poorly-developed coatings in columns A and B. The
increased oxidant concentration in the column C and D coating solutions
allowed greater oxidation of chalcopyrite and subsequent saturation of Fe-K
phosphate to occur. This resulted in an amorphous coating forming on
practically all chalcopyrite surfaces. This coating was the most effective in
inhibiting oxidation and acid generation in the dissolution stage of the
experiment.
The phosphate precipitates probably also inhibited the release of Pb and, to a
lesser extent, Cu and Zn into solution. However, the reduced base metal
concentrations in the coated column leachates may have been due to the
elevated pH alone. Fe concentrations were also attenuated in all columns,
however, the below detection [Fe] of the control leachates indicate that another
process, such as ferric hydroxide precipitation, was inhibiting Fe release.
Arsenic and Sb did not form phosphate phases and their release was not
inhibited in the coated column dissolution stage leachates. Further work is
required to investigate the effects of Ca(OH)2 addition on the formation of
phosphates and their ability to inhibit acid generation and attenuation of
dissolved metals.
82
Chapter Three – Phosphate stabilisation experiments
3.4 Phosphate stabilisation of partly oxidised, polyminerallic mine
waste using liquid chemical stabilisers (experiment 2)
3.4.1 Aims
Experiment 1 demonstrated the ability of the phosphate stabilisation technique
to form oxidation inhibiting, metal attenuating phosphate phases on
polyminerallic, unoxidised, sulphidic mine waste. The samples used in
experiment 1 were HCl washed to remove any soluble phases and therefore do
not represent actual mine waste characteristics, especially at abandoned
historic mine sites. In contrast, experiment 2 used partly oxidised mine waste to
investigate the effect of abundant secondary phases on the phosphate
stabilisation technique.
The specific aims of experiment 2 were:
a) to determine the morphologies and chemistries of any phosphate
phases formed by the interaction of partly oxidised, polyminerallic
mine waste with liquid phosphate stabilisers;
b) to determine the stability, metal attenuation ability and acid
generation inhibition ability of any phosphate phases formed by the
interaction of partly oxidised, polyminerallic mine waste with liquid
phosphate stabilisers.
3.4.2 Specific methodology
The waste material used in experiment 2 was sourced from homogenised,
quartered, composite mine waste samples collected from waste dump faces of
the abandoned Montalbion silver mine (Chapter 2). In contrast to experiment 1,
the waste material was not washed with HCl in order to retain the soluble
secondary minerals. The XRD and bulk XRF results for the partly oxidised,
polyminerallic waste material used in the columns of experiment 2 are tabulated
in Appendix B1. The porosity of the material was considered adequate to
83

Chapter Three – Phosphate stabilisation experiments
ensure saturation of the entire column. Therefore, 400 g of waste material was
placed into each column without any additional quartz sand.
The compositions and concentrations of the coating solutions used in
experiment 2 were identical to those used in experiment 1 (Table 3.5).
Table 3.5. Coating solutions used in the coating stage of experiment 2.
Oxidant Phosphate Buffer
Column A 0.01 M H2O2 0.2 M KH2PO4 0.2 M CH3COONa
Column B 0.01 M H2O2 0.4 M KH2PO4 0.2 M CH3COONa
Column C 0.1 M H2O2 0.4 M KH2PO4 0.2 M CH3COONa
Column D 0.2 M H2O2 0.2 M KH2PO4 0.2 M CH3COONa
Five litres of coating solution were added to the respective columns at a rate of
400 ml per day. During the coating stage, leachate samples were collected after
the addition of 400 ml, 2600 ml and 5000 ml of coating solution. These samples
were analysed for As (0.5 mg/l), Cu (0.1 mg/l), Fe (0.1 mg/l), Pb (0.7 mg/l), S (1
mg/l), Sb (0.08 mg/l), and Zn (0.05 mg/l) by ICP-AES. Detection limits are
shown in brackets.
The dissolution stage of the experiment consisted of the addition of 5000 ml of
0.01 M H2O2 at a rate of 400 ml per day. Leachate samples were collected after
the addition of 200 ml, 800 ml, 1600 ml, 2000 ml and then every 600 ml addition
until the addition of 5000 ml of oxidant. These samples were analysed for Al
(100 μg/l), As (1 μg/l), Cu (0.1 μg/l), Pb (0.5 μg/l), Sb (0.1 μg/l) and Zn (5 μg/l)
by ICP–MS and for Fe (0.1 mg/l) and S (1 mg/l) by ICP-AES. Detection levels
are shown in brackets.
Samples of waste material were removed from the columns at the completion of
the coating and dissolution stages. In addition, further aliquots of waste material
(~30 g) were removed from each column after the addition of 5000 ml of coating
solution but prior to the addition of Ca(OH)2. These samples were prepared for
84
Chapter Three – Phosphate stabilisation experiments
SEM observation and EDS analysis (Section 3.2.3) in order to determine
whether the addition of Ca(OH)2 was required to precipitate phosphate phases.
3.4.3 Coating stage results
Coating stage leachates initially contained small quantities of light brown
precipitates, which were probably partly disassociated Fe compounds and
slightly soluble sulphates. The leachates became clear after the addition of
approximately 2000 ml of coating solution. Complete chemical results for the
coating stage leachates are tabulated in Appendix B3.
Leachate chemistry
Coating solutions were buffered to pH 5.2–5.8 for the duration of the coating
stage (Fig. 3.8a). The pH of all columns increased steadily with coating solution
addition due to instrumental drift. Recalibration of the pH meter resulted in a pH
drop, however, the instrumental drift continued. The electrode was replaced at
the conclusion of the coating stage to solve the problem. Despite the
instrumental drift, pH drift for individual columns for the duration of the coating
stage was restricted to 0.4 of a pH unit. Instrumental problems caused 0.2 pH
units of that drift, indicating that pH drift for each column was limited to 0.2 pH
units during the coating stage (Fig. 3.8a). The pH of column A and D leachates
were higher than column B and C leachates, generally by 0.2 pH units, due to
the greater concentration of KH2PO4 in column B and C coating solutions
(Section 3.3.3).
The conductivities of the coating stage leachates were very high due to the
KH2PO4 and NaAC used in the coating solutions (20 000 μS/cm – 70 000
μS/cm) (Fig. 3.8b). Although the conductivities rose and fell inexplicably during
the coating stage, the values of column B and C leachates were always greater
than the conductivities for leachates from columns A and D, due to the stronger
KH2PO4 concentrations of the column B and C coating solutions (Table 3.5).
85

Chapter Three – Phosphate stabilisation experiments
5.00
5.50
6.00
200
600
1000
1400
1800
2200
2600
3000
3400
3800
4200
4600
5000
cumulative leachate (ml)
pH
Column AColumn BColumn CColumn D
Figure 3.8a.
0
10000
20000
30000
40000
50000
60000
70000
80000
200
600
1000
1400
1800
2200
2600
3000
3400
3800
4200
4600
5000
cumulative leachate (ml)
cond
uctiv
ity ( μ
S/cm
)
Figure 3.8b. Figure 3.8. Experiment 2 pH (a) and conductivity (b) of coating stage leachates. Legend for (a) also applies to (b).
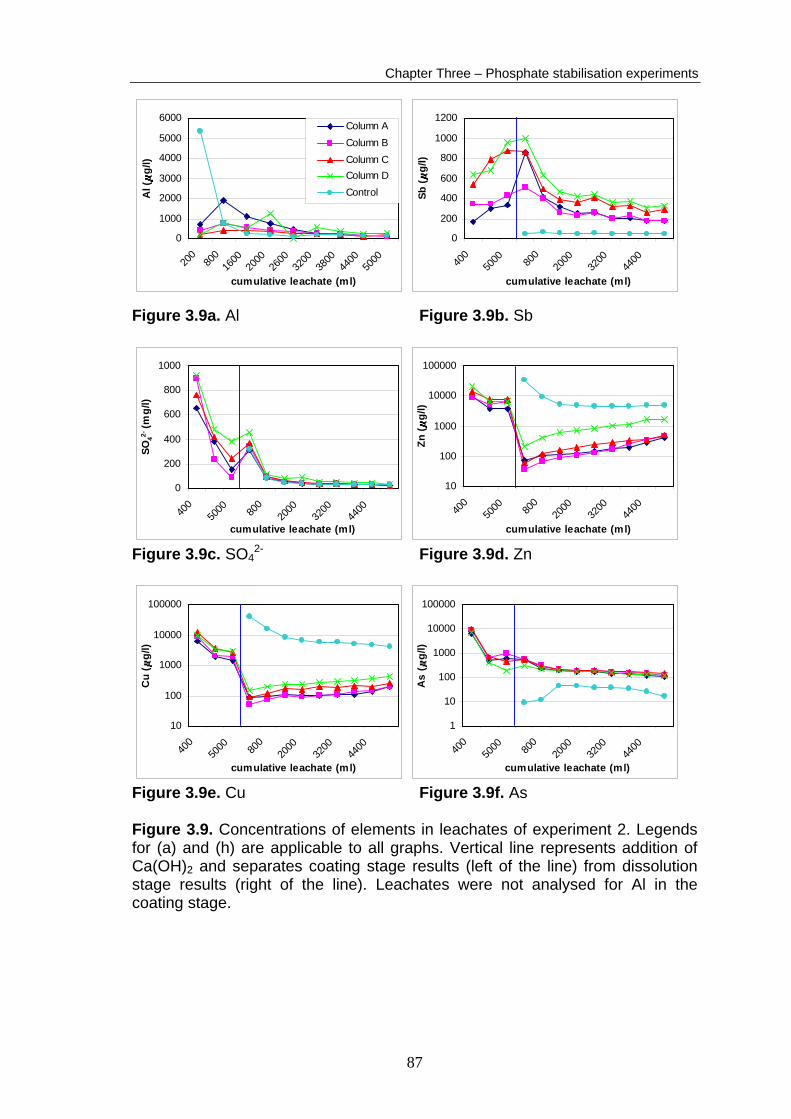
As in experiment 1, the coating stage leachate [Fe] was below detection in all
columns. Concentrations of As, Cu, SO42- and Zn dropped during the coating
stage by 93 %, 75 %, 73 % and 51 % respectively (average of the four columns)
(Fig. 3.9). In contrast to experiment 1 however, [Pb] dropped or rose slightly and
[Sb] rose by 60 % during the coating stage (average of the four columns) (Fig.
3.9b,g). The overall elemental abundance in the coating stage column
leachates (average of the four columns’ cumulative element release
86
Chapter Three – Phosphate stabilisation experiments
0
1000
2000
3000
4000
5000
6000
200
800
1600
2000
2600
3200
3800
4400
5000
cumulative leachate (ml)
Al (
g/l)
Column AColumn BColumn CColumn DControl
0
200
400
600
800
1000
1200
400
5000 80
020
0032
0044
00
cumulative leachate (ml)
Sb (
g/l)
Figure 3.9a. Al Figure 3.9b. Sb
0
200
400
600
800
1000
400
5000 80
020
0032
0044
00
cumulative leachate (ml)
SO42-
(mg/
l)
10
100
1000
10000
100000
400
5000 80
020
0032
0044
00
cumulative leachate (ml)
Zn (
g/l)
Figure 3.9c. SO4
2- Figure 3.9d. Zn
10
100
1000
10000
100000
400
5000 80
020
0032
0044
00
cumulative leachate (ml)
Cu
(g/
l)
1
10
100
1000
10000
100000
400
5000 80
020
0032
0044
00
cumulative leachate (ml)
As
(g/
l)
Figure 3.9e. Cu Figure 3.9f. As Figure 3.9. Concentrations of elements in leachates of experiment 2. Legends for (a) and (h) are applicable to all graphs. Vertical line represents addition of Ca(OH)2 and separates coating stage results (left of the line) from dissolution stage results (right of the line). Leachates were not analysed for Al in the coating stage.
87

Chapter Three – Phosphate stabilisation experiments
1
10
100
1000
10000
400
5000 80
020
0032
0044
00
cumulative leachate (ml)
Pb (
g/l)
0
200400
600800
10001200
1400
400
5000 80
020
0032
0044
00
cumulative leachate (ml)
Fe (
g/l)
Column A
Column B
Column C
Column D
Control
Figure 3.9g. Pb Figure 3.9h. Fe Figure 3.9. (continued) during the coating stage) was SO4
2- > Zn > Cu > As > Sb > Pb > Fe, which was
similar to experiment 1. The absolute cumulative quantities of coating stage
leachate SO42-, Pb and Zn were higher in experiment 2 than in experiment 1,
whereas quantities of As, Cu and Sb were lower then experiment 1 coating
stage leachates.
The order of elemental abundance in the bulk XRF results of the partly oxidised,
polyminerallic waste was Si > S > Pb > Al > Fe > Cu > Zn > Sb > As (Appendix
B1). Comparing this to the order of elemental abundance in the coating stage
leachates highlights the relative immobility of Pb and Fe and the mobility of As,
Cu and Zn in the coating stage leachates.
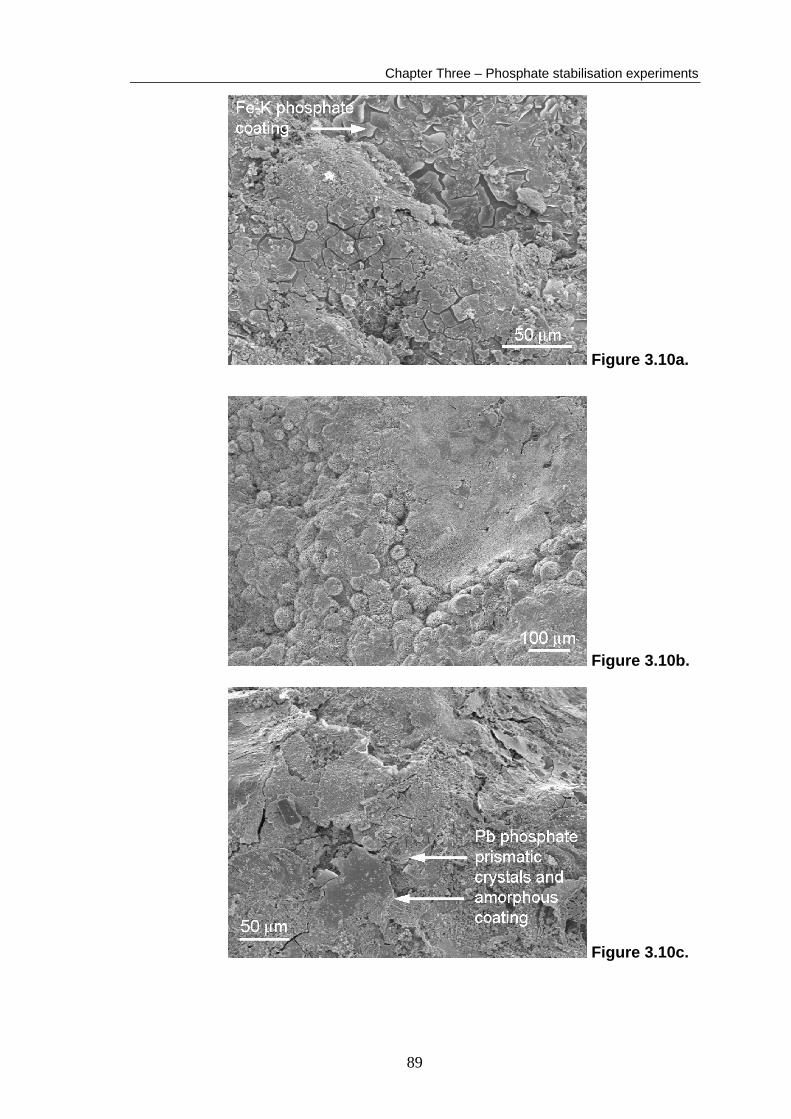
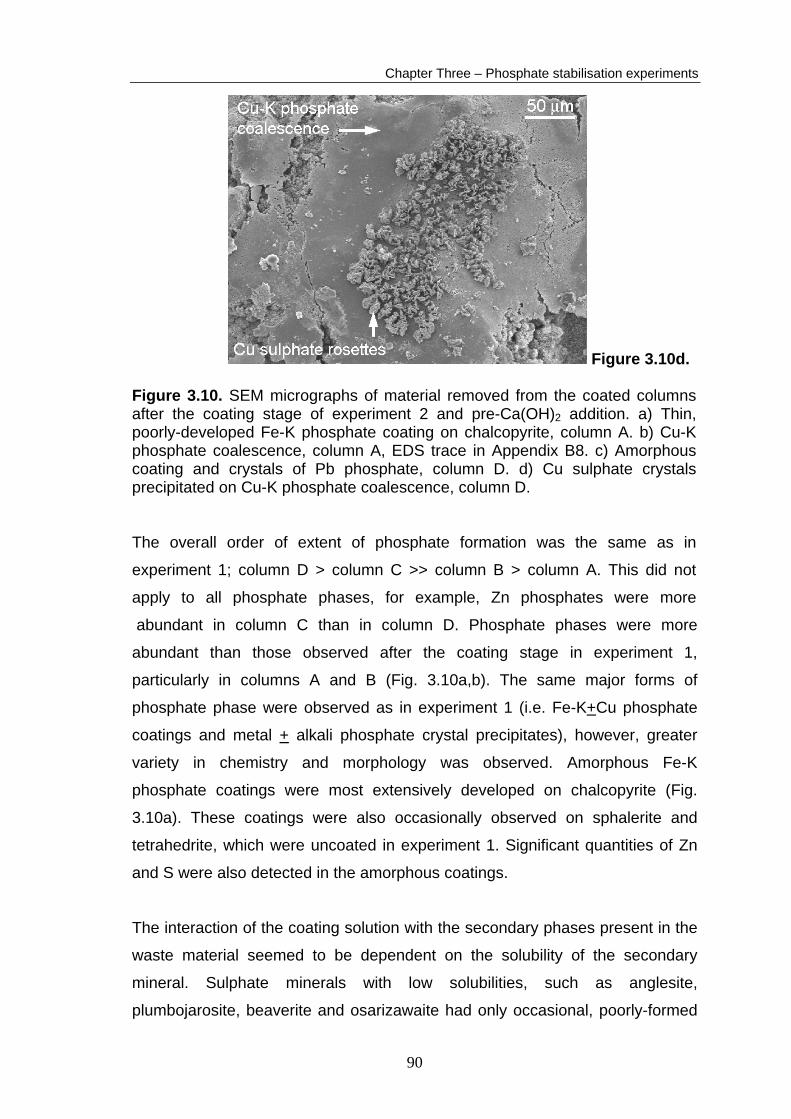
SEM observations
A summary of the SEM observations (on the material removed from the coated
columns prior to Ca(OH)2 addition) is presented in Table 3.6. Detailed results
and additional SEM micrographs are presented in Appendix B6. Abundant
phosphate phases were observed in material removed from all the coated
columns prior to Ca(OH)2 addition (Fig. 3.10), which demonstrates that the
Ca(OH)2 stabiliser was not required to form phosphate coatings or precipitates.
88
Chapter Three – Phosphate stabilisation experiments
Figure 3.10a.
Figure 3.10b.
Figure 3.10c.
89
Chapter Three – Phosphate stabilisation experiments
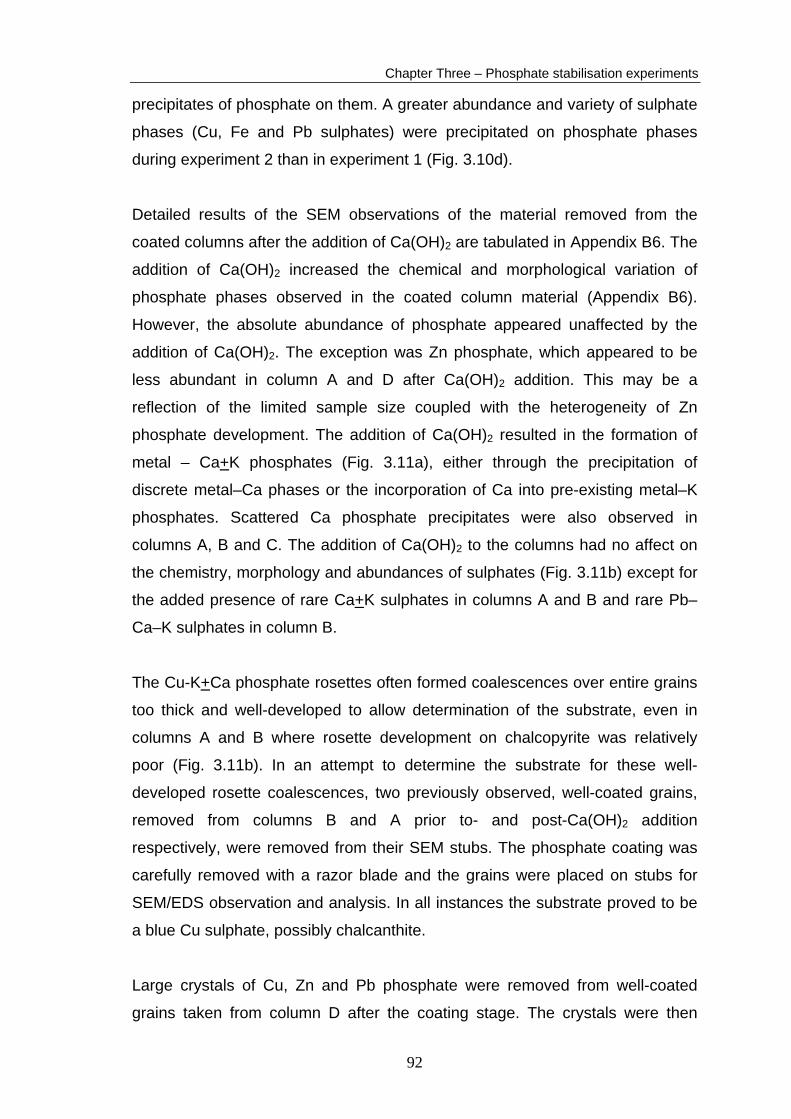
Figure 3.10d. Figure 3.10. SEM micrographs of material removed from the coated columns after the coating stage of experiment 2 and pre-Ca(OH)2 addition. a) Thin, poorly-developed Fe-K phosphate coating on chalcopyrite, column A. b) Cu-K phosphate coalescence, column A, EDS trace in Appendix B8. c) Amorphous coating and crystals of Pb phosphate, column D. d) Cu sulphate crystals precipitated on Cu-K phosphate coalescence, column D. The overall order of extent of phosphate formation was the same as in
experiment 1; column D > column C >> column B > column A. This did not
apply to all phosphate phases, for example, Zn phosphates were more
abundant in column C than in column D. Phosphate phases were more
abundant than those observed after the coating stage in experiment 1,
particularly in columns A and B (Fig. 3.10a,b). The same major forms of
phosphate phase were observed as in experiment 1 (i.e. Fe-K+Cu phosphate
coatings and metal + alkali phosphate crystal precipitates), however, greater
variety in chemistry and morphology was observed. Amorphous Fe-K
phosphate coatings were most extensively developed on chalcopyrite (Fig.
3.10a). These coatings were also occasionally observed on sphalerite and
tetrahedrite, which were uncoated in experiment 1. Significant quantities of Zn
and S were also detected in the amorphous coatings.
The interaction of the coating solution with the secondary phases present in the
waste material seemed to be dependent on the solubility of the secondary
mineral. Sulphate minerals with low solubilities, such as anglesite,
plumbojarosite, beaverite and osarizawaite had only occasional, poorly-formed
90

Chapter Three – Phosphate stabilisation experiments
Table 3.6. Summary of SEM observations of precipitates and coatings formed on partly oxidised polyminerallic mine waste in columns during the coating stage of experiment 2, prior to the addition of Ca(OH)2.
Chemistry Morphology Abundance Pb+K phosphate (Fig. 3.10c)
extensive coalescences of pincushions of fine (0.5 μm x 10 μm) acicular crystals; large (30 μm x 10 μm) bladed and leafy crystals and amorphous to scaly coatings
pincushions cover ~99 % of galena in all columns, large crystals cover ~10 % of galena in column D, rare precipitates in other columns; coatings rare in column D
Cu-K+(Si, Fe, S, Al) phosphate (Fig. 3.10b,d)
scattered spherical rosettes up to 30 μm diameter, often form coalescences of radial acicular splays
heterogeneous development, cover 100% of some grains, absent on others; abundant on coated chalcopyrite, scattered on quartz, clays, tetrahedrite and oxides
Fe-K+(Cu-Zn-S) phosphate (Fig. 3.10a)
amorphous coating with extensive desiccation cracks, variable thickness
thin coating on ~75 % of chalcopyrite in column A and B; thick coating on ~99 % of chalcopyrite and stannite and thin coating on 99 % of arsenopyrite in columns C and D; sphalerite and tetrahedrite rarely coated in columns A, B and D
Zn-K+(S) phosphate (Appendix B6)
large (200 μm x 100 μm) prismatic crystals; radial flow-like agglomerations of fine-grained (10 μm x 1 μm) acicular crystals; amorphous spheroids
large crystals and amorphous spheroids scattered precipitates in all columns; flow-like agglomerations cover ~40 % of sphalerite in columns C and D.
Pb, Cu, Fe sulphates (Fig. 3.10d)
euhedral rosettes, botryoids, fibres and blocky prisms
Cu sulphates rare isolated precipitates in columns A, B and C, occasionally extensive in column D; Pb and Fe sulphates rare precipitates in columns C and D
phosphates precipitated on them. Copper and Fe sulphates, presumably with
high solubilities, usually had extensive phosphate precipitates on them. Iron
oxides observed in the waste material also had only rare and poorly-formed
91
Chapter Three – Phosphate stabilisation experiments
precipitates of phosphate on them. A greater abundance and variety of sulphate
phases (Cu, Fe and Pb sulphates) were precipitated on phosphate phases
during experiment 2 than in experiment 1 (Fig. 3.10d).
Detailed results of the SEM observations of the material removed from the
coated columns after the addition of Ca(OH)2 are tabulated in Appendix B6. The
addition of Ca(OH)2 increased the chemical and morphological variation of
phosphate phases observed in the coated column material (Appendix B6).
However, the absolute abundance of phosphate appeared unaffected by the
addition of Ca(OH)2. The exception was Zn phosphate, which appeared to be
less abundant in column A and D after Ca(OH)2 addition. This may be a
reflection of the limited sample size coupled with the heterogeneity of Zn
phosphate development. The addition of Ca(OH)2 resulted in the formation of
metal – Ca+K phosphates (Fig. 3.11a), either through the precipitation of
discrete metal–Ca phases or the incorporation of Ca into pre-existing metal–K
phosphates. Scattered Ca phosphate precipitates were also observed in
columns A, B and C. The addition of Ca(OH)2 to the columns had no affect on
the chemistry, morphology and abundances of sulphates (Fig. 3.11b) except for
the added presence of rare Ca+K sulphates in columns A and B and rare Pb–
Ca–K sulphates in column B.
The Cu-K+Ca phosphate rosettes often formed coalescences over entire grains
too thick and well-developed to allow determination of the substrate, even in
columns A and B where rosette development on chalcopyrite was relatively
poor (Fig. 3.11b). In an attempt to determine the substrate for these well-
developed rosette coalescences, two previously observed, well-coated grains,
removed from columns B and A prior to- and post-Ca(OH)2 addition
respectively, were removed from their SEM stubs. The phosphate coating was
carefully removed with a razor blade and the grains were placed on stubs for
SEM/EDS observation and analysis. In all instances the substrate proved to be
a blue Cu sulphate, possibly chalcanthite.
Large crystals of Cu, Zn and Pb phosphate were removed from well-coated
grains taken from column D after the coating stage. The crystals were then
92
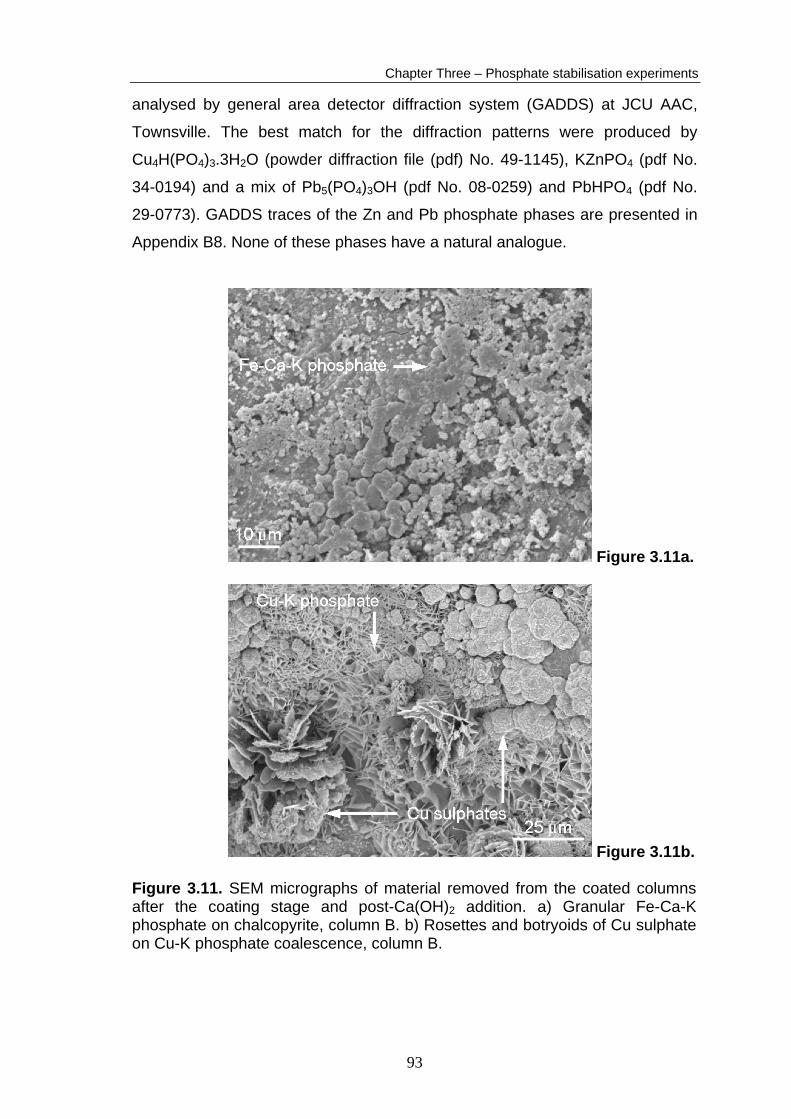
Chapter Three – Phosphate stabilisation experiments
analysed by general area detector diffraction system (GADDS) at JCU AAC,
Townsville. The best match for the diffraction patterns were produced by
Cu4H(PO4)3.3H2O (powder diffraction file (pdf) No. 49-1145), KZnPO4 (pdf No.
34-0194) and a mix of Pb5(PO4)3OH (pdf No. 08-0259) and PbHPO4 (pdf No.
29-0773). GADDS traces of the Zn and Pb phosphate phases are presented in
Appendix B8. None of these phases have a natural analogue.
Figure 3.11a.
Figure 3.11b. Figure 3.11. SEM micrographs of material removed from the coated columns after the coating stage and post-Ca(OH)2 addition. a) Granular Fe-Ca-K phosphate on chalcopyrite, column B. b) Rosettes and botryoids of Cu sulphate on Cu-K phosphate coalescence, column B.
93
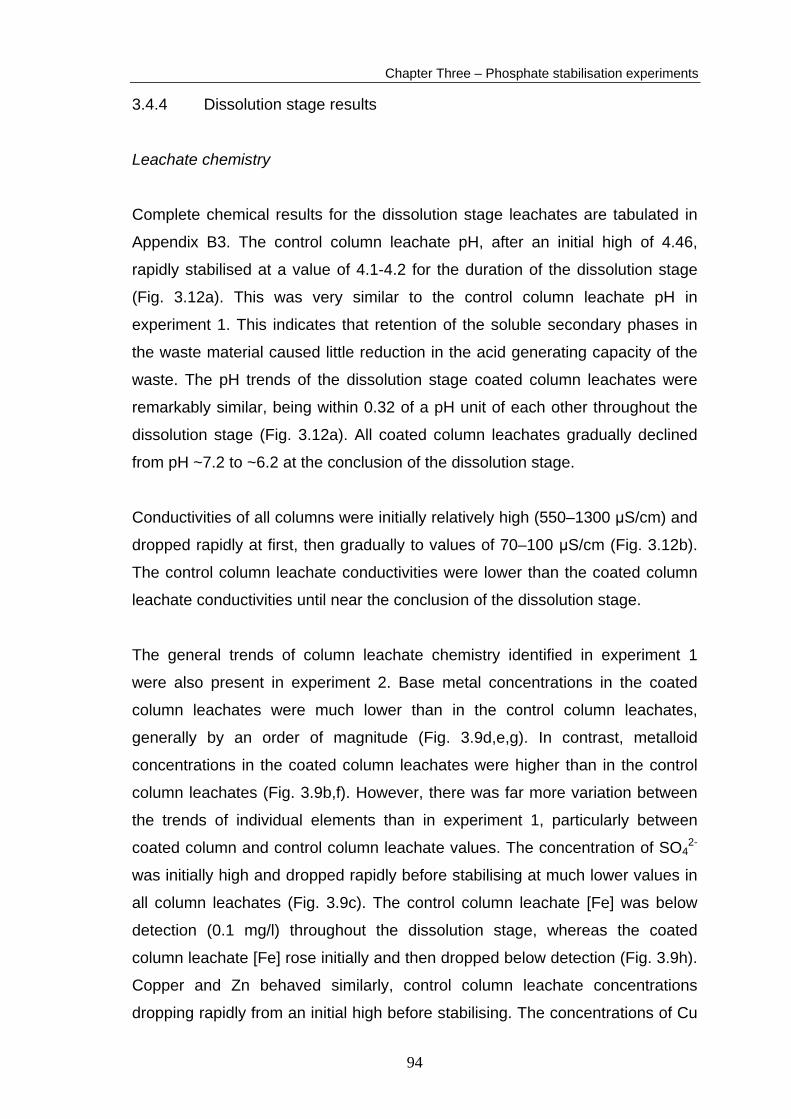
Chapter Three – Phosphate stabilisation experiments
3.4.4 Dissolution stage results
Leachate chemistry
Complete chemical results for the dissolution stage leachates are tabulated in
Appendix B3. The control column leachate pH, after an initial high of 4.46,
rapidly stabilised at a value of 4.1-4.2 for the duration of the dissolution stage
(Fig. 3.12a). This was very similar to the control column leachate pH in
experiment 1. This indicates that retention of the soluble secondary phases in
the waste material caused little reduction in the acid generating capacity of the
waste. The pH trends of the dissolution stage coated column leachates were
remarkably similar, being within 0.32 of a pH unit of each other throughout the
dissolution stage (Fig. 3.12a). All coated column leachates gradually declined
from pH ~7.2 to ~6.2 at the conclusion of the dissolution stage.
Conductivities of all columns were initially relatively high (550–1300 μS/cm) and
dropped rapidly at first, then gradually to values of 70–100 μS/cm (Fig. 3.12b).
The control column leachate conductivities were lower than the coated column
leachate conductivities until near the conclusion of the dissolution stage.
The general trends of column leachate chemistry identified in experiment 1
were also present in experiment 2. Base metal concentrations in the coated
column leachates were much lower than in the control column leachates,
generally by an order of magnitude (Fig. 3.9d,e,g). In contrast, metalloid
concentrations in the coated column leachates were higher than in the control
column leachates (Fig. 3.9b,f). However, there was far more variation between
the trends of individual elements than in experiment 1, particularly between
coated column and control column leachate values. The concentration of SO42-
was initially high and dropped rapidly before stabilising at much lower values in
all column leachates (Fig. 3.9c). The control column leachate [Fe] was below
detection (0.1 mg/l) throughout the dissolution stage, whereas the coated
column leachate [Fe] rose initially and then dropped below detection (Fig. 3.9h).
Copper and Zn behaved similarly, control column leachate concentrations
dropping rapidly from an initial high before stabilising. The concentrations of Cu
94

Chapter Three – Phosphate stabilisation experiments
3.00
4.00
5.00
6.00
7.00
8.00
200
600
1000
1400
1800
2200
2600
3000
3400
3800
4200
4600
5000
cumulative leachate (ml)
pH
Figure 3.12a.
0
200
400
600
800
1000
1200
1400
200
600
1000
1400
1800
2200
2600
3000
3400
3800
4200
4600
5000
cumulative leachate (ml)
cond
uctiv
ity ( μ
S/cm
)
Column AColumn BColumn CColumn DControl
Figure 3.12b. Figure 3.12. Experiment 2 pH (a) and conductivity (b) of dissolution stage leachates. Legend for (b) also applies to (a). and Zn in the coated column leachates were initially low and increased steadily
during the dissolution stage (Fig. 3.9d,e). In contrast, in all columns [Pb] initially
rose before steadily declining (Fig. 3.9g). Control column leachate [Al] dropped
rapidly after an initial high, whereas the coated column leachate [Al] rose
steadily before dropping steadily (Fig. 3.9a). The control column leachate [As]
remained relatively similar throughout the dissolution stage, whereas
concentrations of As and Sb in the coated column leachates decreased rapidly
from an initial high, then decreased steadily (Fig. 3.9b,f).
95
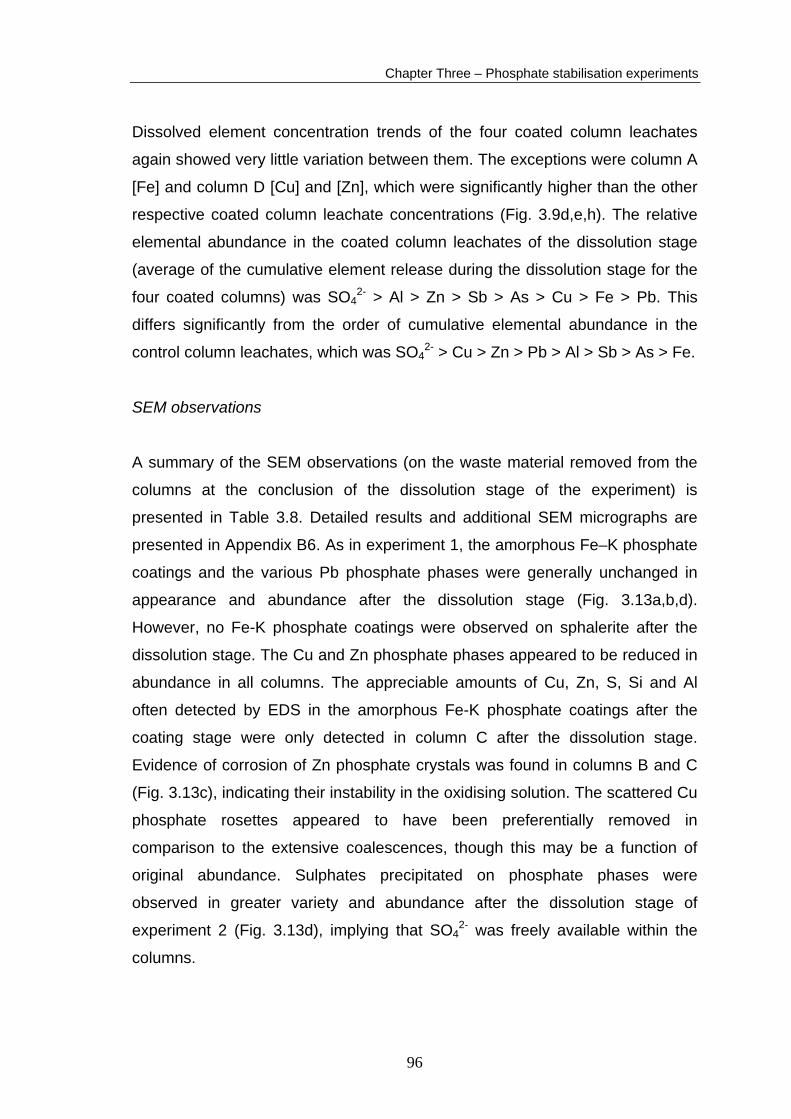
Chapter Three – Phosphate stabilisation experiments
Dissolved element concentration trends of the four coated column leachates
again showed very little variation between them. The exceptions were column A
[Fe] and column D [Cu] and [Zn], which were significantly higher than the other
respective coated column leachate concentrations (Fig. 3.9d,e,h). The relative
elemental abundance in the coated column leachates of the dissolution stage
(average of the cumulative element release during the dissolution stage for the
four coated columns) was SO42- > Al > Zn > Sb > As > Cu > Fe > Pb. This
differs significantly from the order of cumulative elemental abundance in the
control column leachates, which was SO42- > Cu > Zn > Pb > Al > Sb > As > Fe.
SEM observations
A summary of the SEM observations (on the waste material removed from the
columns at the conclusion of the dissolution stage of the experiment) is
presented in Table 3.8. Detailed results and additional SEM micrographs are
presented in Appendix B6. As in experiment 1, the amorphous Fe–K phosphate
coatings and the various Pb phosphate phases were generally unchanged in
appearance and abundance after the dissolution stage (Fig. 3.13a,b,d).
However, no Fe-K phosphate coatings were observed on sphalerite after the
dissolution stage. The Cu and Zn phosphate phases appeared to be reduced in
abundance in all columns. The appreciable amounts of Cu, Zn, S, Si and Al
often detected by EDS in the amorphous Fe-K phosphate coatings after the
coating stage were only detected in column C after the dissolution stage.
Evidence of corrosion of Zn phosphate crystals was found in columns B and C
(Fig. 3.13c), indicating their instability in the oxidising solution. The scattered Cu
phosphate rosettes appeared to have been preferentially removed in
comparison to the extensive coalescences, though this may be a function of
original abundance. Sulphates precipitated on phosphate phases were
observed in greater variety and abundance after the dissolution stage of
experiment 2 (Fig. 3.13d), implying that SO42- was freely available within the
columns.
96
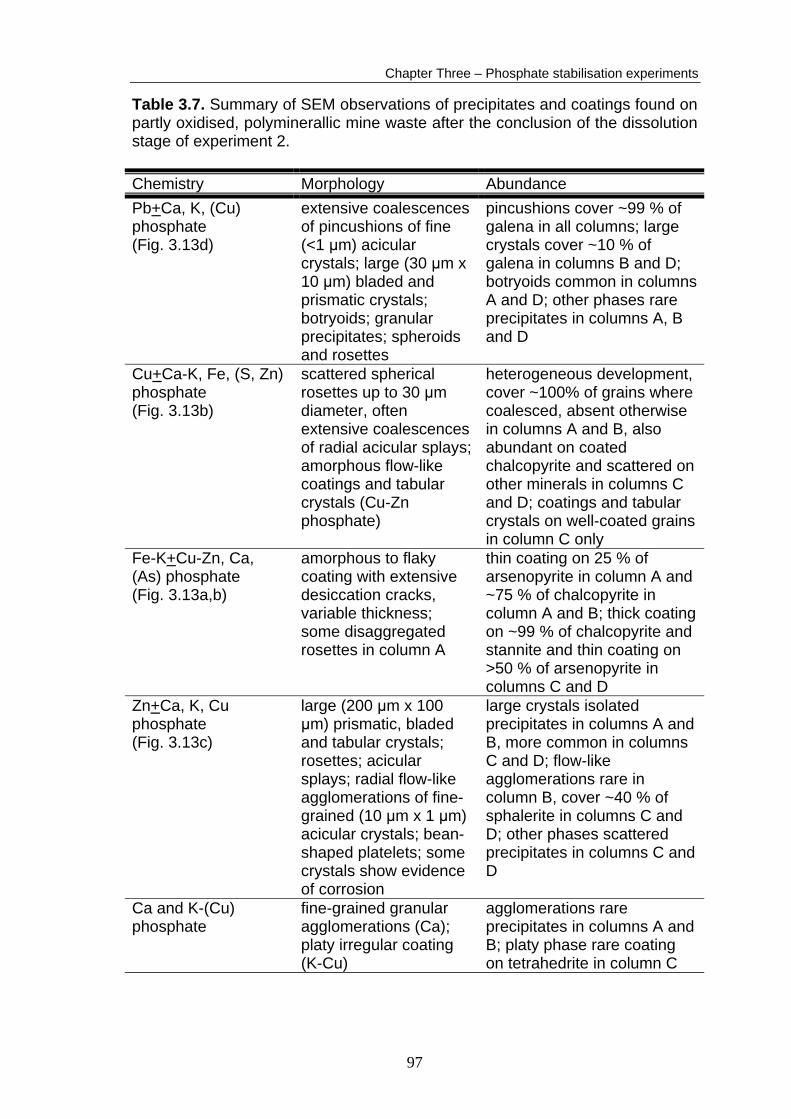
Chapter Three – Phosphate stabilisation experiments
Table 3.7. Summary of SEM observations of precipitates and coatings found on partly oxidised, polyminerallic mine waste after the conclusion of the dissolution stage of experiment 2. Chemistry Morphology Abundance Pb+Ca, K, (Cu) phosphate (Fig. 3.13d)
extensive coalescences of pincushions of fine (<1 μm) acicular crystals; large (30 μm x 10 μm) bladed and prismatic crystals; botryoids; granular precipitates; spheroids and rosettes
pincushions cover ~99 % of galena in all columns; large crystals cover ~10 % of galena in columns B and D; botryoids common in columns A and D; other phases rare precipitates in columns A, B and D
Cu+Ca-K, Fe, (S, Zn) phosphate (Fig. 3.13b)
scattered spherical rosettes up to 30 μm diameter, often extensive coalescences of radial acicular splays; amorphous flow-like coatings and tabular crystals (Cu-Zn phosphate)
heterogeneous development, cover ~100% of grains where coalesced, absent otherwise in columns A and B, also abundant on coated chalcopyrite and scattered on other minerals in columns C and D; coatings and tabular crystals on well-coated grains in column C only
Fe-K+Cu-Zn, Ca, (As) phosphate (Fig. 3.13a,b)
amorphous to flaky coating with extensive desiccation cracks, variable thickness; some disaggregated rosettes in column A
thin coating on 25 % of arsenopyrite in column A and ~75 % of chalcopyrite in column A and B; thick coating on ~99 % of chalcopyrite and stannite and thin coating on >50 % of arsenopyrite in columns C and D
Zn+Ca, K, Cu phosphate (Fig. 3.13c)
large (200 μm x 100 μm) prismatic, bladed and tabular crystals; rosettes; acicular splays; radial flow-like agglomerations of fine-grained (10 μm x 1 μm) acicular crystals; bean-shaped platelets; some crystals show evidence of corrosion
large crystals isolated precipitates in columns A and B, more common in columns C and D; flow-like agglomerations rare in column B, cover ~40 % of sphalerite in columns C and D; other phases scattered precipitates in columns C and D
Ca and K-(Cu) phosphate
fine-grained granular agglomerations (Ca); platy irregular coating (K-Cu)
agglomerations rare precipitates in columns A and B; platy phase rare coating on tetrahedrite in column C
97
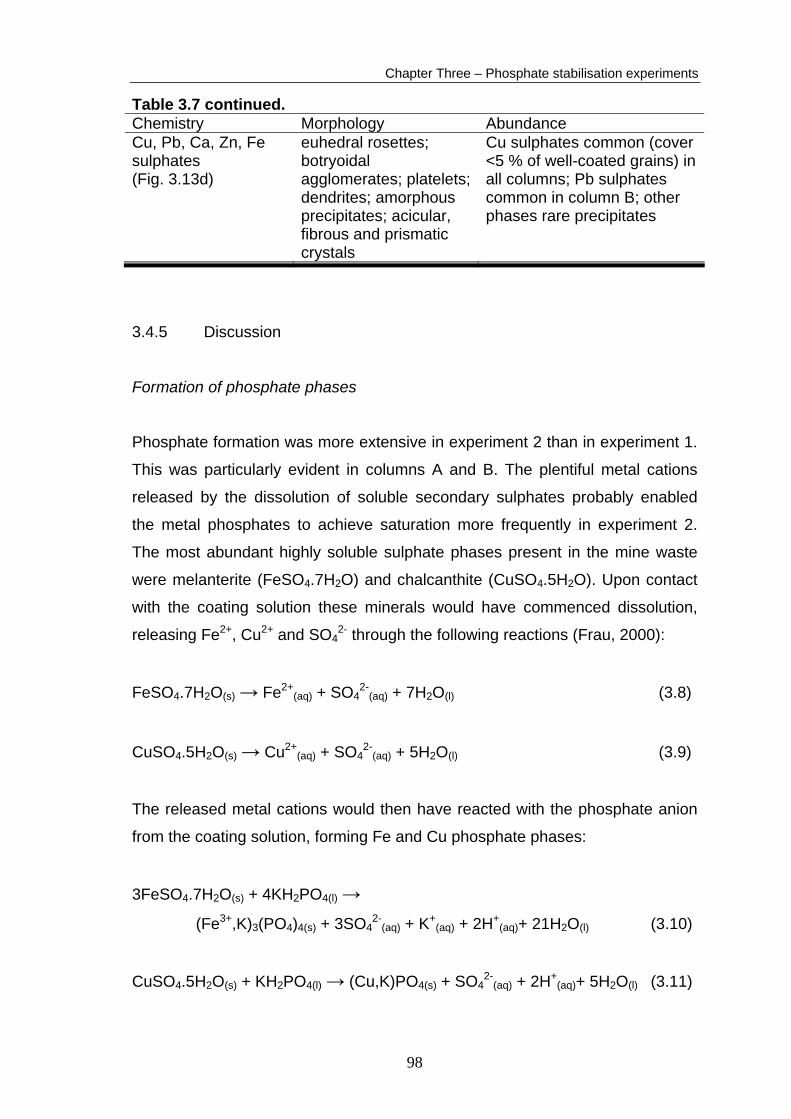
Chapter Three – Phosphate stabilisation experiments
Table 3.7 continued. Chemistry Morphology Abundance Cu, Pb, Ca, Zn, Fe sulphates (Fig. 3.13d)
euhedral rosettes; botryoidal agglomerates; platelets; dendrites; amorphous precipitates; acicular, fibrous and prismatic crystals
Cu sulphates common (cover <5 % of well-coated grains) in all columns; Pb sulphates common in column B; other phases rare precipitates
3.4.5 Discussion
Formation of phosphate phases
Phosphate formation was more extensive in experiment 2 than in experiment 1.
This was particularly evident in columns A and B. The plentiful metal cations
released by the dissolution of soluble secondary sulphates probably enabled
the metal phosphates to achieve saturation more frequently in experiment 2.
The most abundant highly soluble sulphate phases present in the mine waste
were melanterite (FeSO4.7H2O) and chalcanthite (CuSO4.5H2O). Upon contact
with the coating solution these minerals would have commenced dissolution,
releasing Fe2+, Cu2+ and SO42- through the following reactions (Frau, 2000):
FeSO4.7H2O(s) → Fe2+(aq) + SO4
2-(aq) + 7H2O(l) (3.8)
CuSO4.5H2O(s) → Cu2+(aq) + SO4
2-(aq) + 5H2O(l) (3.9)
The released metal cations would then have reacted with the phosphate anion
from the coating solution, forming Fe and Cu phosphate phases:
3FeSO4.7H2O(s) + 4KH2PO4(l) →
(Fe3+,K)3(PO4)4(s) + 3SO42-
(aq) + K+(aq) + 2H+
(aq)+ 21H2O(l) (3.10)
CuSO4.5H2O(s) + KH2PO4(l) → (Cu,K)PO4(s) + SO42-
(aq) + 2H+(aq)+ 5H2O(l) (3.11)
98

Chapter Three – Phosphate stabilisation experiments
Figure 3.13a.
Figure 3.13b.
Figure 3.13c.
99
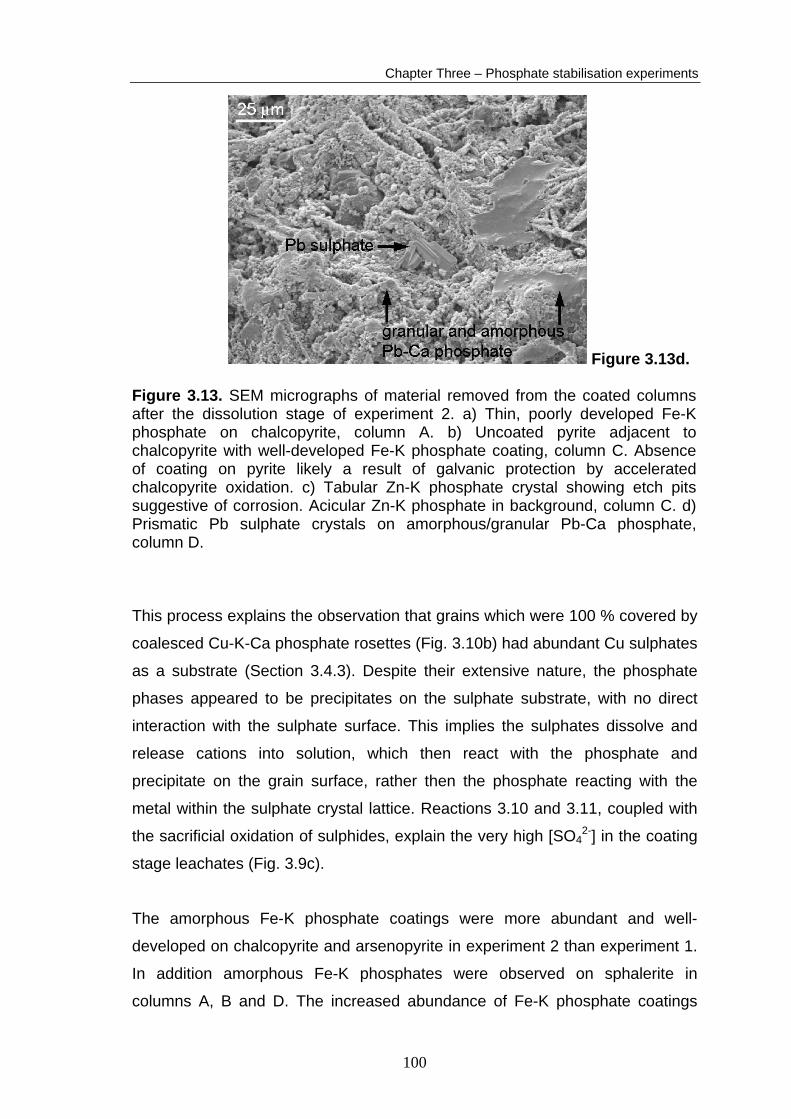
Chapter Three – Phosphate stabilisation experiments
Figure 3.13d. Figure 3.13. SEM micrographs of material removed from the coated columns after the dissolution stage of experiment 2. a) Thin, poorly developed Fe-K phosphate on chalcopyrite, column A. b) Uncoated pyrite adjacent to chalcopyrite with well-developed Fe-K phosphate coating, column C. Absence of coating on pyrite likely a result of galvanic protection by accelerated chalcopyrite oxidation. c) Tabular Zn-K phosphate crystal showing etch pits suggestive of corrosion. Acicular Zn-K phosphate in background, column C. d) Prismatic Pb sulphate crystals on amorphous/granular Pb-Ca phosphate, column D.
This process explains the observation that grains which were 100 % covered by
coalesced Cu-K-Ca phosphate rosettes (Fig. 3.10b) had abundant Cu sulphates
as a substrate (Section 3.4.3). Despite their extensive nature, the phosphate
phases appeared to be precipitates on the sulphate substrate, with no direct
interaction with the sulphate surface. This implies the sulphates dissolve and
release cations into solution, which then react with the phosphate and
precipitate on the grain surface, rather then the phosphate reacting with the
metal within the sulphate crystal lattice. Reactions 3.10 and 3.11, coupled with
the sacrificial oxidation of sulphides, explain the very high [SO42-] in the coating
stage leachates (Fig. 3.9c).
The amorphous Fe-K phosphate coatings were more abundant and well-
developed on chalcopyrite and arsenopyrite in experiment 2 than experiment 1.
In addition amorphous Fe-K phosphates were observed on sphalerite in
columns A, B and D. The increased abundance of Fe-K phosphate coatings
100
Chapter Three – Phosphate stabilisation experiments
was likely promoted by the increased [Fe3+] through melanterite dissolution
(Reaction 3.10) and subsequent oxidation of the ferrous iron. This theory is
supported by the presence of amorphous Fe-K phosphates on Fe-poor
sphalerite. The Fe in the phosphates on sphalerite could not be derived from
the oxidation of the mineral. The phosphate probably formed as a precipitate
rather than a coating interacting with the mineral surface as little Fe was present
in the sphalerite lattice. The presence of substantial quantities of Zn in many of
the Fe-K phosphate coatings on chalcopyrite also implies that incorporation of
metals into the Fe-K phosphate coatings occurred, possibly as later
precipitates.
The addition of Ca(OH)2 was not necessary to induce the formation of
phosphate coatings or precipitates. Fytas and Evangelou (1998) state the
purpose of the Ca(OH)2 was “to form calcium phosphate complexes on pyrite
surfaces in order to increase phosphate coating resistance on a long-term
basis”. Calcium was only occasionally detected in the Fe-K phosphate coatings
on chalcopyrite. The fact that oxidation was successfully inhibited despite the
lack of Ca suggests that Ca(OH)2 addition may be superfluous for phosphate
treatment of chalcopyrite-rich mine waste. However, the substantial Ca often
detected with the Cu, Pb and Zn phosphates, may have a stabilising effect on
these phases. Further column experiments without Ca(OH)2 addition are
required to determine whether this process is required to form phosphate
phases which effectively inhibit sulphide oxidation and attenuate metal release
from sulphidic mine waste.
Although over 300 phosphate minerals exist in nature (Nriagu, 1983), the
GADDS results of large Cu, Pb and Zn phosphate crystals formed in column D
(Section 3.4.3) (Appendix B8) showed that the phases had no natural
analogues. This is probably the case for the other phosphate phases formed in
the phosphate stabilisation experiments, with the possible exception of
pyromorphite. More sensitive analytical procedures are required to ascertain the
true speciation of the metal + alkali phosphates, particularly the very fine-
grained or amorphous coatings.
101
Chapter Three – Phosphate stabilisation experiments
The dissolved element trends in the experiment 2 coating stage leachates were
similar to those in experiment 1 for all elements except As and Sb (Fig. 3.9b,f).
Arsenic and Sb trends also differed from each other appreciably, which was
unexpected as the aqueous chemistry of As and Sb are believed to be similar
(Ashley et al., 2003). This indicates the solid phases controlling Sb and As
concentrations react differently in the coating solution. The higher [Sb] in
column C and D coating stage leachates (Fig. 3.9b) suggests tetrahedrite
oxidation controls the [Sb] within the leachates. The reason for the steady
increase in [Sb] during the coating stage is unknown. The rapid decrease in
coating stage leachate [As] (Fig. 3.9f) suggests depletion of readily-mobilised
As. Phosphate has been shown to rapidly replace arsenate on goethite surfaces
through a ligand exchange mechanism (O'Reilly et al., 2001), which may be
responsible for the high leachate [As] at the start of the coating stage.
Dissolution of scorodite (Krause and Ettel, 1988) or rapid desorption of As from
iron (hydr)oxides (Savage et al., 2000) at pH 5–6 are other processes possibly
responsible for the observed As trends. The lower [As] during the remainder of
the coating stage were probably controlled by arsenopyrite and arsenian
tetrahedrite oxidation.
The major factor controlling the formation of phosphates in experiment 2 was
again oxidant strength. Overall phosphate formation was more extensive than in
experiment 1 due to the greater availability of metal cations through the
dissolution of secondary sulphates. Processes controlling the leachate
dissolved element concentrations in experiment 2 were generally the same as
those of experiment 1 (Section 3.3.5). This is reflected by the generally similar
elemental trends in experiment 1 and 2 coating stage leachates. However, the
desorption of elements from and dissolution of secondary phases would have
contributed significantly more aqueous ions to the solution.
Stability of phosphate phases
The leachate pH remained above 6 and acid generation was prevented in all of
the coated columns during the dissolution stage (Fig. 3.12a). This was well
above the control column value of ~4.15. However, the variable abundance of
102

Chapter Three – Phosphate stabilisation experiments
phosphates observed in the coated columns (column D > column C >> column
B > column A) did not influence the leachate pH. This implies that although the
Fe-K phosphate coatings observed in columns A and B were thin and poorly-
formed (Fig. 3.10a; Fig. 3.13a), they were able to prevent sulphide (particularly
chalcopyrite) oxidation and hence acid generation.
The Fe-K phosphate precipitates on sphalerite and the impurities (Cu, Zn, S, Si
and Al) within Fe-K phosphate coatings on chalcopyrite were absent or reduced
in abundance after the dissolution stage. This implies that these phases,
interpreted to have formed as precipitates from solution, were less stable in the
oxidising solution than the Fe-K phosphate coatings which were reacted directly
with sulphide surfaces. The Fe released from dissolution of these precipitates
may be responsible for the slightly elevated Fe concentrations in the coated
column leachates during the dissolution stage (Fig. 3.9h).
The concentrations of base metals in the coated column leachates during the
dissolution stage were likely controlled by the stability of the base metal
phosphates in the oxidising solution, although the solution pH may also have an
important effect. The Pb phosphates were stable in the oxidising solution,
resulting in low [Pb] in all coated column leachates during the dissolution stage
(Fig. 3.9g). In contrast, the corroded Zn phosphate crystals observed in
columns B and C after the dissolution stage (Fig. 3.13c) demonstrate the
instability of the Zn phosphates in the oxidising solution. The corrosion of the Zn
phosphates was likely responsible for the steadily increasing [Zn] in the coated
column leachates during the dissolution stage (Fig. 3.9d). No direct evidence of
corrosion of Cu phosphate rosettes was observed, however, their decreased
abundance in the waste material after the dissolution stage implies they were
unstable in the oxidising solution. The dissolution of Cu phosphates was
probably responsible for the coated column leachate [Cu] increasing during the
dissolution stage (Fig. 3.9e). The relatively high Cu and Zn concentrations in the
column D leachates are probably due to a greater quantity of Cu and Zn
phosphates being available for corrosion during the dissolution stage than in
columns A and B. However, why this is not the case for the column C
dissolution stage leachates is not clear.
103

Chapter Three – Phosphate stabilisation experiments
Concentrations of As and Sb in the dissolution stage leachates are a function of
solution pH. The acidity of the control column promoted metalloid attenuation as
in experiment 1. The [Sb] shows a marked increase at the start of the
dissolution stage in the leachates of all the coated columns compared with the
coating stage leachate concentrations (Fig. 3.9b). This is possibly due to the
large pH increase (pH >8) associated with the addition of Ca(OH)2. The
increased pH may have increased desorption of Sb from iron (hydr)oxides in the
waste material. Arsenic concentration, in contrast, showed no increase in the
coated column leachates at the start of the dissolution stage (Fig. 3.9f). The
readily mobilised As may have already been removed from the waste material
early in the coating stage.
Aluminium concentrations in the coated column leachates during the dissolution
stage were probably controlled by the dissolution of sparingly soluble clays, and
remobilisation of some Al from the Fe-K phosphate coatings. Though the
leachate pH was above the first hydrolysis constant of Al3+ in all coated columns
(Nordstrom and Ball, 1986), no Al-rich precipitates were observed. The initial
elevated [Al] in the control column leachate (Fig. 3.9a) was probably due to the
dissolution of soluble Al-bearing sulphates present in the mine waste (e.g. K-
alum, tamarugite; Table 2.2). Flushing of the released Al3+ and rapid depletion
of the sulphates led to lower [Al], possibly controlled by the dissolution of
sparingly soluble clays.
The similarity of [SO42-] in the control and coated column leachates during the
dissolution stage (Fig. 3.9c) poses problems for interpretation. The degree of
sulphide oxidation was probably much greater in the control column than in the
coated columns, as evidenced by the leachate pH values. The control column
leachate [SO42-] was probably controlled by the dissolution of secondary
sulphates and the oxidation of sulphides. It is possible that the amount of SO42-
released from the dissolution of secondary sulphates masked any differences in
SO42- release due to sulphide oxidation between the coated and the control
columns. In addition, coprecipitation and adsorption of SO42- onto iron
(hydr)oxides may have reduced the [SO42-] in the control column leachates
104
Chapter Three – Phosphate stabilisation experiments
(Rose and Ghazi, 1997). The initially high [SO42-] in the coated column
leachates at the start of the dissolution stage is possibly due to the dissolution
of sulphates formed during the coating stage or the desorption of SO42- from
iron (hydr)oxides at the alkaline conditions (pH >8) resulting from the addition of
the Ca(OH)2 (Rose and Elliot, 2000).
The greater degree of amorphous Fe-K phosphate coating developed in
experiment 2 inhibited the generation of acid in all coated columns. This was
despite the thin, poorly-developed nature of the coatings in columns A and B.
The concentration of dissolved base metals in the leachates was controlled by
the stability of the base metal phosphates in the oxidising solution coupled with
inhibited sulphide oxidation. Leachate metalloid concentrations were controlled
by the pH of the leachate, which influenced the aqueous mobility of the
metalloids.
3.4.6 Summary
The presence of secondary minerals in the partly oxidised mine waste promoted
the formation of phosphate phases through the increased availability of cations
for complexation with the phosphate anion. The strength of the oxidant used in
the coating solutions was still the most important factor governing the extent of
phosphate formation. The higher concentrations of cations in solution allowed
the formation of phosphate precipitates on all sulphides to varying degrees.
Chalcopyrite and galena again hosted the most abundant coatings and
precipitates respectively.
The degree of phosphate formation had no effect on acid generation inhibition
with acid generation being prevented in all coated columns. Base metal release
was also probably inhibited by the phosphate phases, typically by an order of
magnitude, although Zn and Cu release increased during the dissolution stage,
likely through the dissolution of Zn and Cu phosphates.
105