Embed Size (px)
Citation preview
Chapter Three
Tradeoffs:
No Pain, No Gain
What do managers do?
• They make decisions
• These decisions may or may not involve tradeoffs
• Good management creates an environment of constant tradeoff
• Poor management is indicated if production can be increase without tradeoffs

Managerial Decisions and Economic Efficiency
• Case 1 – No tradeoffs = Poor Management– If no tradeoffs exist in your decision-making
you are simply employing previously idle or under-employed resources
– You are increasing the efficiency of existing resources which were previously improperly deployed
Managerial Decisions and Economic Efficiency
• Case 1 – To pursue economic efficiency management must…– Use existing resources more efficiently
• Case 1 is referred to as “X-inefficiency” – Improper deployment of resources– These resources must be put to better
alternative use
Managerial Decisions and Economic Efficiency
• Case 2 – Tradeoff Choices– The firm’s existing resources and technologies
are being fully and efficiently employed– All X-inefficiency has been eliminated– Now real tradeoff choices begin
Production Possibilities Curve
• Let’s use what economists call the production possibilities curve (PPC) to illustrate the difference between – Case 1: No tradeoffs = Poor Management – Case 2: Tradeoff Choices
PPC
At any given point-in-time the producer faces – Fixed Resources or Inputs– Fixed Technology
• A PPC outlines the set of production possibilities available when your fixed resources and technology are being used “fully and efficiently” (i.e., there is no X-inefficiency)
PPC
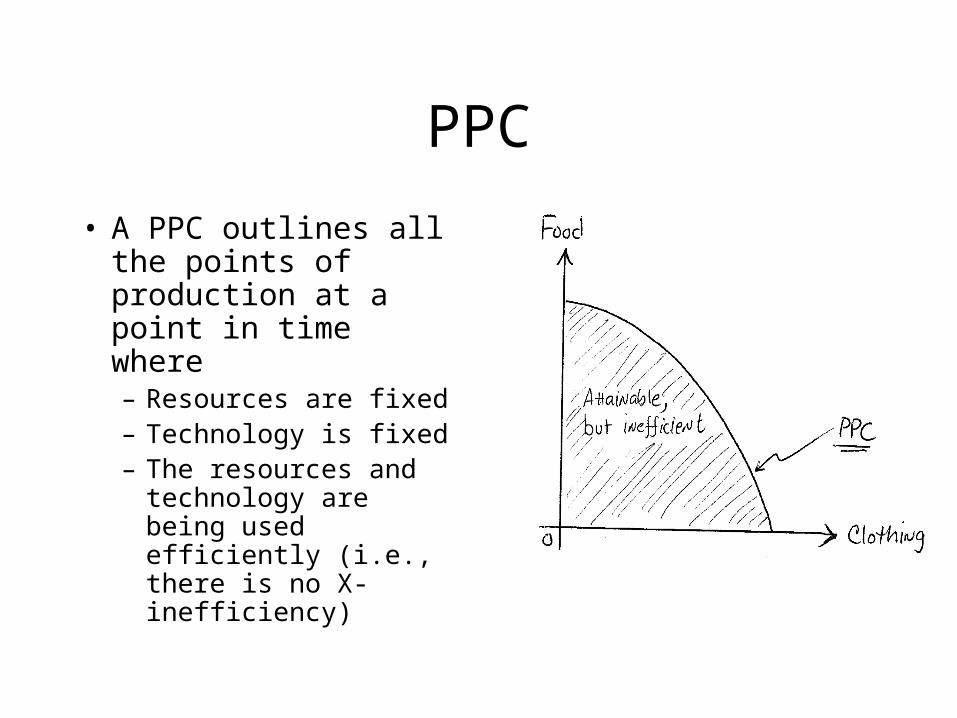
• A PPC outlines all the points of production at a point in time where– Resources are fixed– Technology is fixed– The resources and
technology are being used efficiently (i.e., there is no X-inefficiency)
PPC
• The firm can produce anywhere on or under the PPC
• If they produce within the interior of the PPC they are suffering X-inefficiency and can produce more of both goods with existing resources
• Any point within the interior of the PPC is thus “attainable, but inefficient”
PPC
• Operating on the PPC curve means that you have eliminated all X-inefficiency
• You are creating as much output as possible with your resources and technology.
On the PPC
• Once X-inefficiency is eliminated you have to make the following tradeoff:– The decision to produce more of good X
requires you produce less of good Y
Why?
• You are constrained by the resources and technology available to you.
• In order to produce more of good X you must apply more of the firm’s resources to good X
• Because all idle and underemployed resources have been eliminated (i.e., there is no X-inefficiency) the only way to get more resources for good X is to transfer them from good Y
Production
• The slope of the PPC is a measure of opportunity cost– How much of good X do I have to give up to
produce one additional unit of good Y?– Alternatively, how much of good Y do I have
to give up to produce one additional unit of good X?
Case 1: No Tradeoffs = Poor Management
• Indicates the existence of X-inefficiency– The inefficiency is the result of idle resources
or resources being used in inefficient ways– Idle or underutilized resources are costly
• Their value-added to the firm can be improved by more efficient utilization
Case 1: No Tradeoffs = Poor Management
• Simple managerial decision – move from the interior of the PPC to the PPC curve itself
• Employ the idle resource or less than fully productive resources in more productive ways
• X-inefficiency falls to zero when you are efficiently employing all of the firm’s available resources
Review - Case 2: Tradeoff Choices
• A more difficult managerial decision– To produce more of good X you must release
resources from good Y by producing less of good Y
– To produce more of good Y you must release resources from good X by producing less of good X
Case 2: Tradeoff Choices and using Cost-Value Logic
Ask two critical questions:1. Cost
1. What am I giving up? (What is the cost?)
2. Value1. Is it worth more or less than what I am gaining?
(What is its value?)
– Realize that technology and resource changes require the manager to evaluate these questions continually and the results of all current choice lie in the future
Challenges in Cost-Value Logic
1. Measurement Problems
2. Customer Psychology
3. False Choices
4. Choice over Time
Measurement Problems
• Tradeoff measures are often difficult to quantify• The firms measure of the cost-value tradeoff may
differ from the customers measure of it• Experience and intuition play an important role in
– Deciding what to measure
– Deciding how to measure it
Customer Psychology
• Customers make tradeoffs based upon the goods attributes
• They engage in their own cost-value logic
• Customer valuation is inherently subjective

Customer Psychology
• The firm sells to the customers actual values not their intended values
• Customers may say that they intend to act one way but actually act in another way– Using intentions as a measure of action is
problematic: actions often betray intention

Customer Psychology
• Experience and intuition play a very important role in judging what true customer values may be

False Choices
• Choices inherently embody compromise (tradeoffs)
• Choices are almost never all-or-nothing so avoid binomial thinking
• Choices almost always produce gray rather than pure black or pure white
• Recognize and embrace the gray aspects of choice
Choice over Time
“A management problem is not solved if immediate profits are purchased by endangering the long-run health, even survival, of the company. A management decision is irresponsible if it risks disaster for the sake of a grandiose future.”
Peter Drucker
The Manager’s Dilemma
• Choice must be made today
• The consequences of choice today lie entirely in the future
To be an effective manager
• You must balance both short-term cost-value logic and long-term cost-value logic
• Ignoring this balance is deadly– Enron and Arthur Anderson, 2001– IBM, early 1980s– Kodak, Xerox and Polaroid; the advent of the
digital age
Introducing Comparative Advantage
• An intuitive approach– Sue, a lawyer, can accurately type 70 words
per minute or 4200 words per hour– Pam, her secretary, can accurately type 35
words per minute or 2100 words per hour
• Sue has what economists call the “absolute advantage” in typing. She is the more productive typist.
Should Sue type her own work?
• That depends upon opportunity costs• What is Sue’s next best, foregone
alternative? – Working as a lawyer earning $100 per hour
• In one hour Sue can type 4200 words while Pam can type 2100 words. Pam is slower but she also earns less per hour (suppose, $15 per hour.)
Should Sue type her own work?
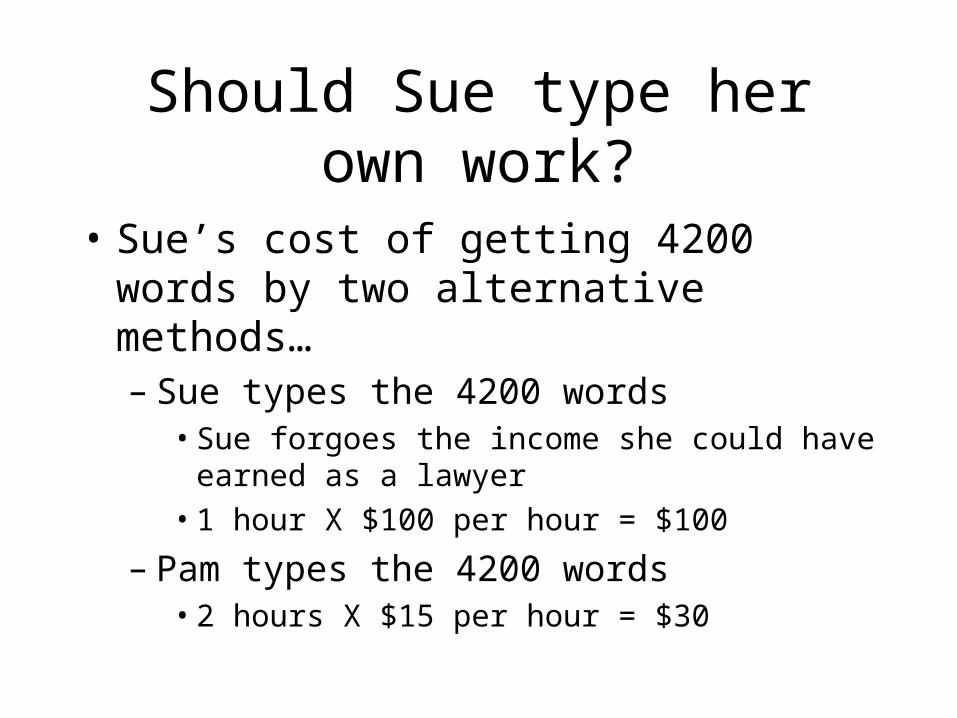
• Sue’s cost of getting 4200 words by two alternative methods…– Sue types the 4200 words
• Sue forgoes the income she could have earned as a lawyer
• 1 hour X $100 per hour = $100
– Pam types the 4200 words• 2 hours X $15 per hour = $30
Comparative Advantage
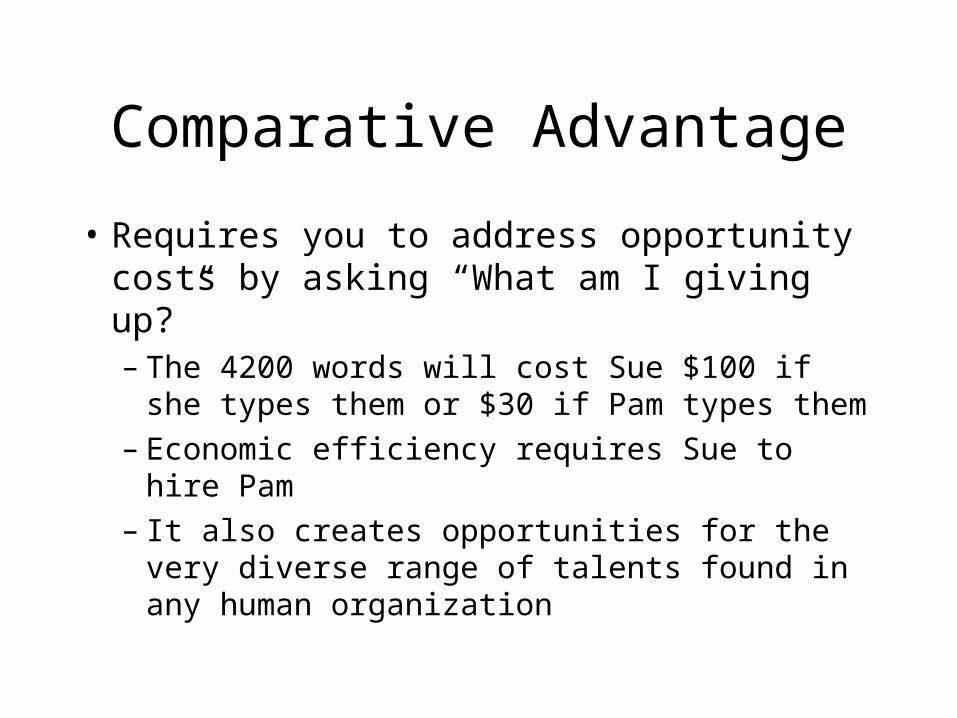
• Requires you to address opportunity costs by asking “What am I giving up?”– The 4200 words will cost Sue $100 if she types
them or $30 if Pam types them– Economic efficiency requires Sue to hire Pam– It also creates opportunities for the very diverse
range of talents found in any human organization
The Law of Comparative Advantage
“Any trading entity will gain by producing the product or products in which it is the low opportunity cost producer and trading those products for goods and services in which they are high opportunity cost producers”– Both sides of the trade gain from following
comparative advantage– Comparative Advantage applies to any entity
• individuals, groups, regions, and nation-states
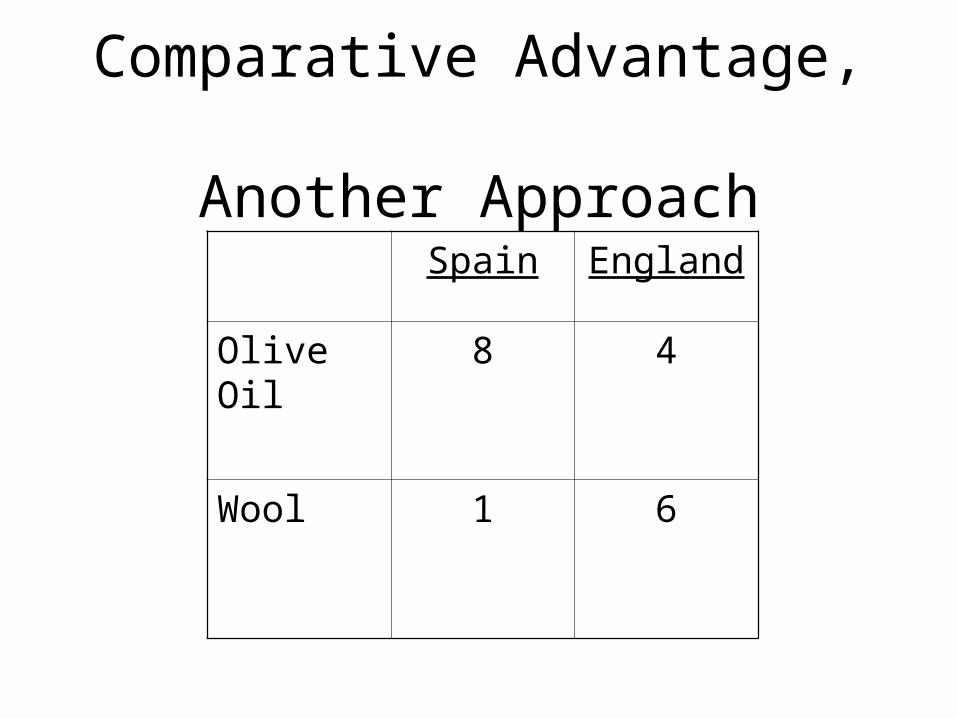
Comparative Advantage, Another Approach
Spain England
Olive Oil 8 4
Wool 1 6
Another Approach
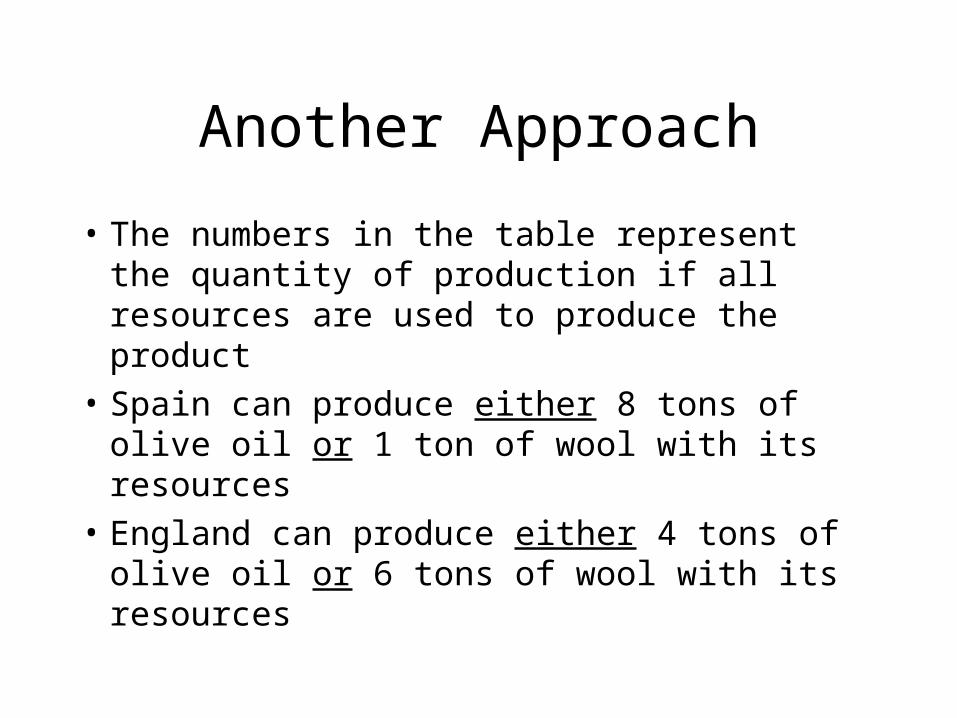
• The numbers in the table represent the quantity of production if all resources are used to produce the product
• Spain can produce either 8 tons of olive oil or 1 ton of wool with its resources
• England can produce either 4 tons of olive oil or 6 tons of wool with its resources
Using Absolute Advantage
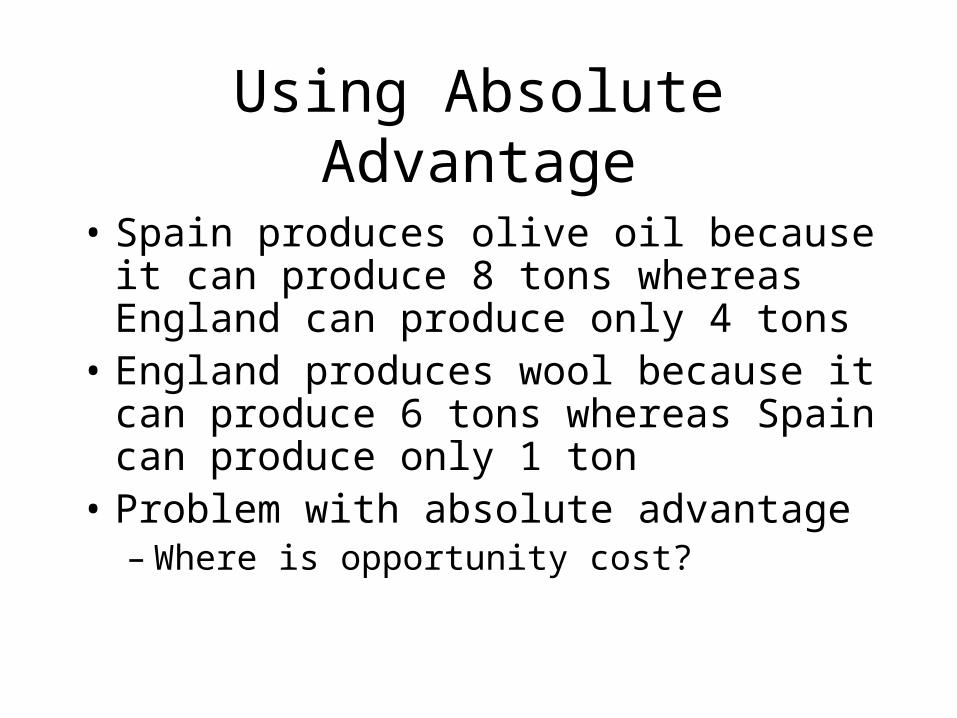
• Spain produces olive oil because it can produce 8 tons whereas England can produce only 4 tons
• England produces wool because it can produce 6 tons whereas Spain can produce only 1 ton
• Problem with absolute advantage– Where is opportunity cost?

Absolute vs. Comparative Advantage
• Absolute Advantage asks– Which entity can produce the most?
• Comparative Advantage asks– Which entity can produce most efficiently?– Where costs are measured in terms of
opportunity costs.
Comparative Advantage
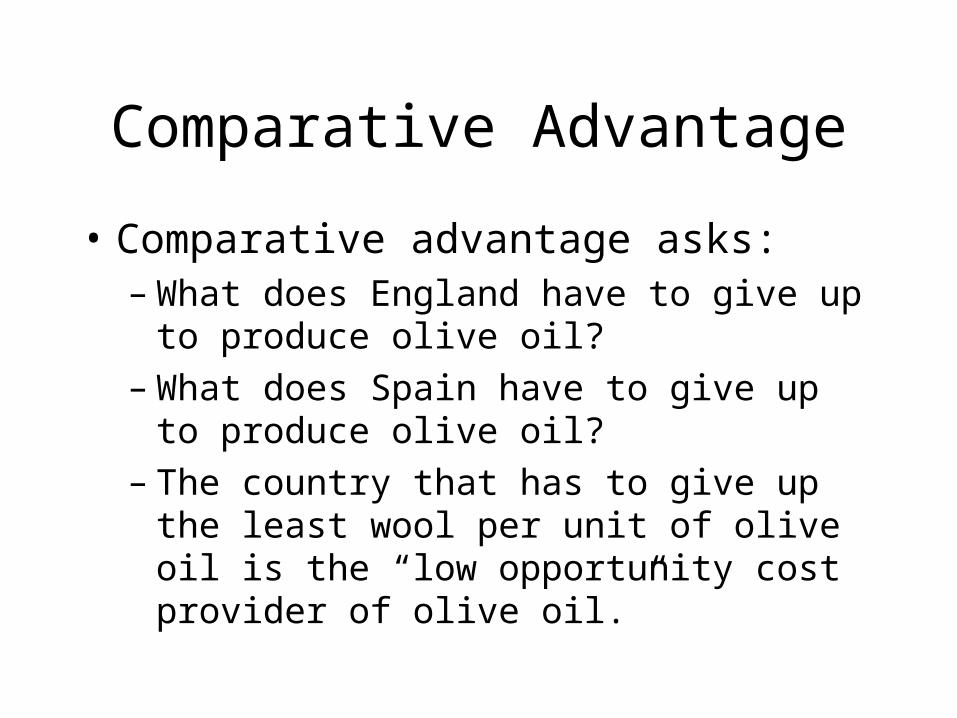
• Comparative advantage asks:– What does England have to give up to produce
olive oil?– What does Spain have to give up to produce
olive oil?– The country that has to give up the least wool
per unit of olive oil is the “low opportunity cost provider of olive oil.”
Comparative Advantage
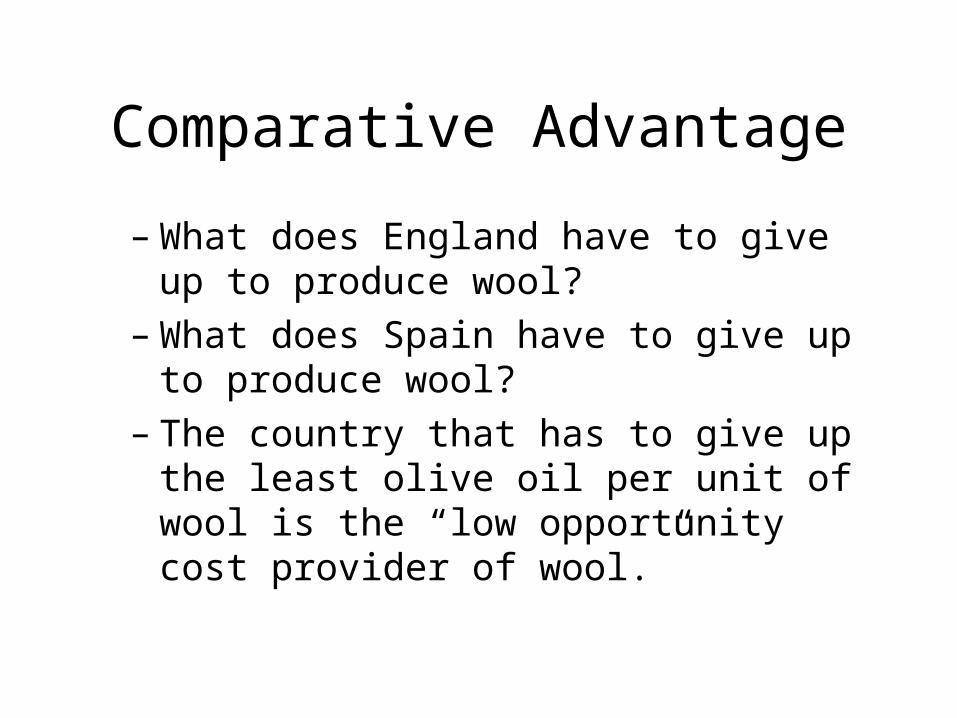
– What does England have to give up to produce wool?
– What does Spain have to give up to produce wool?
– The country that has to give up the least olive oil per unit of wool is the “low opportunity cost provider of wool.”
The Law of Comparative Advantage
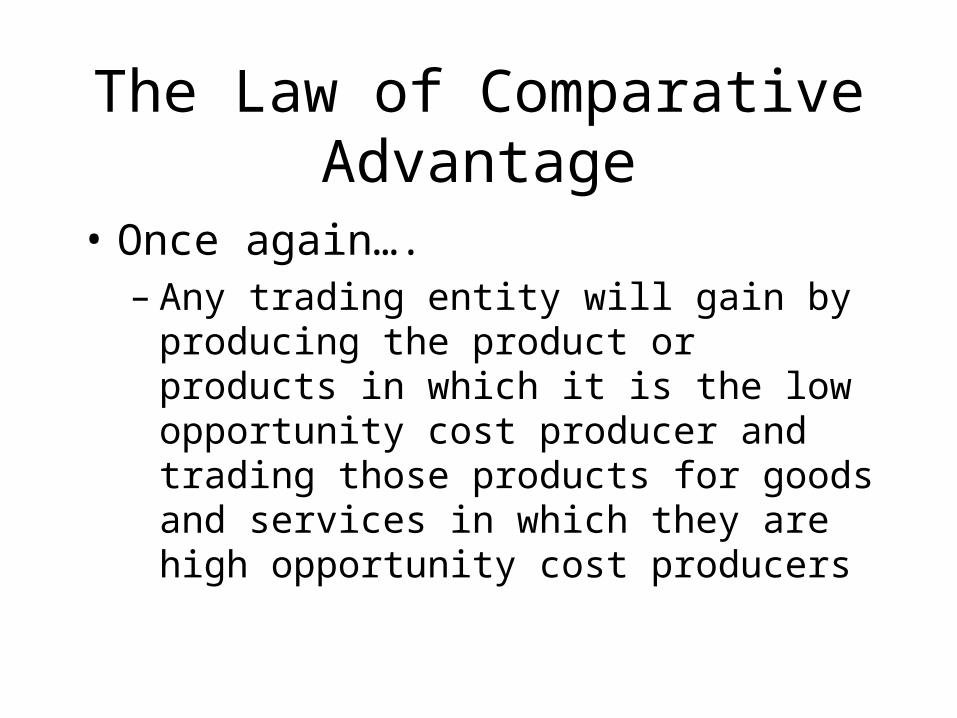
• Once again….– Any trading entity will gain by producing the
product or products in which it is the low opportunity cost producer and trading those products for goods and services in which they are high opportunity cost producers
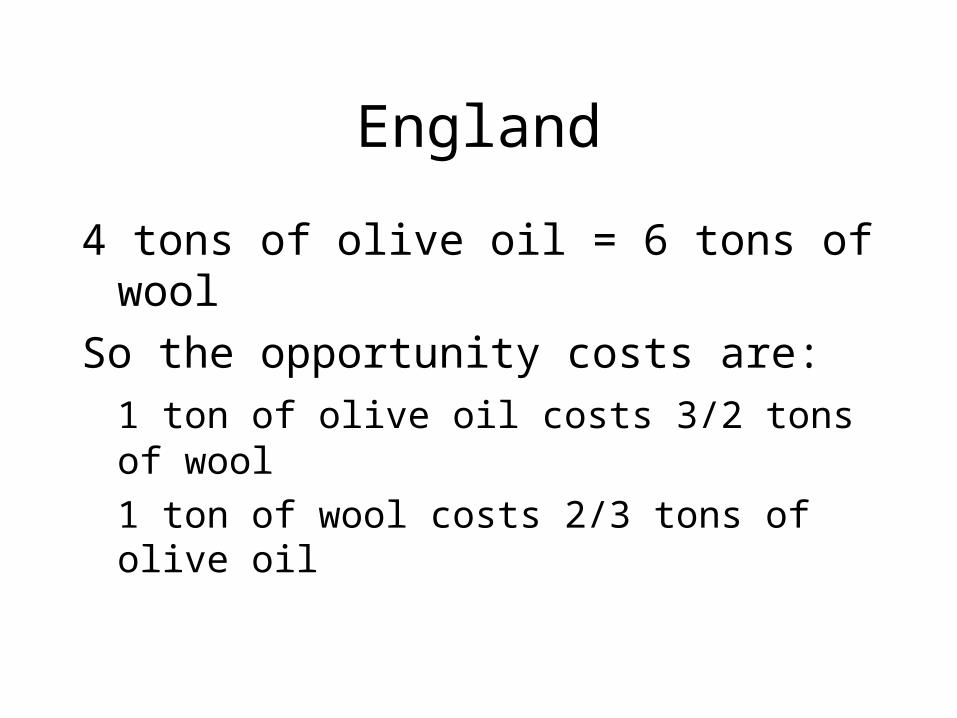
England
4 tons of olive oil = 6 tons of wool
So the opportunity costs are:
1 ton of olive oil costs 3/2 tons of wool
1 ton of wool costs 2/3 tons of olive oil
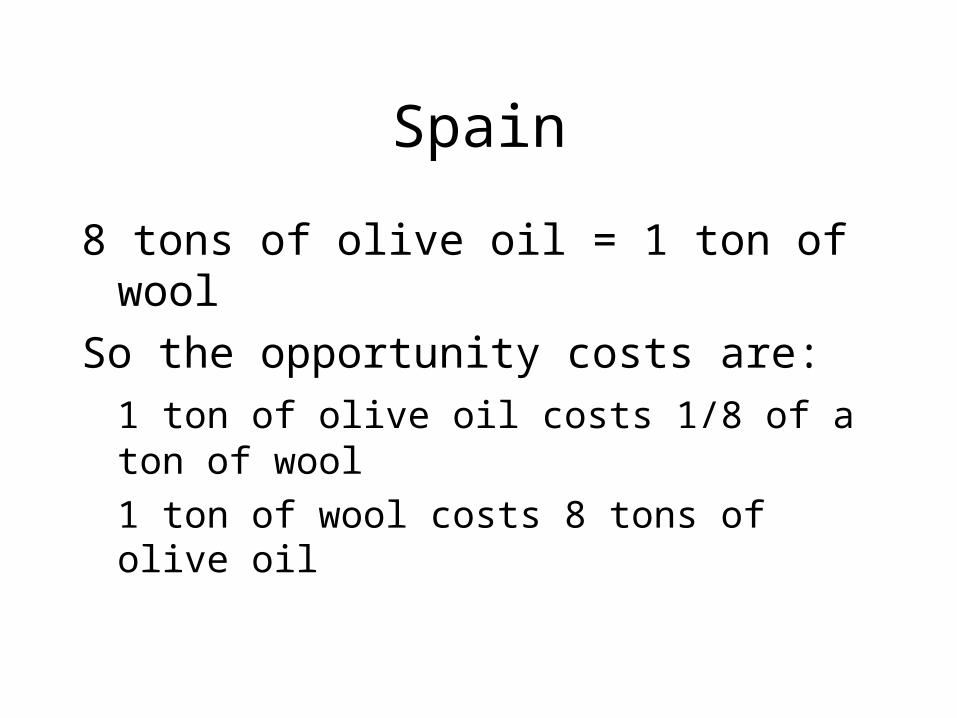
Spain
8 tons of olive oil = 1 ton of wool
So the opportunity costs are:
1 ton of olive oil costs 1/8 of a ton of wool
1 ton of wool costs 8 tons of olive oil
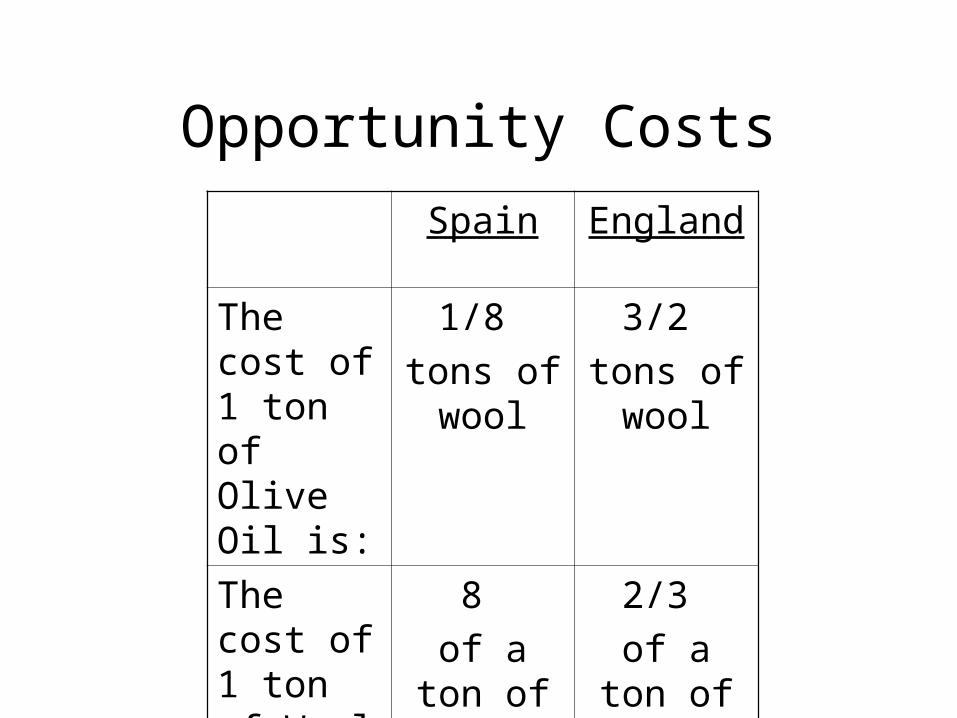
Opportunity Costs
Spain England
The cost of 1 ton of Olive Oil is:
1/8
tons of wool
3/2
tons of wool
The cost of 1 ton of Wool is:
8
of a ton of olive oil
2/3
of a ton of olive oil
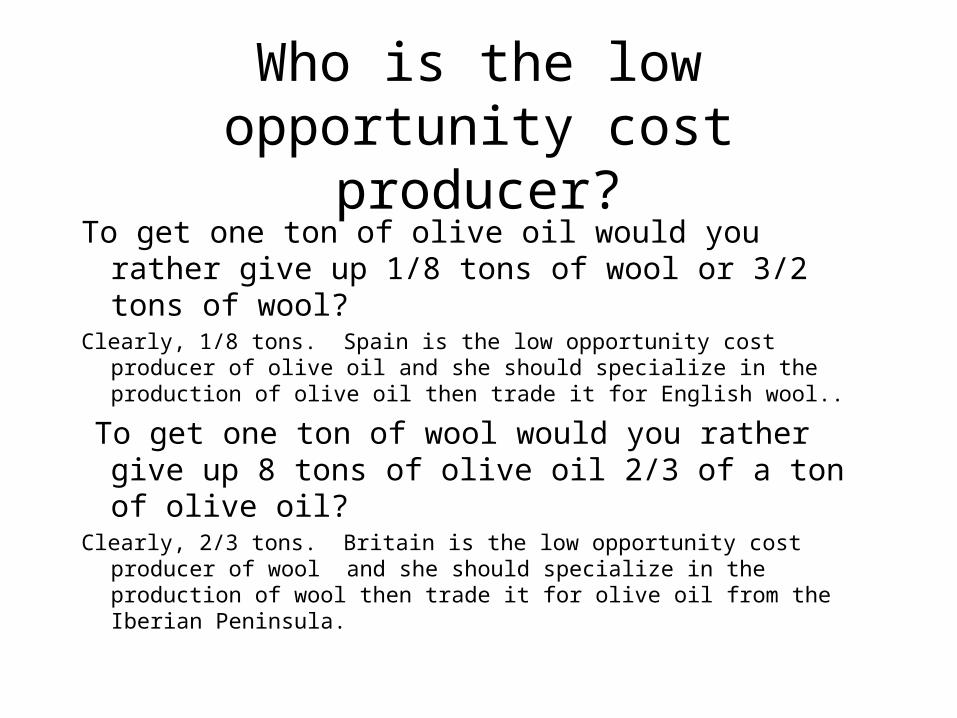
Who is the low opportunity cost producer?
To get one ton of olive oil would you rather give up 1/8 tons of wool or 3/2 tons of wool?
Clearly, 1/8 tons. Spain is the low opportunity cost producer of olive oil and she should specialize in the production of olive oil then trade it for English wool..
To get one ton of wool would you rather give up 8 tons of olive oil 2/3 of a ton of olive oil?
Clearly, 2/3 tons. Britain is the low opportunity cost producer of wool and she should specialize in the production of wool then trade it for olive oil from the Iberian Peninsula.
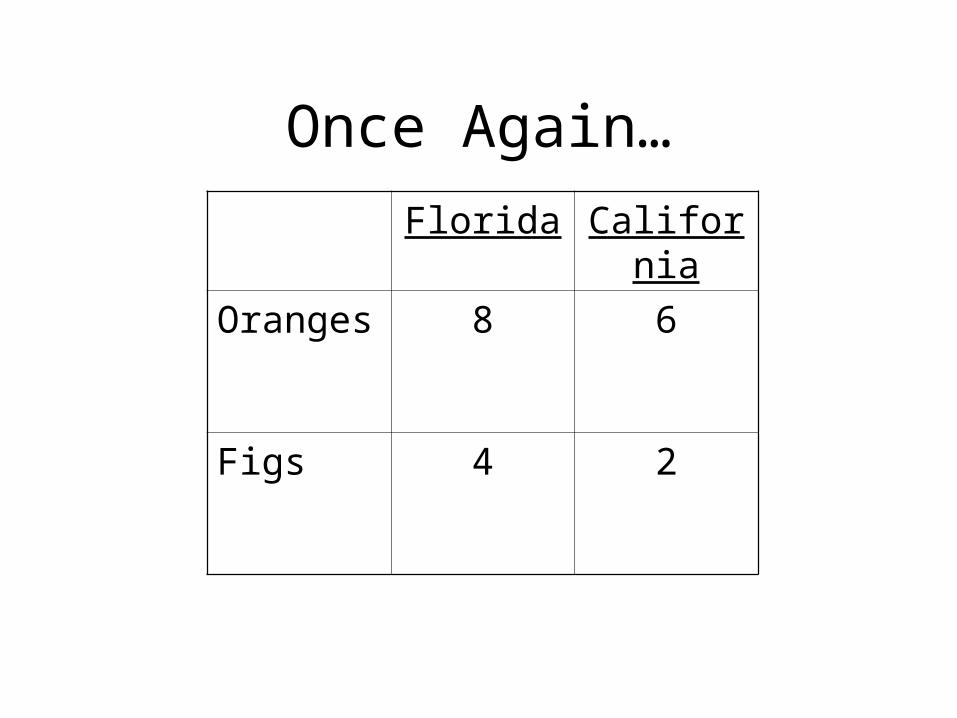
Once Again…
Florida California
Oranges 8 6
Figs 4 2
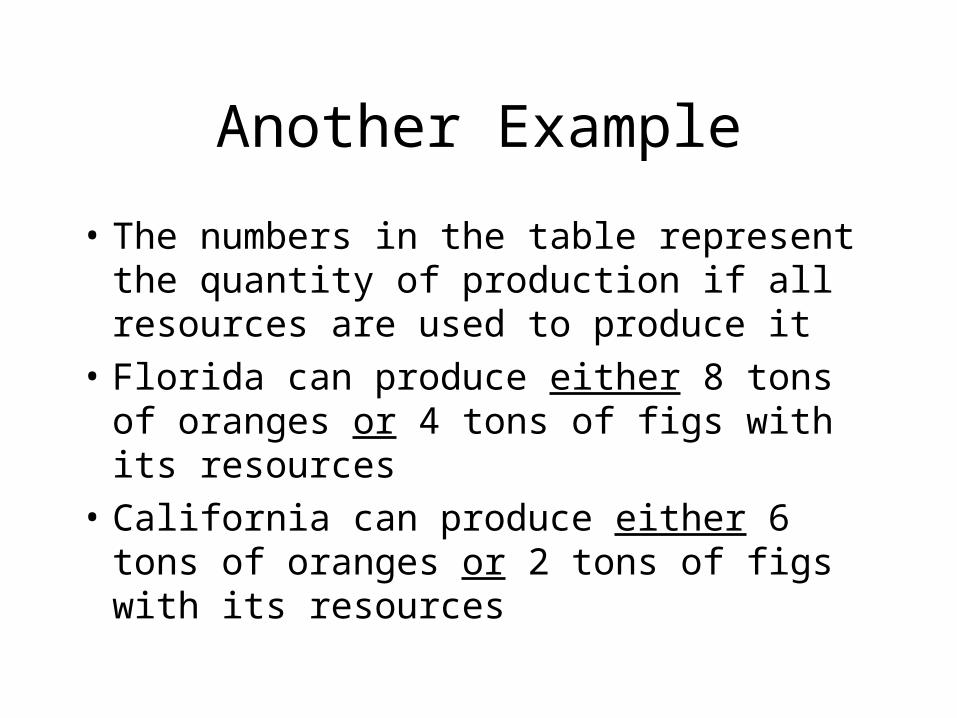
Another Example
• The numbers in the table represent the quantity of production if all resources are used to produce it
• Florida can produce either 8 tons of oranges or 4 tons of figs with its resources
• California can produce either 6 tons of oranges or 2 tons of figs with its resources
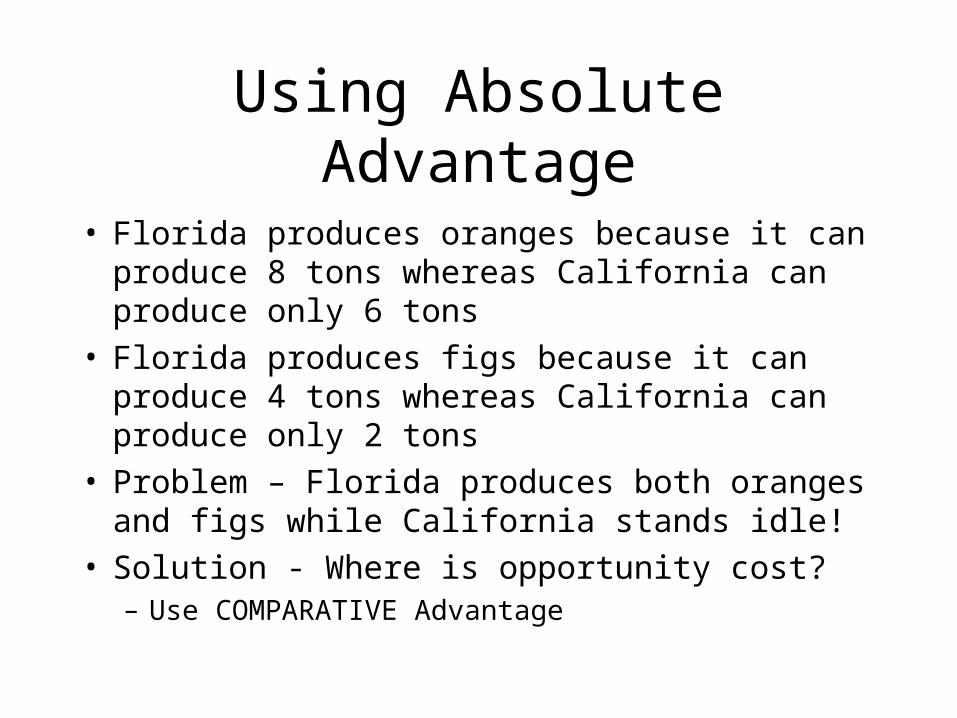
Using Absolute Advantage
• Florida produces oranges because it can produce 8 tons whereas California can produce only 6 tons
• Florida produces figs because it can produce 4 tons whereas California can produce only 2 tons
• Problem – Florida produces both oranges and figs while California stands idle!
• Solution - Where is opportunity cost?– Use COMPARATIVE Advantage
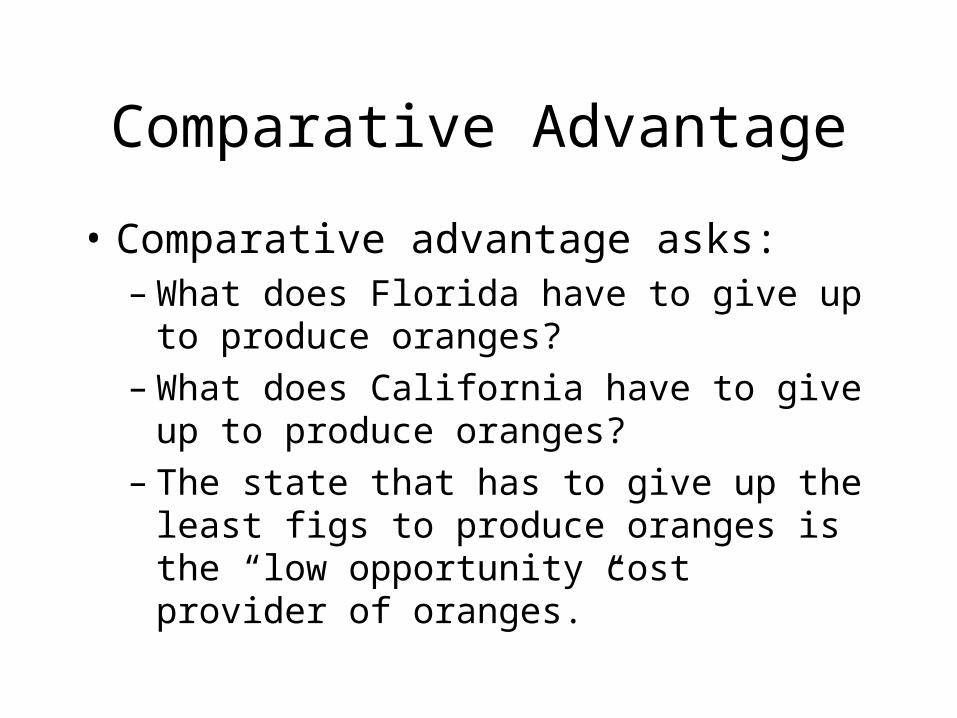
Comparative Advantage
• Comparative advantage asks:– What does Florida have to give up to produce
oranges?– What does California have to give up to
produce oranges?– The state that has to give up the least figs to
produce oranges is the “low opportunity cost provider of oranges.”
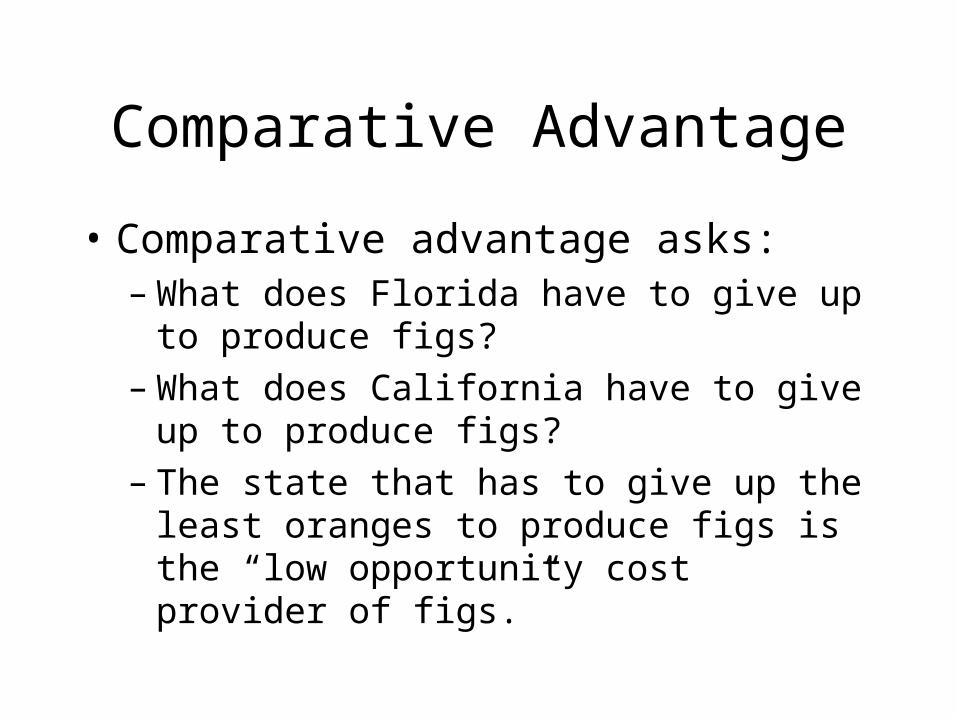
Comparative Advantage
• Comparative advantage asks:– What does Florida have to give up to produce
figs?– What does California have to give up to
produce figs?– The state that has to give up the least oranges to
produce figs is the “low opportunity cost provider of figs.”
The Law of Comparative Advantage
“Any trading entity will gain by producing the product or products in which it is the low opportunity cost producer and trading those products for goods and services in which they are high opportunity cost producers.”– By using Comparative Advantage you are never
caught with one entity producing both items and the other producing nothing
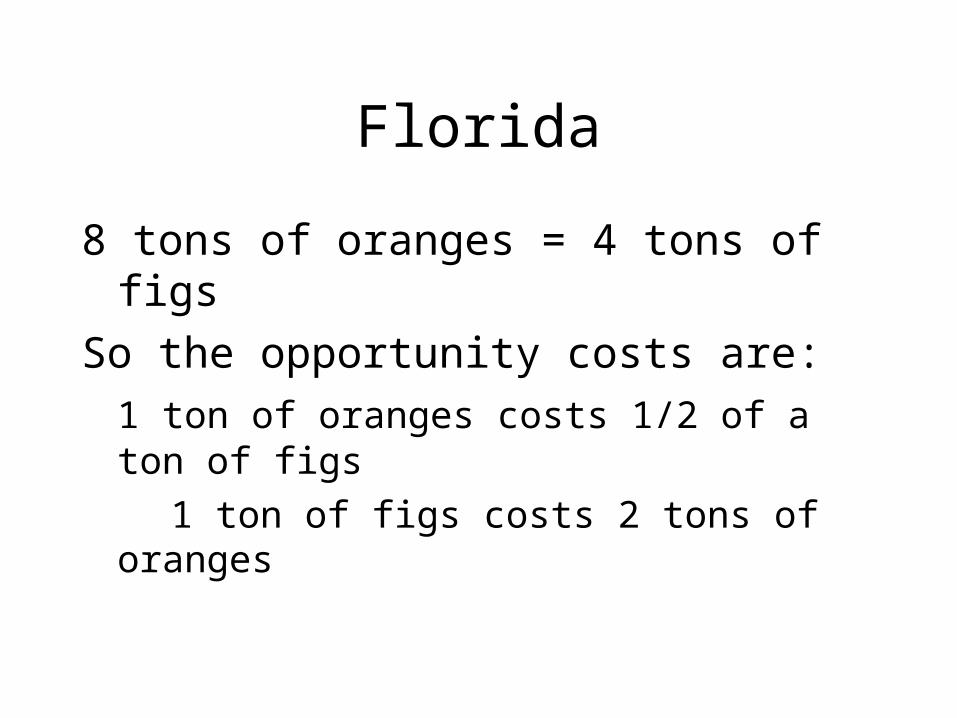
Florida
8 tons of oranges = 4 tons of figs
So the opportunity costs are:
1 ton of oranges costs 1/2 of a ton of figs
1 ton of figs costs 2 tons of oranges
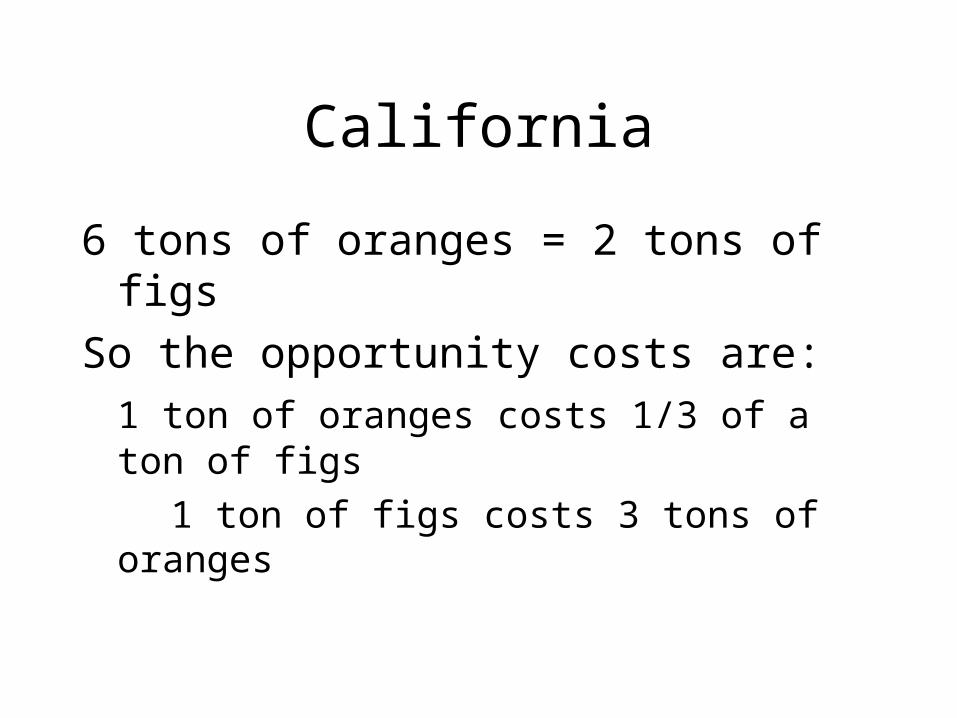
California
6 tons of oranges = 2 tons of figs
So the opportunity costs are:
1 ton of oranges costs 1/3 of a ton of figs
1 ton of figs costs 3 tons of oranges
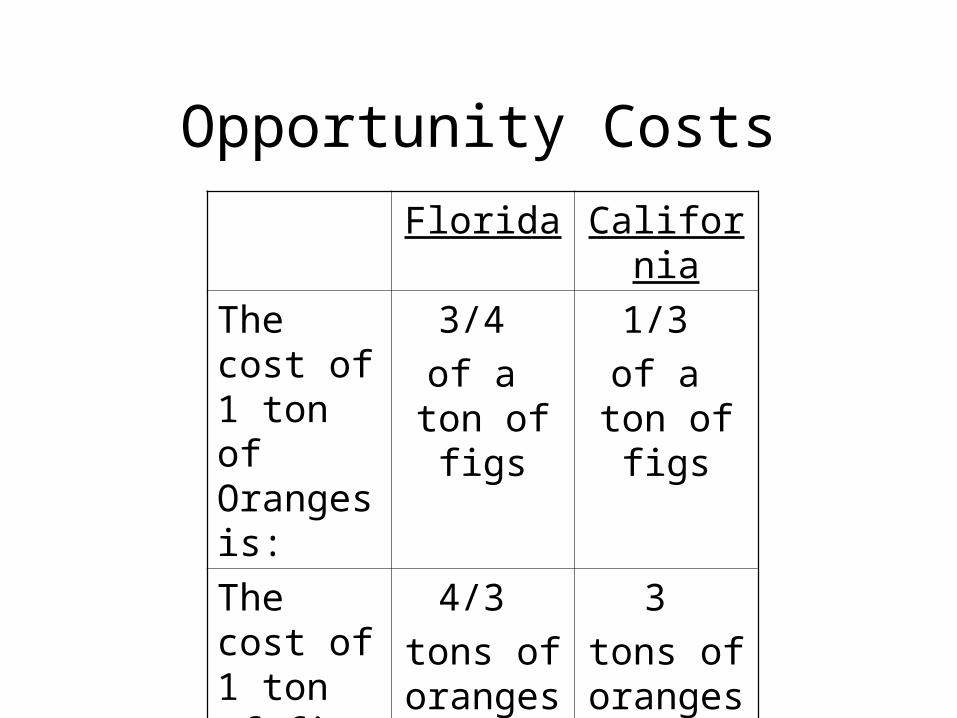
Opportunity Costs
Florida California
The cost of 1 ton of Oranges is:
3/4
of a ton of figs
1/3
of a ton of figs
The cost of 1 ton of figs is:
4/3
tons of oranges
3
tons of oranges
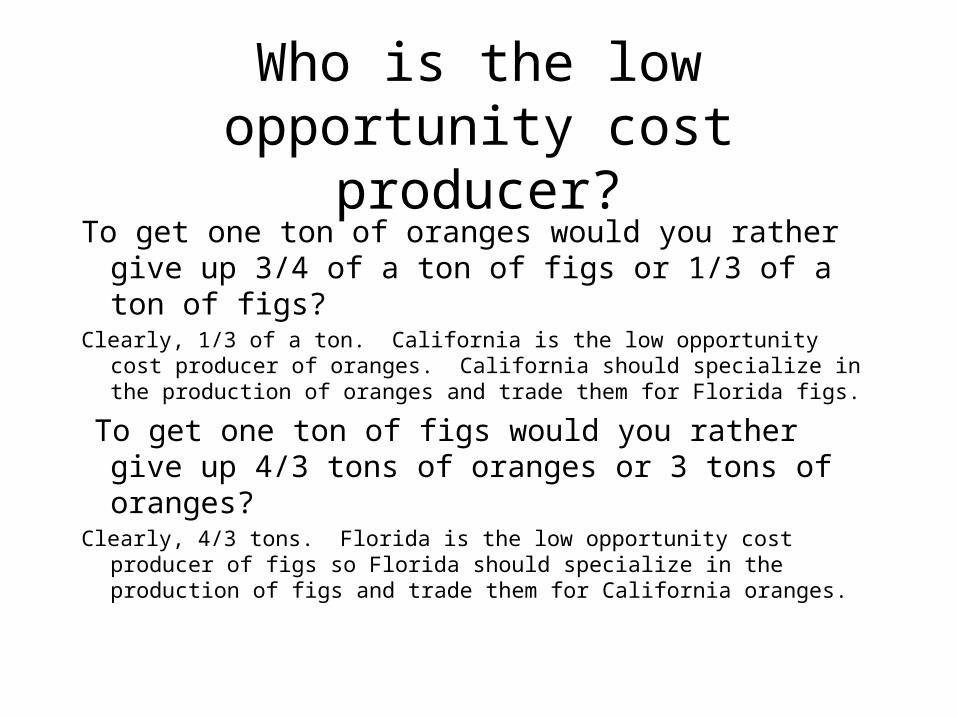
Who is the low opportunity cost producer?
To get one ton of oranges would you rather give up 3/4 of a ton of figs or 1/3 of a ton of figs?
Clearly, 1/3 of a ton. California is the low opportunity cost producer of oranges. California should specialize in the production of oranges and trade them for Florida figs.
To get one ton of figs would you rather give up 4/3 tons of oranges or 3 tons of oranges?
Clearly, 4/3 tons. Florida is the low opportunity cost producer of figs so Florida should specialize in the production of figs and trade them for California oranges.
Finale’
• The overall production in a system grows when the entities within that system produce the goods and services in which they hold comparative advantage.
• This analysis has made a number of simplifying assumptions, however, they can be relaxed one-by-one and the fundamental cost-logic of trade holds.
Finale’
• The overall production in a system grows when the entities within that system produce the goods and services in which they hold comparative advantage.
• Trading entities should then turn to other low opportunity cost producers for the goods they have high opportunity costs to produce.
• Trading parties gain economic efficiency through trade.
Then…Why do so many people oppose pursuing the gains from trade?
• It requires change and no one is protected• As a whole, the country is clearly better off for
trading in the low opportunity cost framework of comparative advantage
• However, particular groups will be made worse off if they have to compete with more efficient producers
• French Farmers• Japanese Rice Farmers• American Steel Producers
Trade restrictions
• Trade restriction are almost universally used to protect politically-influential groups– French Farmers– Japanese Rice Farmers– American Steel Producers
• Trade does occur under trade restrictions.– Politicians do the trading. They offer trade protection in exchange
for political support, campaign contributions and constituent votes.