Embed Size (px)
Citation preview
CHAPTER 111 \
Physical Properties of Sea Water
. ....*.. m. . ..*m. m. . . . . ..*... m.msm. *s...9.. *m. a**mmmm.. *me... . . . . . . . . . . . . . . . . . . . . . . . . . . . . . . . . . . . . . . . . . . . . . .
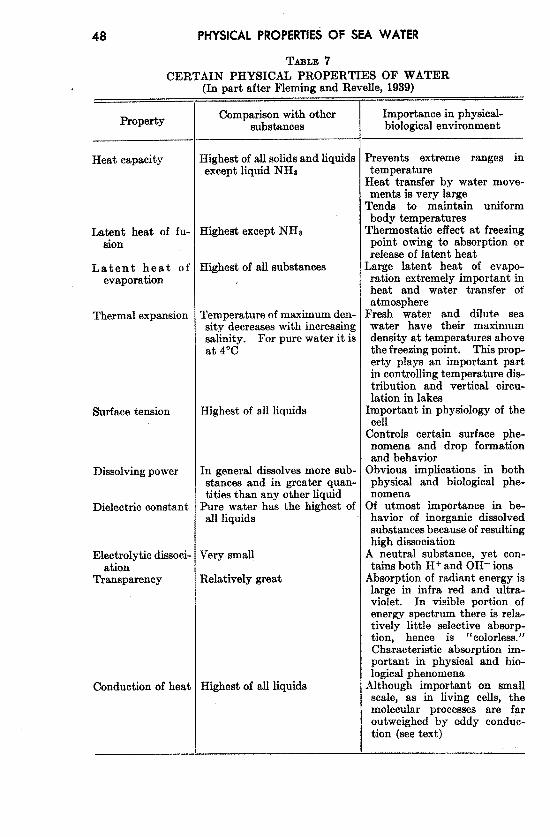
The properties of pure water are unique in comparison with those ofother liquids, and the nature of our physical environment-that is, thecharacteristics of the oceans, the atmosphere, and the land—-is in manyways dependent upon the peculiar properties of water, The “fitness”of water for the manifold needs of living organisms has been pointed outby physiologists and ecologists (for example, Henderson, 1913, Bayliss,1927). Table 7 shows some of the characteristics which are importantin this respect for both fresh water and sea water.
The unique character of water is further emphasized by the fact that,according to studies on related compounds, pure water should freezeat about —150”C and boil at —100”C. The chemical constitution ofwater offers no explanation for these anomalies and certain other devi- “ations from the theoretical properties. However, it has been found thatliquid water is not made up of individual HzO molecules but that it ispolymerized--that is, multiple groups containing one, two, or threeelementary HzO molecules may exist. These are referred to as mono-hydrol, dihydrol, and trihydrol. The relative proportions of the threeforms depend upon the temperature, the immediate past history of thewater, and other factors. The degree of polymerization decreases withincreasing temperature. The existence of the water polymers is helpfulin explaining certain of the peculiar properties of water such as the highmelting and boiling points. The degree of polymerization has beenthought to have certain physiological effects (Barnes and Jahn, 1934).
The discovery of isotopes of hydrogen and oxygen has modified ourconception of ‘fpure” water. All naturally occurring water containssmall but variable amounts of heavy hydrogen (deuterium) and heavyoxygen. These modify the density and other properties, but, since theirconcentrations are extremely small, the effect is slight. As the under-standing of this problem increases, it may become desirable to definemore exactly certain physical units that are based on the properties ofwater, such as the liter and calorie, by taking into account the isotopiccomposition of water. The amounts of the heavy isotopes vary some-what, depending upon the source of the water. Wirth, Thompson, and
47
48 PHYSICAL PROPERTIESOF SEA WATER
TABLE 7
CERTAIN PHYSICAL PROPERTIES OF WATER(In part after Fleming and Revelle, 1939)
Property
Heat capacity
Latent heat of fu-sion
Latent heat ofevaporation
Thermal expansion
Surface tension
Dissolvingpower
Dielectric constant
Electrolytic dissoci-ation
Transparency
Conduction of hea{
Comparisonwith othersubstances
Highest of all solidsand liquidsexcept liquid NHs
Highest except NHs
Highest of all substances
Temperature of maximum den-sity decreaseswith increasingsalinity. For pure water it isat 4°C
Highest of all liquids
In general dissolvesmore sub-stances and in greater quan-tities than any other liquid
Pure water has the highest ofall liquids
Very small
Relatively great
Highest of all liquids
Importance in physical-biologicalenvironment
Prevents extreme ranges intemperature
Heat transfer by water move-ments is very large
Tends to maintain uniformbody temperatures
Thermostatic effect at freezingpoint owing to absorption orrelease of latent heat
Large latent heat of evapo-ration extremely important inheat and water transfer ofatmosphere
Fresh water and dilute seawater have their maximumdensity at temperatures abovethe freezingpoint. This prop-erty plays an important partin controlling temperature dis-tribution and vertical circu-lation in lakes
Important in physiology of thecell
Controls certain surface phe-nomena and drop formationand behavior
Obvious implications in bothphysical and biological phe-nomena
Of utmost importance in be-havior of inorganic dissolvedsubstancesbecauseof resultinghigh dissociation
A neutral substance, yet con-tains both H+ and OH– ions
Absorption of radiant energy islarge in infra red and ultra-violet. In visible portion ofenergy spectrum there is rela-tively little selective absorp-tion, hence is “colorless,”Characteristic absorption im-portant in physical and bio-logical phenomena
Although important on smallscale, as in living cells, themolecular processes are faroutweighed by eddy conduc-tion (seetext)
PHYSICAL PROPERTIES,OF SEA WATER 49
Utterback (1935) found that distilled water prepared from sea-watersamples was, on the average, 1.4 X 10⁻⁶ greater in density than distilledtap water. Sea water from areas of great dilution showed a somewhatsmaller anomaly—namely, 0.2 to 0.5 X 10⁻⁶ in density. Samples fromthe depths of the ocean were higher than the average. Swartout andDole (1939) found that the density of water distilled from a sea-watersample was 1.7 X 10⁻⁶ greater than that prepared from Lake Michiganwater. They also found that the ratio between hydrogen and deuteriumin sea water was about 7000:1. Rain water, and consequently freshwater, has a lower proportion of the heavy isotopes than sea water, sincea certain fractionation takes place in the process of evaporation. Thefield of isotope study is relatively new, and as yet little is known aboutthe distribution or significance of the isotopes. Their variability isapparently rather small and consequently will not significantly affectthe magnitude of the properties to be discussed.
Information as to the physical properties of distilled water is found incomprehensive handbooks (for example, Dorsey, 1940) or in the Inter-national Critical Tables. A number of these physical properties dependupon two variables, temperatureand pressure,but in the case of sea watera third variable has to be considered; namely, the salinity of the water,which will be defined and discussedbelow. Some of the properties, suchas compressibility, thermal expansion, and refractive index, are onlyslightly altered by the presence of dissolved salts, but other propertiesthat are constant in the case of distilled water, such as freezing pointand temperature of maximum density, are dependent on salinity in thecase of sea water. Furthermore, the presence of dissolved salts adds afew new characteristicsto sea water, such as osmotic pressure. Generalsurveys of the physical properties of sea water have been given byKriimmel (1907), Matthews (1923), Harvey (1928), Johnstone (1928),and Thompson (1932),
Another important aspect of the physical characteristics that has tobe considered when dealing with water as it occurs in nature, regardlessof whether fresh water or sea water is concerned, is that several importantprocesses are greatly modified by the presence of minute suspendedparticles or by the state of motion. Thus, the absorption of light inlakes or in the sea is entirely different from the absorption of light indistilled water or in “pure” sea water, because the waters encounteredin nature always contain suspended matter that causes increased scatter-ing of the light and consequently increased absorption in layers of similarthickness. The processes of heat conduction, chemical diffusion, andtransfer of momentum from one layer to another are so completelyaltered in moving water that, for water under ‘natural conditions, thecoefficients which have been determined under laboratory conditionsmust be replaced by corresponding “eddy” coefficients that depend
50 PHYSICAL PROPERTIESOF SEA WATER
upon the presence of eddies. Some of the physical properties of seawater, therefore, depend only upon the three variables, temperature,salinity, and pressure, which can all be determined with great accuracy,whereas others depend upon such variables as amount of suspendedmatter or character of motion, which at present cannot be accuratelydetermined. Before turning to a discussion of the physical propertiesand their relations to these variables, we shall discuss the salinity of thesea water.
Salinity and Chlorinity
In the chapter on chemical oceanography the composition of thedksolved constituents in sea water is considered in detail. Our presentinterest is only in the more abundant substances whose concentrationwill affect the physical properties. It has been found that, regardless ofthe absolute concentration, the relative proportions of the dijFerent majorconstituents are virtuallp constant, except in regions of high dilution (lowsalinity), where minor deviations may occur. From this rule it followsthat any one of the major constituents may be used as a measure of theothers and of the total amount of salt, and that water sampleshaving thesame total salt content, regardlessof their source, are virtually identicalin their physical properties.
Owing to the complexity of sea water, it is impossible by directchemical analysis to determine the total quantity of dhsolved solids in agiven sample. Furthermore, it is impossible to obtain reproducibleresults by evaporating sea water to dryness and weighing the residue,because certain of the materials present, chiefly chloride, are lost in thelast stages of drying. These difficulties can be avoided by following atechnique yieldlng reproducible results which, although they do notrepresent the total quantity of dissolved solids, do represent a quantityof slightly smallernumericalvalue that is closely related and by definitionis called the salinity of the water. This technique was established by anInternational Commission (Forth, Knudsen, and Sorensen, 1902), andon the basis of its work the salinity is defined as the total amount of solidmaterial in grams contained in one kilogram of sea water when all thecarbonate has been converted to oxide, the bromine and iodine replaced bychlorine, and all organic matter completely oxidized.
The determination of salinity by the method of the InternationalCommission is rarely if ever carried out at the present time because itis too difficult and slow, but, owing to the constant composition of thedissolved solids, the determination of any of the- elements present inrelatively large quantity can be used as a measure of the other elementsand of the salinity. Chloride ions make up approximately 55 per centof the dissolved solids and can be determined with ease and accuracy bytitration with silver nitrate, using potassium chromate as indicator.
PHYSICAL PROPERTIESOF WA WATER
The empirical relationship between salinity and chlorinity,by the International Commission, is
Salinity = 0.03 + 1.805 X Chlorinity.
51
as established
The chlorinity that appears in this equation is also a dejinedquantity anddoes not represent the actual amount of chlorine in a sample of sea water.Both salinity and chlorinity are always expressed in grams per kilogramof sea water—that is, in parts per thousand, or per mine, for which thesymbol ‘/00 is used.
CHLORINITY. In the titration with silver nitrate, bromides andiodides are precipitated together with the chlorides, but in the compu-tation it is assumed that they are chlorides. Chlorinity was thereforeoriginally defined as the total amount of chlorine, bromine, and iodine ingrams contained in one kilogram of sea water, assuming that the bromineand the iodine had been replaced bg chlorine. This definition introduces achlorine-equivalent that is dependent upon the atomic weights used inpreparing the standard solutions. Since the time of the work of theInternational Commission, there have been changes in the atomic weights,and the relation between salinity and chlorinity as defined above is nolonger strictly true. In order to retain this relationship and to avoidapparent changes in the chlorinity of sea water it has fortunately beenpossible to redefine chlorinity so that it is independent of changes inatomic weights.
The primary standard used in the determination of chlorinity isso+alled “Normal Water” (Eau de nzer normale), prepared by theHydrographical Laboratories in Copenhagen, Denmark, and distributedto all oceanographic institutions. Some of these institutions made theirown secondary standarda by means of the Normal Water. As a resultof world conditions the preparation of Normal Water has temporarilybeen taken over by the Woods Hole Oceanographic Institution.
Normal Water is sea water whose chlorinity has been adjusted toabout 19.4 */00 and accurately determined by either direct or indirectcomparisons with the original standard prepared in 1902. Hence, thechlorinitiesof all batches have been independent of changes in the atomicweights. A new primary standard (Urnormal-1937), prepared in 1937,will be used to establish the chlorinity of future batches of NormalWater for general distribution (Jacobsen and Knudsen, “1940). Com-parison with earlier series of Normal Water showed the chlorinity of thenew standard to be 19.381 O/OO.As a more absolute method should beavailable with which to check future Normal Water preparations, the1937 primary standard was analyzed, using extremely pure “atomicweight silver,” The equivalent amount of silver necessary to precipitatethe halides was determined and the ratio of chlorinity to silver wasfound to be 0,3285233. On this basis a new definition of chlorinity was
52 PHYSICAL PROPERTIESOF SEA WATER
introduced: The number giving the chlorinity in grams per kilogram of asea-water sample is identical with the number giving the mass in grams oj“atomic weight silver” just necessary to precipitate the halogens in 0.3!285233kilogram of the sea-water sample. By this redefinition the chlorinity hasbeen made independent of changes in atomic weights, whereas thechlorine-equivalent, for which the original definition is retained, may varyslightly as the atomic weights are modified. The empirically establishedrelationship between chlorinity and salinity (p. 51) remains valid and,according to the new definition of chlorinity, will never be affected bymodification of the atomic weights.
The ratio of chlorine to silver, using the 1940 atomic weights (Ag =107.880 and Cl = 35.457), is 0.3286707. Hence the ratio of chlorine-equivalent to the chlorinity is:
0,32867070.3285233
= 1.00045.
This ratio is important when computing the chemical composition of seawater of given chlorinity, as the chlorine-equivalent will be greater thanthe indicated chlorinity. It must also be taken into account whenpreparing standard chloride solutions or when direct gravimetric analysesare made to determine the halide content of sea water. It is of interestto see how closely this ratio corresponds to the change which could beexpected from the modification of the atomic weights. According toJacobsen and Knudsen (1940) the indicated chlorinity of the NormalWater should be increased by 0.0094 0/00 to take this modification intoaccount. Thk procedure gives a ratio between chlorine-equivalent andchlorinity of 1.000485, which is in good agreement with that given above.
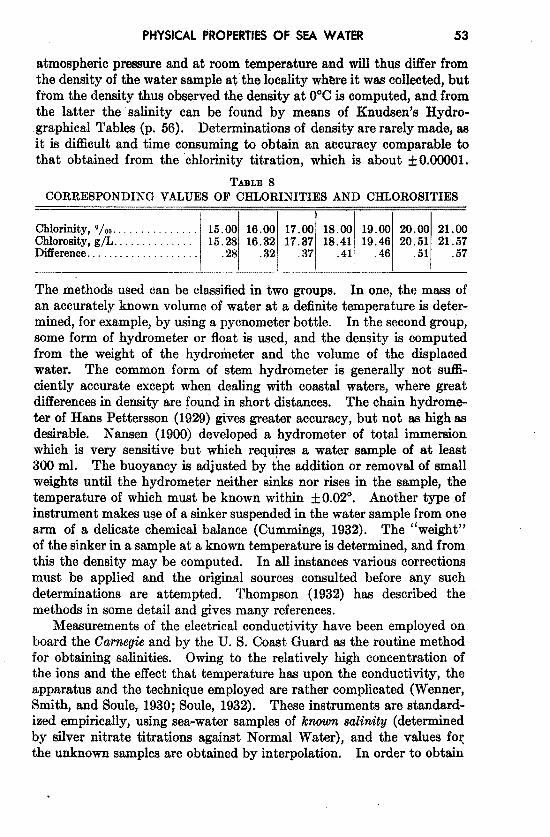
When dealing with the chemistry of sea water, other substances aregenerally determined and reported on a volume basis, wherefore it isconvenient to introduce chtorosity (Cl) (Intern. Assn. Phys. Oceanogr.,1939), which is the property corresponding to the chlorinity expressedas grams per 200-liter (p. 169). Chlorosity is obtained by multiplyingthe chlorinity of a water sample by its density at 20°. Table 8 gives thecorresponding values of chlorosity for chlorinities between 15.00 and21,00 o/o@
METHODS FOROBTAININGSALINITY,OTHERTHANTITRATIONWITHSILVERNITRATE. The salinity can also be determined from the densityof a water sample at a given temperature or by measuring either theelectrical conductivity or the refractive index, both of which depend uponthe salinity. The character of these properties will be dealt with below,but their application to salinity determinations will be briefly discussedhere.
Determinations of density are appropriately included under methodsfor obtaining salinity, because such determinations are generally made at
PHYSICAL PROPERTIESOF SEA WATER 53
atmospheric pressure and at room temperature and will thus dxfferfromthe density of the water sample at the locality whare it was collected, butfrom the density thus observed the density at O°Cis computed, and fromthe latter the’ salinity can be found by means of Knudsen’s 13ydro-graphical Tables (p. 56). Determinations of density are rarely made, aait is difficult and time consuming to obtain an accuracy comparable tothat obtained from the “chlorinity titration, which is about +0,00001.
TABLE8CORRESPONDING VALUES OF CHLORINITIES AND CHLOROSITIES
Chlorinity, 0/00. . . . . . . . . . . . . . . 15.00 16.00 17.00 18.00 19.00 20.00 21.00Chlorosity, g/L . . . . . . . . . . . . . . 15.28 16.32 17.37 18.41 19.46 20.51 21.57Difference. . . . . . . . . . . . . . . . . . . . .28 .32 .37 .41 .46 .51 .57
The methods used can be classifiedin two groups. In one, the mass ofan accurately known volume of water at a definite temperature is deter-mined, for example, by using a pycnometer bottle. In the second group,some form of hydrometer or float is used, and the density is computedfrom the weight of the hydrometer and the volume of the displacedwater. The common form of stem hydrometer is generally not suffi-ciently accurate except when dealing with cotwtal waters, where greatdifferences in density are found in short distances. The chain hydrome-ter of Hans Pettersson (1929) gives greater accuracy, but not as high asdesirable. Nansen (1900) developed a hydrometer of total immersionwhich is very sensitive but which requires a water sample of at least300 ml. The buoyancy is adjusted by the addition or removal of smallweights until the hydrometer neither sinks nor rises in the sample, thetemperature of which must be known within k 0.02”, Another type .ofinstrument makes use of a sinkersuspended in the water sample from onearm of a delicate chemical balance (Cummings, 1932). The “weight”of the sinkerin a sample at a known temperatureis determined, and fromthis the density may be computed. In all instances various correctionsmust be applied and the original sources consulted before any suchdeterminations are attempted. Thompson (1932) has described themethods in some detail and gives many references.
Measurements of the electrical conductivity have been employed onboard the Carnegieand by the U. S. Coast Guard as the routine methodfor obtaining salinities. Owing to the relatively high concentration ofthe ions and the effect that temperature has upon the conductivity, theapparatus and the technique employed are rather complicated (Wenner,Smith, and Soule, 1930; Soule, 1932). These instruments are standard-ized empirically, using sea-water samples of known salinity (determinedby silver nitrate titrations against Normal Water), and the values foxthe unknown samples are obtained by interpolation. In order to obtain
.
54 PHYSICAL PROPERTIESOF SEA WATER
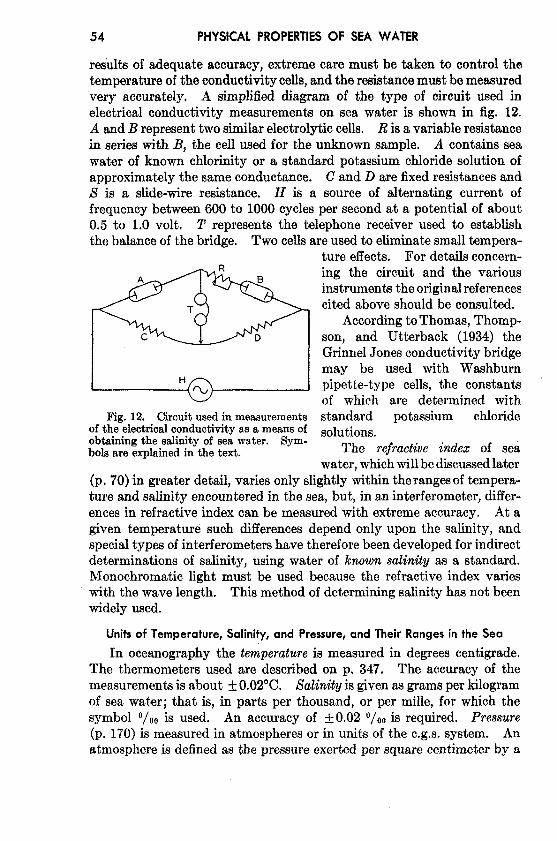
results of adequate accuracy, extreme care must be taken to control thetemperatureof the conductivity cells,and the resistancemust be measuredvery accurately. A simplified diagram of the type of circuit used inelectrical conductivity measurements on sea water is shown in fig. 12.A and B representtwo similarelectrolytic cells. B is a variable resistancein series with B, the cell used for the unknown sample, A. contains seawater of known chlorinity or a standard potassium chloride solution ofapproximately the same conductance. C and D are fixed resistancesandS is a slide-wire resistance. H is a source of alternating current offrequency between 600 to 1000 cycles per second at a potential of about0.5 to 1.0 volt. T represents the telephone receiver used to establishthe balance of the bridge. TWOcellsare used to eliminatesmall tempera-
A
1 HI
Fig. 12. Circuit wed in measurementsof the electrical conductivity as a means ofobtaining the salinity of sea water. Sym-bols are explained in the text.
ture effects. For details concern-ing the circuit and the variousinstrumentsthe originalreferencescited above should be consulted.
According to Thomas, Thomp-son, and Utterback (1934) theGrinnelJones conductivity bridgemay be used with Washburnpipette-type cells, the constantsof which are determined withstandard potassium chloridesolutions.
The refractive index of se~water.whichwill be d~cussed later
(p. 70) in greater detail, varies only slightly within therangesof tempera-ture and salinity encountered in the sea, but, in an interferometer, differ-ences in refractive index can be measured with extreme accuracy. At agiven temperature such differences depend only upon the salinity, andspecial types of interferometershave therefore been developed for indirectdeterminations of salinity, using water of known saiinit~ as a standard.Monochromatic light must be used because the refractive index varieswith the wave length. This method of determining salinity has not beenwidely used.
Units of Temperature, Salinity, and Pressure, and Their Ranges in the Sea
In oceanography the te~perature is measured in degrees centigrade.The thermometers used are described on p, 347, The accuracy of themeasurementsis about ~ 0.02°C. fkzhkit~ is given as gramsper kilogramof sea water; that is, in parts per thousand, or per mine, for which thesymbol ‘/00 is used. An accuracy of f 0.02 0/00is required. Pressure(p. 170) is measured in atmospheresor in units of the c.g,s. system. Anatmosphere is defined as the pressureexerted per square centimeter by a
PHYSICAL PROPERTIESOF SEA WATER 55
column of mercury 760 mm high at a temperature of O°C, where theacceleration of gravity is 980.665 cm/secz. In chemical oceanography arelatedunit, the Torr, is used which equals the pressureexerted per square
‘ centimeter by a column of mercury 1 mm high at a temperature of O°Cand at the above-mentioned acceleration of gravity. The c.g.s. unit ofpressure is dyne/cm2, and 1 atmosphere = 1.0133 X 10s dynes/cm2.One million dynes/cm2 was designated as 1 bar by V. 13jerknes. Thecorresponding practical unit used in physical oceanography is 1 decibar$which equals 0,1 bar. The pressure exerted per square centimeter by1 m of sea water very nearly equals 1 decibar; that is, the hydrostaticpressure in the sea increasesby 1 decibar for approximately every meterof depth. Therefore, the depth ifi meters and the pressure in deciba?’%areexpressed bg nsarlg the same numerical value. This rule is sufficientlyaccurate for determining the effect of pressure on the physical propertiesof the water, but details of the pressure dktribution must be computedfrom the density distribution (p. 408).
In the oceans the temperature ranges from about –2° to +30”C.The lower limit is determined by the formation of ice, and the upperlimit is determined by processes of radiation and exchange of heat with .the atmosphere (p. 127). In landlocked areas the surface temperaturemay be higher, but in the open ocean it rarely exceeds 30*C.
The salinity in the oceans is generally between 33 0/00 and 37 O/OO.
The surface salinity in high latitudes, in regions of high rainfall, or wherethere is dilution by rivers may be considerably less, and in certain semi-enclosed areas, such as the Gulf of Bottila, the salinity may approachzero. In isolated seas in intermediate latitudes, such as the Red Sea,where evaporation is excessive, salinitiesmay reach 40 O/OO or more. Asthe range in the open oceans is rather small, it is sometimes convenientto use a salinity of 35 O/.Om an average for all oceans. In the chapteron the chemistry of sea water the tabulations are made for water of19.00 0/00 chlorinity; that is, 34.325 0/00 salinity.
In dealing with the pressure in the oceans, the atmospheric pressureis always neglected and the pressure at the sea surface is entered aszero. Since the pressure is essentially a function of depth and thenumerical value in decibars nearly equals the depth in meters, the rangein pressure will be from zero at the sea surface to over 10,000 decibarsin the deepest part of the ocean.
Owing to the character of the distribution .of temperature and salinityin the oceans, some relationships exist between these conditions and thepressure. The temperature of the deep and bottom water of the oceansis always low, varying between 4° and - 1°(3, so that high pressuresaremsociated with low temperatures. Similarly, the salinity of deep andbottom water varies within narrow limits, 34.6 0/00 to 35 O/OO, and highpressures are therefore associated with salinities between these limits.
56 PHYSICAL PROPERTIESOF SEA WATER
Exceptions are found in isolated seas in intermediate latitudes, such asthe Mediterranean and Red Seas, where water of high temperature andhigh salinity is found at great depths, and hence under great pressure.
Density of Sea Water
The density of any substance is defined as the mass per unit volume.Thus, in the c.g.s. system, density is stated in grams per cubic centimeter.The specific gravity is defined asthe ratio of the density to that of distilledwater at a given temperature and under atmospheric pressure. In thec.g.s. system the density of distilled water at 4°C is equal to unity. Inoceanography, specific gravities are now always referred to distilledwater at 4°C and are therefore numerically identical with densities.In oceanography the term density is generally used, although, strictlyspeaking, specific gravity is always considered.
The density of sea water depends upon three variables: temperature,salinity, and pressure. These are indicated by designating the densityby the symbol p,,~,P,but, when dealing with numerical values, space issaved by introducing cr,,~,~, which is defined in the following manner:
U.,$,p= (p,,$,p — 1)1000.
Thus, if P,,o,P = 1.02575, ua,o,P = 25.75.The density of a sea-water sample at the temperature and pressure at
which is was collected, p,,@,P,is called the density in situ, and is generallyexpressed as U*,O,P. At atmospheric pressure and temperature O“C, thecorresponding quantity is simply written at, and at 0° it is written Co.The symbol 8 will be used for temperature except when writing cr~,where,following common practice, tstands for temperature.
At atmospheric pressure and at temperature of O°C the densityis a function of the salinity only, or, as a simple relationship existsbetween salinity and chlorinity, the density can be considered a functionof chlorinity. The International Commission, which determined therelation between salinity and chlorinity and developed the standardtechnique for determinations of chlorinity by titration, also determinedthe density of sea water at 0° with a high degree of accuracy, usingpycnometers. From these determinationsthe following relation betweenUOand chlorinity was derived:
Uo= –0.069 + 1.4708 Cl – 0.001570 Cl’ + 0.0000398 Cl$.
Corresponding values of cO,chlorinity, and salinity are given in Knudsen’sHydrographlcal Tables for each 0.01 ‘J/OoCl.
In order to find the density of sea water at other temperatures andpressures, the effects of thermal expansion and compressibility on thedensity must be known. The coefficient of thermal expansion hasbeen determined in the laboratory under atmospheric pressure, and
PHYSICAL PROPERTIESOF SEA WATER 57
according to these determinationsthe density under atmospheric pressureand at temperature 8° can be written in the form
U# = U(l – D.
The quantity D is expressed as a complicated function of aO and tem-perature, and is tabulated in Knudsen’s Hydrographical Tables. Sincethe values of u~are widely used in dynamical oceanography, tables forcomputing at directly from temperature and salinity have been preparedby McEwen (1929) and Matthews (1932). A special slide rule for thesame purpose has been devised by Sund (1929). Knudsen’s tables alsocontain a tabulation of D as a function of UIand temperature, by meansof which co can be found if u~is known (ao = at + D). This table isuseful for obtaining the salinity of a water sample the density of whichhas been directly determined at some known temperature (p. 53).
The effect on the density of the compressibility of sea water ofdifferent salinities and at different temperatures and pressures wasexamined by Ekman (1908), who established a complicated empiricalformula for the mean compressibility between pressuresOand p decibars(quoted in V. Bjerknes and Sandstrom, 1910). From this formula,correction ~erms have been computed which, added to the value of ut,give the corresponding value u.,~,~for any value of pressure.
COMPUTATIONOFDENSITYANDSPECIFICVOLUMEIN SITU. Tablesfrom which the density in situ, p.,~,,, could be obtained directly from thetemperature, salinity, and pressure with sufficiently close intervals inthe three variables would fill many large volumes, but by means ofvarious artifices convenient tables have been prepared. Following theprocedure of Bjerknes and Sandstrom (1910), one can write
The first four terms can be expressed by u,, which can readily bedetermined by the methods outlined above, and the remaining termsrepresent the effects of the compressibility. When dealing with densityit is desirable,for reasonsthat will be explained later (p. 402), to introducethe dynamic depth, D, as the independent variable instead of the pressure,p, and to write
p.,t9,D = 1 + lo–8u# + ED + 6,,D + @,D + 6,$,D.
The c terms in this equation have been tabulated by Bjerknes andSandstrom (1910) and by Hesselberg and Sverdrup (1914).
Instead of the density, P,,a,p,its reciprocal value, the specific volumein situ, a~,~,pis generally used in dynamic oceanography. In order toavoid writing a large number of decimals, the specific volume is commonlyexpressed as an anomaly, 8, defined in the following way:
d = a* ,*,p - Wirl,o,p,
58 PHYSICAL PROPERTIESOF SEA WATER
where CYM,O,P is the specific volume of water of salinity 35 0/00, at O°C,andat pressure p in decibars. The anomaly depends on the temperature,salinity, and pressure, and hence can be expressed as
8 = & + 68 + 8.,!?+ ih,p+ &9,p+ ii,19,f?.
It should be observed that the anomaly, by definition, does not containa term ~P,which would represent the effect of pressureat temperature 0°and salinity 35 O/OO.The reason for this is explained on page 409. Ofthe above terms the last one, &,Afl,is so small that it can always beneglected. Thus, five terms are needed for obtaining ~, and these weretabulated by Bjerknes and Sandstrom. If c, has already been computed,the terms that are independent of pressure can be combined as Q(Sverdrup, 1933).
The value of A,,~ = 6, + 68 + 8.,s is easily obtained from ULbecause
11 Io-%tQ!8,8,1J= — = —
/J8,L9,0 1 + lo–%tand
a*,o,o = CWo, o + AS,*= 0.97264 + A,,o.Hence
Thus, in practice,8 = A,,~ + 6,,P+ &,P.
The values for these three terms are given in the appendix in smalltables from which one can obtain the specific volume anomaly in situofany water sample when its temperature, salinity, at, and the pressureare known. In these tables the terms are entered with one extra decimalplace in order to avoid any accumulation of errors due to rounding-offof figures, and also in order to facilitate preparation of exact graphs thatmay be used instead of the tabulation, or for the preparation of tables inwhich the arguments are entered at such olose intervals that interpolationbecomes easy or unnecessary.
The procedure that is followed in calculating the density or specificvolume in situ can be summarized as follows. For a given water samplethe temperature, salinity, and depth at which it was collected must beknown. For reasonsstated elsewhereit can be assumedthat the numeri-cal value of the pressure in decibars is the same as that of the depth inmeters. From the temperature and salinity the value of a, is obtainedfrom Knudsen’s Tables or from graphs or tables prepared from thissource, (McEwen, 1929; Matthews, 1932). With the values of u~,temperature, salinity, and pressure the specific volume anomaly iscomputed by means of the tables given in the appendix. If the absolutevalue of the specific volume is required, the anomaly must be added to
PHYSICAL PROPERTIESOF SEA WATER 59
the appropriate value of mi,o,p given in the appendix. In this table aregiven the specific volume of water of 35 ‘/00 and 0° at various pressuresin decibars. The absolute density in situcan then be obtained as thereciprocal of the specific volume.
Another set of tables for computing the specific volume in situ hasbeen prepared by Matthews (1938), who, in our notations, defines theanomaly as # = a~,o,~- aS4.W,0,m. Thus, he refers the anomalies towater of salinity 34.85 ‘/00, for which co = 28.00. The difference,13– 6’ = a~4.8b,0,P– a~5,0,P,depends upon the pressure:
Pressure, decibars. . . . . . . . . . . . . . . . . 0 2000 4000 Oooo sooo 10,OOO(a-a’ )xlo’, . . . . . . . . . . . . . . . . . . 12.0 11<5 11.1 10.7 10.4 10.1
Before comparing numerical values of the specific volume anomaliespublished in different reports, it is necessary to know on what tablesthe reported values are based.
USE OF KNUDSEN’SHYDROGRAPHICALTABLES. A certain pointconcerning the use of Knudsen’s Hydrographical Tables should be keptin mind. Although they have been shown to hold very well over thenormal range of the concentration of sea water, they are not necessarilyvalid for highly diluted or concentrated sea water. The tables are basedon the careful examination of a series of samples collected from variousregions. The dilute samples used were taken in the Baltic Sea, whereddution sometimes reduces the chlorinity to about 10/00, and where theriver water that is mainly responsible for the dilution contains relativelylarge quantities of dissolved solids. This is shown by the fact that theequation relating salinity to chlorinity shows,a salinity of 0.03 0/00 for
zero chlorinity, and according to Lyman and Fleming (1940) the totaldissolved solids corresponding to this figure are probably of the order of0.07 O/oo. Thus, empirically, the salinity of sea water can be expressedby an equation of the type
S=a+b cl,
where the numerical value of a depends upon the composition of thediluted samples used for establishing the relation, If 1 kg of water ofhigh salinity, S, is diluted by adding n kilograms of distilledwater, thesalinity of the dilution will be SD = S/ (n + 1) ~ and the ChlOrinity Of
the diluted sample will be Cl/(n + 1). According to Knudsen’s Tablesthis sample, however, has a salinity SK = a + b Cl/(n + 1). Thedifference between this and the true salinity is SK – SD = a[n/(n + 1)1,meaning that, if after dilution the chlorinity were determined by titrationand the salinity were taken from Knudsen’s Tables, it would be too high.Knudsen’s Tables would therefore also give too great a density. As anexample, let us assumethat 1 kg of water of salinity 35 ‘/oo and chlorinity19.375 o/00 is diluted by adding 9 kg of distilled water, reducing the
60 PHYSICAL PROPERTIESOF SEA WATER
chlorinity to 1.938 O/OO. Knudsen’s Tables give for this chlorinity asalinity of 3.53 0/00, whereas the “true” salinity would be 3.50 O/OO.
Similarly, Knudsen’s Tables would give a co equal to 2.78, whereas thetrue value should be 2.75. At low concentration, chlorinities computedfrom direct density determinations, and vice versa, may therefore be inerror. For example, “ chlorinities” of sea ice computed from densitymeasurements made on the melt water were consistently smaller thanthose determined by titration (p. 219), and in this case the dflutingwater was essentially distilled water. The restricted application of theCl: S: density relations to highly diluted water occurring naturally orprepared in the laboratory should always be kept in mind.
Thermal Properties of Sea Water
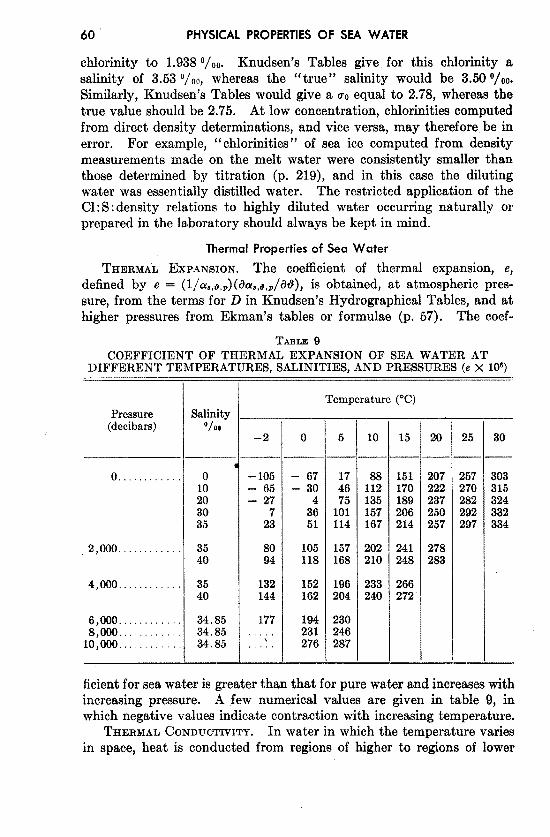
THERMAL EXPANSION. The coefficient of thermal expansion, e,defined by e = (l/CG,O,P)(&,~,p/&?), is obtained, at atmospheric pres-sure, from the terms for D in Knudsen’s Hydrographical Tables, and athigher pressures from Ekman’s tables or formulae (p. 57). The coef-
TABLm9COEFFICIENT OF THERMAL EXPANSION OF SEA WATER AT
DIFFERENT TEMPERATURES, SALINITIES, AND PRESSURES (e X 10s)
Pressure(decibars)
0. . . . . . . . . . .
. 2,000 . . . . . . . . . . .
4,000 . . . . . . . . . . .
6,000 . . . . . . . . . .8,000 . . . . . . . . . . .
10,000. . . . . . . . . . .
Salinity‘/0,
o
E3035
3540
3540
34.8584.8534.85
–2
– 105- 65- 27
723
8094
132144
177
\. .
Temperature (“C)
o
– 67– 30
3:51
105118
152162
194231276
5
174675
101114
157168
196204
230246287—
10
88112135157167
202210
233240
15
151170189206214
241248
266272
20 25
207222237250257
278283
—
257270282292297
30
303315324332334
ficient for sea water is greater than that for pure water and increaseswithincreasing pressure. A few numerical values are given in table 9, inwhich negative values indicate contraction with increasing temperature.
THERMALCONDUCTIVITY. In water in which the temperature variesin space, heat is conducted from regions of higher to regions of lower
PHYSICAL PROPERTIESOF SEA WATER 61
temperature. The amount of heat in gram calories per second which isconducted through a surface of area 1 cm2 is proportional to the changein temperature per centimeter along a line normal to that surface, andthe coefficient of proportionality, ~, is called the coefficient of thermalconductivity (dQ/dt = - y d@/dn). For pure water at 15°C the coef-ficient is equal to 1.39 X 10⁻³. The coefficient is somewhat smaller forsea water and increaseswith increasing temperature and pressure. Thiscoefficient is valid, however, only if the water is at rest or in Iaminarmotion (p. 89), but in the oceans the water is nearly always in a state ofturbulent motion in w~ch the processes of heat transfer are completelyaltered. In thesecircumstancesthe above coefficientof heat conductivitymust be replaced by an ‘{eddy” coefficient which is many times largerand which depends so much upon the state of motion that effects oftemperature and pressure can be disregarded (p. 91).
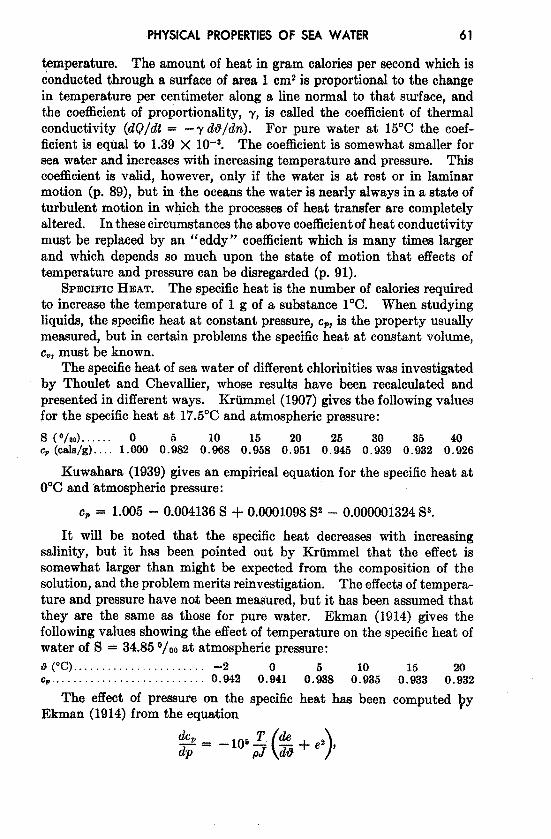
SPECIFICHEAT. The specific heat is the number of calories requiredto increase the temperature of 1 g of a substance 1°C, When studyingliquids, the specific heat at constant pressure, Cp,is the property usuallymeasured, but in certain problems the specific heat at constant volume,cV,must be known.
The specific heat of sea water of different chlor.kities was investigatedby Thoulet and Chevalier, whose results have been recalculated andpresented in different ways. Krummel (1907) gives the following valuesfor the specific heat at 17.5°C and atmospheric pressure:
s(”/oo) . . . . . . o 5 10 20 25G (cals/g). . . . 1.000 0.982 0.968 0.!’58 0.951 0.945 0%39 0%32 04:26
Kuwahara (1939) gives an empirical equation for the specific heat atO°C and atmospheric pressure:
Cp = 1.005-0.004136 S + 0.0001098 Sz – 0.000001324 S$.
It will be noted that the specific heat decreases with increasingsalinity, but it has been pointed out by Krtimmel that the effect issomewhat larger than might be expected from the composition of thesolution, and the problem meritsreinvestigation. The effects of tempera-ture and pressurehave not been measured, but it has been assumed thatthey are the same as those for pure water. Ekman (1914) gives thefollowing values showing the effect of temperature on the specific heat ofwater of S ==34.85 ‘/00 at atmospheric pressure:79(”C). . . . . . . . . . . . . . . . . . . . . ,. -2Cap. . . . . . . . . . . . . . . . . . . . . . . . . . 0.942 0.:41 0.:38 0!:35 O%33 02:32
The effect of pressure on the specific heat has been computed byEkman (1914) from the equation
dc,
()T !E+e2,
~= ‘*05~ d8
62 PHYSICAL PROPERTIESOF SEA WATER
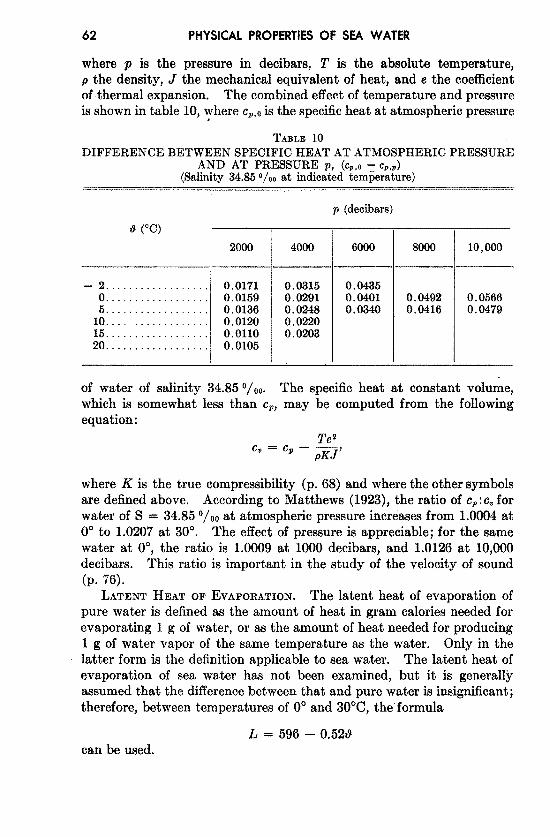
where p is the pressure in decibars, T is the absolute temperature,p the density, J the mechanical equivalent of heat, and e the coefficientof thermal expansion. The combined effect of temperature and pressureis shown in table 10, where Cfl,ois the specific heat at atmospheric pressure.
TABLE10DIFFERENCE BETWEEN SPECIFIC HEAT AT ATMOSPHERIC PRESSURE
AND AT PRESSURE ‘p, (CP,0 – C,,,)(Salinity 34.85‘/~iIat indicated temperature)
1
I p (decibars)
!$ (’c)
2000 4000 6000 8000 10,000
– 2. . . . . . . . . . . . . . . . . . 0.0171 0.0315 0.04350. . . . . . . . . . . . . . . . . . 0.0159 0.0291 0.0401 0.0492 0.0566
0.0136 0.0248 0.0340 0.0416 0,04791:::::’::::::::::::: 0.0120 0.022015. . . . . . . . . . . . . . . . . . 0.0110 0,020320. . . . . . . . . . . . . . . . . . 0.0105
of water of salinity 34.85 ‘/00. The specific heat at constant volume,which is somewhat less than CP,may be computed from the followingequation:
~e2c*=cp ——
pKJ’
where K is the true compressibility (p. 68) and where the other symbolsare defined above. According to Matthews (1923), the ratio of c.: coforwater of S = 34.85 ‘/00 at atmospheric pressure increasesfrom 1.0004 at0° to 1.0207 at 30°. The effect of pressure is appreciable; for the samewater at 0°, the ratio is 1.0009 at 1000 decibars, and 1.0126 at 10,000decibars. This ratio is important in the study of the velocity of sound(p. 76).
LATDNTHEATOFEVAPORATION.The latent heat of evaporation ofpure water is defined as the amount of heat in gram calories needed forevaporating 1 g of water, or as the amount of heat needed for producing1 g of water vapor of the same temperature as the water. Only in thelatter form is the definition applicable to sea water. The latent heat ofevaporation of sea water has not been examined, but it is generallyassumed that the clifference between that and pure water is insignificant;therefore, between temperatures of 0° and 30”C, the’ formula
L = 596 – 0.520ean be used.
PHYSICAL PROPERTIESOF SEA WATER 63
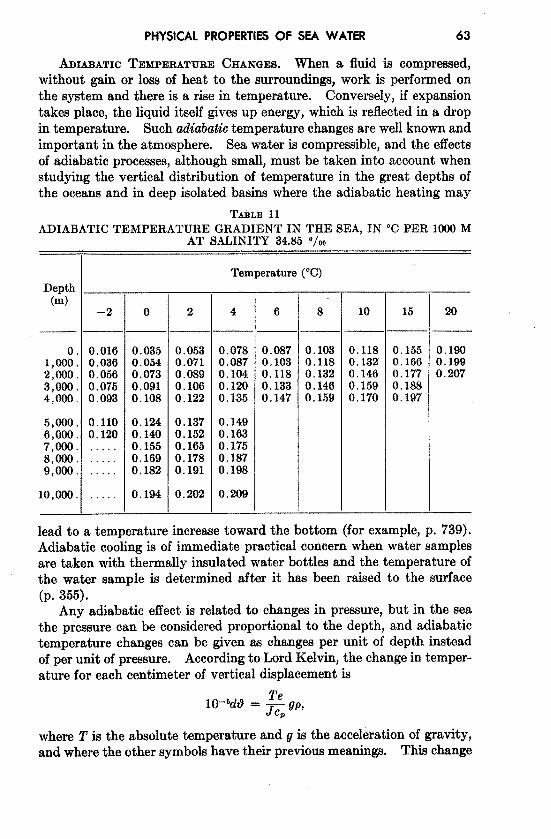
ADIABATICTEMPERATURECHANGES. When a fluid is compressed,without gain or loss of heat to the surroundings, work is performed onthe system and there is a rke in temperature. Conversely, if expansiontakes place, the liquid itself gives up energy, which is reflected in a dropin temperature. Such adiabatic temperature changes are well known andimportant in the atmosphere. Sea water is compressible, and the effectsof adiabatic processes, although small, must be taken into account whenstudying the vertical distribution of temperature in the great depths ofthe oceans and in deep isolated basins where the adiabatic heating may
TABLE11ADIABATIC TEMPERATURE GRADIENT IN THE SEA, IN “C I?ER 1000 M
AT SALINITY 34.85 0/00
Depth(m)
–2
o. 0.0161,000. 0.0362,000. 0.0563,000. 0.0754,000. 0.093
5,000. 0.1106,000. 0.1207,000.8,000. :::::9,000. . . . . .
10,OOO. . . . .
0
0.0350.0540.0730.0910.108
0.1240.1400.1550.1690.182
0.194
2
0.0530.0710. 0s90.1060.122
0.1370.1520.1650.1780.191
0.202
Temperature (“C)
4
0.0780.0870.1040.1200.135
0.1490.1630.1750.1870.198
0.209
6
0.0870.1030.1180.1330.147
8
0.1030.11s0.1320.1460.159
10
0.1180.1320.1460.1590.170
15
0.1550.1660.1770.1880.197
20
0.1900.1990.207
lead to a tem~erature increase toward the bottom (for example, p. 739).Adiabatic coiling is of immediate practical concern when water samplesare taken with thermally insulated water bottles and the temperature ofthe water sample is determined after it has been raised to the surface(p. 355).
Any adiabatic effect is related to changes in pressure, but in the seathe pressure can be considered proportional to the depth, and adiabatictemperature changes can be given as changes per unit of depth insteadof per unit of pressure. According to Lord Kelvin, the change in temper-ature for each centimeter of vertical displacement is
lo-bd~ ‘e= ~p 9P,
where T is the absolute temperature and g is the acceleration of gravity,and where the other symbols have their previous meanings. This change

64 PHYSICAL PROPERTIESOF SEA WATER
is extremely small, and for practical purposes the adiabatic temperaturechange on a vertical distance of 1000 m, called the adkdxztictemperaturegradient, is used instead. It should be observed that the adiabatictemperature gradient depends mainly upon the coefficient of thermalexpansion, e, which varies much more with temperature and pressurethan the other quantities involved. Ekman (1914) has computed theadiabatic temperature gradient for different temperatures, salinities,anddepths, and some of his values are shown in table 11.
The temperature that a water sample would attain if raised adia-batically to the sea surface has been called the potential temperature(Helland-Hansen, 1912b) and has been designated e. Thus, 0 = $~ –A$, where il. is the temperature in situand AOis the amount by which thetemperature would decrease adiabatically if the sample were raised tothe surface. The potential temperature can be obtained from a table ofthe adiabatic gradients by step-wise computations. Such computationsare long and tedious, but Helland-Hansen (1930) has prepared a con-venient table for Az9which has been reproduced in table 12. The table
T.4BLE12ADIABATIC COOLING (IN O.OI°C) WHEN SEA WATER (UO= 28.0,
S = 34.85 ‘/oo) WHICHHAS A TEMPERATURE OF & AT THEDEPTH OF n METERS IS RAISED FROM THAT DEPTH
TO THE SURFACE!
1 Temperature, Om(“C)Depth
(m)-2 –1 o 1 2 3 4 5 6
. — — — . . . . .
1,000 . . . . . . 2.6 3.5 4.4 5.3 6.2 7.0 7.8 8.6 9.52,000 . . . . . . 7.2 8.9 10.7 12.4 14.1 15.7 17.2 18,8 20.43,000 . . . . . . 13.6 16.1 18.7 21.2 23.6 25.9 28.2 30.5 32.74,000 . . . . . . 21.7 25.0 28.4 31.6 34.7 37.7 40.6 43.5 46.3
5,000 . . . . . . 31.5 35.5 39.6 43.4 47.2 50.9 54.46,000 . . . . . . 42.8 47.5 52.2 56.7 61.1 65.3 69.47,000 ...,.. . . 66.2 71.3 76.2 80.9 85.58,000 . . . . . . 81.5 87.1 92.5 97.7 102,79,000 ..,... . . . . 98.1 104.1 109.9 115.6 121.0
10,000. . . . . . . . . 115.7 122.1 128.3 134.4 140.2
is based on a salinity of 34.85 0/00 (UO= 28.0) and is ap]
Ill7 8 9 10
. — — .
10.2 11.0 11.7 12.4~~eg23,3 24.8 26.2)4.9 37.1 39.2 41.2&9.151.9 54.6 57.2
licable in generalto the deep ocean areas,because in these the salinity does not differ muchfrom 34.85 0/00 and because the effect of salinity on the adiabatic processesis small. It may be seen that if water of 2°C is raisedadiabatically from8000 m to the surface, AO = 0.925°, and therefore the potential tempera-ture of that water is 1.075°. The adiabatic cooling of water of different
PHYSICAL PROPERTIESOF SEA WATER . 65
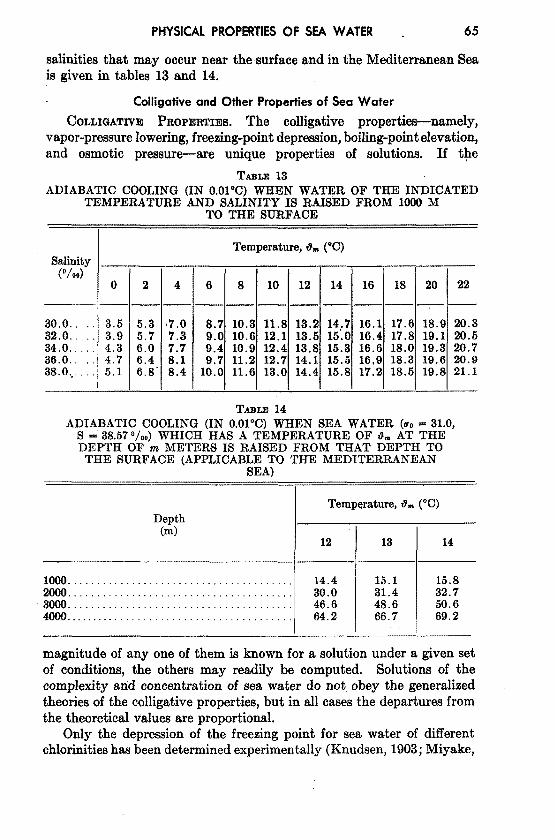
salinities that may occur near the surface and in the Mediterranean Seais given in tables 13 and 14.
Colligativeand Other Properties of Sea Water
COLLIGATIVE PROPERTIES. The colligative properties—namely,vapor-pressurelowering, freezing-point depression,boiling-point elevation,and osmotic pressure-are unique properties of solutions. If the
T-m 13ADIABATIC COOLING (IN O.O1”C)WHEN WATER OF THE INDICATED
TEMPERATURE AND SALINITY IS RAISED FROM 1000 MTO THE SURFACE
Saliiity(“/00)
30.0 . . . . .32.0 . . . . .34.0 . . . . .36.0 . . . . .38.0 ... . . .
0
3.53.94.34.75.1
2
5.3
:::6.46.8
4
‘7.0
;:;8.18.4
Temperature, t%m(W)
6 8 10 12 14 16 18 20 22. — . . . . — . .
8.7 10.3 11.8 13.2 14,7 16.1 17.6 18.9 20.39.0 10.6 12.1 13.5 15.0 16.4 17.8 19,1 20.59.4 10.9 12.4 13,8 15.3 16.6 18.0 19.3 20.79,7 11.2 12.7 14.1 15.5 16.9 18.3 19.6 20.9
10.0 11.6 13,0 14.4 15.8 17.2 18.5 19.8 21.1
ADIABATIC COOLING (IN O.OI°C)WHEN SEA WATER (u”= 31.0,S = 38.57‘loo) WHICH HAS A TEMPERATURE OF 0. AT THEDEPTH OF m METERS IS RAISED FROM THAT DEPTH TO
THE SURFACE (APPLICABLE TO THE MEDITERRANEANSEA)
Depth(m)
Temperature, % (“C)
12 I 13I
14.4 15.130.0 31.446.6 48.664.2 66.7
14
15.832.750.669.2
magnitude of any one of them is known for a solution under a given setof conditions, the others may readily be computed. Solutions of thecomplexity and concentration of sea water do not obey the generalizedtheories of the colligative properties, but in all cases the departures fromthe theoretical values are proportional.
Only the depression of the freezing point for sea water of differentchlorinitieshas been determinedexperimentally (Knudsen, 1903; Miyake,
66 PHYSICAL PROPERTIESOF SEA WATER
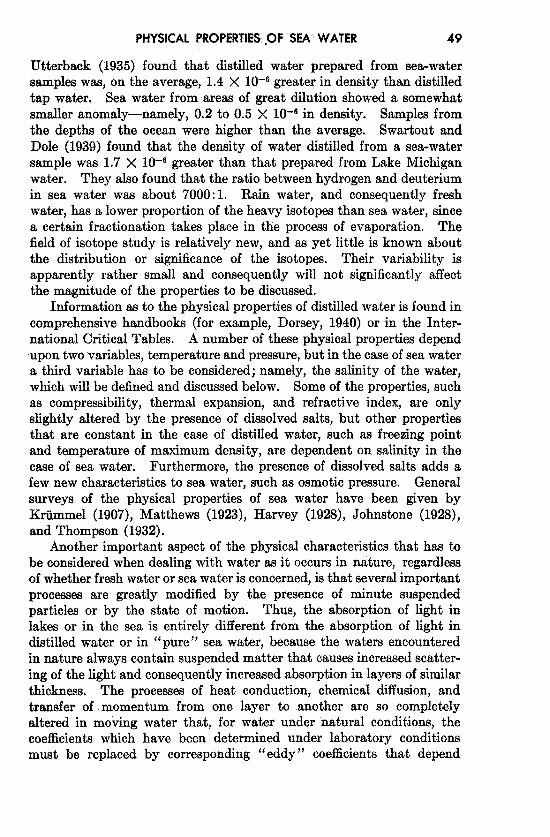
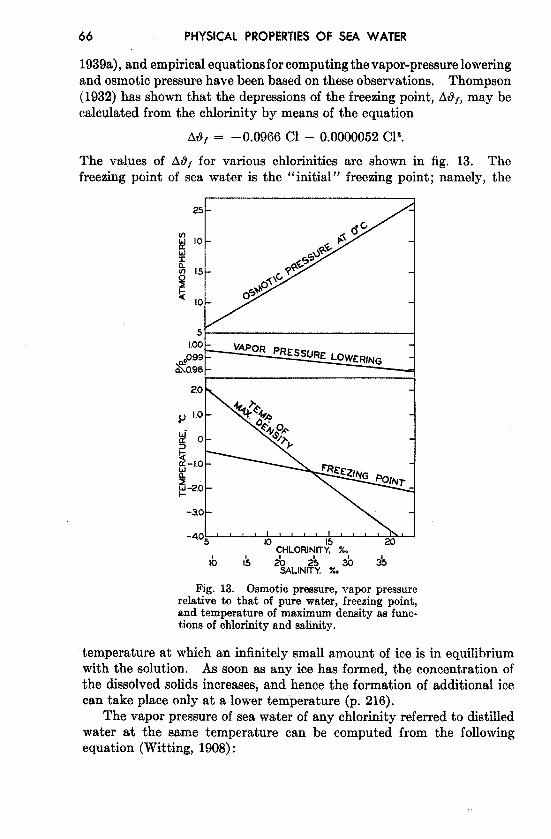
1939a), and empiricalequationsfor computing thevapor-pressureloweringand osmotic pressurehave been baaed on these observations. Thompson(1932) has shown that the depressionsof the freezing point, At?f,maybecalculated from the chlorinity by means of the equation
A@f= –0.0966 Cl – 0.0000052 C13.
The values of At?i for various chlorinities are shown in fig. 13. Thefreezing point of sea water is the “initial” freezing point; namely, the
IGO -
&99 -
&W98 -
go -
%/AJ-2.0 -
-3.0 -
-4.0510
CHLORINWf %20
io 1!5 40 ‘ & i5.SALINI??, %
Fig. 13. Osmotic pressure, vapor prewmrerelative to that of pure water, freezing point,and temperature of maximum density as func-tions of chlorinity and salinity,
temperature at which an infinitely small amount of ice is in equilibriumwith the solution. As soon as any ice has formed, the concentration ofthe dissolved solids increases, and hence the formation of additional icecan take place only at a lower temperature (p. 216).
The vapor pressureof sea water of any chlorinity referred to dktilledwater at the same temperature can be computed from the followingequation (Witting, 1908):
P~YSiCAL Properties OF SEA WATER 67
e—= 1 – 0.000969 Cl,e.
where a is the vapor pressure of the sample and eothat of distilled waterat the same temperature (fig. 13). Sea water within the normal rangeof concentration has a vapor pressure about 98 per cent of that of purewater at the same temperature, and in most cases it is not necessary toconsider the effect of salinity, since variations in the temperature of thesurface watera have a much greater effect upon the vapor pressure(table 29, p. 116).
The osmotic pressure can be calculated from the free%ing-pointdepression by means of the equation derived by Steniua (Thompson,1932) :
OPO= – 12.08 A@f.
The osmotic pressureat any temperature may then be computed:
273 + t?, 0P8 = OPO x 273 “
The variations in osmotic pressureover the range in chlorinity from 5 ‘/00
to 22 ‘/00 are shown in fig. 13.It will be noted that the freezing-point depression and, therefore, the
other colligative properties are not linear functions of the chlorinity,because chlorinity is reported as grams per kilogram of sea water and notas grams per kilogram of solvent water, in which case a linear relationshipshould be expected. In agreement with this expectation, Lyman andFleming (1940) found that the freezing-point depression could be writtenin the form
A@$= -0.05241 Z,
where Z is the total salt content per kilogram of solvent water.The magnitude of the colligative properties depends upon the concen-
tration of ions in the solution and upon their activity. According topresent concepts the major constituents of sea water exist as ions whoseconcentrations may be computed from data in table 35 (p. 173). Withinthe normal range of sea water the gram-ionic concentration per kilogramof solvent water may be obtained from the following expression:
I = 0.03183 Z,
The gram-ionic ~oncentration for water of 19 ‘/00 Cl is 1.1368. Thegram-molecular lowering of the freeningpoint is – 1.86°. Therefore, the“theoretical” value for the depression of the freezing point of water ofchlorinity 19 ‘/oo should be -1.86 X 1.1368 = – 2.11°, but the observedvalue for water of the same chlorinity is – 1.872°. The ratio betweenthe actual and the theoretical value, 0.89, is a measure of the reduced
68 PHYSICAL PROPERTIESOF SEA WATER
activity of the ions in sea water of normal concentrations, and, as men-tioned above, the other colligative properties bear the same relation tothe theoretical values.
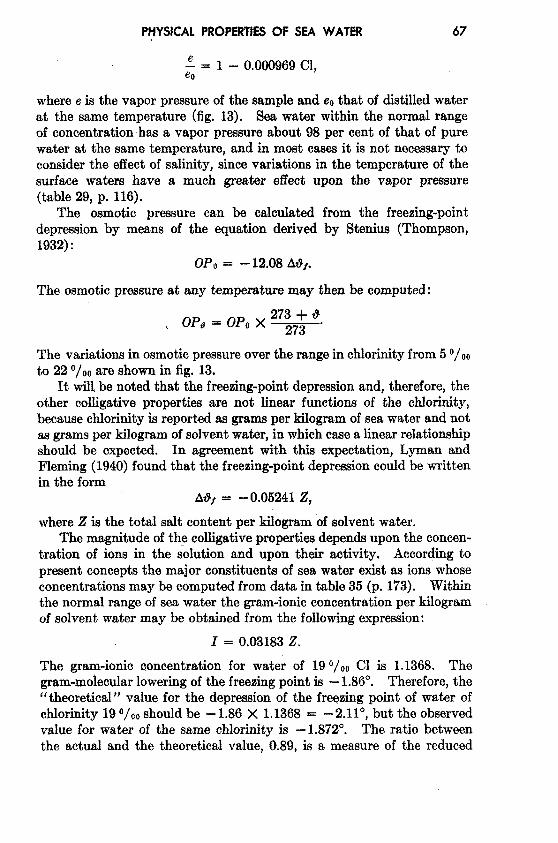
MAXIEIUMDENSITY. Pure water has its maximum density at atemperature of very nearly 4°, but for sea water the temperature ofmaximum density decreases with increasing salinity, and at salinitiesgreater than 24.70 0/00 is below the freezing point. At a salinity of24.70 0/00, the temperature of maximum density coincides with thefreezing point: 8, = – 1.332°. Consequently, the density of sea waterof salinity greater than 24.70 0/00increasescontinuously when such water
TABLE 15MEAN COMPRESSIBILITY OF SEA WATER OF SALINITY
34.85*[o,, (J2X 10s)
I
I Temperature ~C)
(b~rs)o 5 10 15 20 25
——
0 4659 4531 4427 4345 4281 4233100 4582 4458 4357 4278200 4508 4388 4291400 4368 4256
1000 4009 3916
30
4197
is cooled to its freezing point. The temperature of maximum density isshown in fig. 13 as a function of salinity and chlorinity.
COMPRESSIBILITY. Ekman (1908) has derived an empirical equationfor the mean compressibility of sea water between pressures O and p bars(p. 57), as defined by cr,,~,, = as,~,o (1 - kp). Numerical values aregiven in table 15, where the bar has been used as pressureunit.
The true compressibility of sea water is described by means of acoefficient that represents the proportional change in specific volume ifthe hydrostatic pressure is increased by one unit of pressure: K =(– l/cx)(da/dp). The true compressibility can be calculated from themean compressibility, which was tabulated by Ekman, using the equation
~=(’+’%)(1 – kp) ‘
where k is the mean compressibility referred to bar as pressureunit, andp is the pressurein bars.
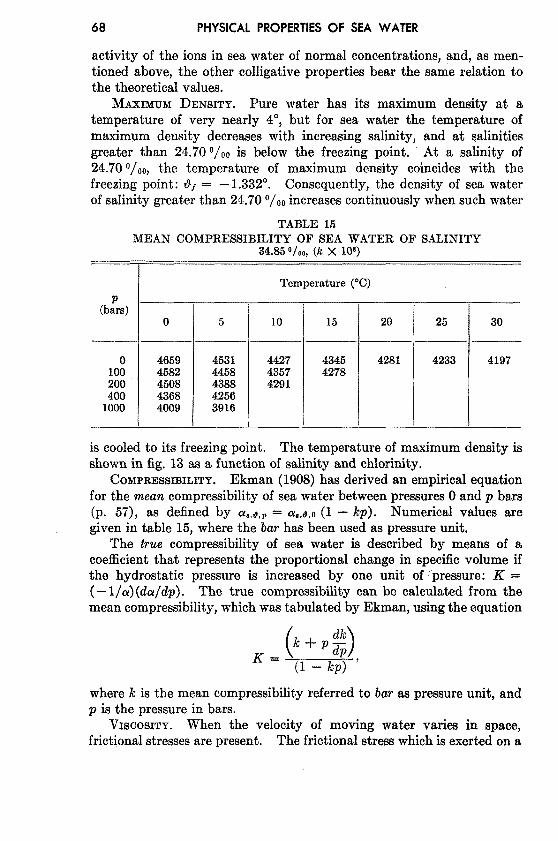
VIscosrrY. When the velocity of moving water varies in space,frictional stressesare present. The frictional stresswhich is exerted on a
PHYSICAL PROPERTIESOF SEA WATER 69
surface of mea 1 cmz is proportional to the change of v&ocity per centi-meter along a line normal to that surface (~s= p dv/dn). The coefficientof proportionalityy (p) is called the d~namic uimw”ty. This coefficientdecreases rapidly with increasing temperature and increases slowlywith inmeasing salinity (table 16, after Dorsey, 1940). With increasingpressure the coefficient for pure water decreases at low temperaturebutincreases at high temperature (Dorsey, 1940), If the same holds truefor sea water, and if the effect is of similar magnitude, the viscosity ofwater of salinity 35 O/OO and temperature0° is 18,3 X 10–sc,g.s. units at apressure of 10,000 decibars, as against 18.9 X 10_s at atmosphericpressure. The difference is insignificant, and the effect of pressureon theviscosity can be disregarded in the oceans.
TABLEI16VISCOSITY OF PURE WATER AND OF SEA WATER AT ATMOSPHERIC
PRESSURE (~ X 10’ C.G.S. UNITS)(After Dorsey)
Temperature (“C)W&y I I I
o 5 10
0. . . . . . . . . . . . . . . . 17.9 15.2 13.110. . . . . . . . . . . . . . . . 18.2 15.5 13.420. . . . . . . . . . . . . . . . 18.5 15.8 13.630. . . . . . . . . . . . . . . . 18.8 16.0 13.835..., . . . . . . . . . . . . 18.9 16.1 13.9
15
11.411.711.912.112.2
20 25 30. —
10.1 8.9 8.010.3 9.1 8.210.5 9.3 8.410.7 9.5 8.610.9 9.6 8.7
The viscosity that has been discussedso far is valid only if the motionis laminar, but, as stated above, turbulent motion prevails in the sea,and an ‘teddy” coefficient must be introduced which is many timeslarger (p. 91).
DIFFUSION, In a solution in which the concentration of a dissolvedsubstance varies in space, the amount of that substance which per seconddiffuses through a surface of area 1 cmz is proportional to the changein concentration per centimeter along a line normal to that surface(dM/dt = – 8 dc/dn). The coefficient of proportionality (3) is calledthe coej?icientoj di~usion; for water it is equal to about 2 X 10⁻⁵, depend-ing upon the character of the solute, and is nearly independent of temper-ature. Within the range of concentrations encountered in the sea thecoefficient is also nearly independent of the saliiity.
What was stated about the coefficient of thermal conductivity in thesea applies also to the coefficient of diffusion. Where turbulent motionprevails, it is necessary to introduce an “eddy” coefficient that is manytimes larger and that is mainly dependent on the state of motion.
70 PHYSICAL PROPERTIESOF SEA WATER
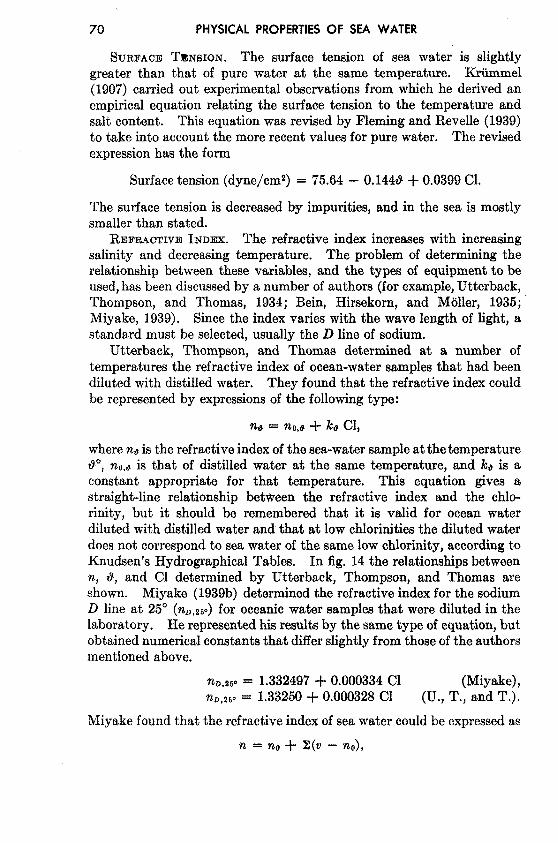
SURFACE TSNSION. The surface tension of sea water is slightlygreater than that of pure water at the same temperature. Krummel(1907) carried outexperimental observations from which he derivedanempirical equation relating the surface tension to the temperature andsalt content. This equation was revised by Fleming and Revelle (1939)to take into account the more recent values for pure water. The revisedexpression has the form
Surface tension (dyne/cm’) = 75.64- 0.1448+ 0.0399 Cl.
The surface tension is decreased by impurities, and in the sea is mostlysmaller than stated.
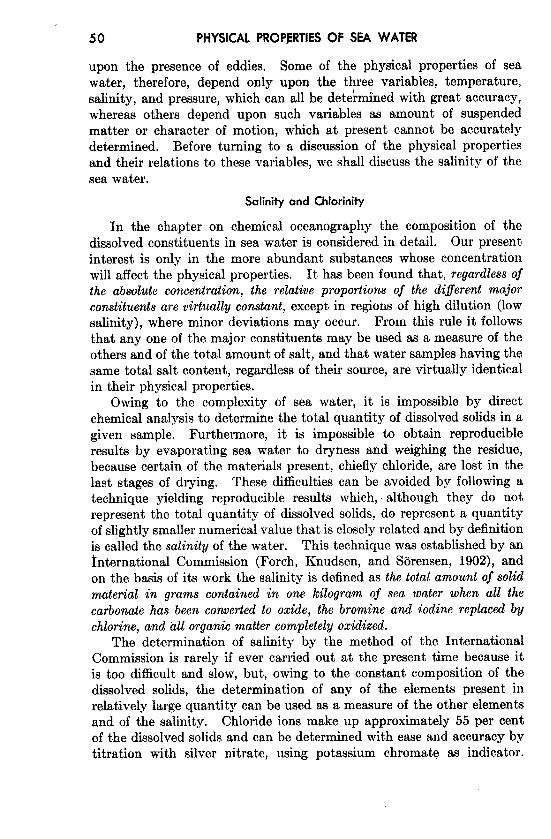
REFRACTmEINDEX. The refractive index increases with increasingsalinity and decreasing temperature. The problem of determining therelationship between these variables, and the types of equipment to beused,has been discussedby a number of authors (for example,Utterback,Thompson, and Thomas, 1934; Bein, Hirsekorn, and Moller, 1935;Miyake, 1939). Since the index varies with the wave length of light, astandard must be selected, usually the D line of sodium.
Utterback, Thompson, and Thomas determined at a number oftemperatures the refractive index of ocean-water samples that had beendiluted with distilled water. They found that the refractive index couldbe represented by expressionsof the following type:
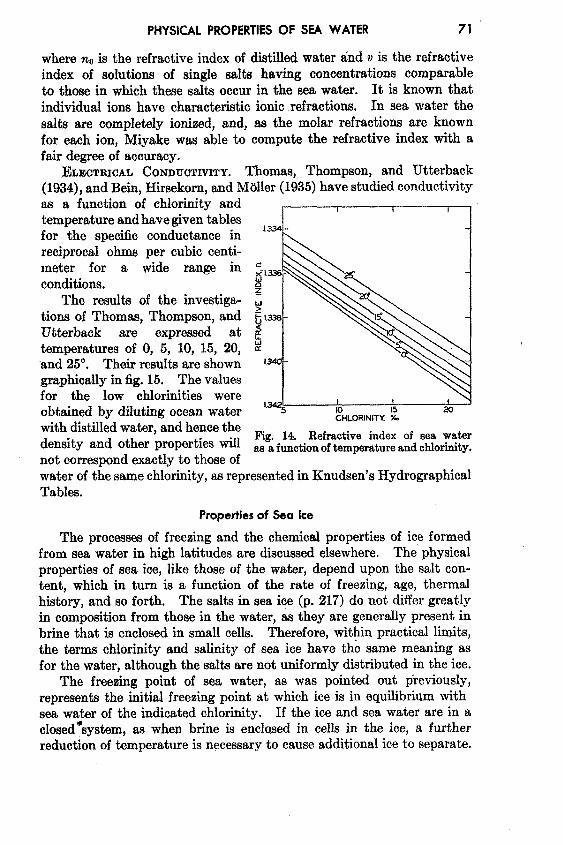
wheren~is the refractive index of the sea-watersample at thetemperature0°, no,~is that of distilled water at the same temperature, and k~ is aconstant appropriate for that temperature. This equation gives astraight-line relationship between the refractive index and the chlo-rinity, but it should be remembered that it is valid for ocean waterdiluted with distilled water and that at low chlorinities the diluted waterdoes not correspond to sea water of the same low chlorinity, according toKnudsen’s Hydrographical Tables. In fig. 14 the relationshipsbetweenn, 0, and Cl determined by Utterback, Thompson, and Thomas areshown. Miyake (1939b) determined the refractive index for the sodiumD line at 25° (n.,Z,.) for oceanic water samples that were diluted in thelaboratory. He representedhk resultsby the same type of equation, butobtained numerical constants that differ slightly from those of the authorsmentioned above.
???D,260 = 1,332497 + 0.000334 Cl (Miyake),?tD,250 = 1.33250 + 0.000328 Cl (U., T., and T.).
Miyake found that the refractive index of sea water could be expressedas
n = nO + 2(v - no),
PHYSICAL PROPERTIESOF SEA WATER 71
where no is the refractive index of distilled water and v is the refractiveindex of solutions of single salts having concentrations comparableto those in which these salts occur in the sea water. It is known thatindividual ions have characteristic ionic refractions. In sea water thesalts are completely ionized, and, as the molar refractions are knownfor each ion, Miyake wss able to compute the refractive index with afair degree of accuracy.
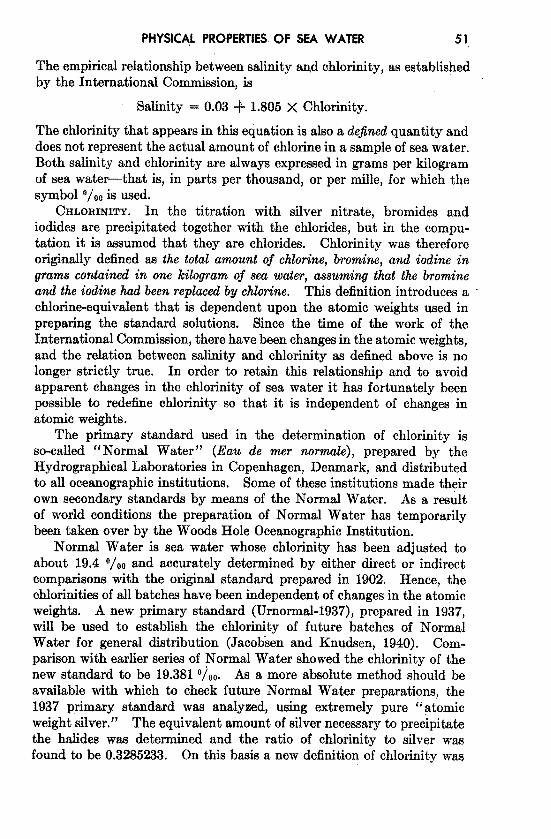
ELECTRICALCONDVWIVITY.Thomas, Thompson, and Utterback(1934), and Bein, Hhsekorn, and Mdller (1935) have studied conductivityas a function of ch.lorinity andtemperatureand have given tablesfor the specific conductance inreciprocal ohms per cubic centi-meter for a wide range in ‘.conditions. g
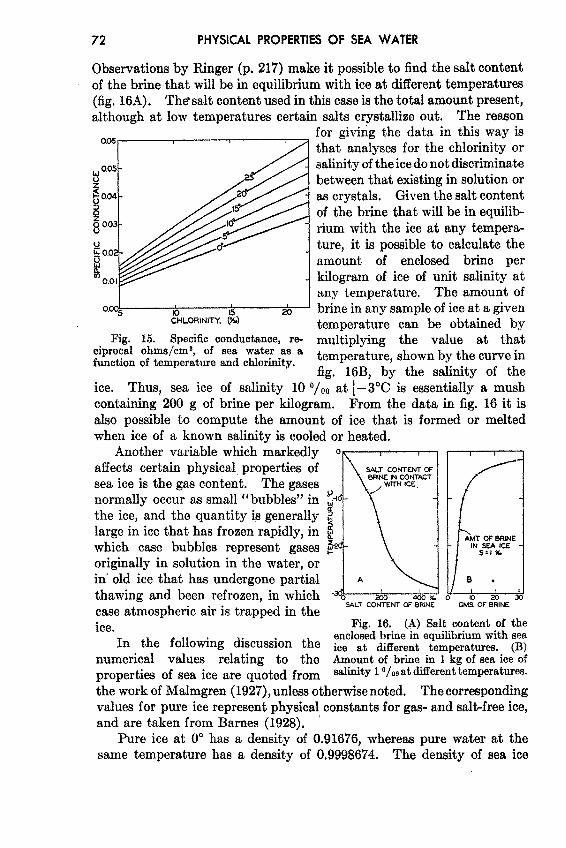
The results of the investiga- ~tiona of Thomas, Thompson, and ~‘Utterback are expressed at #temperatures of O, 5, 10, 15, 20, ~and 25°. Their resultsare showngraphically in fig. 15. The valuesfor the low chlorinitiee wereobtained by diluting ocean water
CHLORINITY “%
with distilledwater, and hence thedensity and other properties will
Fig. 14. Refractive index of ses wateras a function oftemperature and chlorinity.
not correspond exactly to those ofwater of the same chlorinity, as represented in Knudsen’s HydrographicalTables.
Properties of Sea Ice
The processes of freezing and the chemical properties of ice formedfrom sea water in high latitudes are discussed elsewhere. The physicalproperties of sea ice, like those of the water, depend upon the salt con-tent, which in turn is a function of the rate of freezing, age, thermalhistory, and so forth. The salts in sea iee (p. 217) do not differ greatlyin composition from those in the water, aa they are generally present inbrine that is enclosed in small cells. Therefore, within practical limits,the terms chlorinity and salinity of sea ice have the same meaning asfor the water, although the salts are not uniformly distributed in the ice.
The freezing point of sea water, as was pointed out previously,represents the initial freezing point at which ice is in equilibrium withsea water of the indicated chlorinity. If the ice and sea water are in aclosedqsystem, as when brine is enclosed in cells in the ice, a furtherreduction of temperature is necessary to cause additional ice to separate.
72 PHYSICAL PROPERTIESOF SEA WATER
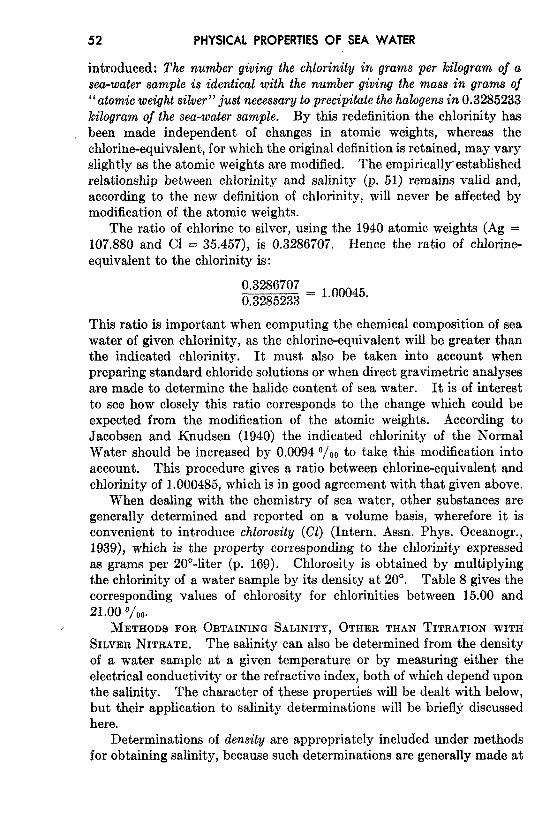
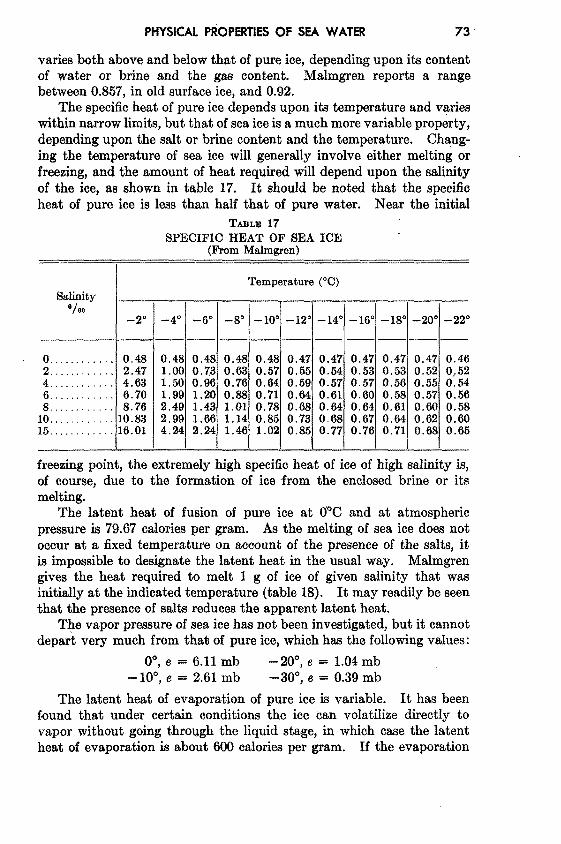
Observations by Ringer (p. 217) make it possible to find the salt contentof the brine that will be in equilibrium with ice at different temperatures(fig. 16A). The’salt content used in this case is the total amount present,although at low tem~eratures certain salts crystallize out. The reason.
o.oe~ Im
&L0i31NITY. (2
Fig. 15. Specific conductance, reciprocal ohms/cmS, of sea water as afunction of temperature and chloridy.
for givi~g the data in this way isthat analyses for the chlorinity orsalinity of the ice do not discriminatebetween that existing in solution oras crystals. Given the salt contentof the brine that will be in equilib-rium with the ice at any tempera-ture, it is possible to calculate theamount of enclosed brine perkilogram of ice of unit salinity atany temperature. The amount ofbrine in any sample of ice at a giventemperature can be obtained bymultiplying the value at thattemperature, shown by the curve infig. 16B, bv the salinity of the
ice. Thus, sea ice of salinity 10 O/o~at [– 3°(3”is essentially a mushcontaining 200 g of brine per kilogram. From the data in fig. 16 it isalso possible to compute the amount of ice that is formed or meltedwhen ice of a known salinity is cooled or heated.
Another variable which markedlyaffects certain physical properties ofsea ice is the gas content. The gasesnormally occur as small “bubbles” inthe ice, and the quantity is generallylarge in ice that has frozen rapidly, inwhich case bubbles represent gasesoriginally in solution in the water, orin’ old ice that has undergone partialthawing and been refrozen, in whichcase atmospheric air is trapped in theice.
In the following discussion thenumerical values relating to theproperties of sea ice are quoted from
IUD.
SALT CONTENT OFSFON&WmC&WT
$-J“.+
*
5
g Ah4T OF SR!MIN ~S=~;CE
$-
A 0.
m% o 20WSALT CONTENT W BRINE G&OF SRINE
Fig. 16. (A) Salt content of theenclosedbrine in equilibrium with seaice at different temperatures. (B)Amount of brine in 1 kg of sea ice ofsalinhy 1 O/OO at differenttemperatures.
~he-workof Malmgren (1927), unlessotherwisenoted. The correspondingvalues for pure ice representphysical constants for gas- and salt-free ice,and are taken from Barnes (1928). ‘
Pure ice at 0° has a density of 0.91676, whereas pure water at thesame temperature has a density of 0.9998674, The density of sea ice
PHYSICAL PROPERTIESOF SEA WATER 73
varies both above and below that of pure ice, depending upon its contentof water or brine and the gas content. Malmgren reports a rangebetween 0.857, in old surface ice, and 0.92.
The specific heat of pure ice depends upon its temperature and v~rieswithin narrow limits, but that of sea ice is a much more variable property,depending upon the salt or brine content and the temperature. Chang-ing the temperature of sea ice will generally involve either melting orfreeaing, and the amount of heat required will depend upon the salinityof the ice, as shown in table 17. It should be noted that the specificheat of pure ice is less than half that of pure water. Near the initial
TABLE17SPECIFIC HEAT OF SEA ICE
(From Malmgren)
I Temperature (“C)Salinity
“/00-2° -4” -6° -8” -10” -12° -14° – 16° – 18° -20° -22°
— . . . . — — — — — —
0 . . . . . . . . . . . . 0.48 0.48 0.48 0.48 0.48 0.47 0.47 0.47 0.47 0.47 0.462. . . . . . . . . . . . 2.47 1.00 0.73 0.63 0.57 0.55 0.54 0.53 0.53 0.52 0.524. . . . . . . . . . . . 4.63 1.50 0.96 0.76 0.64 0.59 0.67 0.57 0.56 0,55 0.546. . . . . . . . . . . . 6.70 1.99 1.20 0.88 0.71 0.64 0.61 0.60 0.58 0.57 0.568. . . . . . . . . . . . 8.76 2.49 1.43 1.01 0.78 0.68 0.64 0.64 0.61 0.60 0.58
10,. . . . . . . . . . 10.83 2.99 1.66 1.14 0.85 0.73 0.68 0.67 0.64 0.62 0.6015, . . . . . . . . . . . 16.01 4.24 2.24 1.46 1.02 0.85 0.77 0.76 0.71 0.68 0.65
freezing point, the extremely high specific heat of ice of high salinity is,of course, due to the formation of ice from the enclosed brine or itsmelting.
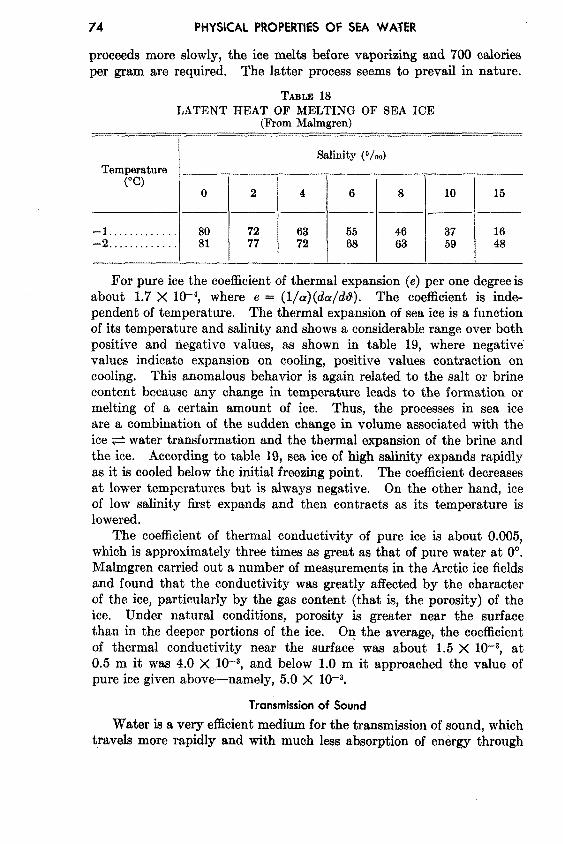
The latent heat of fusion of pure ice at O°C and at atmosphericpressure is 79.67 calories per gram. As the melting of sea ice does notoccur at a fixed temperature on account of the presence of the salts, itis impossible to designate the latent heat in the usual way. Malmgrengives the heat required to melt I g of ice of given salinity that wasinitially at the indicated temperature (table 18). It may readily be seenthat the presence of salts reduces the apparent latent heat,
The vapor pressure of sea ice has not been investigated, but it cannotdepart very much from that of pure ice, which has the following values:
0°, e = 6.11 mb – 20°, e = 1.04 mb– 10°, e = 2.61 mb -30°, e = 0.39 mb
The latent heat of evaporation of pure ice is variable. It has beenfound that under certain conditions the ice can volatilize directly tovapor without going through the liquid stage2 in which case the latentheat of evaporation is about 600 calories per gram. If the evaporation
74 PHYSICAL PROPERTIESOF SEA WATER
proceeds more slowly, the ice melts before vaporizing and 700 caloriesper gram are required. The latter process seems to prevail in nature.
TABLE18LATENT HEAT OF MELTING OF SEA ICE
(From Malmgren)
ISalinity (0/00)
Temperature(“c)
o 2 4 6 8 10 15— — — ——
-1 . . . . . . . . . . . . . 80 72 63 55 46 37 16–2.. !. . . . . . . . . . 81 77 72 68 63 59 48
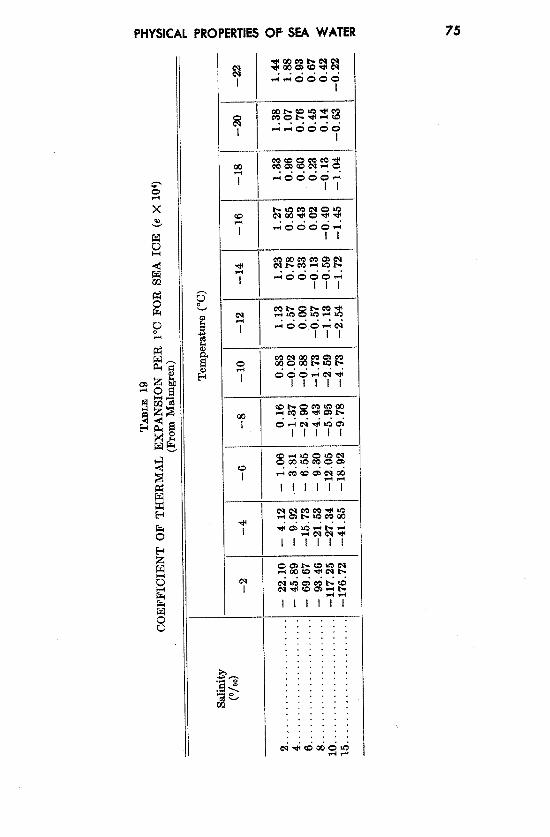
For pure ice the coefficient of thermal expansion (e) per one degree isabout 1.7 X 10⁻⁴, where e = (l/a) (da/d&). The coefficient is inde-pendent of temperature. The thermal expansion of sea ice is a functionof its temperature and salinity and shows a considerable range over bothpositive and negative values, as shown in table 19, where negativevalues indicate expansion on cooling, positive values contraction oncooling. This anomalous behavior is again related to the salt or brinecontent because any change in temperature leads to the formation ormelting of a certain amount of ice. Thus, the processes in sea iceare a combination of the sudden change in volume associated with theice ~ water transformation and the thermal expansion of the brine andthe ice. According to table 19, sea ice of high salinity expands rapidlyas it is cooled below the initial freezing point. The coefficient decreasesat lower temperatures but is always negative. On the other hand, iceof low salinity first expands and then contracts as its temperature islowered.
The coefficient of thermal conductivity of pure ice is about 0.005,which is approximately three times as great as that of pure water at OO.Malmgren carried out a number of measurementsin the Arctic ice fieldsand found that the conductivity was greatly affected by the characterof the ice, particularly by the gas content (that is, the porosity) of theice. Under natural conditions, porosity is greater near the surfacethan in the deeper portions of the ice. On the average, the coefficientof thermal conductivity near the surface was about 1,5 X 10⁻⁸, at0.5 m it was 4.0 X 1(%8,and below 1.0 m it approached the value ofpure ice given above-namely, 5.0 X 10_3.
Transmissionof Sound
Water is a very efficient medium for the transmissionof sound, whiohtravels more rapidly and with much less absorption of energy through
PHYSICAL PROPERTIESOF SEA WATER 75
CJ
I
m
1’
qq%f?%~Oood”ei.ei
11111
. .. .. .. .
.. .. .. .. .. .. .. .. .. .. .. .. .. .. .
&-i
. . . .. . . .. . . .. . . .. . . .. . . .. . . .. . . .. . . .,.. .. . . .. . . .. . . ..,. .. . . .. . . .. . . .. . . .. . . .,.. .
76 PHYSICAL PROPERTIESOF SEA WATER
water than through air. This characteristic has made possible thedevelopment of submarine acoustic methods that are of tremendousvalue in navigation, The most familiar use is in echo sounding, wherethe time required for an impulse to travel to the sea floor and back to thevessel is used as a measure of the depth. Horizontal sound transmissionis used in radio-acoustic range finding, which is employed by surveyingvessels in order to determine their location accurately when carrying onsounding operations out of sight of land. The position of the vessel isdetermined by measuringthe time intervals required for the impulse of abomb explosion to travel to two or more submarine sound detectors(hydrophores) at known locations, usually near shore. Sound trans-mission from subsurface bells has also been used as a navigational aidnear lighthouses. Ultrasonic impulses (frequency above the rangeaudible to the human ear) are largely directional, and many attemptshave been made to develop instruments for locating icebergs and othernavigational hazards in the path of a vessel. The practical aspectsof this problem and the types of equipment used are too numerous toconsider in this discussion, and reference is made to the HydrographicReview (Monaco) as an excellent source of material on these problems.
The velocity of sound in sea water is independent of the wave lengthexcept for impulses resulting from the detonation of relatively largeamounts of explosives. Initially the impulse from such explosions maytravel about 30 per cent faster than normal, apparently because of thetremendous energy involved.
The velocity of sound in a liquid may be computed from the elasticityand density:
?/elasticity~=density ‘
but in practice it is more convenient to use the expression
where ~ is the ratio of the specific heats, cP/ce (p. 62), p is the density,and K is the true compressibility. If p and K are in c.g.s. units, thevelocity is in centimeters per second. The ratio ~ is introduced becausethe sound impulse is a wave of compression and, hence, heats the waterit passes through. The three variables, y, p, and K, all change withtemperature, salinity, and pressure, and therefore must be evaluated forany given set of conditions. For example, water of salinity 34.85 0/00 at30° has a density of 1,021637 at atmospheric pressure (p = O), and forthese conditions 7 = 1.0207 and K = 4.196 X 10–ll. Hence,
v = 1.543 x 10s cm/sec = 1543 m/see.
PHYSICAL PROPERTIESOF SEA WATER 77
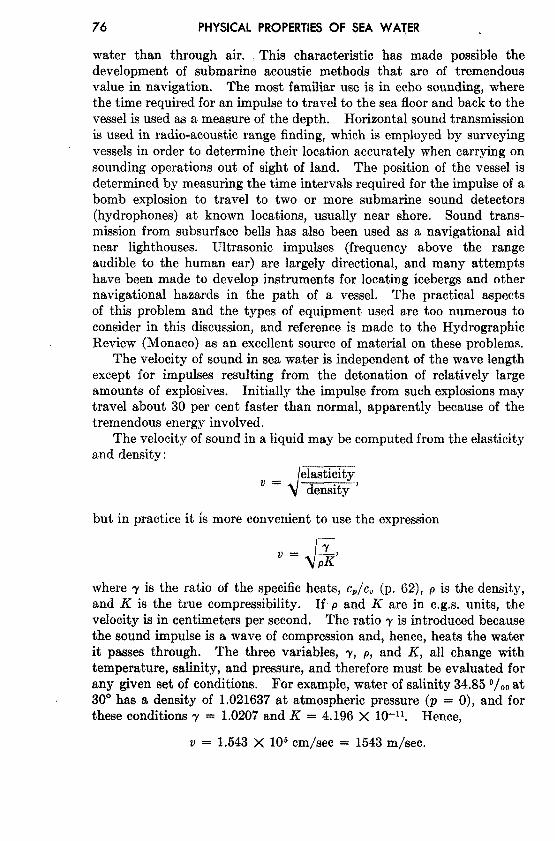
By means of the above formula, suitable tables have been preparedthat give the velocity of sound as a function of temperature, salinity,and pressure. The first practical tables were those of Heck and Service(1924) of the U. S. Coast and ~Geodetic Survey, but these havebeen superseded by the BritishAdmiralty Tables prepared by mIMatthews (1927), wfich~ although NW
“w/
PURE
based on the same original data, %WATER
are slightly more consistent. The ~variations in velocity as a function ~of temperature and salinity are ~ ,0 OZS25.0
s=3i.11
shown in fig. 17. The effect of a, 28.0
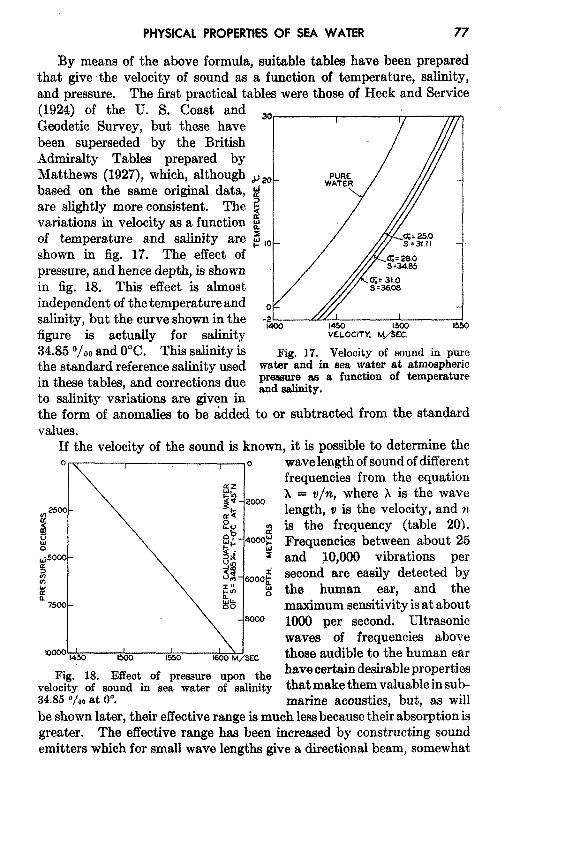
pressure,and hence depth, is shown S=M.SS
in fig. 18. This effect is almost %=31.0s=3m8
independent of the temperatureand osalinity, but the curve shown in thefigure is actualIy for salinity34.85 0/,~and O°C. This salinity isthe standard referencesalinity usedin these tables, and corrections dueto salinity variations are given inthe form of anomalies to be added to or subtracted from the standardvalues.
If the velocity of the sound is known, it is possible to determine theo-
* 2500 -
g
E~ woo -ix~clwaIL
7500 -
Iom ,&. I I I15W 5s0 M@ M/SEC
Fig. 18. Effect of pressure upon thevelooity of 8ound in 8ea water of 8alinity34.85 ‘/00at OO.
.ZL ~1400 1850
VELOCITY, A&?
Fig. 17. Velocity of sound in purewater and in sea water at atmosphericpressure as a function of temperatureand &ty.
.wavelength of sound of differentfrequencies from the equationx = v/n, where k is the wavelength, v is the velocity, and nis the frequency (table 20).Frequencies between about 25and 10,000 vibrations persecond are easily detected bythe human ear, and themaximum sensitivityisat about1000 per second. Ultrasonicwaves of frequencies abovethose audible to the human earhave certaindesirablepropertiesthat makethem valuable insub-marine acoustics, but, as will
be shown later, their effective range ismuch lessbecausetheirabsorption isgreater. The effective range has been increased by constructing soundemitters which for small wave lengths give a directional beam, somewhat
78 PHYSICAL PROPERTIESOF SEA WATER
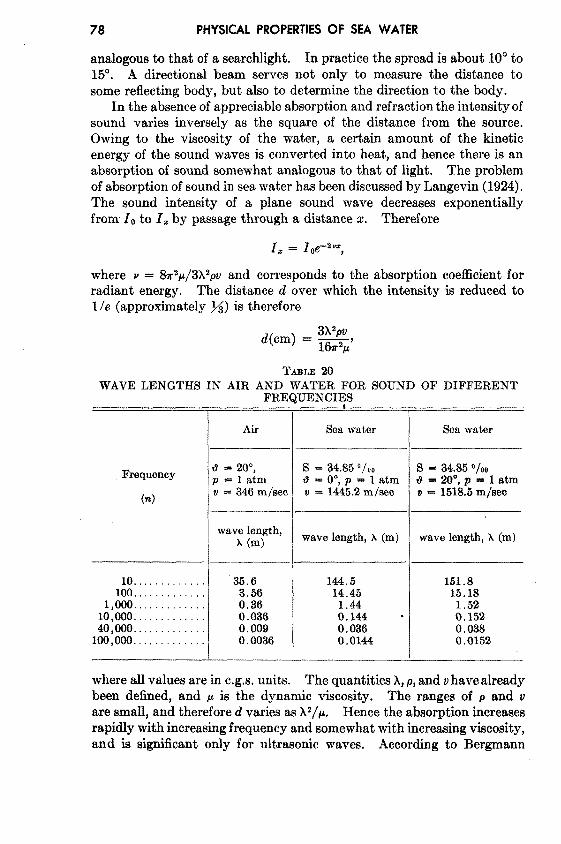
analogous to that of a searchlight. In practice the spread is about 10° to15°. A directional beam serves not only to measure the distance tosome reflecting body, but also to determine the direction to the body.
In the absence of appreciable absorption and refractionthe intensityofsound varies inversely as the square of the distance from the source.Owing to the viscosity of the water, a certain amount of the kineticenergy of the sound waves is converted into heat, and hence there is anabsorption of sound somewhat analogous to that of light. The problemof absorption of sound in seawater has been discussedby Langevin (1924).The sound intensity of a plane sound wave decreases exponentiallyfrom 10 to Iz by passage through a distance x. Therefore
1. = Ioe–2”,
where v = 87r9p/3x2Pvand corresponds to the absorption coefficient forradiant energy. The distance d over which the intensity is reduced to1/e (approximately ~) is therefore
d(cm)3h2pv
= w’
TABJ,m20WAVE LENGTHS IN AIR AND WATER FOR
Frequency
(?2)
10.............100... . . . . . . . . . .
1,000, ..,......,,.10,000. . . . . . . . . . . .40,000.............100,000.............
FRE(
Air
Y= 20”,D=latnlv ==346 m/see
wave length,A(m)
‘35.63.560.360.0360.0090.0036
UENCIESSOUND OF DIFFERENT
*
Sea water
S = 34.85 O/oo
7?=0°, p=latmv = 1445,2m/seo
wave length, A(m)
144.514.451.440,144 ‘0.0360!0144
Sea water
S = 34.85 0/00
$=20°, p=latm# = 1518.5m/see
wave length, A(m)
151.815.181.520.1520.0380.0152
where all values are in C.R,S,units, The quantities A,P, and vhave alreadybeen defined, and 1Ais ~he dynamic vis~osity. The” ranges of p and ‘vare small, and therefore d varies as A2/p. Hence the absorption increasesrapidly with increasingfrequency and somewhat with increasingviscosity,and is significant only for ultrmonic waves. According to Bergnmnn
PHYSICAL PROPERTIESOF SEA WATER 79
(1939) the absorption in water is much greater than ia indicated by theequations above. Efartxnannand Focke (1940) have obtained experi-mental data which indicate that the absorption is approximately athousandfold larger. Whether absorption in the sea is as great or greaterthan that shown by these laboratory tests must await investigation inthe field.
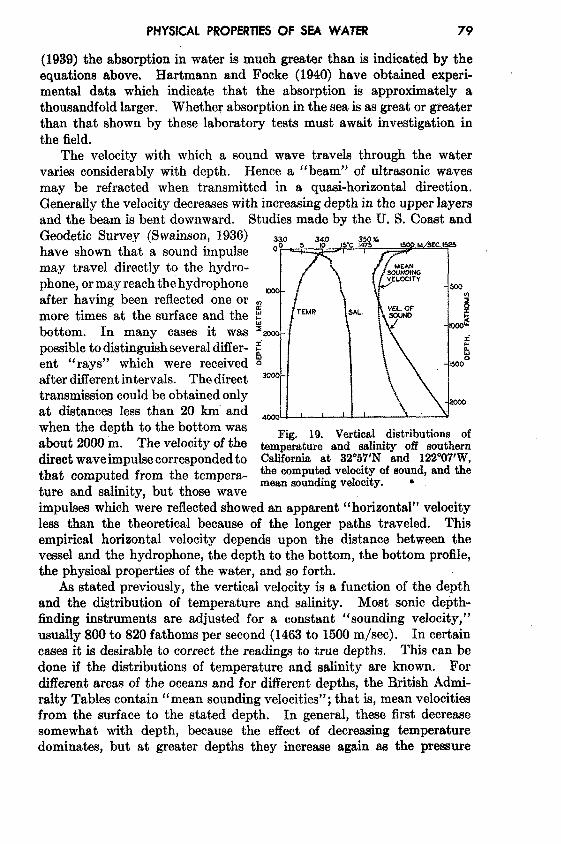
The velocity with which a sound wave travels through the watervaries considerably with depth. Hence a “beam” of ultrasonic wavesmay be refracted when transmitted in a quasi-horizontal direction.Generally the velocity decreaseswith increasingdepth in the upper layersand the beam is bent downward. Studies made by the U. S. Coast andGeodetic Survey (Swainson, 1936)have shown that a sound impulsemay travel directly to the hydro-phore, or may reachthehydrophoreafter having been reflected one ormore times at the surface and thebottom. In many cases it waspossible to distinguishseveraldMer-ent “rays” which were receivedafter differentintervals, The directtransmissioncould be obtained onlyat distances less than 20 km’ andwhen the depth to the bottom wasabout 2000 m. The velocity of thedirect wave impulsecorrespondedtothat computed from the tempera-ture and salinity, but those wave
Fig, 19. Vertical distributions oftemperature and salinity off southernCalifornia at 32”57’N and 122”07’W,the computed velocity of sound, and themean sounding velocity. ●
impulses which ‘werereflected showed an apparent “horizontal” velocityless than the theoretical because of the longer paths traveled. Thisempirical horizontal velocity depends upon the distance between thevessel and the hydrophore, the depth to the bottom, the bottom profile,the physical properties of the water, and so forth.
As stated previously, the vertical velocity is a function of the depthand the distribution of temperature and salinity. Most sonic depth-finding instruments are adjusted for a constant “sounding velocity,”usually 800 to 820 fathoms per second (1463 to 1500 m/see). In certaincases it is desirable to correct the readings to true depths. This can bedone if the distributions of temperature and salinity are known. Fordifferent areas of the oceans and for different depths, the British Admi-ralty Tables contain “mean sounding velocities”; that is, mean velocitiesfrom the surface to the stated depth. In general, these first decreasesomewhat with depth, because the effect of decreasing temperaturedominates, but at greater depths they increase again as the pressure
80 PHYSICAL PROPERTIESOF SEA WATER
effect becomes dominant. In fig. 19 are shown the vertical temperatureand salinity distributions at a station off the coast of southern Californiatogether with the corresponding velocity of sound at all depths as com-puted from the BritishAdmiralty Tables, The mean sounding velocity isalso shown. The latter decreased from 1503 m/see at the surface to aminimum of 1484 m/see for depths between 800 and 1800 m, and thenincreased again to 1496 m/see at 4000 m.
Absorption of Radiation
ABSORPTIONCOEFFICIENTSOF DISTILLED WATER AND OF PURE SEAWATER. In water the intensity of parallel beams of radiation of wavelength x decreases in the direction of the beams, the decrease in a layerof infinitesimalthickness being proportional to the energy, 1, and to thethickness of the layer:
dIA = —XhIk dx.
The coefficient of proportionality, x, is called the absorption coefficient.Integrating this equation between the limits x = h and x = h + L, oneobtains
where the factor 2.30 enters because base-10 logarithms are used insteadof natural logarithms, and where L is the thickness of the layer withinwhich the energy of the radiation is reduced from ~k,h to l~,ffi+~}. Thelatter equation also serves as a definition of the absorption coefficient.The numerical value of the absorption coefficient depends upon the unitof length% which L is expressed. In physics the unit is 1 cm, but inoceanography it has become common practice to use 1 m as the unit oflength. Therefore the numerical values of the coefficients that will begiven here are one hundred times larger than the corresponding valuesgiven in textbooks of physics.
The decreaseof intensity of radiation passingthrough a layer of waterdepends not only upon the amount of radiation that is truly absorbed—that is, converted into another form of energy-but also upon the amountthat is scattered laterally. In “pure” water the scattering takes placeagainst the water molecules, and the effect of scattering is related tothe molecular structure of the water (p. 47). However, when theabsorption in pure water is measured, the effect of scattering is notseparated bgt is included in the absorption coefficient, which variesgreatly with wave length.
A great number of measurements of the absorption coefficients inpure water have been conducted, but the results by different inves-tigators do not agree (Dorsey, 1940). Thus, at a wave length of .48 ~
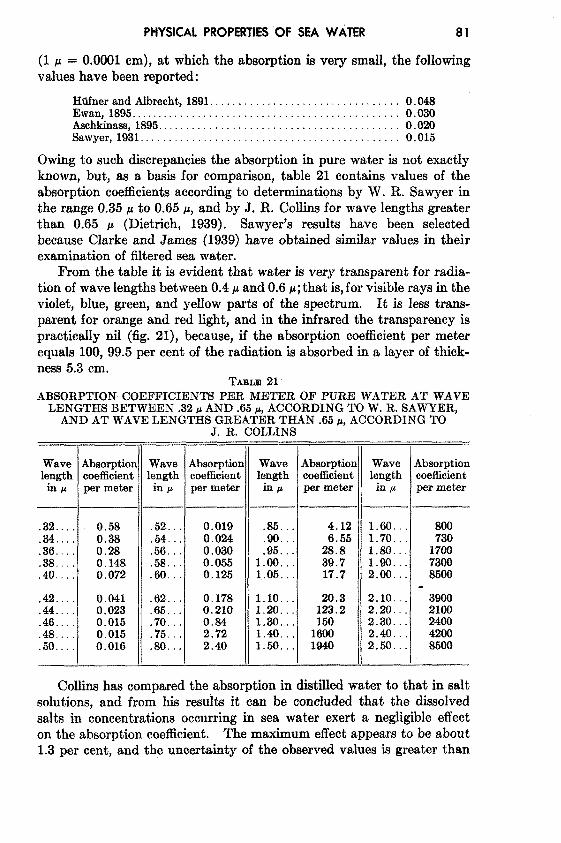
PHYSICAL PROPERTIESOF SEA WATER 81
(1 p = 0.0001 cm), at which the absorption is very small, the followingvalues have been reported:
HiifnerandAlbrecht,1891... . . . . . . . . . . . . . . . . . . . . . . . . . . . ...0.048Ewan,1895. . . . . . . . . . . . . . . . . . . . . . . . . . . . . . . . . . . . . . . . . . . . ...0.030Aschkinsss,lS95. . . . . . . . . . . . . . . . . . . . . . . . . . . . . . . . . . . . . . . ...0.020Sawyer,1931. . . . . . . . . . . . . . . . . . . . . . . . . . . . . . . . . . . . . . . . . . ...0.015
Owing to such discrepancies the absorption in pure.water is not exactlyknown, but, as a basis for comparison, table 21 contains values of theabsorption coefficients according to determinations by W. R. Sawyer inthe range 0.35 ~ to 0.65 ~, and by J. R, Collins for wave lengths greaterthan 0.65 p (Dietrich, 1939). Sawyer’s results have been selectedbecause Clarke and James (1939) have obtained similar values in theirexamination of filtered sea water.
From the table it is evident that water is very transparent for radia-tion of wave lengths between 0.4P and 0.6 ~; that is,for visible rays in theviolet, blue, green, and yellow parts of the spectrum. It is less trans-parent for orange and red light, and in the infrared the transparency ispractically nil (fig. 21), because, if the absorption coefficient per meterequals 100, 99.5 per cent of the radiation is absorbed in a layer of thkk-ness 5.3 cm.
TABLE21ABSORPTION COEFFICIENTS PER METER OF PURE WATER AT WAVE
LENGTHS BETWEEN .32 KAND .65 M,ACCORDING TOW. R. SAWYER,AND AT WAVELENGTHS GREATER THAN .65p, ACCORDING TO
J. R. COLLINS
Wavelength
in&
.32. . . .
.34. . . .
.36 . . . .
.38. . . .,40. . . .
.42. . . .
.44. . . .
.46 . . . .
.48 . . . .
.50. . . .
4bsorptioncoefficientper meter
0.580.380.280.1480.072
0.0410.0230.0150.0150.016
Wavelengthin p
.52. . .
.54. . .
.56.. .
.58. . .
.60. . .
.62. . .
.65. . .
.70. . .
.75. . .
.80. . .
kbsorptiolcoefficientper meter
0.0190.0240.0300.0550.125
0.1780.2100.842.722.40
Wave Absorptionlength coefficient~P per meter
.85. . . 4.12
.90. . . 6.55
.95. . . 28.81.00. . . 39.71.05. . . 17.7
1.10. . .1.20. . . lE::1,30. . . 1501.40, . . 16001.50. . . 1940
Wave Absorptionlength coefficientin P per meter
1.60. . . 8001.70. . . 7301.80. . . 17001.90. . . 78002.00. . . 8500
2.10. . . 36002.20. . . 21002.30. . . 24002.40. . . 42002.50. . . 8500
Collins has compared the absorption in distilled water to that in saltsolutions, and from his results it ~an be concluded that the dissolvedsalts in concentrations occurring in sea water exert a negligible effecton the absorption coefficient. The maximum effect appears to be about1.3 per cent, and the uncertainty of the observed values is greater than
82 PHYSICAL PROPERTIESOF SEA WATER
this amount. These results have been confirmed by Clarke and James(1939), who found that the absorption of pure sea water as representedby Berkefeld-filtered oceanic sea water was practically identical withthat of distilledwater, Their observations indicate that Sawyer’s valuesfor distilled water may be too high in the ultraviolet; that is, at wavelengths smaller than 0.38 ~.
It has also been concluded that the effect of temperature on absorp-tion, which has been establishedin the case of distilledwater, is applicableto uncontaminated sea water. The effect of temperature changes is toincrease the absorption in certain parts of the infrared by about 0.5 percent for every temperature increase of 1°C, but over a large part of thespectrum the temperature effect is much smaller. When dealing withsea water the effect can be neglected.
EXTINCTION COEFFICIENTS IN THE SEA. In oceanography thegreater interest is attached to the rate at which downward-travelingradiation decreases. The rate of decre~e can be defined by means of acoefficient similar to the absorption coefficient:
XA= 2.30 (log Ik,. – log Ih,($+l)),
where 1A,,and 1~,(,~1)represent the radiation intensities of wave length Aon horizontal surfaces at the depths z and (z -i- 1) m. Different nameshave been proposed for this coefficient, such as transrnissive exponent(Clarke, 1933) or extinction coefficient (Pettersson, 1936a). The lattername has been widely used and will be employed h’ere, although theprocess by which the intensity of radiation is reduced will be calledabsorption. The absorption of radiation in the sea is complicated bythe increased scattering due to suspended particles and by the presenceof dissolved colored substances. The extinction coefficient of radiationof a given wave length therefore varies within wide limits from onelocality to another, and in a given locality it varies with depth and time.
The first crude measurementsof absorption in the visible part of the’spectrum were made by lowering a white disc of standard size (30 cm), theSecchi disc, and observing the depth at which the disc disappeared fromsight. Comparisons with recent exact measurementsby other methodshave shown that in the English Channel the extinction coefficient ofvisible rays can roughly be attained from the formula x = 1.?/D, whereB is the maximum depth of visibility in meters, as determined by theSecchi disc (Poole and Atkins, 1929).
The next step in the investigation of the absorption of radiation in seawater was made by subsurface exposure of photographic plates enclosedin watertight containers. Such experiments, which were conductedby Helltmd-Hansen (1912a) on the Michuel SunsExpedition by exposingpanchromatic plates at different depths in the vicinity of the Azores,showed that photographic plates were blackened at very great depths.
PHYSICAL PROPERTIESOF SEA WATER 83
A plate exposed for 40 minutes at a depth of 500 m showed strongblackening, another exposed for 80 minutes at 1000m was also blackened,but a third plate which was exposed for 120 minutes at 1700 m showedno effect whatever. These experiments were made at noon on June 6,1910, with a clear sky. At 500 m it wiw found that the radiation had adistinct downward dwection, because plates exposed at the top of a cubewere much more strongly blackened than those exposed on the sides,
In other experiments colored filterswere used; which showed that thered portion of the spectrum was rapidly absorbed, whereas the green andblue rays penetrated to much greater depths. Quantitative results as tothe absorption at different wave lengths were obtained by using spectro-photometers (Knudsen, 1922), but the methods were laborious and notsensitive enough to be used at great d~pths.
The introduction in recent years of photoelectric cells has madepossible rapid and accurate determinations of extinction coefficients indifferent parts of the spectrum. A number of different instrumentshavebeen and still are in use, but a standardized technique has been proposedby a committee of the International Council for the Exploration of theSea (Atkins et al, 1938). Because of the wide variation in absorptionat different wave lengths, efforts have been directed toward measuringexactly the absorption in narrow spectral bands. The determinationsare accomplished by lowering stepwise a photoelectric or photronic cellenclosed in a watertight container and provided with suitably coloredfilters, and by observing on deck the photoelectric current by means of asensitive galvanometersor a suitable bridge circuit. The measurementsmust be made at constant incident light either on clear, sunny days oron days when the sky is uniformly overcast, because the rapid variationsin incident light that occur on days with scattered clotyis will naturallylead to erroneous results as to the absorption. To determine the per-
‘ centage amount of radiation that reaches a certain depth, it is necessaryto make simultaneous readings of the incident radiation on board ship.For the different precautions that have to be taken, reference is made topapers listed in the bibliography, particularly to Atkins et al (1938),
These methods give information as to the absorption in layers ofdefinite thickness. Instruments for measurements of the transparencyof sea water at given depths and of the scattering of light have beendesigned by H. Pettersson (1936b) and have been used for determiningrelative values. It has been demonstrated, particularly, t~at at bound-ary surfaces sharp variations in transparency and scattering occur. Thestudy of the absorption of radiation in the sea is in rapid progress, andseveral of the following generalizations are therefore presented withreservations.
The main results as to the character of the extinction coefficientin the sea of radiation of different wave lengths can be well illustrated
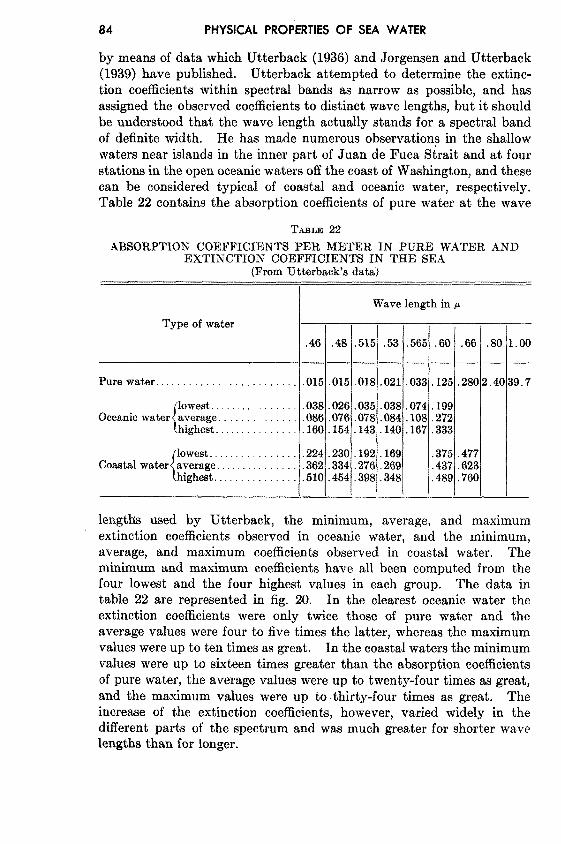
84 PHYSICAL PROPERTIESOF SEA WATER
by means of data which Utterback (1936) and Jorgensen and Utterback(1939) have published. Utterback attempted to determine the extinc-tion coefficients within spectral bands as narrow as possible, and hasassigned the observed coefficients to distinct wave lengths, but it shouldbe understood that the wave length actually stands for a spectral bandof definite width. He has made numerous observations in the shallowwaters near islands in the inner part of Juan de Fuca Strait and at fourstations in the open oceanic waters off the coast of Washington, and thesecan be considered typical of coastal and oceanic water, respectively.Table 22 contains the absorption coefficients of pure water at the wave
TABLE22ABSORPTION COEFFICIENTS PER METER IN PURE WATER AND
EXTINCTION COEFFICIENTS IN THE SEA(From Utterback’s data)
IWave length in w
Type of water
.46 .48 .515 .53 .565 .60 ,66 .80— — — — — — — —
Pure water . . . . . . . . . . . . . . . . . . . . . . . . . .015 .015 .018 .021 ,033 .125 .280 2.40
{
lowest..,...,, . . . .038 .026 .035 .038 .074 .199Oceanicwater average, ., . . . .086 .076 .078 .084 .108 .272
highest.,, .,, ,., . . . . . . .160 .154 .143 .140 .167 .333
‘lowest. . . . . . . . . . . . . . . . .224 .230 .192 .169J
.375 .477Coastal water average. . . . . . . . . . . . . .362 .334 .276 .269
\highest . . . . . . . . . . . . . . . .510 .454 .398 .348.437 .623,489 .760
1.00
39.7
lengths used by Utterback, the minimum, average, and maximumextinction coefficients observed in oceanic water, and the minimum,average, and maximum coefficients observed in coastal water. Theminimum and maximum coefficients have all been computed from thefour lowest and the four highest values in each group. The data intable 22 are represented in fig. 20. In the clearest oceanic water theextinction coefficients were only twice those of pure water and theaverage values were four to five times the latter, whereas the maximumvalues were up to ten times as great. In the coastal waters the minimumvalues were up to sixteen times greater than the absorption coefficientsof pure water, the average values were up to twenty-four times as great,and the maximum values were up to thirty-four times as great. Theincrease of the extinction coefficients, however, varied widely in thedifferent parts of the spectrum and was much greater for shorter wavelengths than for longer.
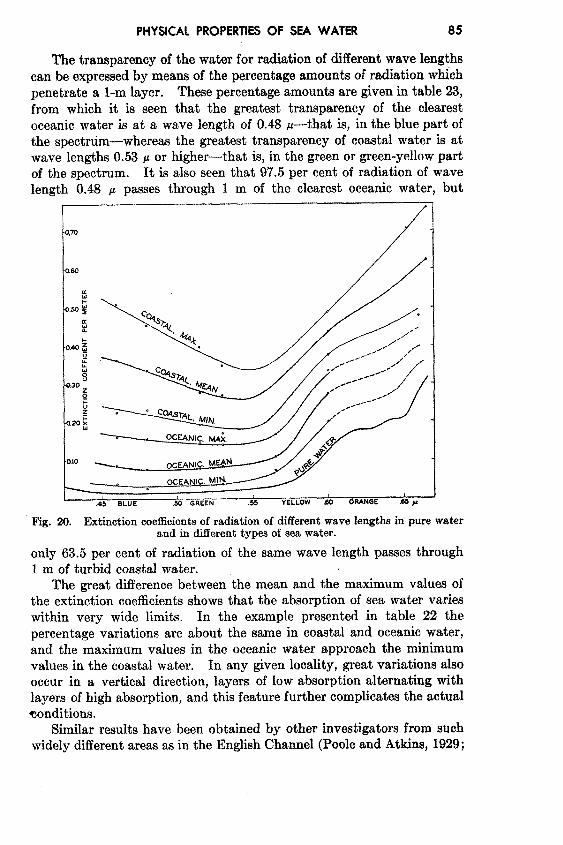
PHYSICAL PROPERTIESOF SEA WATER 85
The transparency of the water for radiation of different wave lengthscan be expressedby me$ns of the percentage amounts of radiation whichpenetrate a l-m layer. These percentage amounts are given in table 23,from which it is seen that the greatest transparency of the clearestoceanic water is at a wave length of 0.48 ~—that is, in the blue part ofthe ~pectrum—whereasthe greatest transparency of coastal water is atwave lengths 0.53 P or higher—that is, in the green or green-yellow partof the spectrum. It is also seen that 97.5 per cent of radiation of wavelength 0,48 IJ passes through 1 m of the clearest oceanic water, but
/1
/1I
MO
~
i-.0.s4$
a&
O.AO :
.45 OLUE ,50 GREEN .35 YELLOW .60 ORANGE ~P
Fig. 20. Extinction coefficientsof radiation of different wave lengths in pure waterand in different types of sea water.
only 63.5 per cent of radiation of the same wave length passes through1 m of turbid coastal water.
The great difference between the mean and the maximum values ofthe extinction coefficients shows that the absorption of sea water varieswithin very wide limits. In the example presented in table 22 thepercentage variations are about the same in coastal and oceanic water,and the maximum values in the oceanic water approach the minimumvalues in the coastal water. In any given locality, great variations alsooccur in a vertical direction, layers of low absorption alternating withlayers of high absorption, and thk feature further complicates the actualconditions.
Similar resuhtshave been obtained by other investigators from suchwidely dhlerent areas as in the English Channel (Poole and Atkins, 1929;
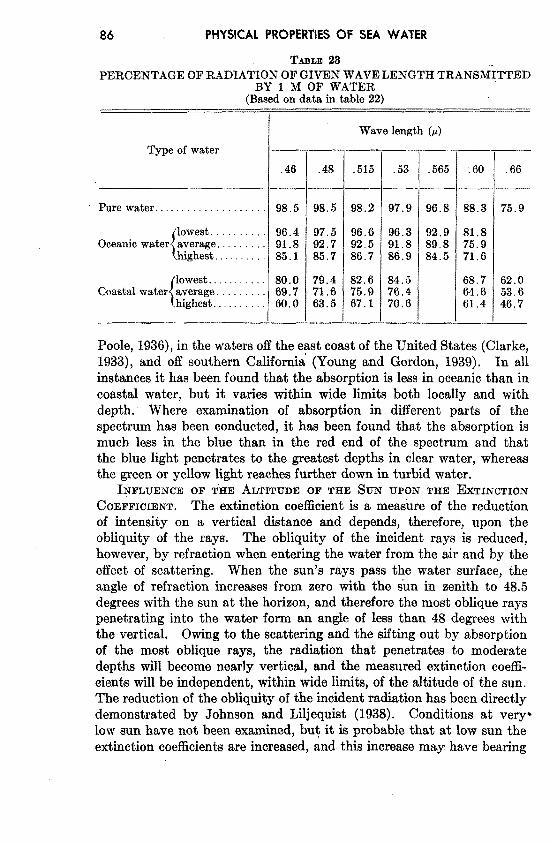
86 8 PHYSICAL PROPERTIESOF SEA WATER
TABLE 23PERCENTAGE OF RADIATION OF GIVEN WAVELENGTH TRANSMITTED
BY 1 M OF WATER(Based on data in table 22)
Type of water —
I .46
k———Pure water . . . . . . . . . . . . . . . . . . . . 98.5
Jlov?(?st. . . . . . . . 964Oceanicwater average.. . . . 91.8
lhighest . . . . . . 85.1
{
lowest. . . . . . . . . . . 80.0Coastal water average. . . . . . . 69.7
highest. . . . . . . . . . 60.0
.48
98.5
97.592.785.7
79.471.663.5
Wave length (M)
.515
98.2
96.692.586.7
82.675.967.1
.53
97.9
96.391.886.9
84.576.470.6
.565
96.8
92.989.884.5
.60
88.3
81>875.971.6
68,764.661.4
.66
75.9
62.053.646.7
Poole, 1936), in the waters off the east coast of the United States (Clarke,1933), and off southern California (Young and Gordon, 1939). In allinstances it has been found that the absorption is less in oceanic than incoastal water, but it varies within wide limits both locally and withdepth. Where examination of absorption in different parts of thespectrum has been conducted, it has been found that the absorption ismuch less in the blue than in the red end of the spectrum and thatthe blue light penetrates to the greatest depths in clear water, whereasthe green or yellow light reaches further down in turbid water.
INFLUENCE OF THE ALTITUDE OF THE SUN UFON THE EXTINCTIONCOEFFICIENT, The extinction coefficient is a measure of the reductionof intensity on a vertical distance and depends, therefore, upon theobliquity of the rays. The obliquity of the incident rays is reduced,however, by refraction when entering the wster from the air and by theeffect of scattering. When the sun’s rays paes the water surface, theangle of refraction increases from zero with the sun in zenith to 48.5degrees with the sun at the horizon, smd therefore the most oblique rayspenetrating into the water form an angle of less than 48 degrees withthe vertical. Owing to the scattering and the sifting out by absorptionof the most oblique rays, the radiation that penetrates to moderatedepths will become nearly vertical, and the measured extinction coeffi-cients will be independent, within wide limits, of the altitude of the sun.The reduction of the obliquity of the incident radiation has been directlydemonstrated by Johnson and Liljequist (1938). Conditions at very*low sun have not been examined, but it is probable that at low sun theextinction coefficients are increased, and this increase may have bearing
PHYSICAL PROPERTiESOF SEA WATER 87
upon the diurnal variation of the incoming energy at greater depths(p. 779).
THE SCATTERINGOF RADIATION IN THE SEA. The scattering ofradiation has been examined both directly by means of Petterssonfsscattering meter (p. 83) and by measuring the relative intensities ofdownward- and upward-traveling radiation or vertical and horizontalradiation. Jorgensen and Utterback (1939) found that in coastal watersthe intensity of the upward-traveling radiation ranged for the shortwave lengths from 1 to 3 per cent of that of the downward-travelingradiation, and for the long wave lengths from 0.5 to 2 per cent. Inoceanic water Utterback (1936) found ratios between 1 and 2 per centat the shorter wave lengths. Clarke (1936) found considerably highervalues in shallow coastal waters, but similar values in the deep basinof the Gulf of Maine.
The relative intensitiesof horizontal and vertical radiation have beenmeasuredby Clarke off the east coast of the United States and by Pooleand Atkins in the English Channel. The greatest value found by Clarkewas 17 per cent, but Poole and Atkins (1929) have reported an averagevalue of 50 per cent for the horizontal radiation down to a depth of 25 min the English Channel. The conclusion that can be drawn from theseexperiments is that the subsurface illumination becomes more and morediffuse with increasing depth, particularly in coastal waters, but that thedirectional character of the radiation is lost only slowly. This conclusionis particularly true in clear oceanic water, where Helland-IIansen (1912a)found that the vertical radiation was distinctly more intense than thehorizontal at a depth of 500 m (p. 82).
CAUSE OF”THEGREAT EXTINCTIONCOEFFICIENTSIN THE SEA. Thegreat extinction coefficients in the sea as compared to those of absolutelypure water are as a rule ascribed to the presence of minute particleswhich cause scattering and reflection of the radiation and which them-selves absorb radiation. If such particles -are small compared to thewave length, h, of the radiation, the scattering will be proportional,according to Lord Rayleigh, to X–4, and the effect therefore at wavelength, say, .46 JLwill be 2.86 times greater than at wave length .60 M.This selective effect leads to a shift toward longer wave lengths in theregion of minimum absorption.
Clarke and James (1939) found that the increased absorption inoceanic water was chiefly cmsed by suspensoids that could be removedby means of a “fine” Berkefeld filter, and that these suspensoids werelargely nonselective in their effect. Utterback’s data (1936) indicated,on the other hand, that the increased absorption in oceanic water is atleast in part due to selective scattering, because at short wave lengthsthe extinction coefficients were increwed more, above those of purewater, than at longer wave lengths (table 22). Kane (1938) is of the
88 PHYSICAL PROPERTIESOF SEA WATER
opinion that selective scattering is of dominant importance (p. 89),but the question is not yet settled as to the mechanism which leads toincreased absorption in oceanic water as compared to pure water. Thefact that even in the clearest oceanic water the absorption is greater thanin pure water indicates, however, that finely suspended matter is alwayspresent. One could state that the ocean waters always contain dust.
The increase of the absorption coefficients in coastal waters appearsto be due in part to another process. Clarke and Jarnes (1939) concludefrom their examination that in coastal water both suspensoid and “filter-passing” materials are effective in increasing the absorption, and thateach exerts a highly selective action, with greatest absorption at theshorter wave lengths. These great absorption at the shorter wavelengths are demonstrated by Utterback’s measurements (table 22).Clarke does not discuss the nature of the “filter-passing” material, butKane (1938) has shown that in sea water water-soluble pigments of yellowcolor are present. These pigments appear to be related to the humicacids, but their chemical composition has not been thoroughly examined,for which reason Kane calls them “yellow substance.” This yellowsubstance seems to occur in greatest abundance in coastal areas, butKane has demonstrated its presence in the open ocean as well andbelieves that it represents a fairly stable metabolic product relatedto the phytoplankton of the sea. The selective absorption bf this yellowsubstance may then be responsible, in part, for the character of theabsorption in coastal water and for shift of the band of minimum absorp-tion toward longer wave lengths.
It has not been possible anywhere to demonstrate any direct influenceof phytoplankton populations on the absorption, but very dense popula-tions may cut down the transparency. At present it appears that themajor increase of absorption of sea water over that of pure water is dueto two factors: the presence of minute suspended particles, and thepresence of dissolved “yellow substance.” The former factor dominatesin oceanic waters, and the latter is particularly important in coastalwaters.
THE COLOR OF THE SEA. The color of the sea, as it appears to anobserver ashore or on board a vessel, varies from a deep blue to an intensegreen, and is in certain circumstances brown or brown-red. The bluewaters are typical of the open oceans, particularly in middle and lowerlatitudes, whereas the green water is more common in coastal areas, andthe brown or “red” water is observed in coastal regions only.
The color of the sea has been examined by means of a Secchi disk(p. 82) by observing the color that the water appears to have when seenagainst the white submerged surface of the disc. This color is recordedaccording to a specially prepared color scale, the” Forel scale” (Kriimmel,1907). The method is a rough one and the scale is not adapted for
PHYSICAL PROPERTIESOF SEA WATER 89
recording the extreme colors in coseta.1 waters. In order to obtain moreexact results, Granquist, working in the Finnish waters, used a long tubethat was blackened on the inside, and this type of instrument has beengreatly improved by Kane (1938).
Kane has critically reviewed earlier theories as to the causes of thecolor of the sea and arrives at conclusions that appear to be consistentwith all available observations. The blue color is explained, in agree-ment with earlier theories, as a result of scattering against the watermolecules themselves, or against suspended minute particlessmallerthanthe shortest visible wave lengths. The blue color of the water is there-fore comparable to the blue color of the sky, The transition from blueto green cannot be explained, however, as a result of scattering, andKane concludes that this transition is due to the above-mentioned “ yel-low substance,” pointing out that the combination of the yellow colorand the ~{natural” blue of the water leads to a scale of green colors asobserved at’ sea. ‘Fluorescence may contribute to the coloring butappears to be of minor importance.
The color of suspended larger particles, if present in gieat abundance,can give color to the sea. In thk case the color is not determinedby the optical properties of the water or by dissolved matter, but bythe colors of the suspendedinorganic or organic particles, and the water isappropriately called “discolored.” Discoloration can be observedwhen large quantities of finely suspended mineral particles are carriedinto the sea after heavy rainfall, or when very large populations, severalmillion cells per liter, of certain species of algae or dinofiagellates arepresent very ‘near the surface. Thus, the “red water” (often morebrown than red) which is quite frequently observed in many areas andafter which the Red Sea and the Vermilion Sea (Gulf of California) havebeen named is due to abundance of certain algae (in the Red Sea, Tricho-desmium erythraeum) or dinofiagellates. The discoloration, beautifulexamples of which have been given by Gunther (1936), is, however, aphenomenon of the typical coastal waters, the green colors beingfrequent in waters neqr the coast or at sea in high latitudes, and theblues charac teristic of the open ocean in middle and lower latitudes(fig. 214, p. 784).
Eddy Conductivity, Diffusivity, and Viscosity
In the preceding discussion it has been repeatedly stated that thecoefficients of heat conduction, diffusion, and viscosity that have beendealt with so far are applicable only if the water is at rest or in Iaminarflow. By laminarflow is understood a state in which sheets (laminae) ofliquids move in an orderly manner such that random local fluctuationsof velocity do not occur. However, the molecules of the liquid, includlngthose of dissolved substances, move at random, and, owing to this
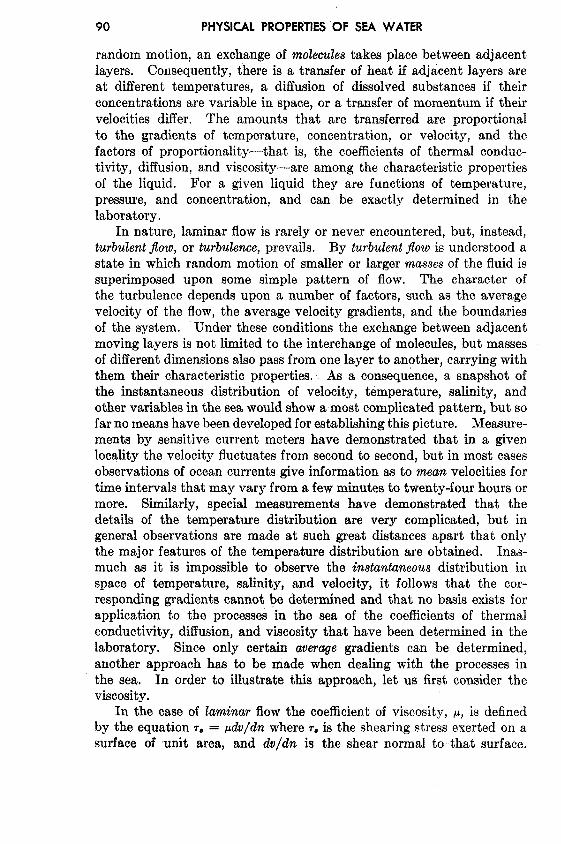
90 PHYSICAL PROPERTIESOF SEA WATER
random motion, an exchange of moleculestakes place between adjacentlayers. Consequently, there is a transfer of heat if adjacent layers areat different temperatures, a diffusion of dissolved substances if theirconcentrations are variable in space, or a transfer of momentum if theirvelocities differ. The amounts that are transferred are proportionalto the gradients of temperature, concentration, or velocity, and thefactors of proportionality—that is, the coefficients of thermal conduc-tivity, diffusion, and viscosity—are among the characteristic propertiesof the liquid. For a given liquid they are functions of temperature,pressure, and concentration, and can be exactly determined in thelaboratory.
In nature, laminar flow is rarely or never encountered, but, instead,turbulent flow, or turbulence, prevails. By turbulent$OWis understood astate in which random motion of smaller or larger massesof the fluid issuperimposed upon some simple pattern of flow. The character ofthe turbulence depends upon a number of factors, such as the averagevelocity of the flow, the average velocity gradients, and the boundariesof the system. Under these conditions the exchange between adjacentmoving layers is not limited to the interchange of molecules, but massesof different dimensionsalso pass from one layer to another, carrying withthem their characteristic properties. As a consequence, a snapshot ofthe instantaneous distribution of velocity, temperature, salinity, andother variables in the sea would show a most complicated pattern, but sofar no meanshave been developed for establishingthis picture. Measure-ments by sensitive current meters have demonstrated that in a givenlocality the velocity fluctuates from second to second, but in most casesobservations of ocean currents give information as to mean velocities fortime intervals that may vary from a few minutes to twenty-four hours ormore. Similarly, special measurements have demonstrated that thedetails of the temperature d~tribution are very complicated, but ingeneral observations me made at such great distances apart that onlythe major features of the temperature distribution are obtained. Inas-much as it is impossible to observe the instantaneous distribution inspace of temperature, salinity, and velocity, it follows that the cor-responding gradients cannot be determined and that no basis exists forapplication to the processes ‘in the sea of the coefficients of thermalconductivity, diffusion, and viscosity that have been determined in thelaboratory. Since only certain averWe gradients can be determined,another approach has to be made when dealing with the processes inthe sea. In order to illustrate this approach, let us first consider theviscosity.
In the case of laminar flow the coefficient of viscosity, H, is definedby the equation ra = pdv/dn where T. is the shearing stress exerted on asurface of unit area, and dv/dn is the shear normal to that surface.
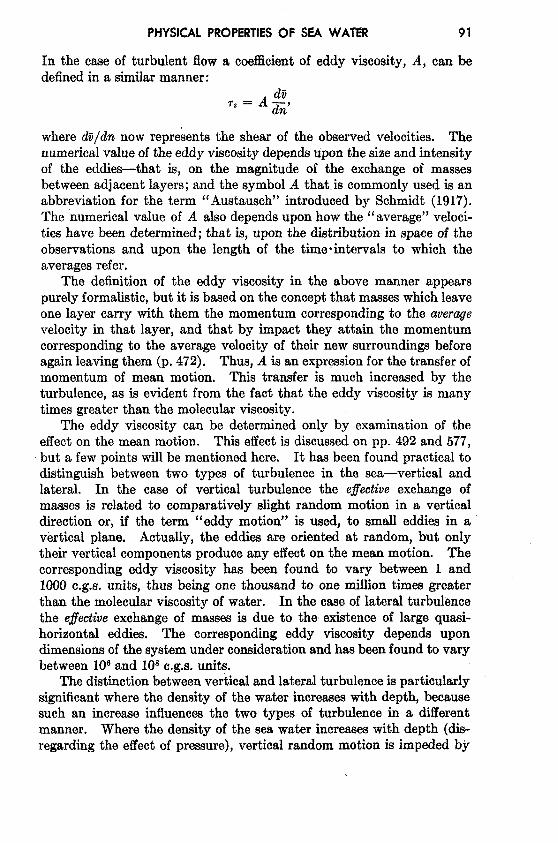
PHYSICAL PROPERTIESOF SEA WATER 91
In the case of turbulent flow a coefficient of eddy viscosity, A, can bedefined in a similar manner:
,*=A$,
where do/dn now represents the shear of the observed velocities. Thenumerical value of the eddy viscosity depends upon the size and intensityof the eddies—that is, on the magnitude of the exchange of massesbetween adjacent layers; and the symbol A that.is commonly used is anabbreviation for the term “ Austausch” introduced by Schmidt (1917).The numerical value of A also depends upon how the “average” veloci-ties have been determined; that is, upon the distribution in space of theobservations and upon the length of the time ● intervals to which theaverages refer.
The definition of the eddy viscosity in the above manner appearspurely formalistic, but it is based on the concept that masseswhich leaveone layer carry with them the momentum corresponding to the avercqevelocity in that layer, and that by impact they attain the momentumcorresponding to the average velocity of their new surroundings beforeagain leaving them (p. 472), Thus, A is an expressionfor the transfer ofmomentum of mean motion. This transfer is much increased by theturbulence, as is evident from the fact that the eddy viscosity is manytimes greater than the molecular viscosity.
The eddy viscosity can be determined only by examination of theeffect on the mean motion. This effect is discussed on pp. 492 and 577,but a few points will be mentioned here. It has been found practical todistinguish between two types of turbulence in the sea—vertical andlateral, In the case of vertical turbulence the e$’ecti~eexchange ofmaases is related to comparatively slight random motion in a verticaldirection or, if the term “eddy motion” is used, to small eddies in avertical plane. Actually, the eddies are oriented at random, but onlytheir vertical components produce any effect on the mean motion. Thecorresponding eddy viscosity has been found to vary between 1 and1000 c.g.s. units, thus being one thousand to one million times greaterthan the molecular viscosity of water. In the cwe of lateral turbulencethe eflectiveexchange of masses is due to the existence of large quasi-horizontal eddies. The corresponding eddy viscosity depends upondimensionsof the system under consideration and has been found to varybetween 10@and 108c.g.s. units.
The distinction between vertical and lateral turbulence is particularlysignificant where the density of the water increases with depth, becausesuch an increase influences the two types of turbulence in a differentmanner. Where the density of the sea water increases with depth (dis-regarding the effect of pressure), vertical random motion is impeded by
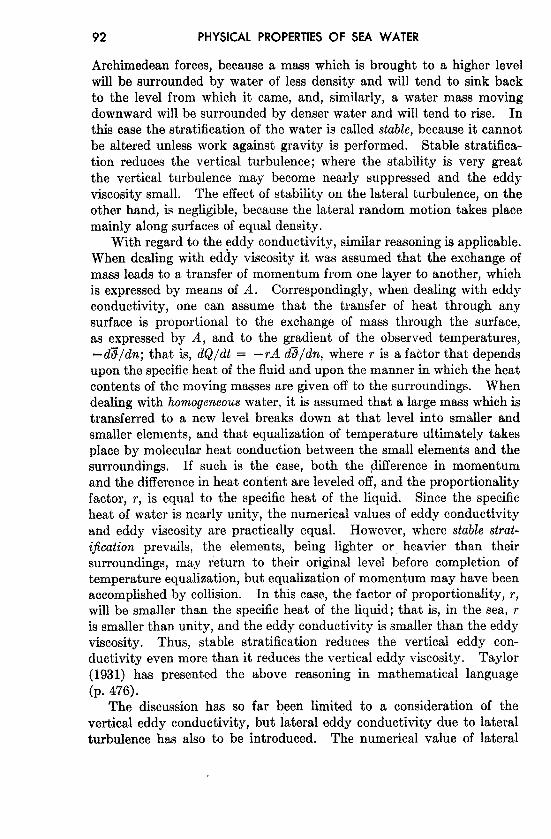
92 PHYSICAL PROPERTIESOF SEA WATER
Archimedean forces, because a mass which is brought to a higher levelwill be surrounded by water of less density and will tend to sink backto the level from which it came, and, similarly, a water mass movingdownward will be surrounded by denser water and will tend to rise. Inthis case the stratification of the water is called stable, because it cannotbe altered unless work against gravity is performed. Stable stratifica-tion reduces the vertical turbulence; where the stability is very greatthe vertical turbulence may become nearly suppressed and the eddyviscosity small. The effect of stability on the lateral turbulence, on theother hand, is negligible, because the lateral random motion takes placemainly along surfaces of equal density.
With regard to the ~ddy conductivity, similar reasoning is applicable.When dealing with eddy viscosity it was assumed that the exchange ofmass leads to a transfer of momentum from one layer to another, whichis expressed by means of A. Correspondingly, when dealing with eddyconductivity, one can assume that the transfer of heat through anysurface is proportional to the exchange of mass through the surface,as expressed by A, and to the gradient of the observed temperatures,-d3/dn; that is, dQ/dt = – rA d8/dn, where r is a factor that dependsupon the specific heat of the fluid and upon the manner in which the heatcontents of the moving masses are given off to the surroundings. Whendealing with homogeneous water, it is assumed that a large mass which istransferred to a new level breaks down at that level into smaller andsmaller elements, and that equalization of temperature ultimately takesplace by molecular heat conduction between the small elements and thesurroundings. If such is the case, both the difference in momentumand the difference in heat content are leveled off, and the proportionalityfactor, r, is equal to the specific heat of the liquid. Since the specificheat of water is nearly unity, the numerical values of eddy conductivityand eddy viscosity are practically equal. However, where stable strat-ification prevails, the elements, being lighter or heavier than theirsurroundings, may return to their original level before completion oftemperature equalization, but equalization of momentum may have beenaccomplished by collision. In this case, the factor of proportionality, r,will be smaller thtm the specific heat of the liquid; that is, in the sea, ris smaller than unity, and the eddy conductivity is smaller than the eddyviscosity. Thus, stable stratification reduces the vertical eddy con-ductivity even more than it reduces the vertical eddy viscosity. Taylor(1931) has presented the above reasoning in mathematical language(p. 476).
The discussion has so far been limited to a consideration of thevertical eddy conductivity, but lateral eddy conductivity due to lateralturbulence has also to be introduced. The numerical value of lateral
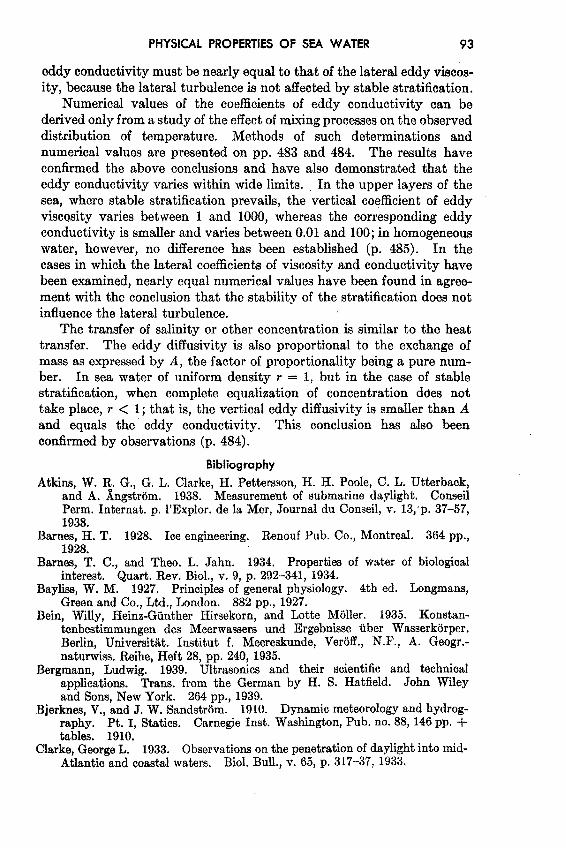
PHYSICAL PROPERTIESOF SEA WATER 93
eddy conductivity must be nearly equal to that of the lateral eddy viscos-ity, because the lateral turbulence is not affeeted by stable stratification.
Numerical values of the coefficients of eddy conductivity can bederived only from a study of the effect of mixing processeson the observeddistribution of temperature. Methods of such determinations andnumerical values are presented on pp. 483 and 484. The results haveconfirmed the above conclusions and have also demonstrated that theeddy conductivity varies within wide limits. In the upper layers of thesea, where stable stratification prevails, the vertical coefficient of eddyviscosity varies between 1 and 1000, whereas the corresponding eddyconductivity is smallerand varies between 0.01 and 100; in homogeneouswater, however, no difference has been established (p. 485). In thecases in which the lateral coefficients of viscosity and conductivity havebeen examined, nearly equal numerical values have been found in agree-ment with the conclusion that the stability of the stratification does notinfluence the lateral turbulence.
The transfer of salinity or other concentration is similar to the heattransfer. The eddy diffusivity is also proportional to the exchange ofmass as expressed by A, the factor of proportionality y being a pure num-ber. In sea water of uniform density r = 1, but in the case of stablestratification, when complete equalization of concentration does nottake place, r < 1; that is, the vertical eddy diffusivity is smailer than Aand equals the eddy conductivity. Thk conclusion has also beenconfirmed by observations (p. 484).
Bibliography
Atkins, W. R. G., G. L. Clarke, H. Pettersson, H. H. Poole, C. L. Utterback,and A. Angstrom, 1938. Measurement of submarine daylight. ConeeilPerm. Internat. p. l’Explor. de la Mer, Journal du Conseil, v. 13, p. 37-57,1938.
Barnes, H. T. 1928. Ice engineering. Renouf Pub. Co., Montreal. 364 pp.,1928.
Barnes, T. C., and Theo. L. Jahn. 1934. Properties of water of biologicalinterest. Quart. Rev. Blol., v. 9, p. 292-341, 1934.
Bayliss, W, M. 1927. Principles of general physiology. 4th ed. Longmans,Green and Co., Ltd., London. 882 pp., 1927.
Bein, Winy, Heinz-Gunther Hirsekorn, and Lotte Moller. 1935. Konstan-tenbestimmungen des Meerwassers und Ergebnisse uber Wasserkorper.Berlin, Universitiit. Institut f. Meereskunde, Veroff., N.F., A. Geogr.-naturwiss. Reihe, Heft 28, pp. 240, 1935.
Bergmann, Ludwig. 1939. Ultrasonics and their scientific and technicalapplications. Trans. from the German by H. S. Hatfield. John Wileyand Sons, New York. 264 pp., 1939.
Bjerknes, V., and J. W. Sandstrom. 1910. Dynamic meteorology and hydrog-raphy. Pt. I, Statics. Carnegie Inst. Washington, Pub. no. 88, 146 pp. +tables. 1910,
Clarke, George L. 1933. Observations on the penetration of daylight into mid-Atlantic and coastal waters, BIO1.Bull,, V. 65, p. 317-37, 1933.
94 PHYSICAL PROPERTIESOF SEA WATER
1936.Light penetration in the western North Atlantic and itsapplication to biological problems, Conseil Perm. Intern. p. l’Explor. de laMer, Rapp. et Proc,-Verb., v, 101, pt. 2, no. 3, 14 pp., 1936.
Clarke, George L,, and Harry R. James. 1939. Laboratory analysis of theselective absorption of light by sea water. Optical Sot. Amer., Jour., V. 29,p. 43-55, 1939.
Cummings, N. W. 1932. A sinker method for the determination of specificgravities. Scripps Inst. Oceanogr., Univ. Calif., Bull., tech. ser., v. 3,p. 101-18, 1932.
Dietrich, G. 1939. Dle Absorption der Strahlung im reinen Wasser und imreinen Meerwasser. Ann. d. Hydrogr. u. Mar. Meteor,, Bd. 67, S.411-17,1939.
Dorsey, N. Ernest. 1940. Properties of ordinary water-substance. Amer.Chem. Sot., Monograph Ser. No. 81. Reinhold Pub. Corp., New York.673 pp., 1940.
Ekman, V. W. 1908. Die Zusammendruckbarkeit des Meerwassers. ConseilPerm, Intern. p. l’Explor. de la Mer, Pub. de Circonetance, No. 43, 47 pp.,1908.
1914. Der adiabatische Temperaturgradient im Meere. Ann.d. Hydrogr. u, Mar. Meteor., Bd. 42, S.340-44, 1914.
Fleming, R, H., and Roger Revelle, 1939. Physical processes in the ocean.P. 48-141 in Recent marine sediments, A symposium. Parker D. Trask, Ed.Amer. Assn. Petroleum Geol., Tulsa, Okla. 736 pp., 1939,
I?orch, C., Martin Knudsen, und S. P. L. Sorensen. 1902. Berichte uber dieKohstantenbestimmungen zur Aufstellung der hydrographkchen Tabellen.D. Kgl. Danske Videnak. Selsk. Skrifter, 6. Raekke, naturvidensk. ogmathem., Afd X11.1, 151 pp., 1902.
Gunther, E. R. 1936. A report on oceanographical investigations in the Perucoastal current. Discovery Repts., v, 13, p. 107-276, 1936.
Hartmann, G. K., and Alfred B. Focke. 1940. Absorption of supersonicwaves in water and in aqueous solutions. Phys. Rev., v. 57, p. 221-25,1940.
Harvey, H. W. 1928. Biological chemistry and physics of sea water. Cam-bridge Univ. Press, London, 194 pp., 1928.
Heck, N. H., and Jerry H. Service. 1924, Velocity of sound in sea water.U. S. Coast and Geod. Surv., Spec. Pub. no. 108, 27 pp., 1924.
Helland-Hansen, B. 1912a. Physical oceanography. Ch. 5, p, 21O–3O6inMurray and Hjort, Depths of the ocean. Macmillan and Co., London,821 pp., 1912.
1912b. The ocean waters, An introduction to physical oceanog-raphy. Intern. Rev. d. Hydrobiol., Suppl. to Bd. III, Ser. 1, H. 2, 84 pp.,1912. Leipzig.
1930. Physical oceanography and meteorology. MichaelA’an North Atlantic Deep-Sea Exped., 1910, Rept. Sci. Results, V, 1,art. 2, 217 pp., 1930.
Henderson, L. J. 1913. The fitness of the environment. Macmillan Co,,New York, 317 pp., 1913.
Hesselberg, Th., and H. U. Sverdrup. 1914. Die Stabllit5tsverh<nisse desSeewassers bei vertikalen Verschiebungen, Bergens Museums Aarbok, no.14, 17 pp., 1914-15.
Hydrographic Review, Published by the International Hydrographic Bureau,Monaco. v. 1- , 1923-to date.

PHYSICAL PROPERTIESOF SEA WATER 95
International Association of Physical Oceanography (Assn. d’006anogr. Phys.)Union G60d. et G60phys, Intern. 1939. Report of the Committee onChemical Methods and Units. Presented at 7th General Assembly,Washington, D. C?., 1939. Publication Scientifique. In press.
International critical tables of numerical data, physics, chemistry and technologyPublished for Nat. Research Council by McGraw-Hill Co., New York.7 volumes, 1926-1930.
Jacobsen, J. P., and Martin Knudsen. 1940. Urnormal 1937 or primarystandard sea-water 1937. Union G60d. et G60phys. Intern., Assn. d’Oc6an-ographle, Pub. sci., no. 7, 38 pp., Liverpool, 1940.
Johnson, Nds G., and G. Liljequist. 1938. On the angular distribution ofsubmarine daylight and on the total submarine illumination. Svenskal#$ogr.-Biologiska Kommiss. Skrifter. N.S., Hydrografi no. 14, 15 pp.,
.Johnstone, James. 1928. An introduction to oceanography. Univ. Press,
Liverpool. 368 pp., 1928.Jorgensen, Wilhelm, and C. L. Utterback. 1939. Periodic changes in spectral
scattering and spectral transmission of daylight in tidal water. Jour.Marine Research, v. 2, p. 30-37, 1939.
Kane, K. 1938. Zum Problem der Meereswasserfarbe. Ann. d. Hydrogr. undMar. Meteor,, Bd. 66, S,1-13, 1938.
Knudsen, Martin. 1901. Hydrographical tables. G. E. C. Gad, Copenhagen,63 pp., 1901.
1903. Gefrierpunkttabelle ftir Meerwasser. Conseil Perm.Intern. p, l’Explor. de la Mer, Pub. de Circonetance, no. 5, p. 11-13, 1903.
1922. On measurement of the penetration of light into the sea.Conseil Perm, Intern. p. l’Explor. de la Mer, Pub. de Chconstance, no. 76,16 pp., ~922.
Kriimmel, Otto. 1907. Handbuch der Ozeanograpbie: Bd. 1, Die rihndch,chemisehen und physikalischen Verhiiltniese des Meeres. J. Engelhorn.Stuttgart. 526 pp., 1907.
Kuwahara, Susumu. 1939. Velocity of sound in sea water and calculationof the velocity for use in sonic sounding, Hy@ogr. Rev., v. 16, no. 2, p.123–40,1939. Monaco.
Langevin,P. 1924. The employmentof ultra-sonicwavesfor echo sounding.Hydrogr.Rev., v. 2, no. 1, p. 57-91, 1924. Monaco.
Lyman, John, and Richard H, Fleming. 1940. Compositionof sea water.Jour. MarineResearch,v. 3, p. 134-46, 1940.
Malmgren, Finn. 1927. On the propertiesof sea-ice. Norwegian NorthPolarExped.withtheMawi 1918-1925,Sci. Results, v. 1, no. 5, 67 pp.,1927.
Matthews,Donald J. 1923. Physicaloceanography. v. 3, p. 665-692in Adictionaryof appliedphysics,SirRichardGlazebrook,Ed. MacmillanandCo,, London,1923.
1927. Tables of the velocity of sound in pure water and seawater for use in echo-sounding and sound-ranging. British Admiralty,Hydrogr. Dept., H.D. no. 282, 29 pp., 1927.
1932. Tables of the determination of density of sea water undernormal pressure, fi’igma-t. Conseil Perm. Intern. p. l’Explor. de la Mer.Copenhagen. 59 pp., 1932.
1938. Tables for calculating the specific volume of sea waterunder pressure. Conseil Perm. Intern. p. l’Expl, de la Mer. Copenhagen.67 pp., 1938.
96 PHYSICAL PROPERTIESOF SEA WATER
NfcEwen, Gee. F. 1929. Tables to facilitate dynamic computations of oceancurrents according to the Bjerknes circulation theory. Scripps Inst.Oceanogr., Univ. Calif. Mimeographed, 1929. La Jolla.
Miyake, Y. 1939a. Chemical studies of th~ western Pacific Ocean. III.Freezing point, osmotic pressure, boiling point and vapour pressure of seawater. Chem. Sot. Japan, Bull., v. 14, no. 3, p. 58-62, 1939.
— 1939b. Chemical studies of the westernPacific Ocean. IV. Therefractive index of sea water. Chem. Sot. Japan, v. 14, no. 6, p. 239-42,1939.
Nansen, Fridtjof. 1900. On hydrometers and the surface tension of liquids.Norwegian North Polar Exped. 1893-1896, Sci. Results, v. 3, no. 10, 88 pp.,1900.
Pettersson, Hans. 1936a. Das Licht im Meer. Bioklim. Beiblii.tter, Heft 1,11 pp., 1936,
1936b. The transparency of sea water. Conseil Perm, Intern.p. l’Explor. de la Mer, Rapp. et Proc.-Verb., v. 101, pt. 2, no. 6, 7 pp., 1936.
Pettersson, Hans and Otto. 1929. Methods for determination of the densityand salinity of sea water. Svenska Hydrogr.-Biologiska Kommiss.Skrifter, N.S., Hydrografi no, 3, p. 1-4, 1929.
Poole, H, H, 1936, The photo-electric measurement of submarine illuminationin offshore waters. Conseil Perm. Intern. p. l’Explor. de la Mer, Rapp. etProc.-Verb., v. 101, pt. 2, no. 2, 12 pp., 1936.
Poole, H. H., and W. R. G. Atkins. 1929. Photo-electric measurements of sub-marine illumination throughout the year. Marine Biol. Assn. U. K., Jour.,v. 16, p. 297-324, 1929. Plymouth.
Schmidt, Wilhelm. 1917. Wirkungen der ungeordneten Bewegung im Wasserder Meere und Seen. Ann. d. Hydrogr. u. Mar. Meteor., Bd. 45, S. 367-81,431-45, 1917.
Soule, Floyd M. 1932. Oceanographic instruments and methods. Physics ofthe earth, v. 5, Oceanography, p. 411-441. Nat. Research Council, Bull. no.85, 1932.
Sund, Oscar. 1929. An oceanographical slide rule. A new apparatus forcalculating oceanographical data. Conseil Perm. Intern. p. l’Explor. de laMer, Jour. du Conseil, v. 4, p. 93-98, 1929.
Sverdrup, H. U. 1933. Vereinfachtes Verfahren zur Berechnung der Druck-und Massenverteilung im Meere. Geofysiske Publikasjoner, v. 10, no. 1,9 pp., 1933. 0s10.
Swainson, O. W. 1936. Velocity and ray paths of sound waves in seawater. U. S. Coast and Geod. Surv., Field Engineers Bull. no. 10, 64 pp.,1936,
Swartout, J. A., and Malcolm Dole. 1939. The protium-deuterium ratio andthe atomic weight of hydrogen, Amer. Chem, Sot., Jour., v, 61, p, 2025-29, 1939.
Taylor, G. I. 1931. Internal waves and turbulence in a fluid of variabledensity. Conseil Perm. Intern. p. l’Explor. de la Mer, Rapp. et Proc.-Verb.,V. 76, p. 35-42, 1931.
Thomas, B. K).,T. G. Thompson, and C. L. Utterback, 1934, The electricalconductivity of sea water. Conseil Perm. Intern. p. l’Explor, de la Mer,Jour. du Conseil, v. 9, p. 28-35, 1934.
Thompson, T. G. 1932, The physical properties of sea water. Physics of theearth, v. 5, Oceanography, p. 63-94. Nat. Research Council, Bull. no. 85,1932.
PHYSICAL PROPERTIESOF SEA WATER 97
Utterbaok,C. L. 1936. Spectralbands of submarinesolar radiationin theNorth Pacific and adjacent inshore waters. Conseil Perm. Intern. P.l’Explor. de la Mer, Rapp. et Proc.-Verb., v. 101, pt. 2, no. 4,15 pp., 1936.
Utterback, C, L., T. G. Thompson, and B. D. Thomas. 1934. Refractivity-chlorinity-temperature relationshipsof ocean waters. Conseil Perm. Intern.p. l’Explor. de la Mer, Jour. du Coneeil, v. 9, p. 35-38, 1934.
Wenner, F., Edward H. Smith, and Floyd M. Soule. 1930. Apparatus for thedetermination aboard ship of the salinity of sea water by the electrical con-ductivity method. Jour. Research, U. S, Bur. Standards, v, 5, p. 711-32,1930.
Wirth, H, E., T. G, Thompson, and C. L. Utterback. 1935. Distribution ofisotopic water in the sea. Amer. Chem. Sot., Jour., v. 57, p. 400-04, 1935.
Witting, R. 1908. Untersuchungen zur Kenntnis der Wasserbewegungen undder Wasserumsetzung in den Finnland umgebenden Meeren. FinlandkcheHydrogr.%iologische Untersuchungen, no. 2, 246 pp., 1908. Ct. p. 173.
Young, R. T., Jr.; and R. D. Gordon. 1939. Report on the penetration of lightin the Pacific Ocean off the coast of southern California. Scripps Inst.Oceanogr., Univ. Caiif., Bull., tech. ser., v. 4, p. 197-218, 1939.


![Thermodynamic Propertiesof thevan der Waals Fluid1402.1205v1 [cond-mat.soft] 5 Feb 2014 Thermodynamic Propertiesof thevan der Waals Fluid David C. Johnston Department of Physics and](https://img.pdfslide.net/doc/110x75/5aa8b0357f8b9a77188bd950/thermodynamic-propertiesof-thevan-der-waals-fluid-14021205v1-cond-matsoft-5.jpg)