Embed Size (px)
Citation preview

227
CHAPTER V CASE STUDY OF IDEA CELLULAR LTD.

228
5. Introduction to Cellular Telephony
Cellular telephony, which enables a person the power to communicate round the clock,
across the world, has ushered in major changes in the entire industry of
telecommunications. Mobile telephones have become an integral part of the growth,
success and efficiency of any business / economy. The most widely used wireless
standard in the world today, is GSM. The GSM Association (Global System for Mobile
Communications) was instituted in the year 1987 to promote and expedite the adoption,
development and deployment and evolution of the GSM standard for digital wireless
communications.
The GSM Association was formed as a result of a European Community agreement on
the need to adopt common standards suitable for cross border European mobile
communications. Starting off primarily as a European standard, the Groupe Speciale
Mobile as it was then called, soon came to represent the Global System for Mobile
Communications as it achieved the status of a world-wide standard. GSM is today, the
world's leading digital standard accounting for 68.5% of the global digital wireless
market. The Indian Government when considering the introduction of cellular services
into the country, made a landmark decision to introduce the GSM standard, bypassing
obsolescent technologies and standards.
5.1 Cellular Telephony Industry in India
It was recognized by the Government of India that the provision of a world-class
telecommunications infrastructure and information is the key to rapid economic and
social development of the country. It is critical not only for the development of the
Information Technology industry, but also has widespread ramifications on the entire
economy of the country. It is also anticipated that in the future years, a major part of the
GDP of the country would be contributed by this sector. Accordingly, it is of vital
importance to the country that there be a comprehensive and forward looking
telecommunications policy which creates an enabling framework for development of this
industry.

229
5.2 Liberalization of Indian Telecom Sector Telecommunications sector is now universally recognized as one of the prime movers of
the modern economy; it is especially important for a developing country like India. The
availability of adequate infrastructure facilities is critical for acceleration of the economic
development of any country. In fact international studies have established that for every
1% increase in tele-density, there is a 3% increase in the growth of GDP. Accordingly,
the Government of India has accorded the highest priority to investment and development
of the telecommunications sector. Telecom industry requires very huge levels of
investments and it was believed that the Indian Government alone would find it difficult
to organize public funding of this sector on such a massive scale. In fact the national
telecom Policy 1994, estimated a resource gap of Rs.23, 000 crores to meet the telecom
targets of the eighth five-year plan of the Government of India (1992-97).
It was for this reason to bridge the resource gap between government funding and the
total projected funds requirement and to provide the additional resources to achieve the
nation's telecom targets that the telecommunications sector was liberalized in 1992 and
the Government invited private sector participation in telecommunications. Cellular
mobile services were one of the first areas to be opened up to private competition. The
whole country was divided into the 4 metropolitan cities of and 19 telecom circles, which
were roughly analogous with the States of India. In the year 1995
tenders invited for cellular services in 20 Telecom circles. The circles were roughly
analogous to the states of India and were divided into "A", "B" and "C" categories based
on their perceived business potential.
Category A comprised the states of Maharashtra Gujarat, AndhraPradesh, Karnataka and
Tamil Nadu. Category B comprised the states of Kerala Punjab Haryana Uttar Pradesh
(West) Uttar Pradesh (East) Rajasthan Madhya Pradesh and West Bengal. Category C
comprised the states of Himachal Pradesh, Bihar, Orissa, Assam and North East states.
Cellular Licenses were awarded to the private sector - first in the metropolitan cities of
Delhi, Mumbai, Kolkata and Chennai in 1994 and then in the 19-telecom circles in 1995.
The first metro cellular network started operating in August 1995 in Calcutta.

230
When cellular mobile services were first introduced in 1994 it was as a duopoly (that is a
maximum of two cellular mobile operators could be licensed in each telecom circle),
under a fixed license fee regime and for a license period of 10 years. The initial response
of the private sector was very encouraging. The attractiveness of the Indian market - the
low tele-density, the high latent demand and a burgeoning middle class - brought in some
of the largest global telecom players, foreign institutional investors and the major Indian
industrial houses to invest in telecom, especially the Indian cellular industry. Telecom
proved to be a powerful attractor of foreign investment. The cumulative FDI inflow into
telecom since 1993 has exceeded Rs. 43,000 Million. Within telecom, the cellular
industry has attracted most of the foreign investment since 1993, accounting for almost
50% of the FDI inflow into telecom - representing amongst the biggest investments in
any one sector in India.
5.3 FDI in Telecom Sector
Annual foreign investment in telecom increased steadily from an insignificant Rs. 20.6
Million in 1993 to Rs. 17,756.4 Million in 1998. However, the attractiveness of the
Indian market did not last for very long, as by 1997-98; the private cellular operators
were confronted with a series of problems that threatened their very viability and
survival. As a result of this, Foreign Direct Investment (FDI) inflow into telecom dropped
sharply, declining by almost 90% to Rs. 2126.7 Million in 1999. This dropped further in
Year 2000 - as until June 2000, only Rs. 918 Million had flown into the country. One of
the key factors responsible for the critical state of the telecom sector & consequently also
the cellular industry was that liberalization / deregulation was undertaken in an inverted
manner vis-à-vis international practices and generally accepted norms. Usually,
deregulation is preceded by tariff rebalancing, institution of a strong and independent
regulator and only then is private sector participation invited.
5.4 Private Sector Participation in Indian Telecommunications Sector
In India, private sector participation was invited in 1992, the Regulatory Authority was
set up in 1997 and the tariff rebalancing exercise commenced in 1999 and is still far from
complete. Further, even when the regulatory authority was set up, there was considerable
231
ambiguity on its powers, which resulted in virtually each and every order of the Authority
being challenged by the Licensor / incumbent. Another important factor was the basic
approach of the Government towards liberalization. Consumer benefit was not given the
due importance and the telecom sector was viewed as a revenue generator / cash cow for
the Government exchequer. The huge license fees paid by the private operators resulted
in a high cost structure leading to un-affordable tariffs and lower growth of the market.
5.5 New Telecom Policy of India (NTP 1999)
It was under the above circumstances that the Government undertook a review of telecom
policy & the role of the regulatory authority. The result was NTP 99, which was
announced in March 1999 & the amendment of the TRAI Act in January 2000. NTP 99 is
an extremely forward-looking policy. It significantly changed the dynamics of the Indian
telecom industry as it not only replaced the high cost fixed licensing regime with a lower
cost licensing structure through revenue sharing, but also provides for greater degree of
competition and more flexibility in choice of technologies. The amendments in the
Telecom Regulatory Authority of India (TRAI) Act resulted in a considerable
strengthening of the Regulator & greater clarity on its role and powers. It also put in
place a separate dispute settlement mechanism in the form of the Telecom Dispute
Settlement and Appellate Tribunal to expeditiously deal with and resolve issues relating
to the telecom sector.
The existing private cellular operators at that point of time migrated to the new telecom
policy regime with effect from August 1999. The migration to a more beneficial regime
translated into tangible consumer benefits - lower tariffs, greater subscriber uptake and
increased coverage. Cellular tariffs have dropped by over 90% since May 1999 - a
phenomenon unparalleled by any other sector or industry in India. The average airtime
tariff in Year 2001 was prevailing around Rs. 2 per minute as against the peak ceiling
tariff of Rs. 16.80 per minute when NTP 99 was announced. At the same time, there has
also been a significant drop in the cost of mobile handsets. Cellular handsets that were
available for around Rs. 25-30,000 in the initial days of cellular have now dropped
significantly, with a base level handsets being available for as little as Rs.2,000 upwards.

232
This has come about as a result of increased volumes and some degree of rationalization
of government levies.
5.6 Growth of Mobile Telephony in India
As a result of improved affordability, there an increased take-up of the service and the
cellular operators were able to venture into more and more cities & towns of the country.
In fact cellular services are now available in almost 1400 cities & towns of India. With
the lower tariffs and increased coverage, there was also a resultant increase in the number
of cellular subscribers. The point of inflexion for subscriber take-off is clearly post NTP-
99. From 1.2 million subscribers in April 1999, to almost 2 million by April 2000, the
number of cellular subscribers has grown to almost 6.5 million by the end of March 2002.
By March 2001, the industry had invested nearly Rs. 16,000 crores in cellular
infrastructure and it is estimated that these investments will grow to Rs. 20,000 crores in
the next 4-5 years. The year 2001 also saw the entry of BSNL and MTNL as the third
cellular operators as had been mandated in NTP 99. Further, in July 2001, cellular
licenses were awarded to the 4th cellular operators in different telecom circles. With this
the number of cellular operators has gone up to 89 licenses.
As of March 2002, the Indian cellular mobile industry had 42 networks on air, serving
over 1400 towns and cities and covering thousands of villages and serving almost 6.5
million subscribers across the country. The quality of the service is widely accepted to be
of international standards and till date there has been no waiting period involved in
availing of this service. The cellular industry has been growing at an average rate of 85%
per annum and it is hoped that the industry will be able to sustain this growth in the
coming years. The Working Group on the Telecom Sector set up by the Government of
India for the tenth five-year plan, has estimated that over the next five years, around
31.55 million cellular subscribers would be added all over India.
Indian telecom sector registered a record growth during the year 2005. More than 30
million telephony subscribers added during 2005, total base nears 125 million. The gross
additions were around 5 millions in December, 2005. The Tele-density of India reached

233
11.43. The GSM mobile industry continued to grow at a rapid pace and the GSM industry
had added a record 3.5 million subscribers during the month of January ‘06. This is also
the highest monthly subscriber additions recorded by the GSM industry since inception of
service. The GSM subscriber base crossed the 60 million mark and reached 62 million as
on January 2006 from 58.5 million in December 2005, representing a growth of 6% in
January 2006.
Table 5.1: Mobile Subscriber Growth in India between Nov’05 and Dec’05)

234
Table: 5.2 Company Wise, GSM Subscribers for Each Circle, (as on 31st
City/Circle
Jan’06)
Operators No. of Subscribers
Delhi Bharti Tele-Ventures 1895680 Hutchison Essar 1742136 MTNL 742647 IDEA 832183 Mumbai BPL Mobile 1334272 Hutchison Max 1838818 MTNL 888027 Bharti Tele-Ventures 1135954 Chennai Aircel Cellular Ltd 677815 Bharti Tele-Ventures 610968 Hutchison Essar 375328 BSNL 509118 Kolkata Bharti Tele-Ventures 604661 Hutchison Telecom 869113 BSNL 403538 Reliable Internet 19191 All Metros Total 14479449 A' Circle Maharashtra BPL Cellular 683651 IDEA 1631574 Bharti Tele-Ventures 1211226 BSNL 1056053 Gujarat Fascel 2012797 IDEA 914163 Bharti Tele-Ventures 791524 BSNL 827750 A.P. IDEA 850858 Bharti Tele-Ventures 1534879 Hutchison Essar 756395 BSNL 1053728 Karnataka Bharti Tele-Ventures 2001370 Spice Comm 366263 Hutchison Essar 964612 BSNL 1112005 T.N. BPL Cellular 467216 Aircel Limited 1602380

235
BSNL 1339658 Bharti Tele-Ventures 698659
A' Circle 21876761
Total
‘B’ Circle
Kerala Idea Mobile Comm 768101 BPL Cellular 431102 Bharti Cellular 529444 BSNL 1425438 Punjab Spice Comm. 1351215 Bharti Tele-Ventures 1542103 BSNL 383020 Hutchison Essar 605837 Haryana Idea Mobile Comm 273456 Aircel Digilink 344998 Bharti Cellular 384948 BSNL 482490 U.P.(W) Ideal Mobile Comm 813111 Bharti Tele Ventures 519132 BSNL 892797 Hutchison Essar 501369 U.P.(E) Aircel Digilink 1209445 BSNL 1581512 Bharti Tele-Ventures 543207 Rajasthan Aircel Digilink 527136 Bharti Hexacom 918233 BSNL 953830 M.P. IDEA 649095 Reliance Telecom 500159 Bharti Tele-Ventures 403769 BSNL 387966 W.B. & A&N Reliance Telecom 227410 BSNL 583060 Bharti Tele-Ventures 291642 Hutchison Telecom 417158 Dishnet Wireless 7522 B' Circle Total 20449705
C Circle Bharti Tele-Ventures
236
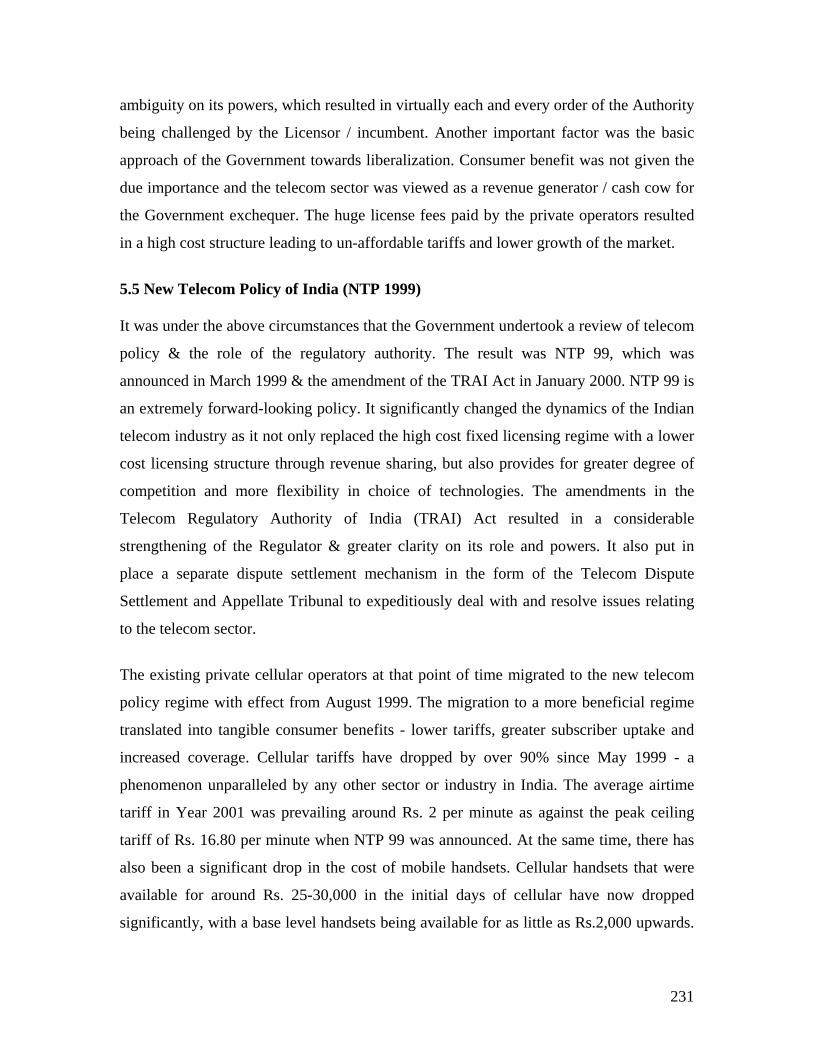
H.P. 332955 Reliance Telecom 62030 BSNL 210166 Bihar Reliance Telecom 502281 BSNL 782889 Bharti Tele-Ventures 665241 Orissa Reliance Telecom 179906 BSNL 476399 Bharti Tele-Ventures 364527 Dishnet Wireless 19469 Assam Reliance Telecom 185053 BSNL 308346 Bharti Tele-Ventures 129156 Dishnet Wireless 34992 N.E. Reliance Telecom 53818 Bharti Tele-Ventures 22999 BSNL 176853 Dishnet Wireless 36427 Jammu & Kashmir BSNL 426384 Bharti Tele-Ventures 240893 DIshnet Wireless 2445
Total C' Circle 5213229
Total All India 62019144
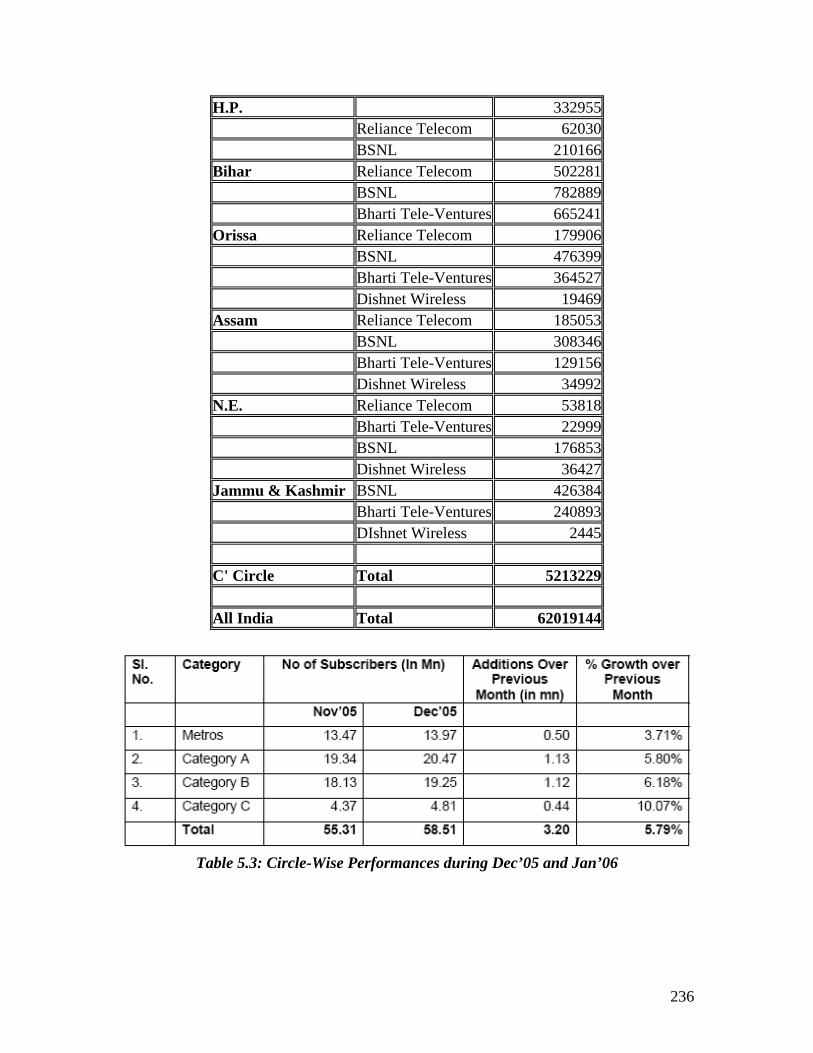
Table 5.3: Circle-Wise Performances during Dec’05 and Jan’06

237
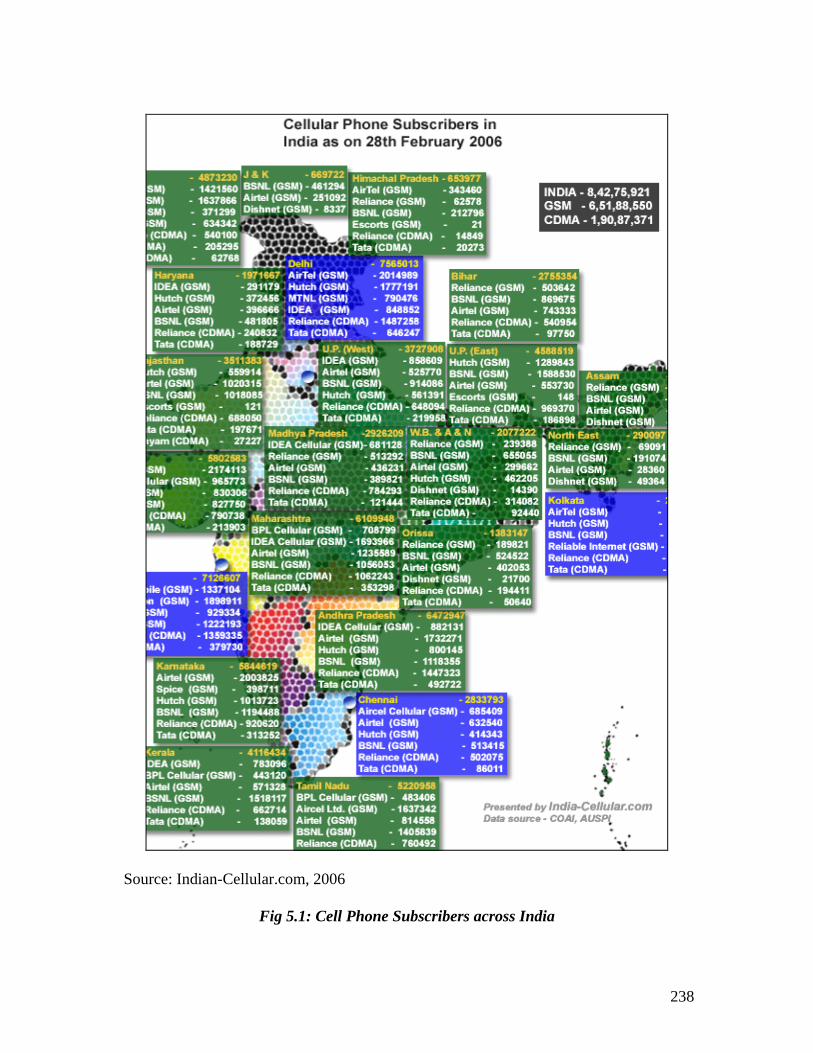
5.7 Circle-Wise Growth of Mobile Telephony In the year 2005, among all circles, Category C circles continued to witness the highest
rate of growth at 8.3%, which is much higher as compared to Metros and A & B circles.
Within the Category C circles, the highest growth was recorded by the Assam Circle
(14.22%) followed by N.E. (North East) Circle (10.86%). In terms of growth, Category C
circles were followed by Category A circles, which recorded a healthy growth of 6.85%
over the previous month. Karnataka recorded the highest growth at (11.3%) followed by
A.P. at 7.8%.
Category B circles witnessed a growth of 6.2%. Amongst the Category B circles, West
Bengal & A.N. recorded highest growth at (14%), followed by Kerala at (8.8%). The
Metro subscribers grew by 3.70% over the previous month. Kolkatta recorded the highest
growth at (5.21%) followed by Chennai (3.86%).
238
Source: Indian-Cellular.com, 2006
Fig 5.1: Cell Phone Subscribers across India

239
A summary picture of the company wise performance (including CDMA and GSM) as on
28th Feb’06 is given below:
Group Company Total Subscribers Bharti (GSM) 18450074 BSNL(GSM) 16060906 Hutch (GSM) 15868133 Reliance (CDMA) 14622980 IDEA (GSM) 7005024 Tata (CDMA) 4374396 Aircel (GSM) 2464209 Spice (GSM) 1820271 Reliance (GSM) 1800123 MTNL (GSM) 1719810 HFCL (CDMA) 62768 Shyam (CDMA) 27227 Total 84275921
Table: 5.4 Company wise Performance
(Including CDMA and GSM) as on 28th Feb’06
Source: Indian-Cellular.com, 2006
Fig: 5.2 Group Wise Company market Shares of Mobile Operators (as on 28/2/06)

240
The subscriber base of major mobile operators at the end of year 2005 in comparison to 2004 as below:
Source: TRAI, 2006
Table 5.5: Subscriber Bases of Major Mobile Operators of India (As on Dec’04 and Dec’05)
In the mobile segment 4.46 million subscribers have been added during December
2005 as compared to 3.51 million in November 2005. The mobile additions consist of
3.19 million GSM subscribers and 1.27 million CDMA subscribers as against 2.33
million GSM and 1.18 million CDMA the previous month. During the year 2005
about 27.91 million mobile subscribers were added, making it a total of 75.92 million
mobile subscribers by the end of year 2005.
The comparison of month-wise addition in mobile subscriber base for 2003, 2004 &
2005 (in millions) is as follows:
Year Jan. Feb. Mar. April May June July Aug. Sept. Oct. Nov. Dec. Total in
(Jan-Dec) 12 months
2003 0.64 0.60 0.96 0.64 2.26 1.42 2.31 1.79 1.61 1.67 1.90 1.69 17.49
2004 1.58 1.60 1.93 1.37 1.33 1.43 1.74 1.67 1.84 1.51 1.56 1.95 19.51
2005 1.76 1.67 0.78 1.46 1.72 1.97 2.46 2.74 2.48 2.90 3.51 4.46 27.91
Source: TRAI, 2006
Table 5.6: Month-wise Additions in Mobile Subscriber Base for the years 2003, 2004 & 2005 (in millions)

241
5.8 Tele-Density of India The gross subscribers' base consisting of fixed as well as mobile has touched 124.85
million at the end of December, 2005 as compared to subscriber base of 92.88 million
at the end of December, 2004, thus registering an overall annual growth of 34.42%.
The year 2005 ended up with the tele-density reaching 11.43 as compared to 8.62 at
the end of 2004.
242
5.9 Origin & Growth of Idea Cellular Ltd. The history of Idea Cellular dates back to year1995, when the Aditya Birla Group and
AT&T (through Birla AT&T- Maharashtra, Gujarat) and the Tata Group (through Tata
Cellular in Andhra Pradesh) were among the pioneering operators to set up cellular
networks. In the year 2000, the three players increased their range of operations. The
historic path breaking merger and the subsequent acquisition of the RPG Cellular -
Madhya Pradesh circle led to the formation of Birla Tata AT&T Limited.
The company changed its name from Birla Tata AT&T Limited to IDEA Cellular
Limited with effect from May 1, 2002 with a view to introduce a common identity across
all its circles of operations and leverage the benefit of a common brand. Simultaneously,
the company also introduced a new brand called ‘idea’ for its entire circle replacing its
existing brands. IDEA emerged as the fastest growing cellular company in India. The
company surpassed the industry growth of 80 per cent with a growth rate of 135 percent
in its subscriber base from 343606 in the year 2000-01 to 808676 in the year 2001-02.The
revenues grew by 52 per cent to Rs.6025 million in 2001-02. Since then, Idea Cellular
has been an impressive growth. For the financial year 2001-02, Idea Cellular achieved a
135% increase in subscriber numbers, by far the fastest growing of all operators in India.
The company also ranked No. 1 in customer satisfaction among all operators (NFO MBL
survey), which is a reflection of the quality of the company’s services.
In the year 2004, Idea Cellular made its presence felt in the of Indian telecom sector by
concluding the largest ever acquisition in Indian wireless industry by acquiring Escotel.
With the acquisition of Escotel, Idea’s network covers around 60% of India’s population
and over 65% of the potential telecom-market. Idea Cellular has become a national player
by having its presence in 11 circles across the country. Idea Cellular is also the only
company with one of its circle having crossed one million subscriber figure excluding the
metro markets.

243
5.10 Brand Vision of Idea Cellular
IDEA’s vision is to innovate, stimulate and liberate. The philosophy is reflected in the
company’s baseline: ‘An Idea (!dea) can change your life.’ The company claims that ‘by
continuously innovating to liberate customers from the constraints of time and space,
IDEA is determined to emerge as the most customer-focused mobile service brand in
India.’
5.11 Brand Identity
Brand consolidation was one of the most important initiatives undertaken by the company
during the financial year under review. This was done with the following specific
objectives:
• To unify the brand identity.
• To leverage a stronger brand recall across geographies.
• To generate advertising economies of scale.
• To position the company as a proxy for a challenging and dynamic future.
IDEA is a simple name, easy to remember. It is easily recognized across all ages, cultures
and languages. It stands for positive change at a time when sweeping cellular revolution
is transforming India. More importantly, the various identities were merged under the
IDEA identity. The brand !dea and !dea Chitchat replaced the AT&T and AT&T prepaid
brands in Maharashtra and Gujarat, the Tata Cellular and Freedom brand in AP and the
RPG Cellular and Wings brand in MP.
5.12 Coverage of Idea Cellular Idea Cellular covers over 3,660 small and major towns & villages along with a total
highway connectivity of over 6,000 kilometers. Currently, there are over 380 IDEA n U
outlets and Idea shops and a network of over 44,000 retailers and dealers across the
country. Each circle has its own dedicated call centre with a single call resolution
approach towards the customer. This is a unique effort provided by the company. Idea
Cellular offers roaming across 200 networks in India and across the world, two- way pre-

244
paid roaming is also available to customers. While traveling in India, Customers can stay
connected internationally by receiving calls, sending and receiving SMS.
Idea Cellular controls a portfolio of India’s most attractive and mainly contiguous
properties including the seven states of Maharashtra (excluding Mumbai), Goa, Gujarat,
Andhra Pradesh, Madhya Pradesh, Chattisgarh, UP (W), Haryana, Kerala and Delhi.
Having operations in four of the five largest cellular circles in India, Idea Cellular is the
market leader in the Maharashtra& Goa, Kerala, UP (W) and Madhya Pradesh &
Chattisgarh circles in terms of number of subscribers. With the acquisition of Escotel
Idea’s network has spread into Kerala, Haryana, Utter Pradesh, Rajasthan, Uttaranchal
and Himachal Pradesh virtually covering India from North to South, through eleven
circles of telecom operations in India. IDEA’s Delhi circle is also the fastest growing
fourth operator in the country. The following table depicts the subscriber base of Idea
Cellular:
Circles Oct-05 Nov-05 Dec-05
Andhra Pradesh 781,965 824,008 798,497 Delhi & NCR 758,179 816,811 788,234 Gujarat 791,395 875,551 824,984 Haryana 247,673 260,985 249,825 Kerala 711,507 740,180 766,403 Madhya Pradesh 571,547 583,208 611,425 Maharashtra 1,442,442 1,539,449 1,457,193 Uttar Pradesh (W) 758,014 768,051 779,330
Total 6,062,722 6,210,172 6,473,962
Table 5.7: Growth of Idea Cellular Subscriber Base during Oct’05- Dec’05
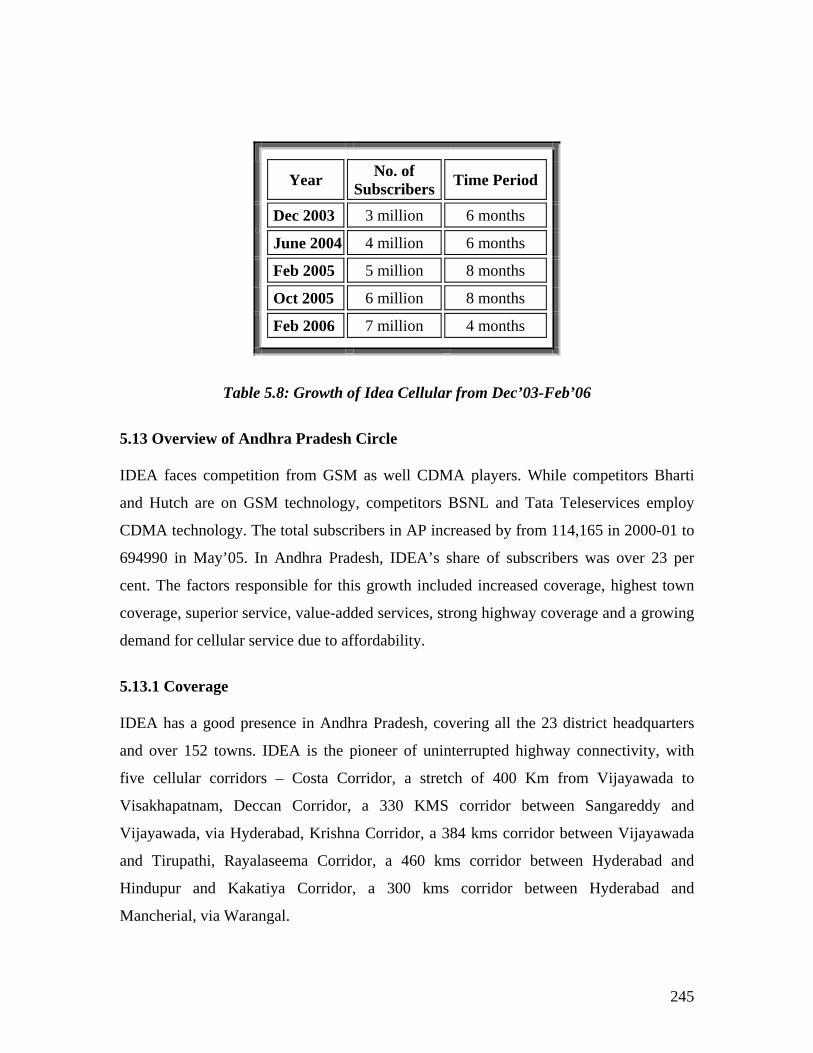
Idea Cellular achieved the milestone of crossing the seven million strong customer mark
in its eight circle operation covering only 45% of the country’s cellular base. In less than
twelve months the company has added nearly two million subscribers (Feb, 05- Feb, 06),
reflecting a stupendous growth of 40 % and maintaining leadership positions in a
majority of its operating circles. Idea continues to occupy number one or two positions in
five out its eight circles.
245
Year No. of Subscribers Time Period
Dec 2003 3 million 6 months
June 2004 4 million 6 months
Feb 2005 5 million 8 months
Oct 2005 6 million 8 months
Feb 2006 7 million 4 months
Table 5.8: Growth of Idea Cellular from Dec’03-Feb’06
5.13 Overview of Andhra Pradesh Circle IDEA faces competition from GSM as well CDMA players. While competitors Bharti
and Hutch are on GSM technology, competitors BSNL and Tata Teleservices employ
CDMA technology. The total subscribers in AP increased by from 114,165 in 2000-01 to
694990 in May’05. In Andhra Pradesh, IDEA’s share of subscribers was over 23 per
cent. The factors responsible for this growth included increased coverage, highest town
coverage, superior service, value-added services, strong highway coverage and a growing
demand for cellular service due to affordability.
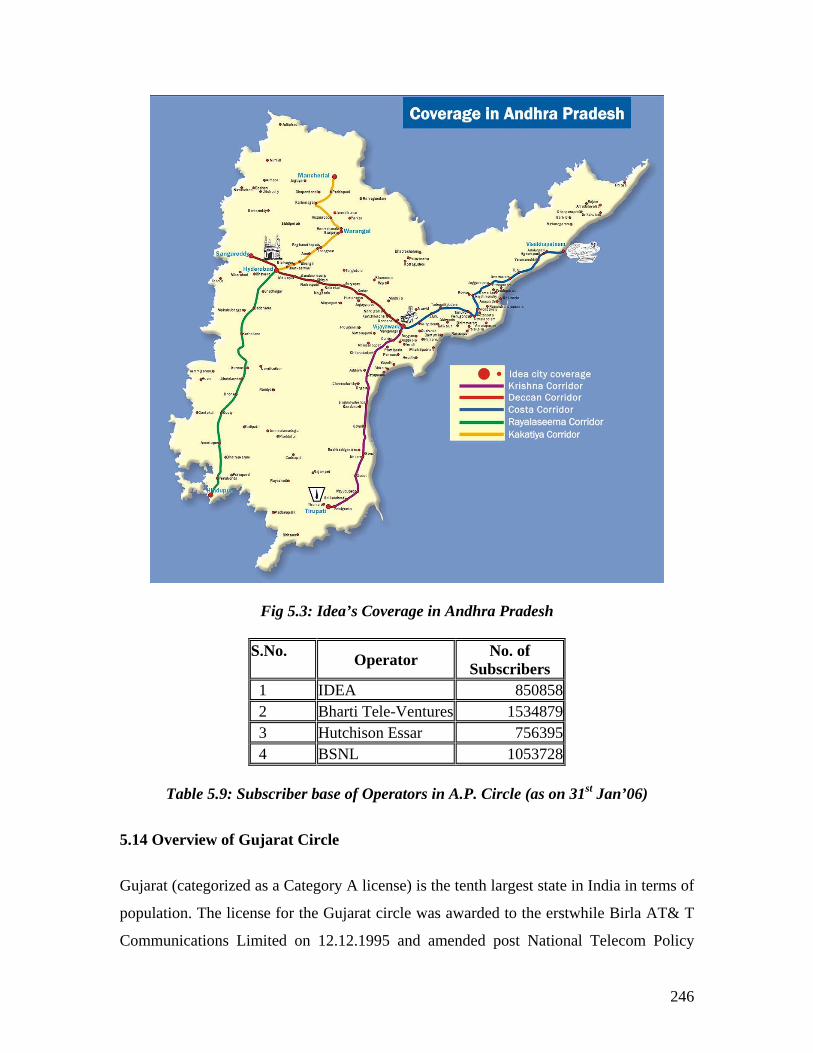
5.13.1 Coverage IDEA has a good presence in Andhra Pradesh, covering all the 23 district headquarters
and over 152 towns. IDEA is the pioneer of uninterrupted highway connectivity, with
five cellular corridors – Costa Corridor, a stretch of 400 Km from Vijayawada to
Visakhapatnam, Deccan Corridor, a 330 KMS corridor between Sangareddy and
Vijayawada, via Hyderabad, Krishna Corridor, a 384 kms corridor between Vijayawada
and Tirupathi, Rayalaseema Corridor, a 460 kms corridor between Hyderabad and
Hindupur and Kakatiya Corridor, a 300 kms corridor between Hyderabad and
Mancherial, via Warangal.
246
Fig 5.3: Idea’s Coverage in Andhra Pradesh
S.No. Operator No. of Subscribers
1 IDEA 850858 2 Bharti Tele-Ventures 1534879 3 Hutchison Essar 756395 4 BSNL 1053728
Table 5.9: Subscriber base of Operators in A.P. Circle (as on 31st
Gujarat (categorized as a Category A license) is the tenth largest state in India in terms of
population. The license for the Gujarat circle was awarded to the erstwhile Birla AT& T
Communications Limited on 12.12.1995 and amended post National Telecom Policy
Jan’06)
5.14 Overview of Gujarat Circle

247
1999. Gujarat had 2.6 million fixed lines as of December 2001 with a fixed line
penetration at 5.1 per cent, higher than the national average of 3.4 per cent. Cellular
penetration reached 0.9 per cent. Gujarat has an excellent infrastructure and its highways,
linking Rajasthan to Maharashtra and other highways connecting the ports are well
known. These have been used for providing coverage by IDEA. IDEA enjoys highway
coverage of 1550 KMs through its superior backbone network.
Fig: 5.4 Idea’s Coverage in Gujarat
S.No. Operator No. of Subscribers
1 Fascel 2012797 2 IDEA 914163 3 BhartiTele-Ventures 791524 4 BSNL 827750
Table 5.10: Subscriber base of Operators in Gujarat Circle (as on 31st Jan’06)

248
5.15 M.P. Circle Overview The Madhya Pradesh Circle (M.P.) which includes Chattisgarh (categorized as a
Category B license) is the largest state in India in terms of area. The license for the
Madhya Pradesh Circle was awarded to the erstwhile RPG Cellcom Limited
(subsequently renamed to BTA Cellcom Limited) on 12.12.1995 and amended after the
announcement of National Telecom Policy 1999. Madhya Pradesh had 1.3 million fixed
lines as of December 2001 with a fixed line penetration of 1.6 per cent. Cellular
penetration was 0.3 per cent
IDEA’s immediate competitor in the Madhya Pradesh Circle was Reliance Telecom,
owned by the Reliance Group. BSNL was third operator, while the fourth operator's
license was awarded to Bharti Telecom. Even though BTA Cellcom Limited was ahead
of competition in rolling out its services, the delayed implementation of its network
expansion plans allowed the Reliance Group to take a 3:1 lead in the Madhya Pradesh
market by February 2001. However following the acquisition of BTA Cellcom by IDEA
Cellular Limited, a number of initiatives were taken: enhancement of switch capacities,
improved distribution network, a town-level focus and the introduction of innovative
value-added services. All these measures resulted in a larger share of the market by 13
per cent from 24 per cent in 2000-01 to 37 per cent in 2001-02.During this period, IDEA
achieved a growth rate of 276 per cent with subscriber base rising from 21,006 in 2000-
01 to 79,053 in 2001-02.
5.15.1 Idea’s Coverage in MP Circle
Following the acquisition of BTA Cellcom by IDEA Cellular Limited, IDEA made
aggressive investments in the Madhya Pradesh Circle and extended its coverage to 40
new towns from 13 towns in 2000-01 to 53 towns in 2001-02. IDEA also added 53 new
cell sites in 2001-02, increasing the total cell sites from 54 in 2000-01 to 107 in 2001-02.
IDEA Cellular, market leader in M.P. & Chattisgarh is on an expansion drive and plans to
invest Rs. 150 crore in the MP & Chattisgarh Circle in the year 2006.

249
Fig 5.5: Idea’s Coverage in Madhya Pradesh India’s leading cellular operator and the market leader in Madhya Pradesh and C Idea cellular, in the Chattisgarh Circle, has launched, “Service Guarantee” on bills for all
postpaid customers in the circle. Service Guarantee on billing is a unique guarantee given
by Idea for Error Free Billing with respect to Plan / Services / Features / Call Rating. This
is a world-class innovation in regards to customer service. IDEA is the first and only
cellular operator in the Circle to launch Service Guarantee on bills for its postpaid
customers. This is an additional service offering to the post-paid customers. This
guarantee is applicable for all bills raised on or after June 1, 2005. If any customer
identifies a valid error or combination of the below mentioned errors, he would be
eligible for a credit of Rs 100/- per bill, as an appreciation from Idea for letting them
know their mistake. Such a guarantee is possible only with a highly efficient technology
environment and strong processes, which IDEA has put in place to provide the best value
to its customers.

250
The bill guarantee is applicable for the following:
· Charges for a plan different from the plan opted for.
· Charges for a feature different from the feature opted for.
· Charges due to non-updating of activation fee.
· Charges due to error in call rating.
· Charges due to failure in updating of credits arising out of the above complaints.
S.No. Operator No. of Subscribers
1 IDEA 649095 2 Reliance Telecom 500159 3 Bharti Tele-Ventures 403769 4 BSNL 387966
Table 5.11: Subscriber base of Operators in M.P. Circle (as on 31st Jan’06)

251
Fig 5.6: Idea’s Coverage in Delhi
5.16 Overview of Delhi Circle
In the Delhi circle, IDEA signed the licensee agreement as a fourth operator in October
2001 and set up about 300 base stations while preparing to offer services as a fourth
operator in Delhi. By the end of May’05 Idea has a subscriber base of 617874 of a total
of 4250111 subscribers in Delhi circle, thus accounting for 14.5 percent of market share.
To support a rapidly growing customer base and to provide a congestion free high quality
coverage, in the Delhi Circle, Idea plans to add an additional 400 cell sites and take the
total to over 1000 in the first half of 2006, in newly identified population clusters within
the Delhi and National Capital Region (NCR region). With the subscriber base at 7.88
lakhs currently, Idea has plans to cross the one Million mark in the same period. A total
investment of Rs. 150 crore has been ear marked for this expansion. With the best tariffs
to offer in the Mobility space, Idea Cellular in New Delhi had posted a 39% growth in

252
subscriber base and a 35% growth in Revenue in the last twelve months. The Year 2005
has been an immensely successful year for the Circle with the launch of products and
promotions such as STD at the rate of 99 paise. Idea Cellular, in Delhi continues to
register the lowest network faults per 100 subscribers and lowest Call Drops among all
GSM operators in Delhi. . The newly launched error free Bill Guarantee for post-paid
subscribers is also another move to ensure maximum customer satisfaction.
S.No. Operators No. of Subscribers
1 Bharti Tele-Ventures 1895680 2 Hutchison Essar 1742136 3 MTNL 742647 4 IDEA 832183
Table 5.12: Subscriber Base of Operators in Delhi Circle (as on 31st
• Coverage: Superior indoor and outdoor coverage on 900 Mhz to its customers
across 185 towns and local calling facility in all these towns.
Jan’06)
5.17 Coverage in Haryana
IDEA has a vast and a very strong distribution network of over 4000 plus dealers and
retailers spanning through A, B & C class cities across Haryana. IDEA Cellular also
provides one-on-one service to customers through over its IDEA 'n' U outlets & recently
introduced IDEA Shops spread across the circle and all major highways. The Call Center
capacity is also being doubled to cater to sharp rise in subscribers. With a utilization of
less than 75% of the installed capacity IDEA has been providing the best seamless
connectivity in Haryana. After the upgradation of the network, a total of 185 towns will
be connected within Haryana. With this, there will be an increased capacity for call
handling, it will reduce network congestion further, enable better call completion and
increase network efficiency. With this upgradation, customers in new towns will be
offered cell broadcast and high-speed data services like GPRS and EDGE.
The company attributes its growth to the following factors:

253
• Sales & Service Network: Its vast sales & service network of over 4,000 plus
retail outlets & IDEA n U & IDEA Shops showrooms spread across Haryana.
• Customer Centric Tariff Plans: Simple, affordable, customer friendly and
innovative tariff plans like Mobile-to-Mobile @ Re. 1, Idea Superpower, 2yrs &
3yrs validity vouchers among others. IDEA has, in the past, launched special
promotional offers exclusively for Haryana subscribers such as Champion 249
Plan and 1000 SMS packs etc.
• Value Added Services: Value Added Services like ‘IDEA’, which allows a user
to Speak into their mobile phones to avail the services, E-Mail on Mobile, Pay
Easy, Mobile Top Up, Music Messaging, Group SMS and Global SMS - SMS to
160 countries 564 networks across CDMA, GSM etc.
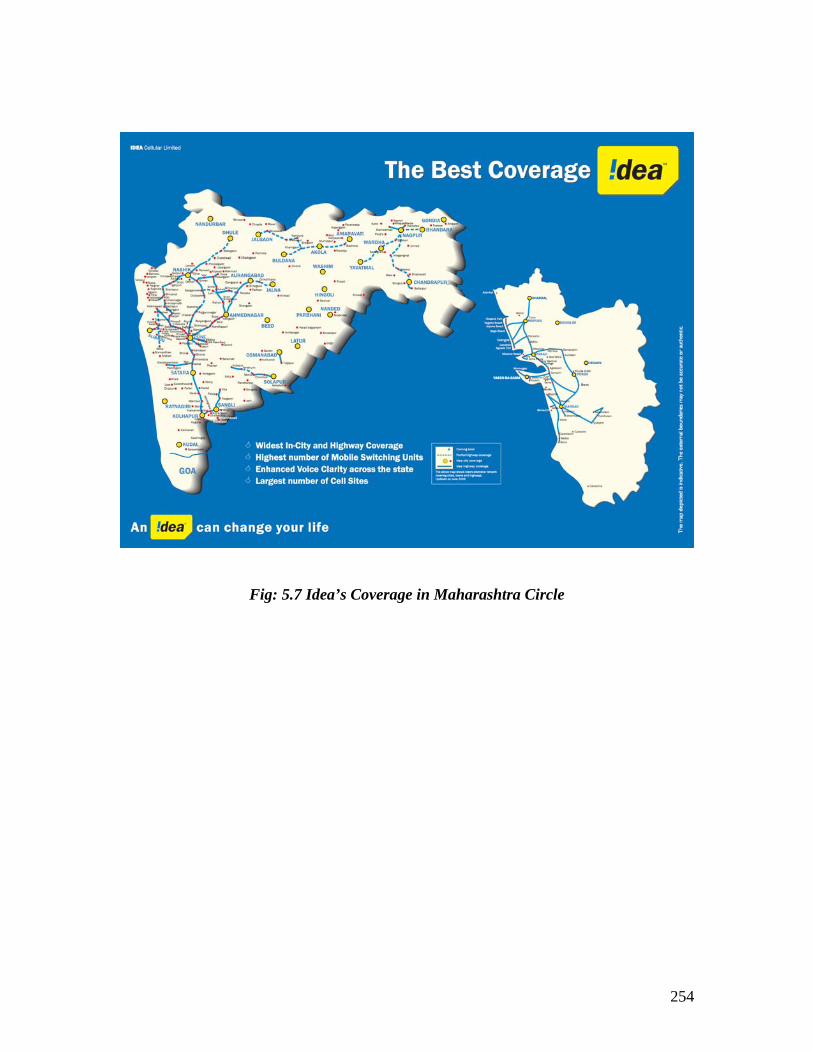
5.18 Coverage in Maharashtra Idea cellular competes with BPL, Bharathi, BPCL and BSNL in the Maharashtra circle. It
has a subscriber base of 1631574 subscribers of the total 4582504 subscribers, accounting
for 35.6 percent of the market.
S.No. Operator No. of Subscribers
1 BPL Cellular 683651 2 IDEA 1631574 3 Bharti Tele-Ventures 1211226 4 BSNL 1056053
Table 5.13: Subscriber base of Operators in
Maharashtra Circle (as on 31st Jan’06)
254
Fig: 5.7 Idea’s Coverage in Maharashtra Circle

255
5.19 CRM Initiatives at Idea Cellular Ltd. In the course of understanding CRM process in the organization, an attempt is made to
understand the structure of the customer care department in the company. Studying the
functioning of the department would follow this step. The customer service/ customer
care department in Idea Cellular Ltd. is known as ‘Team Response’.
5.19.1 Objectives of CRM Initiatives at Idea Cellular Ltd. A careful study and analysis of information pertaining to the CRM initiatives launched by
the company would reveal the following objectives. They are as follows:
• To provide the necessary information to the customers as and when they require it
• To resolve the complaints launched by the customers in minimum time and ensure
that the problems do not recur.
• To deliver the services requested by the customers in the most efficient manner.
• To retain the existing customers by providing superior service.
• To reward the customer who have exhibited loyalty towards the company
services.
5.20 Structure of ‘Team Response’ Team Response operates through call centers, channel partners, face-to-face locations
(also known as show rooms), priority cells and support cells. Depending on the mode of
communication channel a customer prefers to use, he/she can use any of the above-
mentioned locations, to communicate with the ‘Team Response’. The structure is
depicted in figure 5.8.

256
Customer Care/ Team Response
Call Center Channel Partners Face-to-Face Priority Support (Franchisee/ dealer) Locations Cell Cell
Fig: 5.8 Five Divisions of ‘Team Response’ A customer, depending on his preference can use any of the above facilities, except the
priority cell. A priority cell is exclusively meant for the high-end users/premium
segments of the customers. Any request for any kind of service/ information will land up
at any of the above locations. A detailed description of each of these facilities is given as
follows:
5.20.1 Call Center
A Call Center handles customer enquiries, service requests etc, which are made through
phone calls. Any customer of the company can dial the number 121(for post paid
customers) or 2222 (for pre paid customers). A person who is not a customer can call the
number 9848012345 to get the information he/ she requires. Any call made to the above
numbers would be first received by an Interactive Voice Response (IVR) system. This
system is capable of giving generic information to the caller. The generic information
consists of the details like the bill details (billed amount, unbilled amount, and the last
date for payment of bills), information on the various packages offered by the company,
connection expiry date, various value-added services etc. The call center operates 24
hours a day, seven days a week (24*7 mode).
If the caller has a request for specific information, which otherwise cannot be handled by
the IVR system, then the IVR system guides the caller to dial certain digits on his/ her
phone, so that the call is forwarded to a Team Response member, known as an officer.

257
This officer in turn interacts with the caller, to know the specific requirements and guides
the caller by giving appropriate information, or in case of a complaint, he initiates the
necessary actions to be taken and informs the same to the caller.
Call
Lands up at
IVR
Call evaluation
Yes
No
The call is routed to an officer
Fig 5.9: Flow Chart Depicting Call handling by the Call Center
Does IVR has the required Info.
Caller listens to IVR Info.
Officer interacts with the caller, gives the Info/ initiates the action to be taken
Call ends
IVR prompts the caller to dial certain numbers on his phone, depending on his requirements

258
5.20.1.1 Classification of Calls: The calls received by the call center are generally classified (depending on the nature of
the call) as follows:
a) Calls made for general information and inquiries
Example: Calls asking billing details, due dates for payments, new packages etc.
b) Calls made, requesting for specific services-Service Requests
Example: Calls asking for enabling roaming facility, STD etc. Even calls made asking for
cancellation of facilities like detailed billing, Caller Line Identification etc.
c) Calls that are made to lodge complaints
Example: Calls made to register complaints related to billing discrepancies, non-
availability/ non-functioning of services like SMS etc.
In the case of complaints falling under the category ‘a’, no action is required to be taken
by the Team Response, other than providing the required information.
In the case of complaints falling under categories ‘b’ and ‘c’ the Team Response, to sort
out the issues, should initiate certain actions.
The next facility through which customers can interact with the Team Response is
through the show rooms manned by the channel partners.
5.20.2 Channel Partners As it is impossible for the company to have presence in all geographic locations, various
dealers/ franchisees are appointed at different places to market the offerings and extend
service to the customers. A customer can approach the dealer / franchisee to get the
general information, to make a service request or to lodge a complaint. If it is required,
the dealer in turn forwards the requests to the company, to initiate the necessary actions.
Face-to- face locations (FTF) are the other units through which customers can interact
with the Team Response.

259
5.20.3 Face-to-Face (FTF) locations Face-to-face locations are the show rooms managed by the company. In order to serve the
needs of the existing customers, the company’s personnel manage these locations. The
timings of these locations are from 9:15AM till 8:30 PM. A customer can walk into the
FTF location and can directly interact with the officers present there. Service requests,
complaints, general inquiries are handled by the company’s personnel. Apart from
processing of the requests of the customers, and giving them information, the customer
service officers also perform the following activities:
5.20.3.1 Collection of Feedback Feedback is collected from customers, using a pre designed feedback form, where the
parameters of evaluation are uniform for all the respondents. The following parameters
are evaluated:
a) Waiting time- to interact with the officer at the counter
b) Staff’s courteousness and willingness to help
c) Ability of the staff to provide accurate information
d) Speed and quality of the resolution provided
e) Overall ambience of the customer interaction center
f) Ease of accessing IVR
g) Clarity and quality of information on IVR
h) Availability of information on IVR
i) Ease of accessing an agent in case of personalized assistance
All the above parameters are evaluated on a four point rating scale with the points
indicating excellent position, good, average and below average positions. The purpose is
to identify low rating areas, ascertaining the reasons for poor ratings and rectifying them.
Feedback is also collected, when the customers give it voluntarily. In this case the
feelings, attitudes and experiences of customers are collected.

260
Suggestions for the improvement of services are also collected at the FTF locations. In
addition to this, ‘post contact’ interviews are also conducted with the customers. These
interviews aim at determining the satisfaction levels of the customers and their feedback
on the services offered.
5.20.4 Priority Cell A priority cell is the facility created by the company to take care of the high end users.
These include segments like corporate clients, who offer high value to the company. The
response time is quick and the extension of services is done on a priority basis to these
customer segments.
5.20.5 Support Cell A support cell takes care of all customer queries, complaints and requests, which cannot
land up in any of the earlier discussed locations of Team Response. Written letters, sent
by courier/ mail, letters sent through fax, letters sent by e-mail are the most common
forms in which the support cell receives communication. This cell in turn takes care of
the customer requirements, either by providing information or by initiating the necessary
action.
After a careful analysis of the above information, the various touch points of customers,
considering the various forms of contact, the customers can choose, is depicted in the
following table.
S. No. Customer Contact Modes
(Customers’ preference of contacting) Touch Points
1. Walk-ins Face-To-Face Locations (of Company and dealers’)
2. Phone Calls Call Centers, Priority Cells 3. Letters (mailed/ couriered/ faxed) Support cell 4. E-mail Support Cell
Table 5.14: Various Touch Points of Customer Interactions

261
5.21 Systems (Technology-based) Supporting the Team Response The following technology based systems are used at Idea Cellular Ltd. in order to deliver
superior customer care.
1. Idea Subscriber Management System & Service on Line (ISMS & SOL)
2. Call Management System (CMS)
3. Customer Complaint Management System (CCMS)
5.21.1 Idea Subscriber Management System & Service on Line (ISMS & SOL)
These two systems are meant for supporting the team response members, especially
operating at franchisees and dealer outlets (Idea n U outlets). The team response units at
the dealers offer similar services, as those offered by the parent organization. But as these
units are not directly managed by the parent organization (Idea Cellular Ltd.), they do not
have the departments like billing and activation, to process the service requests or that
could directly address the grievances. The complaints/ service requests received by the
dealers are in turn forwarded to the parent company. ISMS is a system that is meant for
storing the complaints/ requests received by the dealers.
These are later forwarded to the parent organization, which in turn would route the
complaints/ service requests to different departments, depending on the nature of the
grievance/ service request. Service on Line (SOL) system is an improvement over ISMS
in the sense that it drastically cuts down the response time. This is possible by having
web based connectivity. The complaints/ service requests lodged at the dealers’ premises
are directly forwarded to the concerned departments in the parent organization, through
SOL. This helps in reducing the time gap between lodging the service request/ complaint
and initiation of action to resolve it.
5.21.2 Call Management System (CMS)
Call Management System (CMS) is meant for supporting the team response members
operating in the call center. This system distributes calls to different members on the
basis of load taken by them, with an objective of balancing the load among different team
members. It would also keep track of number of calls made during a period of time,
262
number of calls answered, number of calls put on hold, number of calls handled by an
individual etc. At the peak hours of traffic, i.e., when the number of calls is very high, all
the call center personnel would be busy answering the queries of the callers. At such
times a new caller has to wait a lot of time to talk to the call center personnel. In such
circumstances, the voice logger facility is used. A ‘Voice Logger’ mechanism in CMS
stores (records) the voice messages of callers/customers. As soon as the call center
personnel complete their current transactions, they would attend to the calls stored in the
voice logger.
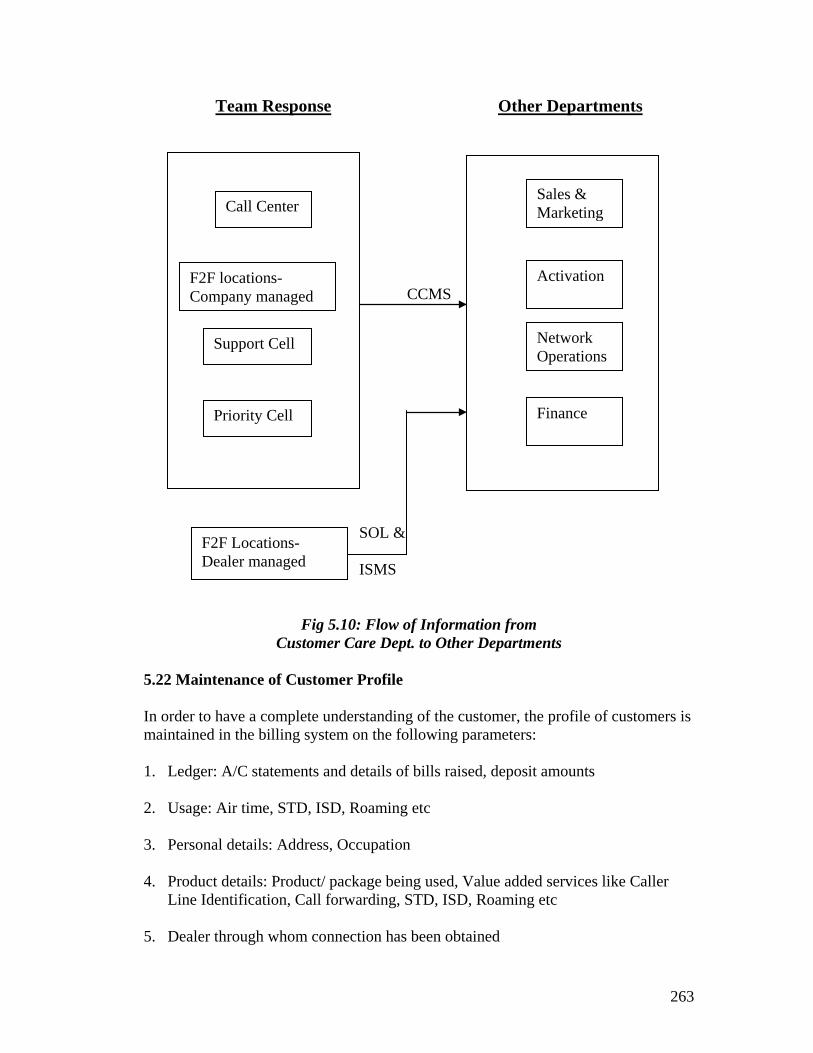
5.21.3 Customer Complaint Management System (CCMS)
Customer Complaint Management System (CCMS) plays an important role in enabling
the team response members to solve the complaints lodged by the customers. Once a
complaint is lodged with any of the Team Response Units, it is recorded in CCMS, and
then depending on the nature of the complaint it is forwarded to the concerned
departments for initiating the necessary action. Once after receiving the service request,
the concerned department acts on it as per the Service Level Agreement (SLA).
‘SLA’ is the Service Level Agreement; which the Team Response arrives at with
different departments, to sort out the out standing issues that customers complain to the
team response units. Individual Service Level Agreements (SLAs) are worked out with
different departments, depending on the nature of actions to be initiated. An SLA states
the kind of action to be taken by the concerned department and the time frame in which
the action has to be completed.
263
Team Response Other Departments
CCMS SOL & ISMS
Fig 5.10: Flow of Information from Customer Care Dept. to Other Departments
5.22 Maintenance of Customer Profile In order to have a complete understanding of the customer, the profile of customers is maintained in the billing system on the following parameters: 1. Ledger: A/C statements and details of bills raised, deposit amounts 2. Usage: Air time, STD, ISD, Roaming etc
3. Personal details: Address, Occupation 4. Product details: Product/ package being used, Value added services like Caller
Line Identification, Call forwarding, STD, ISD, Roaming etc
5. Dealer through whom connection has been obtained
Sales & Marketing
Activation
Finance
F2F locations- Company managed
Call Center
F2F Locations- Dealer managed
Support Cell
Priority Cell
Network Operations

264
Rating of the customer is done on the basis of parameters like payment records, usage
and occupation of the customer etc. These details are accessed by the team response
personnel, while interacting with the customers.
5.23 Proactive Customer Care The earlier mentioned methods of customer care basically are of ‘reactive’ nature i.e. the
action is initiated by the team response, only after receiving a service request/ complaint
from the customers. In addition to these measures, certain pro-active initiatives are also
undertaken by the Team Response Units. These initiatives include:
5.23.1 Proactive Customer Care for Post- Paid Customers
a) Welcome Call- It is made one day after the initial activation. During this call the
team response member gives the details of the package plan the customer has
opted for, coverage areas, details of customer service, payment options etc.
b) Tele Calling- This is meant for contacting customers located in small towns, to
know the quality of service given by the dealers, their satisfaction levels etc.
c) First Bill Call-Just before the dispatch of the first bill to the customer, a call is
made to the customer (as he/ she is receiving the bill for the first time) explaining
him/ her various components of the bill, how to understand the billing format,
how and when and by what date, the payment has to be made etc.
d) Bill Dispatch Message-As soon as the bill is dispatched, an SMS (Short Message
Service) is given to the customer intimating the dispatch. In case the customer
does not receive the bill, even two or three days after receiving this message, this
facility enables the customer to intimate the team response unit about the
problem. The matter would be taken up by the team response personnel and it
enables them to give another copy of the bill, so that the customer will not default
on the payment front.

265
e) Face to Face Meetings- All the walk-ins are encouraged to give oral non
structured feed back, during the meetings at the show rooms.
f) User Tracking- For a period six months from activating a new connection, a close
monitoring is done to identify the prospective subscribers who might be planning
to discontinue the usage of the services of the company. The usage patterns are
monitored, as a consistent decrease in usage would indicate a possible defection.
The customer is contacted and reasons are found for the decreasing usage. In case
of problems from the company’s side, the company would try to provide a
solution, if it is within its capability.
5.23.2 Proactive Customer Care for Corporate Customers
a) A separate help line for online support, which can be easily accessed.
b) Relationship Building- A group of team response members are entrusted with the
task of establishing contact, conducting regular meetings and collecting feed back,
ensuring timely collections etc.
5.23.3 Proactive Customer Care for Pre-Paid Customers a) Welcome Call- One day after the initial activation. During this call the team
response member gives the details of the services offered, coverage areas, details
of customer service, recharge methods, terms and conditions of usage etc.
b) New Service Alerts- Every time new services are launched; customers are
intimated through message alerts, explaining the features and details of the
services.
c) Expiry Date Alert- One week before the expiry of the current subscription,
message alerts are given intimating the expiry date of the subscription.

266
d) Low Balance Alerts- Message alerts are given to the customers as soon as their
balance falls below a certain minimum alert
5.24 Loyalty Reward Programs Customer defection (also known as customer churn) is one of the main problems
encountered by the cellular service providers. According to one company source it is
estimated that every fifth subscriber added to the company’s base is a resultant of
churn from other operators. It has become quite essential for companies to reduce the
churn and improve customer retention. Idea Cellular Ltd. had taken certain initiatives
to improve customer loyalty. The loyalty rewards are passed in terms of fee waivers,
tariff reductions and provision of value-added services. Some of the loyalty reward
programs offered by Idea Cellular are as follows:
5.24.1 One Year Rs.1000 Back If a post-paid customer continues to be a subscriber even after one year from his
subscription, he/ she is given a Rs.1000/- waiver on the 13th month bill. This was
promoted as a loyalty bonus scheme, whereby a customer is given back his initial
deposit amount of Rs.1000/- which was paid during the enrollment. Here the intention
is to see that the customer is with the company at least for a year.
5.24.2 Free SMS Scheme On a new pre-paid connection, at the cost of Rs.29/-, free SMS facility is made
available for three months. Here also, the intention of the company is clear- to retain a
pre paid customer for at least three months. As this is a pre paid segment the danger
of churn is more compared to the post paid segment.
5.24.3 "Buzz 2 Year Advance Rental Plan"
This plan would enable the postpaid customers to go mobile with absolutely zero
rental for a period of 24 months after a one time payment of Rs. 1550 (including Rs.
900/- rental for 6 months, Activation cost of Rs. 550/- and SIM Card charges of Rs.
100/- only). The features of this plan are mentioned as follows:

267
• All Local Calls at the rate of Rs. 1.75/- per minute.
• All STD calls to any number at the rate of Rs. 2.65/- per minute
• SMS Pack free for first six months (50 local SMS free and Re 0.60 per SMS
thereafter)
• Caller Line Identification (CLI) – Rs.50 per month
5.25 Training of Human Resources for Effective Implementation of CRM
Idea’s capability to service seven million customers across different states comes from a
prudent mix of people initiatives and pioneering services. It starts with the recruitment
process. Idea cellular, recruits individuals through a demanding process that tests their
responsiveness and quick-mindedness to diverse customer situations. These situations
require Idea’s customer service assistants (CSA) to be patient, courteous and be able to
converse in English, the local and national language.
Once the individual passes this demanding filter and is recruited, he/she undergoes an
intensive training that acquaints him/her with the company’s history, values, products and
services. Thereafter, the training moves to a more practical environment that is directed
towards enriching the employees with the experience required to take calls competently
and independently: a process whereby they listen to how the more experienced
executives manage customer calls, then initiated into attending to those calls under
supervision and finally with independent confidence.
Idea Cellular recognized the fact that to be able to provide the right information, the
Customer Service Assistants (CSAs) must be competently trained in the art of patient
listening. Once the customer’s requirement has been fully understood, the CSA is
adequately empowered to respond immediately and appropriately to the fullest
satisfaction of the customer. This ability to respond with speed is reinforced by the
CSA’s connection to the Intranet, which hosts all relevant information to address varied
questions that completely satisfy the customer’s needs during the first call.

268
The standards are measured and maintained through a comprehensive performance-based
appraisal system. This system analyses individual performances every quarter in the
categories of best performer, best call-taker, most helpful person and employee with the
track of least absenteeism, on the basis of which members are recognized and rewarded.
5.26 Measures Taken for Effective Implementation of CRM Initiatives
Idea Cellular is the first company in the Indian mobile telephony industry to undertake
certain measures, which in turn have helped in pioneering delivery of products and
services:
• Installation a Plasma TV to monitor incoming calls and ensure a high priority to
waiting calls and utilize resources effectively.
The plasma television, which is displayed centrally, in the office features call
management statistics online. These statistics include the number of calls being made,
calls being addressed, calls being put on hold and calls being attended. The call queue is a
critical customer service parameter which is displayed in the form of a circle, which
increases in size as the queue, enlarges, inspiring an immediate response in queue
management. Thanks to this initiative, CSA response time declined from an average 35
seconds to only 25 seconds liberating 66 hours of calling time in the process. Currently,
the response time is six to eight seconds. Besides, the abandon ratio and the percentage of
customers put on hold, who terminated their call before the call could be put through
declined from 12 per cent to seven per cent. Currently, the abandoned call percentage is
around four to five percent.
• Conceptualization of a call evaluator to listen to calls taken by CSAs and provide
online training.
• Installation of a voice logger to analyze the calls. This system records and stores for
three days all calls made to Idea’s customer service team. As a result, the measure
inspires CSAs to raise the standard of their performance, provides a reference of the
last conversation for better customer servicing, and provides a repository for better
learning for the entire team and room for specific counseling.

269
• Offering online faxes of customers’ queries on billing and payment centers through
an Interactive Voice Response (IVR) system.
According to Idea Cellular, more than 40,000 customers call IDEA call centers for
assistance every day. To service the queries of these callers in the shortest turnaround
time, Idea’s customer-focused front-end is supported by a robust back-end. This
facilitates a seamless transfer of information from the company to the customer.
The back-end has been configured to serve the customer the way the he/ she wants it.
Since customers need standardized information in a lot of instances, the company has
created an interactive voice-based response system in English, Hindi, Gujarati, Telugu
and Marathi. This module enables the caller to follow user-friendly voice-based
guidelines to access relevant information on the phone or fax, customized to their specific
geography. And for customers, who feel more comfortable in speaking to a voice, the
company has a friendly customer service assistant to answer queries at the other end.
5.27 Functioning of Call Centre
IDEA services more than 40,000 calls a day, from its existing customer base on queries
related to billing, schemes and general information through five call centers in Pune,
Ahmedabad, Indore, Hyderabad and Delhi. As a first step towards facilitating customer
convenience, each of these 24 x 7 call centers were assigned with an easy-to-recall 12345
number. As soon as the caller gets connected, he/she is given the facility of interacting
with a customized IVR, structured around usual pre-paid and post-paid customer queries.
IDEA Cellular, has facilitated the delivery of a superior customer service through a
functional managerial grid. At the apex, a senior manager is responsible for the efficiency
of each IDEA call centre. He is supported by a manager, responsible for the day-to-day
functioning of the call centre of her Circle. In turn, he/she is supported by a shift in-
charge who shouldered the supervisory responsibility of the customer service agents and
was available for online guidance round-the clock. Idea Cellular’s customer-interfacing
managerial grid became unique in India with the position of an Evaluator. The Evaluator

270
acted as a filter and online trainer. He/she listens to about 10 calls per CSA across 15
CSAs every day, acting as an effective filter for the quality of the opening verbiage,
information dissemination and closing verbiage. The Evaluator not only acts as a referee:
he/she identifies superior performance and replicates them across the team, enabling
deviations from an established quality norm to be corrected immediately. As a result, the
Evaluator catalyzed a continuous up gradation in the quality of Idea’s service.
This managerial structure is considered not just a service facilitator; it also provides a
means for the career growth of the call-centre professionals in terms of responsibility,
authority and attractive remuneration.
5.28 Response Management
Idea Cellular Ltd. has always encouraged customers to interact with the organization in
any way which they found convenient. To respond with speed and effectiveness to more
than 7000 faxes, 5000 emails and 3000 letters that came in each month, IDEA has created
a Response Management team. Each incoming communication was addressed within 48
hours, responding in detail to the query, satisfying the customer and helping to retain her
as a valued customer. A team leader is ever present to monitor and motivate the CSA and
provide back-end support in the areas of refunds, billing query and adjustments.
5.29 Retention and Churn Management Team
To gain and insight into the reasons as to why the customers felt dissatisfied, Idea
Cellular created a Retention and Churn Management Team. This team makes a reactive
attempt to call customers and analyze the reasons for their wishing to discontinue their
relationship. In the event that these reasons are internal to the organization, the company
works on correcting the problem faced by the customer and convinces the customer of
non-occurrence of the problem once again. This customer feedback and learning are
shared with the entire customer service team as an insurance against their recurrence. As
a result of this initiative, Idea Cellular enjoys a retention rate in excess of 30 per cent,
higher than the industry average of 25 per cent.

271
5.30 Regulatory Compliance
IDEA Cellular has a Regulatory Compliance team that works closely with the law-
enforcing agencies of the country to prevent the misuse of cell phone connections,
leading to a safe community for all. Customer service is not just supported with
infrastructure but also organizationally facilitated in a manner that makes it possible for
customers to be serviced in the shortest time and in the most effective manner. To do this
on a continuous basis, the structure has been tailor made to the requirement of the
customer and the business, classified into a call centre, response management, retention
and churn management, as well as regulatory compliance divisions.
5.31 Billing
When IDEA was born out of the merger of Tata Cellular and Birla AT&T, the immediate
priority was to integrate the diverse billing systems under a common technology
umbrella. IDEA responded with speed and accuracy: it evolved the Kenan Arbor system
in AP, SEMA CABS in Gujarat, LHS version 4.0 in MP and SEMA CABS in
Maharashtra to the LHS version 6.0 in all circles. The standardized IT billing system
presently under usage is 2.5G-enabled and supports GPRS provisioning and charging.
The billing software is equipped to maintain customer accounts and provide back-end
services. IDEA’s billing software was made versatile: it can now be scaled up to handle
larger volumes and respond to wider business complexities like system support for the
call centre and other customer care functions.
5.32 Mediation between Networks
Ideal Cellular Ltd. has a system from Comptel that would permit mediation between
various network nodes such as the MSC, HLR, SMSC etc., and network elements such as
the billing system, fraud management system and data-mining. This installation will
minimize the need to maintain individual links between various network nodes and
network elements. This will ensure greater data integrity and control loss with respect to
usage and provisioning. The mediation function is centralized and standardized across all
of IDEA’s circles.

272
5.33 Fraud Management System
The threats of bad debts and defaults have increased the ongoing need for fraud detection
and prevention. Idea cellular has worked with Subex Software to develop a Fraud
Management System.
5.34 Accounts Management
Since IDEA’s various circles - Gujarat, Maharashtra, Delhi and the corporate office in
Pune - used Oracle 11, while MP used Tally and AP used SAP R3 4.0, it was considered
imperative to implement a standardized accounting application. As a result, the
company’s accounting function is being upgraded to Oracle 11 (upgrade version), which
will facilitate the consolidation and reconciliation of accounts from all circles.
5.35 Value-Added Services
Superior customer service is the critical differentiator among various players in the
cellular industry. To strengthen this delivery, the IT team of Idea has developed a host of
value-added services: subscriber-self care, self provisioning bills and bills on the Internet,
bulk message transmission, content-based applications and differentiated billing.
In a number of ways, a cellular company like IDEA works likes a bank. Each time the
company adds a post-paid subscriber, she has to be appraised for her capacity and
willingness to pay her bill on time. The greater the number of connections that are rolled
out, the greater is the need for the company to monitor the quality of its credit
outstanding in the marketplace. This is a complex exercise for a number of reasons: it
must be conducted across more than a million subscribers; it must be conducted across
various income and society profiles. In view of the need to expand the customer base and
manage the quality of credit, the company instituted two departments - Credit and Risk
Management and Collection Risk Management.
5.36 Credit and Risk Management
At IDEA, the Credit and Risk Management team developed a unique dartboard system to
effectively manage the quality of creditors’ risk:

273
This function includes the following activities:
a) Activation check Contact point verification
b) Date of birth (DOB)/Telephone number verification
c) Exposure control
5.36.1 Activation check
An activation check, which ascertained the proof of residence, is conducted at Idea
Cellular offices and franchisee shops before a connection is activated.
5.36.2 Contact point verification
Once the connection was activated, contact point verification was conducted. As a part of
the protocol, a face-to-face interaction is conducted with every individual customer to
verify the address and date of birth. This exercise is conducted by an external
independent agency, generating additional customer information and once the credit risk
associated with a subscriber is met, the STD/ISD facility is extended.
5.36.3 DOB/Telephone Number verification
This verification was incorporated to minimize the instances of fraudulent subscribers
seeking multi address connections. To mitigate such use, IDEA instituted a date-of-birth
check across the connections with different addresses. This check emerged as an industry
benchmark and information arising out of fraudulent use and is shared within the
industry.
5.36.4 Exposure control
Idea Cellular manages its aggregate credit exposure through an ongoing check and
control of the size of credit of its individual subscribers. Each subscriber is accorded a
credit limit that is based on the usage and track record of remitting the payment to the
company. In the event of an increase in consumption entailing a higher credit and a
breach in the allotted quantum of credit, Idea Cellular enters into a dialogue with the
subscriber to comprehend the reasons behind the increase and requests for an interim

274
payment. As a result of this ongoing exposure control, bad debts are contained at around
two per cent only, considerably lower than the national industry average.
5.37 Collection Risk Management
For the post paid customers, bills are dispatched immediately following the end of the
subscribers’ billing cycle. This action is reinforced with an SMS that indicates to the
customer the dispatch date of the bill, the amount and the due date. Three reminder SMS
are sent to initiate prompt customer action. The company has also made it convenient for
subscribers to settle their bills. IDEA subscribers have the facility of paying through cash,
cheque or credit card. The company opened collection centers across the cities and towns
of its presence. The company, has found that early detection was the most effective fraud
management. In view of this, IDEA delegated its risk management to an automated Fraud
Management System, which analyses information across seventy variables like the
number of minutes consumed, the calling destination, and the time of calls etc to be able
to comprehend the usage pattern of the subscriber and report an unwarranted variation as
soon as it transpires.
As a risk management initiative in the event that the bill is not paid, outward calls are
barred between the 23rd and 25th day from the due date. After the elapse of a month from
the due date, the bill is handed to professional agencies for recovery. The company’s last
recourse is a legal notice under section 138 for dishonored cheques.
5.38 Investment in Technology
Idea Cellular provided its users with a superior service through the use of the digital
GSM technology. This technology, used by IDEA, provided a number of functional
advantages for consumers: an improved voice quality, stronger security, wide-roaming
capabilities and a broad range of services (voice-mail with intelligent message
notification, SMS, enhanced fax service, enhanced data transmission and caller
identification, among others). Interestingly, the digital technology also enabled a more
efficient use of batteries over the competing analogue system, thereby permitting users to
avail of smaller, lighter and trendier handsets.
275
The digital GSM technology possessed a greater capacity than the competing analogue
version. Besides, it gradually replaced the analogue format the world over. IDEA
leveraged the full value of the digital technology through the GSM 900 and GSM 1800
frequencies. The company leveraged the strengths arising from these frequencies to
reduce costs without compromising value. For instance, the signals on the GSM 900
traveled a further distance before they were absorbed or reflected, So a 900MHz BTS
covers a bigger geographic area than an 800MHz cell station, as a result of which IDEA
was able to spread across large distance circles effectively with a GSM-900 network (as
opposed to a GSM-1800 network), resulting in the use of fewer cell stations. IDEA
enhanced value for itself through the customized application of these frequencies. For
instance, Delhi, where the company rolled out its services in November 2002, is a
compact 1483 square Kilometers in size. In such a market, IDEA leveraged the value of
the GSM 1800. At IDEA, the intelligent use of frequencies also served as a competitive
edge. IDEA’s competitors who used the 1800 GSM in a geographically dispersed State
like Maharashtra will need to invest more to create a presence, extending their payback
period and threatening their viability in the process. On the other hand, IDEA’s use of the
GSM 1800 in Delhi prevented competitors with GSM 900 from seizing the advantage as
the distance between two sites was not more than two KMs for IDEA as well as
competitor.
In a technology-intensive business, it is the prudent selection of the right and the
intelligent use of technology that influences service, costs, competitive strength and
viability. IDEA, has selected to work with a technology that is not only relevant for the
GSM technology’s needs but was also compatible with the Universal Mobile
Telecommunications System, often referred to as the 3G. This compatibility worked for
consumer and corporate benefit. The consumer was able to scale up seamlessly when the
company decided to upgrade the service. As a result, Idea saw the selection of the GSM
technology as a prudent de-risking of the company’s existing investments from long-term
losses arising from obsolescence. IDEA’s 2.5 G compatibility was in line with its
conviction that it must be in a position to deliver cutting-edge service faster than its
276
competitors. As a result, the company was in a position to offer the quality of service that
European users enjoy as soon as the regulatory environment enables it to do so. The 3G
technology, when introduced, is expected to revolutionize the concept of mobile
telephony. It is expected to support a transmission capacity of up to 2 MB (as opposed to
9.6 KB through the GSM route).
5.39 Widespread Network Coverage
IDEA, believes that when a subscriber makes a call, he or she should be able to get
through on the first attempt. Network management represented the core of all the activity
at IDEA. The company has an in-house network optimization team which uses an
Advanced Radio Frequency analytical tool to maintain the network at all times. IDEA
established model tuning for the ten leading towns per circle which translated into a
superior coverage and quality. The company’s use of micro-sites resulted in an enhanced
street coverage. IDEA also successfully indigenized no critical maintenance.
The various maintenance initiatives undertaken by the company included the following:
• In-house network planning.
• In-house project implementation.
• In-house operations and maintenance (O&M) except software handling.
• Infrastructure sharing.
• The replacement of on-site 20 KVA DG sets with 15 KVA alternatives.
• The servicing, repair and maintenance of DG sets.
The last initiative reduced the company’s dependence on external vendors and shrunk the
turnaround time in correcting technical issues.
5.40 Network Performance Management
The performance of the network is assessed on the following parameters:
a) Call drop
b) Hand Over Failure
c) System Availability

277
5.40.1 Call Drop
Customers often face the problem of being in the middle of an important call on the cell
phone and discovering that the person at the other end is unable to hear. IDEA Cellular
has invested adequately in the network to ensure that this phenomenon does not happen.
As a result, even through a call drop of three per cent is permitted as per international
standards; the corresponding figure is as low as 1.1 per cent in, cities like Nagpur.
5.40.2 Handover Failure
When customers call from their cell phone to someone on another network often they
experience the phenomenon of listening to a prerecorded voice announcing that the
called person is not available and requesting them to call again. IDEA, has invested
prudently in technologies to minimize such occurrences. Even though the international
failure level for handovers is set at five per cent, the corresponding number at IDEA is
around only 0.5 percent in a location like Nagpur.
5.40.3 System Availability
On a number of occasions it is impossible to make call across simply because the system
that supports the network develops a technical error. At IDEA, the robust natures of the
system as well as an ongoing maintenance initiative ensure that the system is available
almost anytime any subscriber makes a call. This international average for system
availability is placed at 99.8 per cent. IDEA’s corresponding figure for a location like
Panjim was 100 per cent 99.9 per cent at Hyderabad and 99.87 at Gwalior.

278
5.41 Survey of Idea Cellular Customers
As per the research design, discussed in the second chapter, a survey was carried out in
the twin cities of Hyderabad and Secunderabad, among the customers of Idea cellular.
The sample consisted of both prepaid and post paid customers of Idea Cellular. A
structured questionnaire was used to carry out the survey. The survey was carried out at
the company operated Customer Care Office and select dealer outlets of Idea Cellular
(Idea n U outlets) located in Hyderabad and Secunderabad. A total number of sixty ‘Post
paid’ customers and seventy four ‘Pre paid’ customers were interviewed in the process.
The questionnaire used for the survey is presented in the appendix.
Both open ended and close ended questions were used in the survey. For the close ended
questions, in order to analyze the results, the responses were grouped into different
categories as per the choices selected by the respondents. For the open ended questions,
depending on the responses given by the respondents, different categories were created
and the responses were grouped under these categories.
5.41.1 Analysis
In order to have a better understanding of the survey, various bar charts and pie diagrams
were constructed, as per the data obtained. In the analysis part, each question is presented
separately, along with the frequency tables, in each category of response (number of
responses under each of the categories for a particular question), and the corresponding
bar chart/ pie diagram is also presented, followed by the observations made. Details of
non-parametric tests which were conducted to test the statistical significance of the
results obtained are presented in the appendix.

279
Analysis of Data Related to Idea Cellular’s Prepaid Customer Survey
Gender No. of Responses
Percentage (%)
Male 68 92 Female 6 8 Total Responses 74 100
Observation
More than ninety percent of the respondents are men. This phenomenon could be due to
the reason that the interviews were conducted at the customer touch points, and most of
the customers who approached the touch points were men.
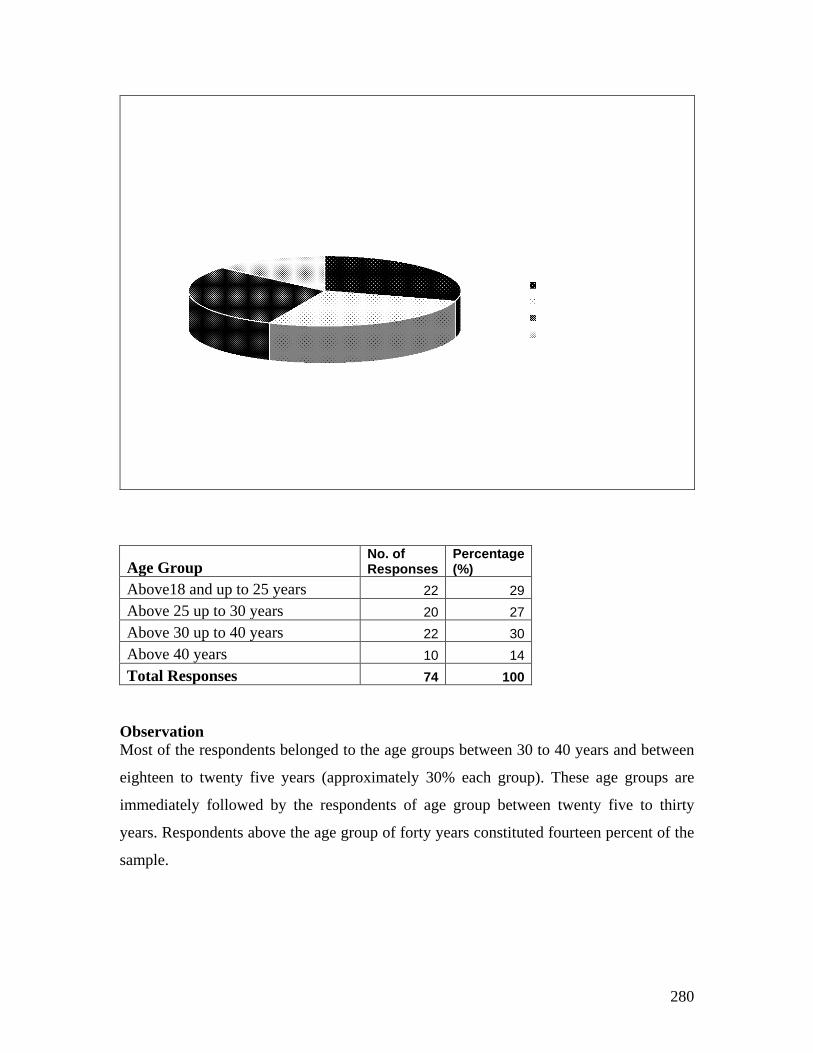
280
Age Group No. of Responses
Percentage (%)
Above18 and up to 25 years 22 29 Above 25 up to 30 years 20 27 Above 30 up to 40 years 22 30 Above 40 years 10 14 Total Responses 74 100
Observation Most of the respondents belonged to the age groups between 30 to 40 years and between
eighteen to twenty five years (approximately 30% each group). These age groups are
immediately followed by the respondents of age group between twenty five to thirty
years. Respondents above the age group of forty years constituted fourteen percent of the
sample.

281
Monthly Income Category No. of Responses
Percentage (%)
Up to Rs.5000/- 6 15 Above Rs.5000 up to Rs.10,000 16 40 Above Rs.10,000 up to Rs.15,000 10 25 Above Rs.15,000 up to Rs.20,000 4 10 Above Rs.20,000 4 10 Total Responses 40 100
Observation Most of the respondents (40%) belong to the income category between Rs.5000/- to
Rs.10, 000/- per month. Twenty five percent of the respondents have a monthly income
in the range above Rs.10, 000/- and below Rs.15, 000/- per month. Fifteen percent of the
respondents have monthly income up to Rs.5000/-. Ten percent of the respondents have
monthly income between Rs.15, 000/- and Rs.20, 000/-. Another ten percent of the
respondents reported monthly income above Rs.20, 000/-. As discussed in the earlier
units, mobile telecom service charges have drastically reduced during the past four years.
This would explain the fact that even people with lower incomes started using mobile
telephone services.
0
2
4
6
8
10
12
14
16
No. of respondents
Upto Rs.5000/-
Above Rs.5000 up to
Rs.10,000
Above Rs.10,000
up to Rs.15,000
Above Rs.15,000
up to Rs.20,000
Above Rs.20,000
Monthly Income Categories
Categories of respondents on the basis of Monthly Income

282
Nature of Cell Connection No. of Responses
Percentage (%)
Own 65 88 Company Sponsored 9 12 Total Responses 74 100
Observation Of the seventy four respondents, sixty five respondents have their own cell phone
connections. Only nine respondents have their cell phone connections, being sponsored
by the companies in which they are working.

283
2. How long have you been using Idea Cellular Connection?
Response Category No. of Responses
Percentage (%)
Up to 6 months 8 11 More than 6 months upto1 year 10 14 More than 1 year, up to 2 Years 18 24 More than 2 years 38 51 Total Responses 74 100
Observation More than fifty percent of the respondents have been using Idea Cellular connection for
more than two years. Another twenty four percent of the customers have been using
Idea’s connection for more than a year, but for less than two years. Eleven percent of the
customers are relatively new to Idea Cellular connection, i.e. they have been using Idea’s
connection for less than six months.
0
5
10
15
20
25
30
35
40
No. of customers
Upto 6 months More than 6 months upto1
year
More than 1 year, upto 2 Years
More than 2 years
Duration of usage
Usage Duration Vs. No. of Customers

284
3. Are you aware of the following? Aware Unaware %Aware %Unaware Team response unit (at the corporate office of Idea Cellular Ltd.) 38 36 51 49 E-mail i.d. ( [email protected]) 39 35 53 47 Team Response desk at dealer outlets 39 35 53 47 Call center number (12345) 62 12 84 16
Observation It is observed very clearly that of all the touch points managed by the company, the call
center has the maximum awareness level (84% of the respondents are aware of it).
Around fifty percent of the respondents are aware of other touch points like the Team
response Unit managed by the company, Team Response Desk at the dealer outlets, and
e-mail address provided by the company. Factors like the service provider itself being a
telecom company, and toll free facility could be the reasons behind the popularity of the
Call Center.
0
10
20
30
40
50
60
70
No. of respondents
Touch points
Awareness levels regarding various touch points
Aware 38 39 39 62 Unaware 36 35 35 12
Team response unit (at Khan
E-mail i.d. ( ccare.ap@ideac
Team Response desk at dealer
Call center number (12345)

285
4. Have you ever visited Team Response at Idea Cellular Office (managed by the Company)
Response Category No. of Responses Percentage (%)
YES 38 51 NO 36 49 Total Responses 74 100
Observation Fifty one percent of the respondents who answered the question replied that they have
visited the ‘Team Response Unit’, managed by the company. The reasons for their visit
and their experiences at the ‘Team Response Unit’ are analyzed in the next questions. As
mentioned earlier, the Call center being very popular among the customers could have
been the choice of the contact point for most of the customers, and they would visit the
“Team Response Unit”, unless they have a need that could not be solved through the call
center.

286
4 a) Purpose of visiting ‘Team Response Unit’
Response Category No. of Responses
Percentage (%)
A) Lodging a complaint 6 16 B) To request for services 8 21 C) Getting General Information 10 26 D) Any other reason 14 37 Total Responses 38 100
Observation Majority of the respondents (37%), who made a visit to the ‘Team Response Unit’, have
chosen the category ‘D’ i.e. reasons mentioned other than in categories, A, B, C. Other
reasons mainly included change of the SIM card, as the old card was damaged, bill
settlements, obtaining new connections etc. Twenty six percent of the respondents
mentioned that they visited the ‘Team response Unit’ to get general information on the
services offered by the company. Twenty six percent of the respondents visited “Team
Response Unit’ to make requests for the activation of certain services. Another sixteen
percent of the respondents visited “Team Response Unit’ to lodge complaints.
0
2
4
6
8
10
12
14
No. of respondents
A) Lodging a complaint
B) To request for services
C) Getting General Information
D) Any other reason _________________
(Pls. mention) Purposes
Purpose of visiting Team response

287
4 b) The waiting time at the ‘Team Response’ was:
Response Category No. of Responses
Percentage (%)
A) ≤ 5 min. 10 26 B) > 5 min≤ 10 min. 12 32 C) >10 min≤15 min. 8 21 D) > 15 min. 8 21 Total Responses 38 100
Observation Thirty two percent of the respondents mentioned that the waiting time at the “Team
Response Unit” was between five to ten minutes. Twenty six percent of the respondents
mentioned that the waiting time was less than five minutes. Twenty one percent of the
respondents mentioned that waiting time was between ten to fifteen minutes. Another
twenty one percent felt that the waiting time was more than fifteen minutes.

288
4 c) What did you feel about the waiting time?
Response Category No. of Responses Percentage (%)
A) Very High 4 11 B) High 4 11 C) Reasonable 20 53 D) Less 4 11 E) Very Less 6 16 Total Responses 38 100
Observation Majority of the respondents, i.e. 53% of them felt that the waiting time was reasonable.
Eleven percent (each) of the respondents felt that the waiting time was very high, high
and less respectively. Sixteen percent of the respondents felt that the waiting time was
very less. As already observed in the earlier question, 26% of the respondents had a
waiting time of less than five minutes and 32% of the respondents had a waiting time
between five to ten minutes.
Respondents feeling about waiting time
A) Very High 11%
B) High 11%
C) Reasonable 52%
D) Less 11%
E) Very Less 15%

289
4 d) Are the staff members friendly and helpful?
Response Category No. of Responses Percentage (%)
A) Definitely Yes 20 53 B) Generally Yes 14 37 C) Can’t Say 4 11 D) Generally No 0 0 E) Definitely No 0 0 Total Responses 38 100
Observation Fifty three percent of the respondents observed that the staff members at the ‘Team
Response Unit’ are definitely friendly and helpful, while thirty seven percent of the
respondents generally agreed that the staff members are friendly and helpful. Eleven
percent of the respondents could not decide about the helpfulness and friendly nature of
‘Team Response’ staff.

290
4e) Was your problem solved in an amicable manner?
Response Category No. of Responses Percentage (%)
A) Definitely Yes 10 26 B) Generally Yes 20 53 C) Can’t Say 4 11 D) Generally No 4 11 E) Definitely No 0 0 Total Responses 38 100
Observation Majority of the respondents (53%) generally agreed that their problem was solved in an
amicable manner at the “Team Response Unit”. Twenty six percent of the respondents
definitely agreed that their problem was amicably solved. Eleven percent of the
respondents could not decide on this matter. Another eleven percent of the respondents
gave their reply as “Generally No” to the query.
0 2 4 6 8
10 12 14 16 18 20
No. of Respondents
A) Definitely Yes
B) Generally Yes
C) Can’t Say D) Generally No
E) Definitely No
Levels of Agreement
Whether the problem was solved in an amicable manner

291
5) Have you ever visited an Idea Dealer Outlet
Response Category No. of Responses Percentage (%)
YES 10 14 NO 64 86 Total Responses 74 100
Observation
Only ten respondents i.e. fourteen percent of the respondents stated that they have visited
Idea Cellular dealer outlets. The remaining eighty six percent did not visit the dealer
outlets. As has been observed earlier, the toll free call center number is the most popular
touch point across cell phone users.
292
5 a) Purpose of visiting ‘Team Response Unit’
Response Category Frequency Percentage (%)
A) Lodging a complaint 6 60 B) To request for services 0 0 C) Getting General Information 4 40 D) Any other reason 0 0 Total Responses 10 100
Observation Sixty percent of the respondents made a visit to the dealer outlets to lodge a complaint,
while forty percent of the respondents visited the dealer outlets to get general information
regarding the services offered by Idea Cellular.

293
5 b) The waiting time at the ‘Team Response’ was:
Response Category No. of Responses
Percentage (%)
A) ≤ 5 min. 2 20 B) > 5 min≤ 10 min 6 60 C) >10 min≤15 min 2 20 D) > 15 min 0 0 Total Responses 10 100
Observation Sixty percent of the respondents i.e. six out of the ten respondents had experienced a
waiting time between five to ten minutes at the dealer outlets. Twenty percent of the
respondents had a waiting time of less than five minutes and the remaining twenty
percent of the respondents had a waiting time between ten to fifteen minutes.
294
5c) What did you feel about the waiting time?
Response Category No. of Responses Percentage (%)
A) Very High 2 20 B) High 2 20 C) Reasonable 6 60 D) Less 0 0 E) Very Less 0 0 Total Responses 10 100
Observation Sixty percent of the respondents felt that the waiting time was reasonable. This was
followed by the perception that the waiting time was very high (20%) and another twenty
percent of the respondents felt that the waiting time was high.

295
5 d) Are the staff members at dealer outlet friendly and helpful?
Response Category No. of Responses Percentage (%)
A) Definitely Yes 2 20 B) Generally Yes 6 60 C) Can’t Say 2 20 D) Generally No 0 0 E) Definitely No 0 0 Total Responses 10 100
Observation Out of the ten respondents who answered the question, six respondents generally agreed
that the staff members at the dealer outlets are friendly and helpful. Two respondents felt
that they were definitely helpful and friendly, while the remaining two respondents could
not decide.

296
5e) Was your problem solved in an amicable manner?
Response Category No. of Responses Percentage (%)
A) Definitely Yes 2 20 B) Generally Yes 4 40 C) Can’t Say 0 0 D) Generally No 4 40 E) Definitely No 0 0 Total Responses 10 100
Observation While forty percent of the respondents generally agreed that their problem was solved
amicably, at the dealer outlet, another forty percent of the respondents generally
disagreed that their problem was solved in an amicable manner. The remaining twenty
percent of the respondents definitely agreed that their problem was solved in an amicable
manner.

297
6. Are you satisfied with the time taken to provide a solution to your problem?
Response Category No. of Responses Percentage (%)
Highly Satisfied 4 17 Satisfied 8 33 Can't Say 8 33 Dissatisfied 4 17 Highly Dissatisfied 0 0 Total Responses 24 100
Observation While thirty three percent of the respondents are satisfied with the time taken to solve
their problem, another thirty three percent could not decide on their satisfaction/
dissatisfaction. Seventeen percent of the respondents felt dissatisfied with the time taken
to solve their problems, while another seventeen percent respondents felt highly satisfied
with the time taken to solve their problem.

298
7a) Your language preference (while using IVR)
Response Category No. of Responses
Percentage (%)
English 36 58 Telugu 16 26 Hindi 10 16 Total Responses 62 100
Observation Fifty eight percent of the respondents gave their language preference as English, while
using IVR service Twenty six percent of the respondents mentioned Telugu as their
preferred language while using IVR. The remaining sixteen percent respondents
mentioned Hindi as their choice of language while using IVR service.

299
7b) Are you satisfied with the information given by IVR?
Response Category No. of Responses Percentage (%)
Highly Satisfied 6 10 Satisfied 34 55 Can't Say 12 19 Dissatisfied 10 16 Highly Dissatisfied 0 0 Total Responses 62 100
Observation Fifty five percent of the respondents mentioned that they are highly satisfied with the
information given by IVR. Nineteen percent of the respondents could not decide on their
satisfaction levels. Sixteen percent of the respondents observed that they are highly
dissatisfied with the information given by IVR. The remaining ten percent respondents
mentioned that they are highly satisfied with the information given by IVR service.

300
7c) Are you satisfied with the time taken to talk to an operator, at the call center?
Response Category No. of Responses Percentage (%)
Highly Satisfied 7 11 Satisfied 25 40 Can't Say 14 23 Dissatisfied 16 26 Highly Dissatisfied 0 0 Total Responses 62 100
Observation Forty percent of the respondents mentioned that they are satisfied with the time taken to
talk to an operator at the call center. Twenty six percent of the respondents replied that
they are dissatisfied with the time taken to talk to an operator. The remaining eleven
percent respondents mentioned that they are satisfied with the time taken to talk to an
operator at the call center.

301
7d) Are you satisfied with the assistance offered by the operator in solving your problem?
Response Category No. of Responses Percentage (%)
Highly Satisfied 13 21 Satisfied 22 35 Can't Say 5 8 Dissatisfied 22 35 Highly Dissatisfied 0 0 Total Responses 62 100
Observation Thirty five percent of the respondents mentioned that they are dissatisfied with the
assistance offered by the operator in solving their problem, while another thirty five
percent of the respondents stated that they are satisfied with the assistance offered by the
operator. Twenty one percent of the respondents mentioned that they are highly satisfied
with the assistance offered by the operator in solving their problems.

302
Q8 How do you rate the overall service given by Idea Cellular?
Response Category No. of Responses
Percentage (%)
Highly Satisfying 10 14 Satisfying 42 57 Neither Satisfying nor Dissatisfying 16 22
Dissatisfying 6 8 Highly Dissatisfying 0 0 Total Responses 74 100
Observation Fifty seven percent of the respondents rated the overall service given by Idea Cellular as
‘Satisfying’. Twenty two percent of the respondents mentioned that the overall service is
neither satisfying nor dissatisfying. Fourteen percent of the respondents rated the overall
service delivered by Idea Cellular as ‘Highly Satisfying’. The remaining eight percent of
the respondents rated the overall service as dissatisfying.

303
Q9 Would like to continue with Idea Cellular connection for another year?
Response Category No. of Responses Percentage (%)
Definitely Continue 22 30 May continue 22 30 Can't Say 20 27 May Discontinue 8 11 Definitely Discontinue 2 3 Total Responses 74 100
Observation Thirty percent of the respondents stated that they would definitely continue with Idea
Cellular for another one year, while another thirty percent of the respondents stated that
they may continue with Idea Cellular for another one year. Twenty seven percent of the
respondents could not decide, while eleven percent of the respondents stated that they
may discontinue with Idea Cellular connection. The remaining three percent of the
respondents stated that they would discontinue with Idea Cellular connection in the
coming one year. The reasons for these decisions are analyzed in the next questions.

304
9 a) Reasons for Continuing with Idea Cellular
Response Category No. of Responses
Percentage (%)
Do not want to change the number 4 40 No problems encountered 6 60 Total Responses 10 100
Observation Out of the ten respondents who answered the question, six respondents stated that they
would like to continue with Idea Cellular, as they did not experience any problems. It is
quite interesting to note that the remaining four respondents stated that they would like to
continue with Idea Cellular, as they did not want to change their number.
Reasons for Continuing with Idea
4
6
0
1
2
3
4
5
6
7
Do not want to change the number No problems encountered Reasons
No. of Respondents

305
Reasons for Discontinuing Idea's Connection
Planning to go for BSNL17%
Proper information is not given33%
Total No. of Responses50%
9b) Reasons for discontinuing Idea Reasons Number Percentage Planning to go for BSNL 2 33 Proper information is not given 4 67 Total No. of Responses 6 100
Observation Out of the six respondents who answered the question, four respondents stated that they
would like to discontinue with Idea Cellular, as they felt that proper information was not
provided by the company, when they needed it. It is quite interesting to note that the
remaining two respondents stated that they would like to shift to BSNL, a public sector
competitor of Idea.

306
Q10. Would you suggest usage of Idea Cellular to your friends/ relatives?
Response Category No. of Responses Percentage (%)
Definitely Suggest 18 24 May Suggest 22 30 Can't Say 18 24 May Not Suggest 8 11 Definitely not suggest 8 11 Total Responses 74 100
Observation Thirty percent of the respondents mentioned that they may suggest the usage of Idea
Cellular to their friends/ relatives. Twenty four percent of the respondents stated that they
would definitely suggest Idea Cellular to their friends/ relatives. Another twenty four
percent of the respondents could not decide. Eleven percent of the respondents stated that
they may not suggest the usage of Idea Cellular to their friends/ relatives, while the
remaining eleven percent respondents stated that they definitely would not suggest the
usage of Idea Cellular to their friends/ relatives.

307
11. What are your suggestions for improvement of services offered by Idea?
Response Category No. of Responses
Percentage (%)
Network should be wider( more coverage area) 8 29 Clarity should be improved( signals are weak) 8 29 special plans should be launched for long term customers 4 14 Talk time should be increased 2 7 Should have more number of tariff plans( like competitors) 2 7 Waiting time with call centre operator should be decreased 2 7 Service should be improved 2 7 Total Responses 28 100
Observation Twenty nine percent of the respondents suggested that Idea’s network coverage should be
wider, while another twenty nine percent of the respondents stated that the strength of the
signals should be improved, so that better clarity of voice is achieved. Other suggestions
include the launch of special plans for long term customers, increase of the amount of
talk time, reduction in time taken to talk with call center operator etc.
0
1
2
3
4
5
6
7
8
No. of Respondents
Network should be
wider( more coverage area)
Clarity should be improved( signals are
weak)
special plans should be
launched for long term customers
Talk time should be increased
Should have more number of tariff plans(
like competitors)
Waiting time with call centre
operator should be decreased
Service should be improved
Suggestions
Suggestions for the improvement of Services
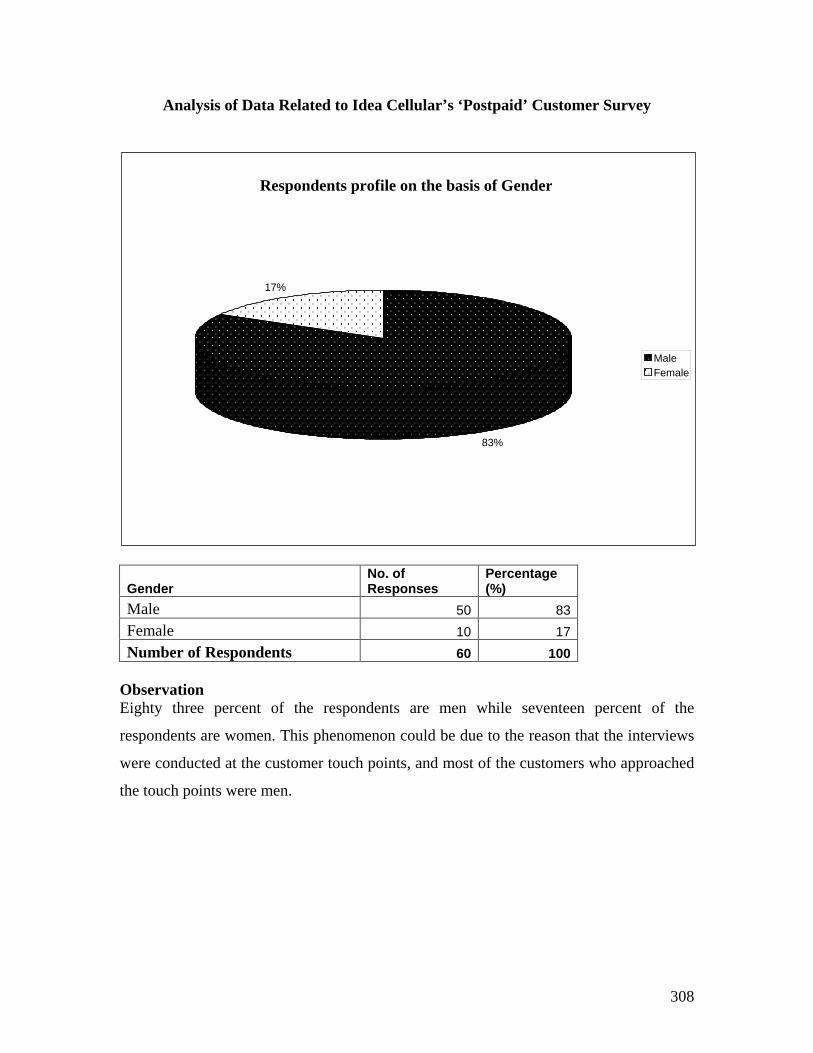
308
Analysis of Data Related to Idea Cellular’s ‘Postpaid’ Customer Survey
Gender No. of Responses
Percentage (%)
Male 50 83 Female 10 17 Number of Respondents 60 100
Observation Eighty three percent of the respondents are men while seventeen percent of the
respondents are women. This phenomenon could be due to the reason that the interviews
were conducted at the customer touch points, and most of the customers who approached
the touch points were men.
83%
17%
Male Female
Respondents profile on the basis of Gender

309
Age Group No. of Responses
Percentage (%)
Above18 and up to 25 Years 8 13 Above 25 up to 30 22 37 Above 30 up to 40 28 47 Above 40 2 3 Total Responses 60 100
Observation Most of the respondents (47%) belong to the age groups between 30 to 40 years and
thirty seven percent of the respondents belong to the age group between twenty five years
and thirty years. These age groups are immediately followed by the respondents of age
group between eighteen to twenty five years (13%). Respondents above the age group of
forty years constituted three percent of the sample.
13%
37% 47%
3%
Above18 and upto 25 Years Above 25 upto 30 Above 30 upto 40 Above 40
Age profile of Post Paid Respondents

310
Monthly Income Category No. of Responses
Percentage (%)
Up to Rs.5000/- 6 13 Above Rs.5000 up to Rs.10,000 28 58 Above Rs.10,000 up to Rs.15,000 8 17 Above Rs.15,000 up to Rs.20,000 6 13 Above Rs.20,000 0 0 Total Responses 48 100
Observation Most of the respondents (58%) belong to the income category between Rs.5000/- to
Rs.10, 000/- per month. Seventeen percent of the respondents have a monthly income in
the range above Rs.10, 000/- and below Rs.15, 000/- per month. Thirteen percent of the
respondents have monthly income up to Rs.5000/-. Another thirteen percent of the
respondents have monthly income between Rs.15, 000/- and Rs.20, 000/-. As discussed
in the earlier units, mobile telecom service charges have drastically reduced during the
past four years. This would explain the fact that even people with lower incomes started
using mobile telephone services
0
5
10
15
20
25
30
No. of respondents
Upto Rs.5000/- Above Rs.5000 upto Rs.10,000
Above Rs.10,000 upto Rs.15,000
Above Rs.15,000 upto Rs.20,000
Above Rs.20,000
Monthly Income Categories
Categories of the respondents on the basis of Monthly Income

311
Type of connection No. of Responses
Percentage (%)
Own 50 83 Company Sponsored 10 17 Total Responses 60 100
Observation Of the sixty respondents, fifty respondents have their own cell phone connections. Only
ten respondents have their cell phone connections, being sponsored by the companies in
which they are working.
83%
17%
Own Company Sponsored
Nature of Cell phone Connection

312
2. How long have you been using Idea Cellular?
Response Category No. of Responses Percentage (%)
Up to 6 months 6 10 More than 6 months upto1 year 10 17 More than 1 year, up to 2 Years 28 47 More than 2 years 16 27 Total Responses 60 100
Observation Forty seven percent of the customers have been using Idea’s connection for more than a
year, but for less than two years. Twenty seven percent of the respondents have been
using Idea Cellular connection for more than two years. Seventeen percent of the
respondents have been using Idea Cellular for more than six months, but less than one
year. Ten percent of the customers are relatively new to Idea Cellular connection, i.e.
they have been using Idea’s connection for less than six months.
0
5
10
15
20
25
30
No. of customers
Up to 6 months More than 6 months up to1 year
More than 1 year, up to 2 Years
More than 2 years
Duration of usage
Usage duration vs. No. of Customers

313
3. Are you aware of the following: Touch Points Aware Unaware %Aware %Unaware Team response unit (at corporate office of Idea Cellular Ltd.) 58 2 97 3 E-mail i.d. ( [email protected]) 10 50 17 83 Team Response desk at dealer outlets 10 50 17 83 Call center number (12345) 58 2 97 3
Observation It is observed very clearly that of all the touch points managed by the company, the call
center and ‘Team Response Unit’ have the maximum awareness levels (97% of the
respondents are aware of them). Around seventeen percent of the respondents are aware
of touch points like Team Response Desk at the dealer outlets, and e-mail address
provided by the company. Factors like the service provider itself being a telecom
company, and toll free facility could be the reasons behind the popularity of the Call
Center. The awareness about ‘Team Response Unit’ is higher among these respondents,
as all of them are post paid customers, and have more chances of interacting with team
members.
0
10
20
30
40
50
60
No. of respondents
Touch points
Awareness levels regarding various touch points
Aware 58 10 10 58 Unware 2 50 50 2
Team response unit (at Khan Latif Khan- corporate
E-mail i.d. ( ccare.ap@ideacellu
lar.com) Team Response desk at dealer
outlets Call center number
(12345)

314
4. Have you ever visited Team Response at Idea Cellular Office (KLK) Response Category No. of Responses Percentage (%) YES 58 97 NO 2 3 Total Responses 60 100
Observation Ninety seven percent of the respondents who answered the question replied that they
have visited the ‘Team Response Unit’, managed by the company. The reasons for their
visit and their experiences at the ‘Team Response Unit’ are analyzed in the next
questions.

315
4 a) Purpose of visiting ‘Team Response Unit’
Response Category No. of Responses Percentage (%)
A) Lodging a complaint 6 10 B) To request for services 10 16 C) Getting General Information 8 13 D) Any other reason 38 61 Total Responses 62 100
Observation Majority of the respondents (61%), who made a visit to the ‘Team Response Unit’, have
chosen the category ‘D’ i.e. reasons mentioned other than in categories, A, B, C. Other
reasons mainly included change of the SIM card, as the old card was damaged, bill
settlements, obtaining new connections etc. Thirteen percent of the respondents
mentioned that they visited the ‘Team response Unit’ to get general information on the
services offered by the company. Sixteen percent of the respondents visited “team
response Unit’ to make requests for the activation of certain services. Another ten percent
of the respondents visited “Team Response Unit’ to lodge complaints.
0
5
10
15
20
25
30
35
40
No. of respondents
A) Lodging a Complaint
B) To request for Services
C) Getting General Information
D) Any other reason
Purposes
Purpose of visiting Team response

316
4b) The waiting time was:
Response Category No. of Responses
Percentage (%)
A) ≤ 5 min. 12 21 B) > 5 min≤ 10 min 24 41 C) >10 min≤15 min 12 21 D) > 15 min 10 17 Total Responses 58 100
Observation Forty one percent of the respondents mentioned that the waiting time at the “Team
Response Unit” was between five to ten minutes. Twenty one percent of the respondents
mentioned that the waiting time was less than five minutes. Another twenty one percent
of the respondents mentioned that waiting time was between ten to fifteen minutes.
Seventeen percent of the respondents mentioned that the waiting time was more than
fifteen minutes.
Waiting Time at Team Response
21%
41%
21%
17%
A) B) C) D)

317
4c) What did you feel about the waiting time?
Response Category No. of Responses Percentage (%)
A) Very High 10 17 B) High 10 17 C) Reasonable 26 45 D) Less 8 14 E) Very Less 4 7 Total Responses 58 100
Observation Most of the respondents, i.e. forty five percent of them felt that the waiting time was
reasonable. Seventeen percent (each) of the respondents felt that the waiting time was
very high and high respectively. Fourteen percent of the respondents felt that the waiting
time was less. Seven percent of the respondents felt that the waiting time was very less.
Respondents feeling about waiting time
17%
17%
45%
14% 7%
A) Very High B) High C) Reasonable D) Less E) Very Less

318
4d) Are the staff members friendly and helpful?
Response Category No. of Responses Percentage (%)
A) Definitely Yes 34 57 B) Generally Yes 22 37 C) Can’t Say 4 7 D) Generally No 0 0 E) Definitely No 0 0 Total Responses 60 100
Observation
Fifty seven percent of the respondents observed that the staff members at the ‘Team
Response Unit’ are definitely friendly and helpful, while thirty seven percent of the
respondents generally agreed that the staff members are friendly and helpful. Seven
percent of the respondents could not decide about the helpfulness and friendly nature of
‘Team Response’ staff.
34
22
4
0 0
0
5
10
15
20
25
30
35
No. of Respondents
A) Definitely Yes
B) Generally Yes
C) Can’t Say D) Generally No E) Definitely No
Levels of Agreement
Whether the Staff Members at Team Response Were Helpful

319
4e) Was your problem solved in an amicable manner? Response Category No. of Responses Percentage (%) A) Definitely Yes 34 59 B) Generally Yes 16 28 C) Can’t Say 2 3 D) Generally No 6 10 E) Definitely No 0 0 Total Responses 58 100
Observation Majority of the respondents (59%) definitely agreed that their problem was solved in an
amicable manner at the “Team Response Unit”. Twenty eight percent of the respondents
generally agreed that their problem was amicably solved. Another ten percent of the
respondents gave their reply as “Generally No” to the query. Three percent of the
respondents could not decide on this matter.
Whether the problem was solved in an amicable manner
34
16
2
6
0 0
5
10
15
20
25
30
35
40
A) Definitely Yes B) Generally Yes C) Can’t Say D) Generally No E) Definitely No Levels of Agreement
No. of Respondents

320
5) Have you ever visited an Idea Dealer Outlet
Response Category No. of Responses Percentage (%)
YES 8 13 NO 52 87 Total Responses 60 100
Observation
Only eight respondents i.e. thirteen percent of the respondents stated that they have
visited Idea Cellular dealer outlets. The remaining eighty seven percent did not visit the
dealer outlets. As has been observed earlier, the toll free call center number is the most
popular touch point across cell phone users.
13%
87%
YES NO
Percentage of Respondents who visited Idea dealer outlets

321
2 2
4
0
0
0.5
1
1.5
2
2.5
3
3.5
4
No. of Respondents
A) Lodging a complaint B) To request forservices
C) Getting GeneralInformation
D) Any other reason_________________
(Pls. mention)Purposes
Purpose of visiting a Dealer Outlet
5a) If yes: Purpose of visiting
Response Category No. of Responses
Percentage (%)
A) Lodging a complaint 2 25 B) To request for services 2 25 C) Getting General Information 4 50
Observation
Of the six respondents who gave answers to this question, two of the respondents made a
visit to the dealer outlets to lodge a complaint, while four of the respondents visited the
dealer outlets to get general information regarding the services offered by Idea Cellular.
Another two respondents visited the dealer outlets to make requests for services.

322
4 4
0 0
0
0.5
1
1.5
2
2.5
3
3.5
4
No. of Respondents
A) ≤ 5 min. . B) > 5 min≤ 10 min C) >10 min≤15 min D) > 15 minWaiting Time Categories
Waiting Time at the Dealer Outlet
5b) The waiting time was:
Response Category No. of Responses
Percentage (%)
A) ≤ 5 min. 4 50 B) > 5 min≤ 10 min 4 50 C) >10 min≤15 min 0 0 D) > 15 min 0 0 Total Responses 8 100
Observation Fifty percent of the respondents i.e. four out of the eight respondents had experienced a
waiting time between five to ten minutes at the dealer outlets. The other four respondents
had a waiting time of less than five minutes.

323
5c) What did you feel about the waiting time?
Response Category No. of Responses Percentage (%)
A) Very High 0 0 B) High 0 0 C) Reasonable 2 25 D) Less 2 25 E) Very Less 4 50 Total Responses 8 100
Observation Fifty percent of the respondents felt that the waiting time was very less. Twenty five
percent of the respondents felt that the waiting time was reasonable. The remaining
twenty five percent of the respondents felt that the waiting time was less.

324
5d) Are the staff members friendly and helpful?
Response Category No. of Responses Percentage (%)
A) Definitely Yes 6 75 B) Generally Yes 2 25 C) Can’t Say 0 0 D) Generally No 0 0 E) Definitely No 0 0 Total Responses 8 100
Observation Out of the eight respondents who answered the question, six respondents definitely
agreed that the staff members at the dealer outlets are friendly and helpful. Two
respondents felt that they were generally helpful and friendly.
75%
25% 0%
A) Definitely Yes B) Generally Yes C) Can’t Say
Whether Staff members were at Dealer Outlets were helpful

325
5e) Was your problem solved in an amicable manner? Response Category No. of Responses Percentage (%) A) Definitely Yes 2 25 B) Generally Yes 0 0 C) Can’t Say 0 0 D) Generally No 4 50 E) Definitely No 2 25 Total Responses 8 100
Observation Fifty percent of the respondents generally disagreed that their problem was solved
amicably, at the dealer outlet, another twenty five percent of the respondents definitely
agreed that their problem was solved in an amicable manner. The remaining twenty five
percent of the respondents definitely disagreed that their problem was solved in an
amicable manner.
2
0 0
4
2
0
0.5
1
1.5
2
2.5
3
3.5
4
No. of Respondents
A) Definitely Yes
B) Generally Yes
C) Can’t Say D) Generally No E) Definitely No
Agreement levels of Respondents
Whether the Problem was solved amicably at Dealer outlets?

326
Satisfaction Levels with the time taken to solve the problem
23%
38%
8%
31%
0%
Highly SatisfiedSatisfiedCan't SayDissatisfiedHighly Dissatisfied
6. Are you satisfied with the time taken to provide a solution to your problem? Response Category No. of Responses Percentage (%) Highly Satisfied 6 23 Satisfied 10 38 Can't Say 2 8 Dissatisfied 8 31 Highly Dissatisfied 0 0 Total Responses 26 100
Observation While thirty eight percent of the respondents are satisfied with the time taken to solve
their problem, thirty one percent are dissatisfied. Twenty three percent of the respondents
are highly satisfied with the time taken to solve their problems, while the other eight
percent respondents could not decide their satisfaction/ dissatisfaction.

327
7a) Your language preference (while using IVR)
Response Category No. of Responses Percentage (%)
English 40 67 Telugu 14 23 Hindi 6 10 Total Responses 60 100
Observation Sixty seven percent of the respondents gave their language preference as English, while
using IVR service. Twenty three percent of the respondents mentioned Telugu as their
preferred language while using IVR. The remaining ten percent respondents mentioned
Hindi as their choice of language while using IVR service.

328
7b) Are you satisfied with the info given by IVR?
Response Category No. of Responses Percentage (%)
Highly Satisfied 10 20 Satisfied 30 60 Can't Say 0 0 Dissatisfied 10 20 Highly Dissatisfied 0 0 Total Responses 50 100
Observation Sixty percent of the respondents mentioned that they are satisfied with the information
given by IVR. Twenty percent of the respondents observed that they are dissatisfied with
the information given by IVR. The remaining twenty percent respondents mentioned that
they are highly satisfied with the information given by IVR service.

329
7c) Are you satisfied with the time taken to talk to an operator? Response Category No. of Responses Percentage (%) Highly Satisfied 6 12 Satisfied 16 32 Can't Say 4 8 Dissatisfied 20 40 Highly Dissatisfied 4 8 Total Responses 50 100
Observation Forty percent of the respondents mentioned that they are dissatisfied with the time taken
to talk to an operator at the call center. Thirty two percent of the respondents replied that
they are satisfied with the time taken to talk to an operator. Twelve percent respondents
mentioned that they are highly satisfied with the time taken to talk to an operator at the
call center. Eight percent could not decide, while the remaining eight percent respondents
mentioned that they are highly dissatisfied.

330
7d) Are you satisfied with the assistance offered by the operator your problem? Response Category No. of Responses Percentage (%) Highly Satisfied 6 12 Satisfied 28 56 Can't Say 0 0 Dissatisfied 14 28 Highly Dissatisfied 2 4 Total Responses 50 100
Observation Fifty six percent of the respondents mentioned that they are satisfied with the assistance
offered by the operator in solving their problem, while another twenty eight percent of
the respondents stated that they are dissatisfied with the assistance offered by the
operator. Only twelve percent of the respondents mentioned that they are highly satisfied
with the assistance offered by the operator in solving their problems. Four percent
mentioned that they are highly dissatisfied.

331
8. How do you rate the overall service given by Idea Cellular?
Response Category No. of Responses
Percentage (%)
Highly Satisfying 24 40 Satisfying 28 47 Neither Satisfying nor Dissatisfying 8 13 Dissatisfying 0 0 Highly Dissatisfying 0 0 Total Responses 60 100
Observation Forty seven percent of the respondents rated the overall service given by Idea Cellular as
‘Satisfying’. Forty percent of the respondents rated the overall service delivered by Idea
Cellular as ‘Highly Satisfying’. Thirteen percent of the respondents mentioned that the
overall service is neither satisfying nor dissatisfying.
Overall Rating of Services offered by Idea
40%
47%
13% 0% 0%
Highly Satisfying Satisfying Neither Satisfying nor Dissatisfying Dissatisfying Highly Dissatisfying

332
Q9. Would like to continue with Idea Cellular connection for another year? Response Category No. of Responses Percentage (%) Definitely Continue 32 53 May continue 16 27 Can't Say 10 17 May Discontinue 2 3 Definitely Discontinue 0 0 Total Responses 60 100
Observation Fifty percent of the respondents stated that they would definitely continue with Idea
Cellular for another one year, while another twenty seven percent of the respondents
stated that they may continue with Idea Cellular for another one year. Seventeen percent
of the respondents could not decide, while three percent of the respondents stated that
they may discontinue with Idea Cellular connection. The reasons for these decisions are
analyzed in the next questions.
53% 27%
17% 3%
0%
Definitely Continue May continue Can't Say May Discontinue Definitely Discontinue
Whether you would continue with Idea for another year?

333
Q9a) Reasons for Continuing with Idea
Response Category No. of Responses
Percentage (%)
Rs.99/- plan 2 6 Good Service 10 31 Good connectivity and Network 8 25 Do not want the number change 2 6 Clarity of voice 4 13 As the company sponsors the connection 6 19 Total Responses 32 100
Observation Out of the thirty two respondents who answered the question, ten respondents (31%)
stated that they would like to continue with Idea Cellular, as they experienced good
service. Eight of the respondents (25%) gave the reason as ‘Good connectivity and
Network’. Four respondents (13%) mentioned ‘clarity of voice’ as the reason. Six of the
respondents (19%) stated that they would continue with Idea Cellular, as the company
sponsors their connection, while two respondents (6%) gave the reason that they ‘do not
want to change their mobile number.’
Reasons for continuing with Idea
6%
31%
25% 6%
13%
19% Rs.99/- plan
Good Service
Good connectivity and Network
do not want the number change
Clarity of voice
As the company sponsors the connection
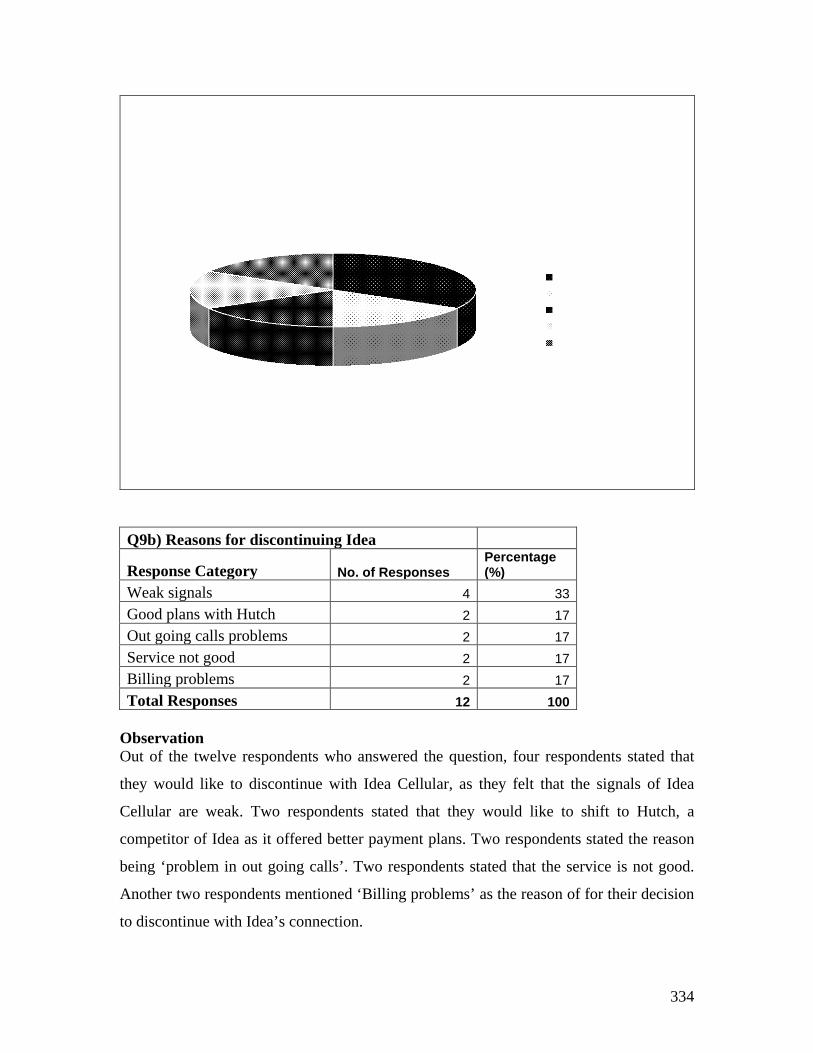
334
Q9b) Reasons for discontinuing Idea
Response Category No. of Responses Percentage (%)
Weak signals 4 33 Good plans with Hutch 2 17 Out going calls problems 2 17 Service not good 2 17 Billing problems 2 17 Total Responses 12 100
Observation Out of the twelve respondents who answered the question, four respondents stated that
they would like to discontinue with Idea Cellular, as they felt that the signals of Idea
Cellular are weak. Two respondents stated that they would like to shift to Hutch, a
competitor of Idea as it offered better payment plans. Two respondents stated the reason
being ‘problem in out going calls’. Two respondents stated that the service is not good.
Another two respondents mentioned ‘Billing problems’ as the reason of for their decision
to discontinue with Idea’s connection.

335
Q10. Would you suggest usage of Idea Cellular to your friends/ relatives? Response Category No. of Responses Percentage (%) Definitely Suggest 34 57 May Suggest 10 17 Can't Say 4 7 May not Suggest 6 10 Definitely not suggest 6 10 Total Responses 60 100
Observation Fifty seven percent of the respondents mentioned that they would definitely suggest the
usage of Idea Cellular to their friends/ relatives. Seventeen percent of the respondents
stated that they may suggest Idea Cellular to their friends/ relatives. Seven percent of the
respondents could not decide. Ten percent of the respondents stated that they may not
suggest the usage of Idea Cellular to their friends/ relatives, while the remaining ten
percent respondents stated that they definitely would not suggest the usage of Idea
Cellular to their friends/ relatives.

336
11. What are your suggestions for improvement of services offered by Idea?
Response Category No. of Responses
Percentage (%)
A SMS should be made cheaper 4 15
B New plans similar to other brands should be launched 6 23
C Call waiting time at call centre should be reduced 4 15
D Call Centre operators should be polite 2 8 E Network should be extended 2 8
F Correct info. Should be available with dealers & call centre operators 4 15
G Network clarity should be improved 2 8
H Billing problems should be solved in less time 2 8
Total Responses 26 100 Observation Twenty three percent of the respondents suggested that ‘New plans’ similar to other
brands (operators) should be launched. Fifteen percent of the respondents suggested that
0
1
2
3
4
5
6
Suggestions for the improvement of services at Idea
Responses 4 6 4 2 2 4 2 2
A B C
D
E
F
G
H

337
the ‘call waiting time’ at call centre should be reduced. Another fifteen percent of the
respondents suggested that SMS should be made cheaper. The other suggestions included
extension of the network, timely resolution of billing problems, improving the network
clarity etc.