Embed Size (px)
Citation preview

85
CHAPTER V
CONCLUSION
A. Conclusion
From the results of this study can be drawn conclusions are:
1. The value of R² is at 0.891756, means that the model of this study (eight
variables independent: Capital Adequacy Ratio, Non Performing Loan,
Fulfillment of PPAP, Net Interest Margin, Return on Equity, Operational
Expenses Operational Income, Loan to Deposit Ratio, and dummy
variable of sensitivity to market risk) may explain the dependent variable
Return on Assets (ROA) of 89.17%, and amounted to 10.183 % explained
outside the model of this research.
2. The probability of the F-statistic value is equal to 0.00000. Based on F test
of the hypothesis testing showed that the probability F-statistic is equal to
0.00000 < 0.05 then Ha is supported. This means that simultaneously
variables CAR, NPL, fulfillment PPAP, NIM, BOPO, ROE, LDR and
CARS effect on ROA, in the α level of 95%. This indicates that there is
an influence between the eight variables independent (Capital Adequacy
Ratio, Non Performing Loan, Provided Provision to Required Provision,
Net Interest Margin, Return on Equity, Cost to income ratio, and Loan to
Deposit Ratio, and dummy variable of sensitivity to market risk together

86
against ROA. Means that any change or variance from the eighth ratio
together will affect ROA.
3. Capital Adequacy Ratio (CAR), Return on Equity (ROE), Net Interest
Margin (NIM), Cost to Income Ratio (BOPO) proven to significantly has
an impact to Return on Assets. This can be seen in table 5 where the level
of significance of the CAR of 0.0040 <0.05. NIM significance level of
0.0061 <0.05. BOPO significance level of 0.0000 <0.05 and ROA variable
has a significance level of 0.0000 <0.05. The level of significance has
proven that the CAMELS ratio is significantly affect the return on assets
(ROA), so that the hypothesis that states there is an impact of the
CAMELS ratio with Return on Assets is supported.
4. For the Loan to Debt Ratio that have a negative impact to the ROA it is
related with the Indonesian bank behaviour. The Indonesian bank likely to
enjoy the benefit from the SBI more than the lending activities. This is
because SBI is the sweetest source of profit and have zero percent Risk
Weighted Assets. So this is why the LDR have a negative impact on ROA
and become not in line with the theory.
B. Limitation
This study has many limitations, such as the following:
1. Proxy used in this study there were only eight variables, while the
CAMELS itself has 6 elements, namely: Capital, Asset, Management,

87
Earning, Liquidity and Sensitivity to market risk. If the more variables
used, the results of the study is expected to be more accurate.
2. For measurement of management element in this study only uses the proxy
Net Interest Margin. This is due to the limited research data of company
management.
3. To measure the sensitivity to market risk in this study used a dummy
variable of Capital Adequacy Ratio. This is due to the limitations of the
researcher to obtain the data used to assess Sensitivity to market risk. Most
of the data does not exist in the published financial statements to the
public.
C. Suggestions for Further Research
With the limitations in this study, the suggestions for further research:
1. Further research can use a questionnaire to assess the element of
management. It is expected that the questionnaire in accordance with
BI resume or other relevant national agencies as well as assessing
aspects of risk management good corporate governance.
2. For further research could use a more comprehensive component to
assess Sensitivity to market risk. Subsequent research can use such
capital or reserve established to cover fluctuations in interest rates or
exchange rate changes.

Refference
Almilia, Luciana S and Winny Herdiningtyas. 2005. “Analisis Rasio CAMEL terhadap Prediksi Kondisi Bermasalah Pada Lembaga Perbankan Perioda 2000-2002”. Jurnal Akuntansi dan Keuangan, Vol 7, No. 2, November.
Dasalak, David. 2005. “Analisis Hubungan antara Rasio Keuangan CAMEL dengan Return on Equity (ROE): Suatu studi empiris pada perbankan dengan modal antara 100 m s/d 10 triliun rupiah yang terdaftar di BEJ.” Fakultas Ekonomi dan Bisnis Universitas Gajah Mada Yogyakarta. Gujarati, Damodar. 2009. Basic Econometrics, Fifth Edition. McGraw-Hill, International Edition.
Hays, et al. 2009. “Efficiency Ratios and Community Bank Performance”. Journal of Finance and Accountancy.page 1-15
Infobank No. 327, Juni 2006, Vol. XXVIII, Rating 131 Bank. Infobank No. 339, Juni 2007, Vol. XXIX, Rating 130 Bank Infobank No. 351, Juni 2008, Vol. XXX, Rating 125 Bank Infobank No. 363, Juni 2009, Vol. XXXI, Rating 120 Bank Infobank No. 375, Juni 2010, Vol. XXXII, Rating 121 Bank Ismail, Abdul Ghafar & Moh. Azlan Shah Zaidi. 2002. “ CAEL RATING: A Stress Test in Bank Monitoring”. Gadjah Mada International Journal of Business, Vol. 4, September, pp. 315-322 Januarti, Indira. 2002. “ Variabel Proksi CAMEL dan Karakteristik Bank Lainnya Untuk Memprediksi Kebangkrutan Bank di Indonesia” . Jurnal Bisnis Strategi, Vol.10, December, page 1-26. Koch, W.Timothy. 1997. Bank Management. The Dryden Press – International Edition. Kuncoro, Mudrajad and Suhardjono. 2002. Manajemen Perbankan Teori dan Aplikasi. edisi pertama. BPFE Yogyakarta.
Lampiran 14 Surat Edaran Bank Indonesia Nomor 3/30/DPNP tanggal 14 Desember 2001
Machfoeds, Mas’oed. 1994. “Financial Ratio Analysis and the Prediction of Earning Changes in Indonesia.” Jurnal Kelola, Vol. 7: 114-137.
Nasser, Etty M. 2003. “Perbandingan Kinerja Bank Pemerintah dan Bank Swasta dengan Rasio CAMEL Serta Pengaruhnya Terhadap Harga Saham”. Media Riset Akuntansi, Auditing dan Informasi, Vol. 3, No. 3 Desember 2003. Nasser, Etty M dan Titik Aryati. 2000. “Model Analisis CAMEL Untuk Memprediksi Financial Distress Pada Sektor Perbankan Yang Go Publik” Jurnal Akuntansi dan Auditing Indonesia (JAAI), Vol, 4, No.2 Payamta and Mas’ud Machfoedz. 1999. Evaluasi Kinerja Perusahaan Perbankan Sebelum dan Sesudah Menjadi Perusahaan Publik di Bursa Efek Jakarta (BEJ). KELOLA No. 20/VIII/1999. Peraturan Bank Indonesia Nomor: 6/10/PBI/2004 Tentang Sistem Penilaian tingkat kesehatan Bank Umum Haryati, Sri. 2001. ”Analisis Kebangkrutan Bank”, Jurnal Ekonomi dan Bisnis Indonesia, Vol.16, No.4, pp.336-345. Surat Edaran Bank Indonesia Nomor 6/23/DPNP tanggal 31 Mei 2004 tentang tata cara penilaian tingkat kesehatan bank umum. Surat Edaran Bank Indonesia No 6/73/Intern DPNP tgl 24 Desember 2004, Perihal Pedoman Sistem Penilaian Tingkat Kesehatan Bank Umum (CAMELS Rating), Bank Indonesia, Jakarta. Susilo, Sri Y. 2000. Bank dan Lembaga Keuangan lainnya, Salemba Empat, Jakarta. Suyono, Agus, 2005, Analisis Rasio-rasio Bank yang Berpengaruh terhadap Return on Asset (ROA), Thesis Program Pasca Sarjana Magister Manajemen Universitas Diponegoro Stock, James H. 2007. Introduction to Econometrics. Second Edition. Pearson – International Edotion Thomson, James B. 1991. “Predicting Bank Failures in the 1980s”. Economic Review - Federal Reserve Bank of Cleveland; First Quarter 1991; 27, 1; ABI/INFORM Global. pg. 9 Woolridge. 2009. Introductory Econometrics, A Modern Approach. Fourth Edition. South Western – International Student Edition. Warsidi & Bambang Agus Pramuka. 2000. “Evaluasi Kegunaan Rasio keuangan dalam memprediksi perubahan laba di masa yang akan datang: suatu studi empiris pada perusahaan yang terdaftar di BEJ.” Jurnal Akuntansi, Manajemen dan Ekonomi Vol. 2 No. 1

Widarjono, Agus. 2010. Ekonometrika: Pengantar dan Aplikasinya (Dilengkapi Aplikasi EViews). Ekonosia Zainuddin. 1998. “Manfaat Rasio Keuangan dalam Memprediksi Pertumbuhan Laba: suatu studi empiris pada perusahaan perbankan yang terdaftar di BEJ.” Fakultas Ekonomi dan Bisnis Universitas Gajah Mada Yogyakarta. Zainuddin and Jogiyanto Hartono. 1999. “Manfaat rasio keuangan dalam memprediksi pertumbuhan laba: suatu studi empiris pada perusahaan perbankan yang terdaftar di BEJ.” Jurnal Riset Akuntansi Indonesia, Vol.2, No.1, Januari, page.66-90 http://www.bi.go.id/web/id/Peraturan/Perbankan/ketentuan+perbankan.htm http://en.wikipedia.org/wiki/Banking http://nustaffsite.gunadarma.ac.id/blog/bhermana/2007/05/02/camel-vs-camels/

APPENDIX 1
Table 1
Sample Data
No Sample of the research
1 BANK RAKYAT INDONESIA
2 BANK CENTRAL ASIA
3 BANK MANDIRI
4 PANINBANK
5 BANK DANAMON INDONESIA
6 BANK NEGARA INDONESIA
7 THE BANK OF TOKYO-MITSUBISHI
UFJ
8 BANK JATENG
9 BANK BTPN
10 BANK JABAR BANTEN
11 BANK UOB BUANA
12 BANK JATIM
13 BANK TABUNGAN NEGARA
14 BANK RIAU
15 BANK SYARIAH MANDIRI
16 BANK OCBC NISP
17 BANK MIZUHO INDONESIA
18 BANK BPD ACEH
19 PERMATA BANK
20 BANK KALTIM
21 BANK UOB INDONESIA
22 BANK OCBC INDONESIA
23 BANK RESONA PERDANIA
24 BANK MESTIKA
25 BANK SUMITOMO MITSUI INDONESIA
26 BANK RABOBANK INT'L INDONESIA
27 BANK EKONOMI
28 BANK BUKOPIN
29 JP MORGAN CHASE INDONESIA
30 BANK MEGA
31 BANK CHINATRUST INDONESIA

32 BANK KEB INDONESIA
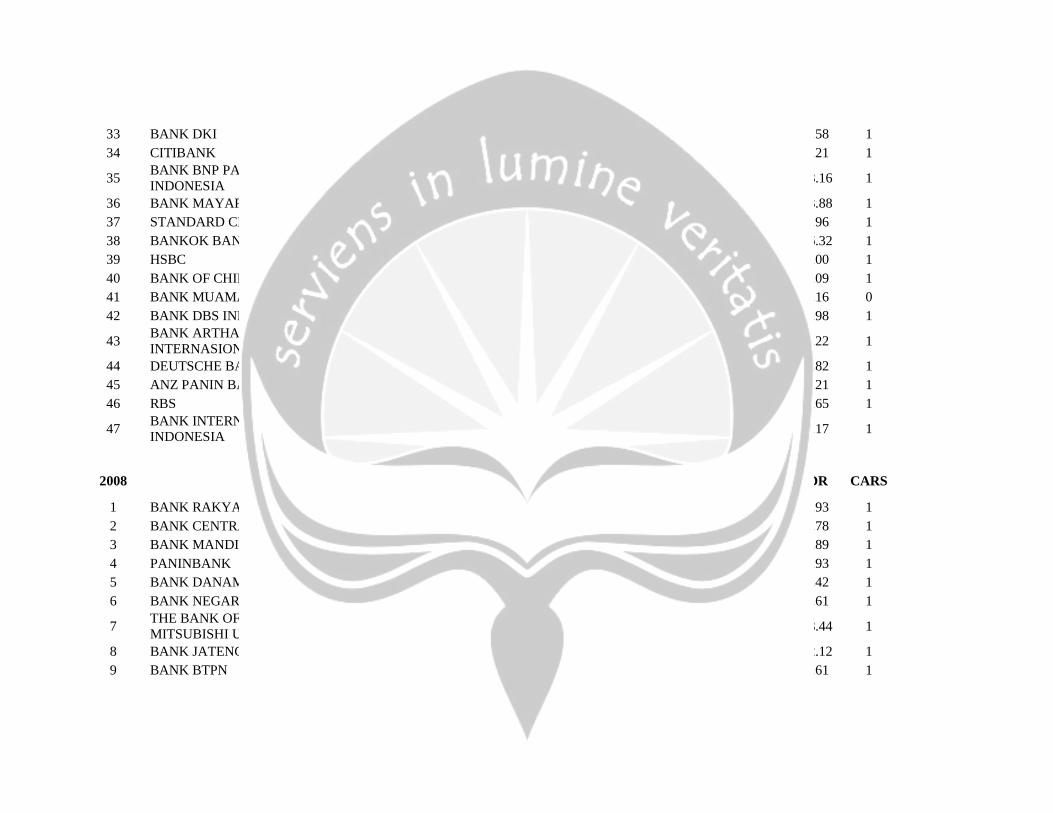
33 BANK DKI
34 CITIBANK
35 BANK BNP PARIBAS INDONESIA
36 BANK MAYAPADA
37 STANDARD CHARTERED BANK
38 BANKOK BANK
39 HSBC
40 BANK OF CHINA
41 BANK MUAMALAT
42 BANK DBS INDONESIA
43 BANK ARTHA GRAHA
INTERNASIONAL
44 DEUTSCHE BANK
45 ANZ PANIN BANK
46 RBS
47 BANK INTERNASIONAL INDONESIA

APPENDIX 2

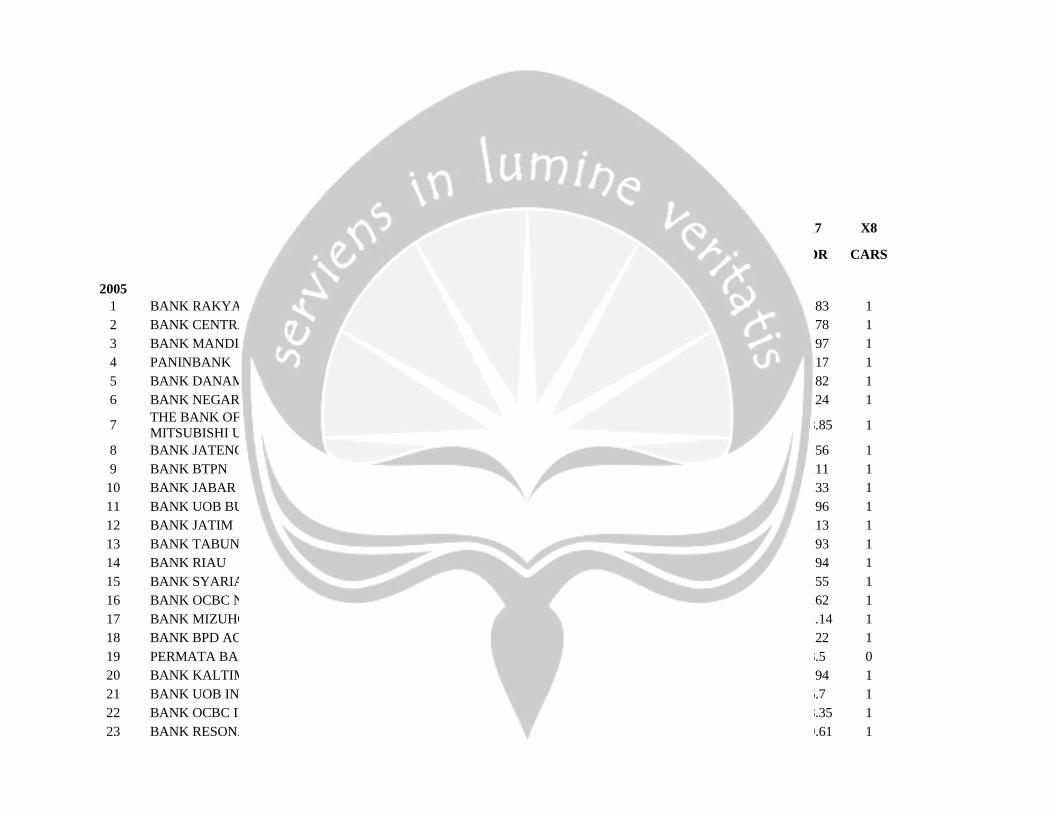
Y
X1
X2
X3
X4
X5
X6
X7
X8
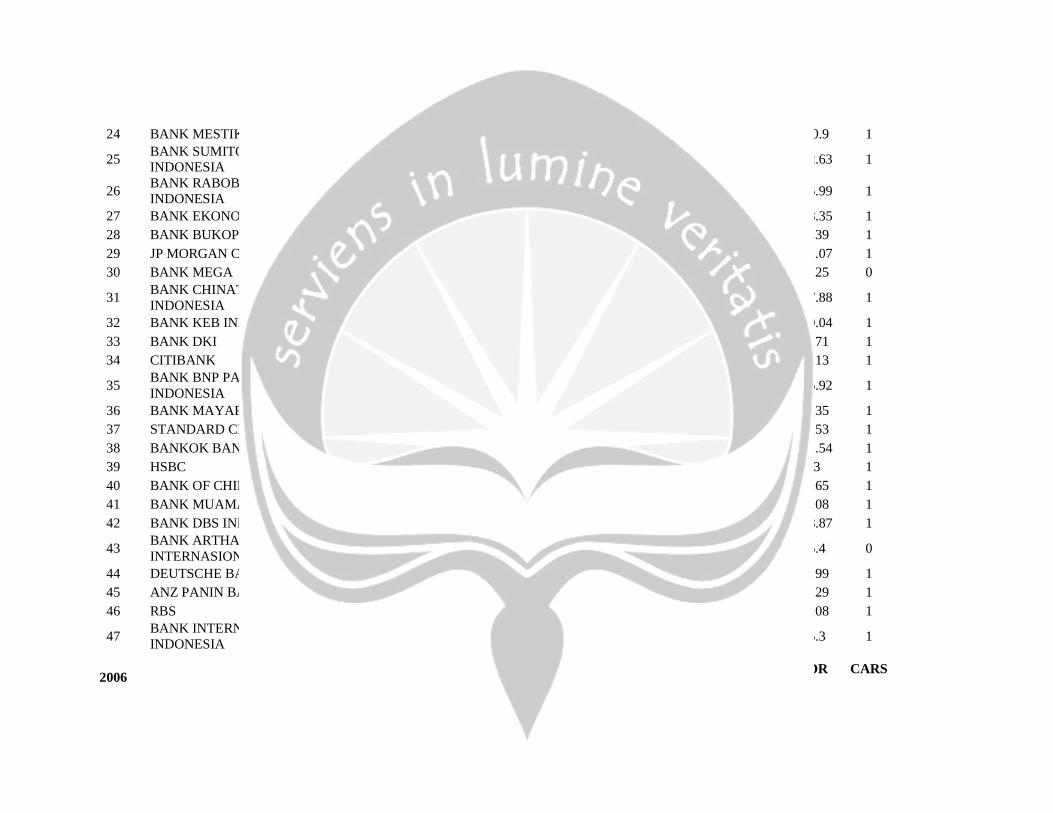
ROA CAR NPL PPAP NIM ROE BOPO LDR CARS
2005
1 BANK RAKYAT INDONESIA 5.04 16.25 4.68 176.62 12.17 37.92 70.45 77.83 1 2 BANK CENTRAL ASIA 3.44 21.66 1.71 122.96 6 28.16 66.82 41.78 1 3 BANK MANDIRI 0.47 23.65 26.66 102.94 3.81 2.76 95.02 49.97 1 4 PANINBANK 2.27 30.58 9.34 100 4.11 14.14 77.65 55.17 1 5 BANK DANAMON INDONESIA 4.68 23.48 2.58 112.26 8.86 24.22 65.65 80.82 1 6 BANK NEGARA INDONESIA 1.61 16.67 13.7 102.29 5.35 12.64 84.88 54.24 1
7 THE BANK OF TOKYO-MITSUBISHI UFJ 2.39 34.89 1.93 100.12 3.49 4.23 69.06 158.85 1
8 BANK JATENG 4.71 14.61 0.57 108.42 11.33 30.54 68.47 68.56 1 9 BANK BTPN 4.25 20.7 2.27 94.4 10.03 17.49 79.27 92.11 1 10 BANK JABAR BANTEN 3.47 15.78 0.45 114.69 10.04 23.54 75.06 87.33 1 11 BANK UOB BUANA 3.13 20.2 2.35 103.86 6.51 18.91 74.64 79.96 1 12 BANK JATIM 1.7 18.64 0.61 182.47 9.39 36.9 73.83 45.13 1 13 BANK TABUNGAN NEGARA 1.66 16.6 4.04 155.61 5.38 33.66 86.16 78.93 1 14 BANK RIAU 2.83 24.83 3.67 99.8 6.27 32.29 69.98 19.94 1 15 BANK SYARIAH MANDIRI 1.83 12.12 3.5 106.93 6.83 14.56 85.7 75.55 1 16 BANK OCBC NISP 2.52 19.95 2.46 100 4.15 14.79 86.52 77.62 1 17 BANK MIZUHO INDONESIA 2.06 19.09 1.43 203.65 3.81 14.73 65.05 111.14 1 18 BANK BPD ACEH 1.2 18.71 1.48 118.39 6.59 33.49 77.46 24.22 1 19 PERMATA BANK 3.5 9.9 5.3 144.3 5.9 14.3 89.6 78.5 0 20 BANK KALTIM 4.2 27.72 1.58 100.78 6.43 26.28 63.97 22.94 1 21 BANK UOB INDONESIA 2.36 36.4 5.9 100.7 4.8 16.9 58.2 86.7 1 22 BANK OCBC INDONESIA 3.31 50.95 6.85 107.38 4.19 8.04 69.99 118.35 1 23 BANK RESONA PERDANIA 7.51 25.16 7.64 130.86 4.21 11.72 61.11 149.61 1
Data of The Sample
24 BANK MESTIKA 4.33 21.58 2.2 264.68 10.67 26.36 50.63 110.9 1
25 BANK SUMITOMO MITSUI INDONESIA 3.57 46.9 3.94 100 3.59 13.77 45.1 132.63 1
26 BANK RABOBANK INT'L INDONESIA 4.33 18.69 5.08 102.82 4.56 28.83 64.8 175.99 1
27 BANK EKONOMI 3.57 12.83 0.89 124.05 4.19 8.04 69.99 118.35 1 28 BANK BUKOPIN 2.09 13.27 3.37 107.57 5.86 25.35 83.26 68.39 1 29 JP MORGAN CHASE INDONESIA 1.8 22.29 0.2 112.89 3.7 11.17 78.74 111.07 1 30 BANK MEGA 1.25 11.13 1.43 100 4.01 15.11 88.88 51.25 0
31 BANK CHINATRUST INDONESIA 5.18 18.16 2.26 103.93 6.24 17.88 56.34 137.88 1
32 BANK KEB INDONESIA 6.3 41.72 5.99 120.12 5.04 20.22 32.05 119.04 1 33 BANK DKI 1.82 19.31 5.36 106.99 6.68 16.91 87.49 41.71 1 34 CITIBANK 4.9 17.01 4.9 118.36 7.83 42.85 65.22 57.13 1
35 BANK BNP PARIBAS INDONESIA 3.25 21.9 13.73 114.27 3.46 18.91 89.48 185.92 1
36 BANK MAYAPADA 0.84 14.24 1.79 122.85 5.74 5.29 92.65 82.35 1 37 STANDARD CHARTERED BANK 5.08 14.86 4.78 105.79 4.91 57.76 59.57 74.53 1 38 BANKOK BANK 4.21 42.58 10.19 173.17 5.05 5.23 51.6 201.54 1 39 HSBC 4 18.13 3 148 8 15 61 63 1 40 BANK OF CHINA 1.13 164.45 0 100.1 2.77 1.02 70.81 20.65 1 41 BANK MUAMALAT 2.53 16.33 2.8 100 6.29 18.1 81.59 89.08 1 42 BANK DBS INDONESIA 2.11 20.32 2.62 114.86 4.23 9.25 83.84 128.87 1
43 BANK ARTHA GRAHA INTERNASIONAL 0.34 11.14 4.73 107.62 5.18 5.22 97.48 85.4 0
44 DEUTSCHE BANK -0.72 50.05 10.3 104.66 1.9 -11.35 113.1 41.99 1 45 ANZ PANIN BANK 5.59 18.14 4.49 100 10.02 17.55 71.98 78.29 1 46 RBS 1.7 13.77 3.9 100.02 3.59 19.35 83 49.08 1
47 BANK INTERNASIONAL INDONESIA 1.72 22.41 2.88 111.94 4.9 25.97 84.89 55.3 1
2006
ROA CAR NPL PPAP NIM ROE BOPO LDR CARS

1 BANK RAKYAT INDONESIA 4.36 19.97 4.81 155.97 10.99 33.75 74.38 72.53 1 2 BANK CENTRAL ASIA 3.80 22.21 1.30 136.90 7.19 29.07 68.84 40.30 1 3 BANK MANDIRI 1.12 25.30 17.08 107.83 4.44 11.12 90.13 55.02 1 4 PANINBANK 2.78 31.71 7.95 100.00 5.05 14.27 78.25 80.47 1 5 BANK DANAMON INDONESIA 2.82 22.37 3.31 107.66 7.22 15.09 80.33 75.51 1 6 BANK NEGARA INDONESIA 1.85 15.95 10.47 100.00 5.19 22.61 84.79 48.98 1
7 THE BANK OF TOKYO-MITSUBISHI UFJ 4.41 34.94 2.09 100.14 4.33 7.83 54.10 131.74 1
8 BANK JATENG 3.72 17.38 0.56 121.76 9.50 32.65 73.67 58.98 1 9 BANK BTPN 4.57 29.46 2.42 100.12 12.37 19.57 80.21 96.43 1 10 BANK JABAR BANTEN 3.01 15.32 0.41 102.59 6.60 22.28 77.52 75.67 1 11 BANK UOB BUANA 3.47 30.83 4.39 111.69 7.65 16.04 74.32 83.03 1 12 BANK JATIM 4.07 39.18 0.43 193.90 9.34 38.48 69.43 38.75 1 13 BANK TABUNGAN NEGARA 1.78 18.23 3.91 112.79 5.13 23.36 87.56 83.75 1 14 BANK RIAU 3.75 30.54 1.30 96.57 6.92 56.05 66.18 17.11 1 15 BANK SYARIAH MANDIRI 1.10 12.60 6.94 101.15 5.63 18.27 90.66 90.21 1 16 BANK OCBC NISP 1.55 17.13 2.49 100.10 4.76 11.01 87.98 82.17 1 17 BANK MIZUHO INDONESIA 3.56 25.40 1.64 133.71 4.85 17.06 59.06 116.17 1 18 BANK BPD ACEH 3.06 22.59 0.82 114.82 7.21 53.53 70.06 19.88 1 19 PERMATA BANK 1.20 14.40 6.40 131.90 6.40 13.10 90.00 83.10 1 20 BANK KALTIM 3.38 29.88 1.30 100.00 5.84 41.87 68.49 17.90 1 21 BANK UOB INDONESIA 2.82 37.30 1.00 102.70 5.10 15.20 55.70 176.40 1 22 BANK OCBC INDONESIA 1.93 50.14 5.05 109.13 4.27 7.09 80.40 119.59 1 23 BANK RESONA PERDANIA 3.81 25.05 7.27 160.73 4.51 13.23 61.89 112.14 1 24 BANK MESTIKA 6.60 23.90 2.90 242.62 10.16 22.71 59.12 91.64 1
25 BANK SUMITOMO MITSUI INDONESIA 5.65 60.23 2.99 100.00 5.05 16.89 42.05 125.69 1
26 BANK RABOBANK INT'L INDONESIA 3.09 22.48 11.68 100.12 3.20 22.71 73.81 269.36 1
27 BANK EKONOMI 1.62 14.03 2.52 117.86 3.95 19.81 86.26 42.4 1
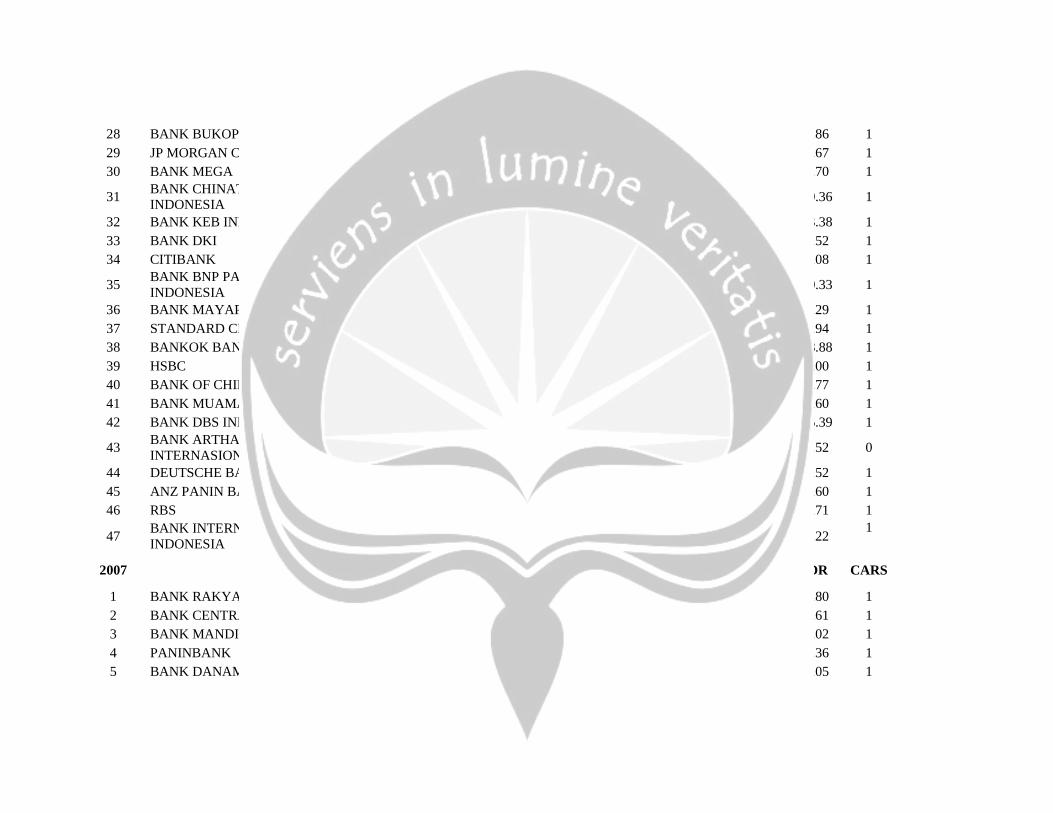
28 BANK BUKOPIN 1.85 15.93 3.72 100.50 5.27 22.14 87.17 58.86 1 29 JP MORGAN CHASE INDONESIA 7.54 53.35 0.00 102.61 4.23 42.46 50.67 44.67 1 30 BANK MEGA 0.88 15.92 1.68 100.00 3.46 9.10 92.78 42.70 1
31 BANK CHINATRUST INDONESIA 7.50 23.01 2.98 171.53 7.46 26.55 53.92 119.36 1
32 BANK KEB INDONESIA 8.81 86.97 5.64 133.59 6.70 19.35 29.50 133.38 1 33 BANK DKI 1.65 17.80 4.68 101.13 6.61 15.60 86.22 52.52 1 34 CITIBANK 4.53 23.67 4.79 116.64 8.26 25.92 70.64 77.08 1
35 BANK BNP PARIBAS INDONESIA 4.32 70.91 10.56 114.39 5.14 16.60 87.18 120.33 1
36 BANK MAYAPADA 1.55 13.82 0.65 109.93 6.15 10.65 88.99 85.29 1 37 STANDARD CHARTERED BANK 4.85 18.02 4.27 103.44 4.90 26.76 67.34 79.94 1 38 BANKOK BANK 2.02 31.08 4.09 188.59 4.70 2.16 56.08 238.88 1 39 HSBC 2.00 16.09 8.00 120.00 9.00 10.00 65.00 65.00 1 40 BANK OF CHINA 3.01 52.97 0.00 100.26 4.69 2.77 65.24 24.77 1 41 BANK MUAMALAT 2.10 14.56 5.76 100.07 6.10 21.99 84.69 83.60 1 42 BANK DBS INDONESIA 1.99 27.05 1.52 101.38 3.90 9.80 86.90 115.39 1
43 BANK ARTHA GRAHA INTERNASIONAL 0.40 11.38 6.21 102.29 3.88 5.67 97.06 79.52 0
44 DEUTSCHE BANK 6.75 54.99 7.83 111.85 1.47 41.07 53.03 59.52 1 45 ANZ PANIN BANK 4.61 17.81 5.62 100.00 15.11 17.08 77.47 77.60 1 46 RBS 2.18 15.69 2.01 101.68 4.86 15.67 85.15 85.71 1
47 BANK INTERNASIONAL INDONESIA 1.43 24.08 5.43 109.44 5.14 19.49 89.82 57.22
1
2007
ROA CAR NPL PPAP NIM ROE BOPO LDR CARS
1 BANK RAKYAT INDONESIA 4.61 16.66 3.44 161.20 10.69 31.64 69.80 68.80 1 2 BANK CENTRAL ASIA 3.34 18.79 0.81 121.18 6.09 26.74 66.73 43.61 1 3 BANK MANDIRI 2.40 21.11 7.33 104.22 5.20 19.07 75.85 52.02 1 4 PANINBANK 3.14 23.34 3.06 100.00 5.81 13.98 73.74 92.36 1 5 BANK DANAMON INDONESIA 3.81 20.57 2.27 114.48 10.44 21.15 74.19 88.05 1

6 BANK NEGARA INDONESIA 0.85 17.65 8.18 79.41 4.99 8.03 93.04 60.56 1
7 THE BANK OF TOKYO-MITSUBISHI UFJ 3.44 36.19 2.03 100.93 3.89 6.88 59.10 116.19 1
8 BANK JATENG 3.80 18.94 0.44 108.27 9.77 39.80 72.04 77.09 1 9 BANK BTPN 6.14 24.23 1.31 168.14 13.84 35.26 73.44 89.18 1 10 BANK JABAR BANTEN 2.44 17.77 0.70 102.20 6.01 19.58 79.12 79.02 1 11 BANK UOB BUANA 3.40 27.94 3.34 100.77 7.07 13.18 69.55 95.23 1 12 BANK JATIM 3.55 34.45 0.69 124.79 7.28 30.85 68.20 42.11 1 13 BANK TABUNGAN NEGARA 1.89 21.86 4.05 112.95 5.31 21.54 85.87 92.38 1 14 BANK RIAU 2.46 31.81 1.74 179.69 5.05 32.88 69.30 30.00 1 15 BANK SYARIAH MANDIRI 1.53 12.46 5.64 100.11 6.31 32.22 81.34 92.96 1 16 BANK OCBC NISP 1.31 16.48 2.53 100.06 4.99 8.71 88.19 89.14 1 17 BANK MIZUHO INDONESIA 2.98 26.65 0.38 100.29 3.63 13.32 59.83 147.24 1 18 BANK BPD ACEH 3.07 26.31 0.81 129.63 5.89 41.68 68.68 30.54 1 19 PERMATA BANK 1.90 14.00 4.60 117.80 7.00 18.10 84.80 88.00 1 20 BANK KALTIM 3.25 27.14 1.94 100.00 5.47 34.19 64.82 24.05 1 21 BANK UOB INDONESIA 3.90 31.70 0.60 100.10 4.40 15.10 59.20 112.00 1 22 BANK OCBC INDONESIA 1.11 32.05 2.05 116.88 3.26 5.08 88.14 114.13 1 23 BANK RESONA PERDANIA 3.37 22.71 3.76 140.85 3.69 13.94 68.42 164.27 1 24 BANK MESTIKA 5.93 26.09 4.01 328.07 8.85 20.35 55.06 89.36 1
25 BANK SUMITOMO MITSUI INDONESIA 3.46 54.31 0.99 100.00 3.72 10.97 66.43 86.13 1
26 BANK RABOBANK INT'L INDONESIA 2.66 23.68 0.00 102.63 4.45 12.43 75.46 265.39 1
27 BANK EKONOMI 1.87 13.18 2.45 113.20 4.28 20.32 80.27 52.05 1 28 BANK BUKOPIN 1.63 12.91 3.57 101.73 4.27 22.34 85.52 65.26 1 29 JP MORGAN CHASE INDONESIA 7.23 97.03 0.00 100.09 5.56 28.02 45.09 54.01 1 30 BANK MEGA 2.33 14.21 1.53 100.00 5.06 25.52 79.21 46.74 1
31 BANK CHINATRUST INDONESIA 4.98 26.90 3.91 123.13 6.76 15.35 59.13 133.25 1
32 BANK KEB INDONESIA 7.65 77.61 0.86 166.16 5.38 15.59 32.73 88.90 1
33 BANK DKI 1.39 15.09 4.15 100.44 6.99 14.00 88.14 68.58 1 34 CITIBANK 5.68 23.32 7.01 106.84 8.50 33.18 64.17 70.21 1
35 BANK BNP PARIBAS INDONESIA 4.85 76.94 5.85 100.01 4.64 10.31 66.48 198.16 1
36 BANK MAYAPADA 1.46 29.95 0.48 100.00 6.85 5.81 88.46 103.88 1 37 STANDARD CHARTERED BANK 3.60 16.04 7.88 104.52 3.71 23.09 72.85 60.96 1 38 BANKOK BANK 1.37 21.85 8.33 126.43 2.32 1.69 85.79 256.32 1 39 HSBC 3.00 16.35 9.00 106.00 10.00 14.00 64.00 66.00 1 40 BANK OF CHINA 4.80 71.96 0.00 100.12 4.81 7.69 31.82 21.09 1 41 BANK MUAMALAT 2.27 10.79 2.96 117.08 7.60 23.24 82.75 99.16 0 42 BANK DBS INDONESIA 1.62 14.01 0.84 101.33 4.01 11.13 88.06 98.98 1
43 BANK ARTHA GRAHA INTERNASIONAL 0.29 12.24 3.77 100.05 3.67 3.01 97.69 82.22 1
44 DEUTSCHE BANK 3.31 57.21 4.87 110.56 2.26 14.38 68.93 68.82 1 45 ANZ PANIN BANK 4.59 18.17 4.81 115.98 14.32 17.63 76.35 66.21 1 46 RBS 1.55 17.83 1.61 105.83 6.59 10.46 88.93 73.65 1
47 BANK INTERNASIONAL INDONESIA 1.23 21.35 3.12 109.14 5.03 10.86 90.49 76.17 1
2008
ROA CAR NPL PPAP NIM ROE BOPO LDR CARS
1 BANK RAKYAT INDONESIA 4.18 13.67 2.8 150.2 9.99 34.5 72.65 79.93 1 2 BANK CENTRAL ASIA 3.42 15.56 0.6 168.93 6.55 30.16 66.76 53.78 1 3 BANK MANDIRI 2.69 15.72 4.69 103.76 5.48 22.74 73.65 56.89 1 4 PANINBANK 1.75 20.65 4.34 100 4.74 10.16 84.56 78.93 1 5 BANK DANAMON INDONESIA 2.67 16.11 2.29 150.08 11.12 14.38 85.77 86.42 1 6 BANK NEGARA INDONESIA 1.12 14.38 4.96 141.36 6.26 9.01 90.16 68.61 1
7 THE BANK OF TOKYO-MITSUBISHI UFJ 3.16 36.37 0.25 100 3.77 5.2 58.61 178.44 1
8 BANK JATENG 4.55 18.49 0.21 115.21 11.37 37.3 70.14 102.12 1 9 BANK BTPN 4.48 23.67 0.59 192.5 11.4 28.44 77.53 91.61 1

10 BANK JABAR BANTEN 3.36 15.39 0.78 103.94 8.45 25.54 75.03 89.44 1 11 BANK UOB BUANA 2.38 25.36 2.51 112.52 7.17 9.03 79.99 91.65 1 12 BANK JATIM 3.94 25.54 0.72 121.71 8.35 31.48 67.42 54.04 1 13 BANK TABUNGAN NEGARA 1.6 16.44 3.2 123.31 5.08 19.64 86.18 101.83 1 14 BANK RIAU 2.92 24.33 1.12 135.07 6.67 29.51 71.93 43.24 1 15 BANK SYARIAH MANDIRI 1.83 12.72 5.66 100.34 6.73 46.21 78.71 89.12 1 16 BANK OCBC NISP 1.54 17.27 2.72 100.15 5.4 9.18 86.12 76.69 1 17 BANK MIZUHO INDONESIA 2.72 19.76 1.52 130.34 3.48 12.09 60.52 198.64 1 18 BANK BPD ACEH 3.09 26.57 1.17 130.34 7.67 31.84 70.57 39.05 1 19 PERMATA BANK 1.7 11.1 3.5 142.4 6.2 12.4 88.9 81.8 0 20 BANK KALTIM 4.64 25.13 1.61 100 6.86 46.85 55.34 33.68 1 21 BANK UOB INDONESIA 3.4 25.6 1 103.6 4.3 15.6 71.3 94.8 1 22 BANK OCBC INDONESIA 1.42 33.51 2 136.52 4.2 6.96 84.81 109.53 1 23 BANK RESONA PERDANIA 3.14 19.58 5.66 121.15 3.48 14.54 67.93 141.31 1 24 BANK MESTIKA 5.16 26.49 2.13 180.9 8.68 17 55.66 97.82 1
25 BANK SUMITOMO MITSUI INDONESIA 3.67 35.25 0.93 100 3.48 14.55 67.79 109.06 1
26 BANK RABOBANK INT'L INDONESIA 0.31 13.31 4.53 129.59 4.66 4.01 96.32 134.4 1
27 BANK EKONOMI 2.26 14.1 1.07 112.44 4.61 18.06 75.63 61.42 1 28 BANK BUKOPIN 1.66 11.21 4.87 107.7 4.8 18.8 84.45 83.6 0 29 JP MORGAN CHASE INDONESIA 6.6 63 0 100.09 4.14 18.85 43.27 86.78 1 30 BANK MEGA 1.98 16.16 1.18 100 5.44 20.47 83.15 64.67 1
31 BANK CHINATRUST INDONESIA 5.97 34.66 4.02 126.69 7.81 16.97 56.09 116.07 1
32 BANK KEB INDONESIA 6.34 48.12 0.23 105.49 4.51 15.63 29.88 75.02 1 33 BANK DKI 1.41 17.21 4.92 111.48 6.22 15.04 89.71 66.98 1 34 CITIBANK 5.64 25.56 2.35 125.92 7.65 28.11 81.71 79.47 1
35 BANK BNP PARIBAS INDONESIA 7.89 56.94 10.46 100 4.52 18.05 43.71 120.55 1
36 BANK MAYAPADA 1.27 23.69 2.83 100 7.57 4.41 90.63 100.22 1
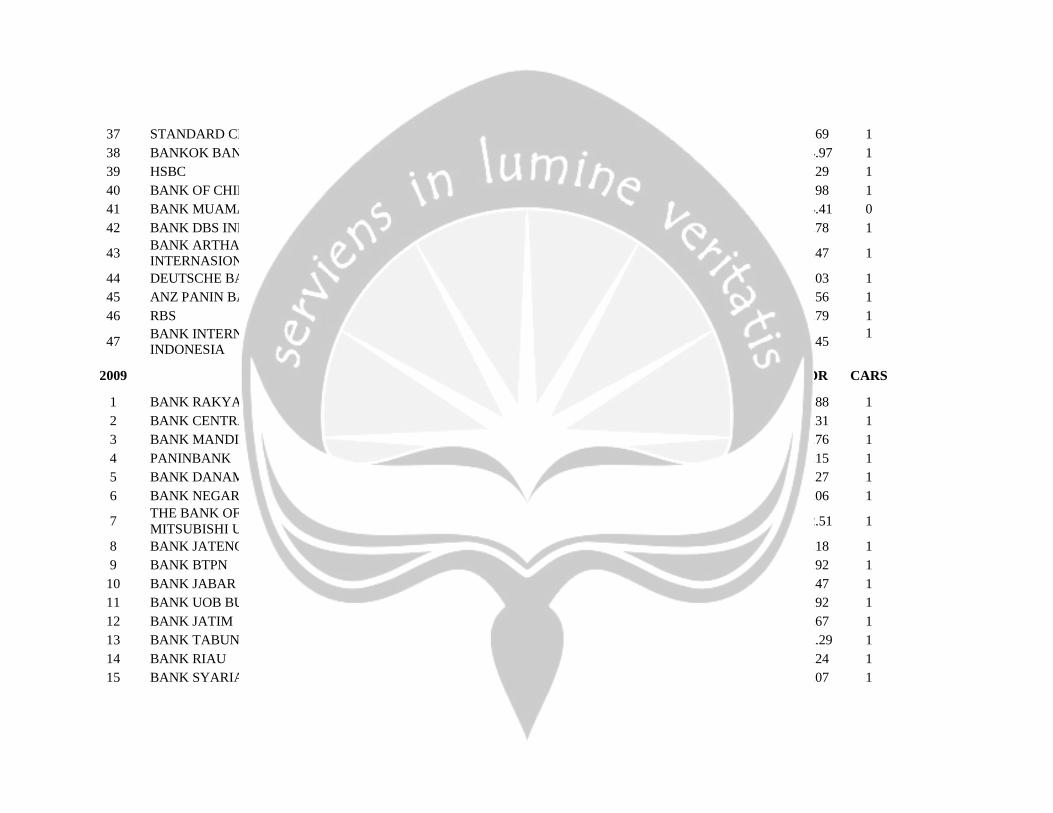
37 STANDARD CHARTERED BANK 2.52 14.19 6.01 110.09 5.04 19.56 77.61 84.69 1 38 BANKOK BANK 2.05 47.88 8.89 110.19 3.96 4.36 55.17 334.97 1 39 HSBC 3.18 12.72 10.49 110.27 8.72 14.43 62.75 67.29 1 40 BANK OF CHINA 4.53 49.23 0 103.59 3.66 40.11 48.25 21.98 1 41 BANK MUAMALAT 2.6 11.44 4.33 106 7.42 33.14 78.94 104.41 0 42 BANK DBS INDONESIA 1.56 20.76 2.18 100.93 3.59 11.46 83.72 77.78 1
43 BANK ARTHA GRAHA INTERNASIONAL 0.34 14.93 3.49 104.35 3.74 4.13 97.54 93.47 1
44 DEUTSCHE BANK 5.96 46.94 6.02 111.1 3.43 22.83 57.93 68.03 1 45 ANZ PANIN BANK 4.61 16.82 2.46 115.8 12.29 22.54 75.98 87.56 1 46 RBS 1.53 16.66 1.22 100.58 5.29 8.53 91.3 72.79 1
47 BANK INTERNASIONAL INDONESIA 1.25 19.93 2.66 109.47 5.18 11.89 93.91 79.45
1
2009
ROA CAR NPL PPAP NIM ROE BOPO LDR CARS
1 BANK RAKYAT INDONESIA 3.73 13.3 3.52 148.99 8.97 35.22 77.64 80.88 1 2 BANK CENTRAL ASIA 1.78 21.93 3.15 100 4.76 10.4 84.27 73.31 1 3 BANK MANDIRI 2.32 20.84 4.47 136.29 12.01 10.77 85.82 88.76 1 4 PANINBANK 3.13 15.55 2.62 107.28 5.19 30.07 70.71 59.15 1 5 BANK DANAMON INDONESIA 3.4 15.34 0.73 219.13 6.4 31.8 68.68 50.27 1 6 BANK NEGARA INDONESIA 1.72 13.91 4.68 130.65 6.01 16.34 84.86 64.06 1
7 THE BANK OF TOKYO-MITSUBISHI UFJ 2.85 39.56 2.39 100 3.29 4.16 56.12 162.51 1
8 BANK JATENG 4.04 20.67 0.26 110.22 9.33 34.23 71.36 89.18 1 9 BANK BTPN 3.42 18.5 0.51 125.55 12.18 25.89 84.06 84.92 1 10 BANK JABAR BANTEN 3.24 21.2 1.97 104.39 7.63 28.09 77.3 82.47 1 11 BANK UOB BUANA 2.84 23.56 2.58 102.38 7.85 11.4 77.95 93.92 1 12 BANK JATIM 3.75 21.38 1.05 113.27 7.66 28.59 66.04 69.67 1 13 BANK TABUNGAN NEGARA 1.47 21.99 3.36 112.36 4.65 18.23 87.87 101.29 1 14 BANK RIAU 2.68 22.29 1.38 100.1 6.09 23.75 73.83 88.24 1 15 BANK SYARIAH MANDIRI 2.23 12.44 4.84 108.16 6.62 44.2 73.76 83.07 1

16 BANK OCBC NISP 1.79 18.36 3.17 100.15 5.53 11.86 84.24 72.39 1 17 BANK MIZUHO INDONESIA 2.53 25.24 3.34 124.75 3.29 11.5 55.21 128.93 1 18 BANK BPD ACEH 3.06 23.51 1.69 102.67 6.95 29.34 71.39 61.79 1 19 PERMATA BANK 1.4 12.2 4 137 5.7 13.3 89.2 90.6 1 20 BANK KALTIM 3.81 22.03 1.37 100 6.37 25.52 63.69 69.11 1 21 BANK UOB INDONESIA 3.4 34.7 3.9 102.2 4.2 16.6 64.5 81.7 1 22 BANK OCBC INDONESIA 2.83 43.36 3.09 113.19 3.98 11.78 68.43 83.15 1 23 BANK RESONA PERDANIA 3.3 23.08 3.93 130.39 3.34 14.95 53.3 124.23 1 24 BANK MESTIKA 4.9 28.48 10.78 112.34 9.15 16.58 61.76 92.26 1
25 BANK SUMITOMO MITSUI INDONESIA 3.44 45.67 1.51 100 3.03 15.81 71.89 98.68 1
26 BANK RABOBANK INT'L INDONESIA 1.66 13.71 5.6 100.09 5.43 11.27 83.95 114.78 1
27 BANK EKONOMI 2.21 21.83 1.11 142.22 4.63 19.42 77.79 45.54 1 28 BANK BUKOPIN 1.46 14.38 2.81 115.13 4.07 16.52 86.93 75.99 1 29 JP MORGAN CHASE INDONESIA 11.06 79.15 0.08 100 3.34 34.43 28.02 56.39 1 30 BANK MEGA 1.77 18.84 1.7 100 4.94 18.72 85.91 56.82 1
31 BANK CHINATRUST INDONESIA 5.83 44.72 7.72 105.5 8.16 14.82 64.81 109.47 1
32 BANK KEB INDONESIA 5.4 69.06 0 115.98 3.95 12.89 33.38 57.33 1 33 BANK DKI 1.41 15.13 5.76 103 6.14 17 88.46 57.25 1 34 CITIBANK 5.74 31.83 10.23 125.13 6.7 25.29 65.21 73.63 1
35 BANK BNP PARIBAS INDONESIA 11.12 206.61 0 110.33 4.77 17.28 29.08 35.03 1
36 BANK MAYAPADA 0.9 17.56 0.96 100 6.74 4.27 93.82 83.77 1 37 STANDARD CHARTERED BANK 2.14 15.37 8.5 107.79 4.11 16.92 77.89 84.27 1 38 BANKOK BANK 3.93 55.67 10.25 120.72 5.2 4.49 31.37 313.45 1 39 HSBC 2.32 20.02 15.84 107.52 7.86 10.96 60.76 72.29 1 40 BANK OF CHINA 2.17 83.41 0 100.01 2.44 3.72 58.62 51.53 1 41 BANK MUAMALAT 0.45 11.15 4.73 108.32 5.15 8.03 95.6 85.82 0 42 BANK DBS INDONESIA 0.91 22.9 2.18 101.2 3.93 4.82 90.83 65.61 1

43 BANK ARTHA GRAHA INTERNASIONAL 0.44 13.87 3.47 107.39 3.81 4.6 96.24 84.04 1
44 DEUTSCHE BANK 5.68 46.95 8.15 108.21 3.1 18.83 54.58 60.22 1 45 ANZ PANIN BANK 0.29 14.5 0.83 100 8.36 1.25 98.08 81.86 1 46 RBS -0.01 28.96 2.61 100 5.23 -1.14 66.81 64.87 1
47 BANK INTERNASIONAL INDONESIA 0.09 14.83 2.39 114.38 5.93 -0.75 101.25 78.11 1

Appendix 3

The Common Effect Method
Dependent Variable: ROA? Method: Pooled Least Squares Date: 12/03/10 Time: 01:00 Sample: 2005 2009 Included observations: 5 Total panel observations 235
Variable Coefficient Std. Error t-Statistic Prob.
C 5.797386 0.806336 7.189786 0.0000 CAR? 0.022393 0.003873 5.781967 0.0000 NPL? 0.033011 0.018791 1.756796 0.0803
PPAP? 0.000421 0.002309 0.182326 0.8555 NIM? 0.038310 0.007049 5.434966 0.0000 ROE? 0.001960 0.001561 1.255193 0.2107
BOPO? -0.072316 0.005773 -12.52613 0.0000 LDR? 0.189881 0.029457 6.445953 0.0000
CARS? -0.230779 0.327083 -0.705567 0.4812
R-squared 0.752229 Mean dependent var 3.099447 Adjusted R-squared 0.743459 S.D. dependent var 1.851713 S.E. of regression 0.937891 Sum squared resid 198.7984 F-statistic 85.76678 Durbin-Watson stat 0.856154 Prob(F-statistic) 0.000000
The Fixed Effect Method
Dependent Variable: ROA? Method: Pooled Least Squares Date: 12/03/10 Time: 01:01 Sample: 2005 2009 Included observations: 5 Total panel observations 235
Variable Coefficient Std. Error t-Statistic Prob.
CAR? 0.012082 0.004158 2.905467 0.0040 NPL? 0.003969 0.022331 0.177740 0.8591
PPAP? -0.000737 0.002530 -0.291357 0.7710 NIM? 0.034760 0.008241 4.217873 0.0000 ROE? -0.001585 0.002347 -0.675559 0.4999
BOPO? -0.078092 0.007330 -10.65372 0.0000 LDR? 0.141577 0.051243 2.762851 0.0061
CARS? -0.195144 0.305586 -0.638590 0.5236 Fixed Effects
_1--C 7.609529 _2--C 7.067064 _3--C 7.096460 _4--C 7.416195 _5--C 7.512937 _6--C 7.149976 _7--C 7.219858

_8--C 7.237815 _9--C 8.311565
_10--C 7.372067 _11--C 7.513594 _12--C 6.486897 _13--C 7.106697 _14--C 6.340311 _15--C 6.356166 _16--C 7.585297 _17--C 6.665744 _18--C 6.047841 _19--C 7.655157 _20--C 6.701967 _21--C 6.837839 _22--C 7.335830 _23--C 8.302758 _24--C 7.921775 _25--C 7.353555 _26--C 7.721676 _27--C 7.383969 _28--C 7.162133 _29--C 8.775158 _30--C 7.212664 _31--C 8.868335 _32--C 7.702606 _33--C 7.077366 _34--C 8.613555 _35--C 9.422847 _36--C 7.328928 _37--C 7.723777 _38--C 6.577069 _39--C 6.264982 _40--C 5.808421 _41--C 7.088344 _42--C 7.691403 _43--C 7.379010 _44--C 8.405898 _45--C 8.129502 _46--C 6.929596 _47--C 7.249474
R-squared 0.891756 Mean dependent var 3.099447 Adjusted R-squared 0.859282 S.D. dependent var 1.851713 S.E. of regression 0.694621 Sum squared resid 86.84963 F-statistic 211.8437 Durbin-Watson stat 1.809969 Prob(F-statistic) 0.000000

The Random Effect Method
Dependent Variable: ROA? Method: GLS (Variance Components) Date: 12/03/10 Time: 01:01 Sample: 2005 2009 Included observations: 5 Total panel observations 235
Variable Coefficient Std. Error t-Statistic Prob.
C 6.792910 0.810941 8.376574 0.0000 CAR? 0.015484 0.003750 4.128905 0.0001 NPL? 0.017034 0.019442 0.876146 0.3819
PPAP? 0.000116 0.002228 0.051978 0.9586 NIM? 0.035270 0.007207 4.894223 0.0000 ROE? 0.000241 0.001817 0.132458 0.8947
BOPO? -0.077365 0.006085 -12.71390 0.0000 LDR? 0.160101 0.036367 4.402357 0.0000
CARS? -0.185436 0.288293 -0.643223 0.5207 Random Effects
_1--C 0.133506 _2--C -0.168276 _3--C -0.267022 _4--C 0.068010 _5--C 0.104589 _6--C -0.158447 _7--C -0.167751 _8--C -0.108661 _9--C 0.690361
_10--C 0.039077 _11--C 0.111836 _12--C -0.708432 _13--C -0.207211 _14--C -0.773383 _15--C -0.823216 _16--C 0.243869 _17--C -0.604755 _18--C -1.001673 _19--C 0.244222 _20--C -0.441969 _21--C -0.441758 _22--C -0.076262 _23--C 0.704844 _24--C 0.312882 _25--C -0.039470 _26--C 0.161947 _27--C 0.117261 _28--C -0.094604 _29--C 1.165657 _30--C 0.002455 _31--C 1.147638 _32--C 0.196311 _33--C -0.193536 _34--C 0.997446 _35--C 1.441994 _36--C -0.006276 _37--C 0.333325 _38--C -0.993825 _39--C -0.949749

_40--C -1.263379 _41--C -0.212929 _42--C 0.318284 _43--C 0.072771 _44--C 0.845495 _45--C 0.576351 _46--C -0.279874 _47--C -0.047675
GLS Transformed Regression
R-squared 0.865574 Mean dependent var 3.099447 Adjusted R-squared 0.860816 S.D. dependent var 1.851713 S.E. of regression 0.690827 Sum squared resid 107.8565 Durbin-Watson stat 1.492045
Unweighted Statistics including Random
Effects
R-squared 0.886438 Mean dependent var 3.099447 Adjusted R-squared 0.882418 S.D. dependent var 1.851713 S.E. of regression 0.634956 Sum squared resid 91.11633 Durbin-Watson stat 1.766169
Hausman Test
Hausman test
(fixed versus random effects)
Chi-square (8 d.f.) 5.3082812
p-value 0.7241755
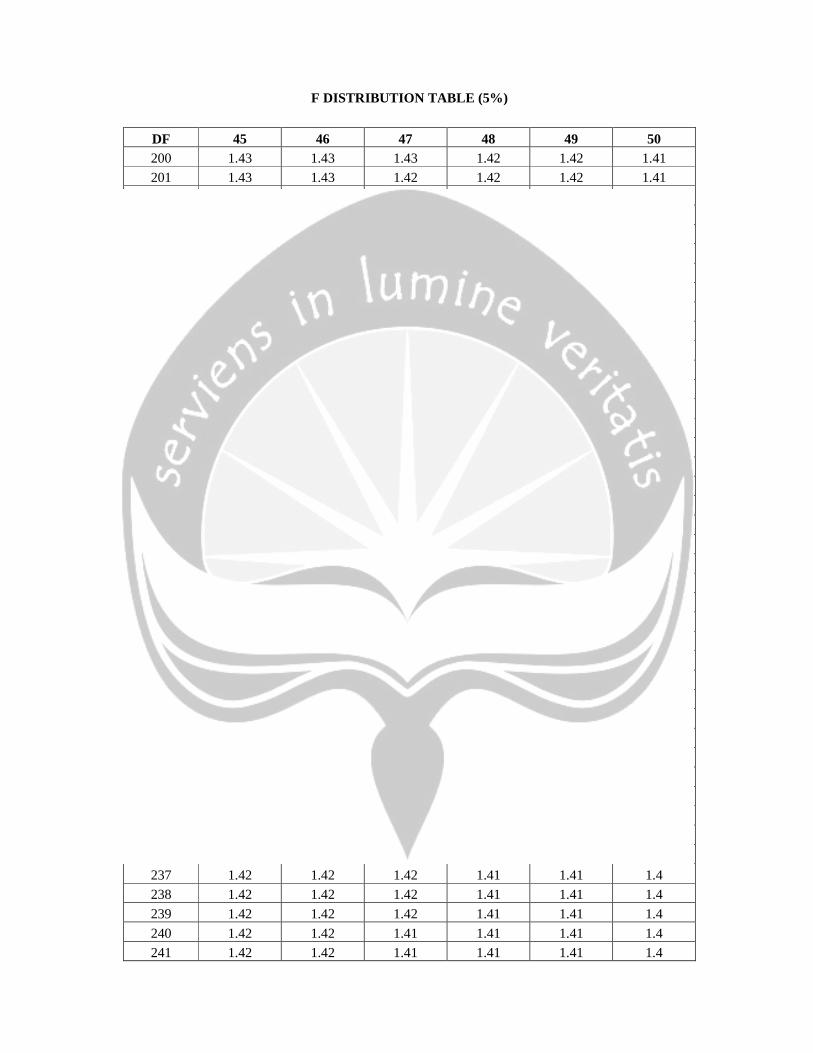
F DISTRIBUTION TABLE (5%)
DF 45 46 47 48 49 50 200 1.43 1.43 1.43 1.42 1.42 1.41 201 1.43 1.43 1.42 1.42 1.42 1.41 202 1.43 1.43 1.42 1.42 1.42 1.41 203 1.43 1.43 1.42 1.42 1.42 1.41 204 1.43 1.43 1.42 1.42 1.42 1.41 205 1.43 1.43 1.42 1.42 1.42 1.41 206 1.43 1.43 1.42 1.42 1.42 1.41 207 1.43 1.43 1.42 1.42 1.42 1.41 208 1.43 1.43 1.42 1.42 1.42 1.41 209 1.43 1.43 1.42 1.42 1.42 1.41 210 1.43 1.43 1.42 1.42 1.42 1.41 211 1.43 1.43 1.42 1.42 1.41 1.41 212 1.43 1.43 1.42 1.42 1.41 1.41 213 1.43 1.43 1.42 1.42 1.41 1.41 214 1.43 1.42 1.42 1.42 1.41 1.41 215 1.43 1.42 1.42 1.42 1.41 1.41 216 1.43 1.42 1.42 1.42 1.41 1.41 217 1.43 1.42 1.42 1.42 1.41 1.41 218 1.43 1.42 1.42 1.42 1.41 1.41 219 1.43 1.42 1.42 1.42 1.41 1.41 220 1.43 1.42 1.42 1.42 1.41 1.41 221 1.43 1.42 1.42 1.42 1.41 1.41 222 1.43 1.42 1.42 1.42 1.41 1.41 223 1.43 1.42 1.42 1.42 1.41 1.41 224 1.43 1.42 1.42 1.41 1.41 1.41 225 1.43 1.42 1.42 1.41 1.41 1.41 226 1.43 1.42 1.42 1.41 1.41 1.41 227 1.43 1.42 1.42 1.41 1.41 1.41 228 1.43 1.42 1.42 1.41 1.41 1.41 229 1.43 1.42 1.42 1.41 1.41 1.41 230 1.42 1.42 1.42 1.41 1.41 1.41 231 1.42 1.42 1.42 1.41 1.41 1.41 232 1.42 1.42 1.42 1.41 1.41 1.41 233 1.42 1.42 1.42 1.41 1.41 1.41 234 1.42 1.42 1.42 1.41 1.41 1.41 235 1.42 1.42 1.42 1.41 1.41 1.41 236 1.42 1.42 1.42 1.41 1.41 1.4 237 1.42 1.42 1.42 1.41 1.41 1.4 238 1.42 1.42 1.42 1.41 1.41 1.4 239 1.42 1.42 1.42 1.41 1.41 1.4 240 1.42 1.42 1.41 1.41 1.41 1.4 241 1.42 1.42 1.41 1.41 1.41 1.4

242 1.42 1.42 1.41 1.41 1.41 1.4 243 1.42 1.42 1.41 1.41 1.41 1.4 244 1.42 1.42 1.41 1.41 1.41 1.4 245 1.42 1.42 1.41 1.41 1.41 1.4 246 1.42 1.42 1.41 1.41 1.41 1.4 247 1.42 1.42 1.41 1.41 1.41 1.4 248 1.42 1.42 1.41 1.41 1.41 1.4 249 1.42 1.42 1.41 1.41 1.41 1.4 250 1.42 1.42 1.41 1.41 1.41 1.4