Embed Size (px)
Citation preview

CHAPTER VI
LOCAL FINANCE UNDER PEOPLE'S PLAN CAMPAIGN
6.1 Introduction
This chapter is divided into two parts. The theoretical aspects of the
people's plan campaign are discussed briefly in the first part. In the second part
the finance under People's Plan Campaign is analysed in detail.
Part I
6.2 The People's Plan Campaign
The 73'(' and 74"' constitutional amendments paved the way for involving
people in local level economic planning. 'People's Campaign for the Ninth
Plan' in Kerala was initiated following the decision of the state government to
earmark 35 to 40% of the state's ninth plan for schemes and projects fomulated
by local bodies. There was a felt need for transferring more powers to local
bodies which prompted the government to frame such a policy. Frank and
Chasin have rightly observed "Kerala's Complex geographical and social
diversity means that officials in the capital city might not know what is best for
particular Panchayats. And Kerala's rich history of mass movements and its high
level of education mean that local participation could overcome the bane of
much international participation- oriented development where democratic
structures on paper just become new mechanism for elite dominance and
exploitation of the poor".'

3 14
People's Plan Campaign aims at empowering the local bodies to formulate
the plans and implement them in a scientific and participatory manner. The
Kerala State Planning Board, then headed by I.S. Gulati, in its first meeting on
6th July 1996 announced decentralised planning in Kerala.
It aims at co ordinated village level plans with the individual government
departments giving assistance . It has been generally felt that such an attempt
would boost up the social and economic development of Kerala. Kamalkutty's
opinion is worth noting here. " In recent times it is revealed that Kerala model
has lacked sustainability. In the absence of sustained economic growth, even the
equity side of development cannot be sustained. The latest Kerala model aims
at transforming the local bodies in to genuine institutions of local self
government endowing them with substantive administrative and financial
power".2
Many powers and functions have been additionally assigned to local
bodies. The responsibility for the management of these institutions has been in
the hands of the elected representatives. They have the power to give priorities,
fix the nornls for selecting beneficiaries and the mode of implementing the
projects . The then Chief Minister of Kerala had noted " We in Kerala have
already taken action by allocating between 35-40 percent of the ninth plan outlay
to local bodies who had been convening Gram Sabhas and ward conventions to
list our local priorities in advance of projectization and formulation of local level
315
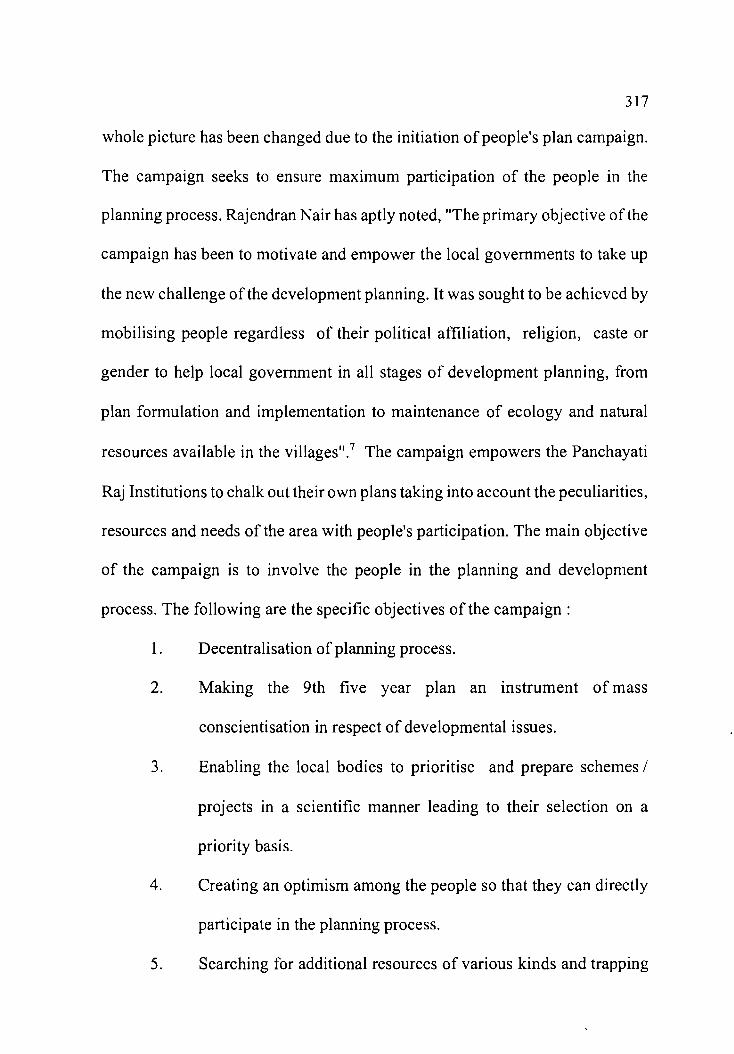
plans, for incorporation in the state plan".) The people's plan emphasises
encouragement of maximum people's participation at every stage of the planning
process. Thus a multi level planning system was evolved involving people and
taking into account the peculiarities of a specified region .It was institutionalised
and operationalised in Kerala. Rajendrajn Nair opines, "The Gandhian dream
of Gram swaraj is very much reflected in the conceptualisation of the people's
plan campaign. It highlights the need for popular participation in the working of
PRIs especially in plan formulation and implementation and also in maintaining
social justice, commitment, accountability and transparency of plan
implementation^".^ Gandhiji's idea of democratic decentraliasation is based on
planning from bottom where people are independent in framing their policies.
6.3 Earlier Experiments
Decentralised planning on an experimental basis was first implemented
in 25 Panchayats in Kerala in the early Nineties. It was a part of the Panchayat
Resource Mapping Programme (PRMP). Kalliasseri Panchayat was selected as
the first Panchayat to have a Panchayat Development Plan based on Resource
Mapping. The people of the Panchayat themselves collected the data regarding
the resources of their Panchayat area. An integrated village development plan
was drawn up for implementation. It is commonly referred to as 'Kalliasseri
experiment'. It was found to be a great success which led the authorities to
think of decentralised planning in Kerala. The effectiveness of the programme

316
can be understood from the following comment. "Kalliasseri developn~ent
volunteers built an 825 metre long canal in one day, draining a previously
waterlogged area of rice fields. They mapped the resource of their village
reorganised their schools, installed high efficiency cook stoves and solar street
lights, set up a shrimp farm in a swamp area and created dry -season vegetable
co-operatives that generated employment and brought down the cost of food".5
The success of Kalliasseri experiment inspired the government of Kerala to
adopt decentralised planning in Kerala.
6.4 Objectives of People's Plan Campaign
Planning in India had been a centralised function. The central government
decided the objectives and strategies of the plan and allocated funds for the
execution of the plan. People at the grass root level had no direct role in the
planning process. The then Vice Chairman of the State Planning Board, Kerala
and K.M. Shajahan also of the Planning Board said, "Instead of evolving
comprehensive programmes taking into consideration the strengths and
weaknesses of the local land water resources, the main feature of the state
planning being implemented turned out to be primarily departmentalism where
different government departments formulated and implemented schemes
according to their perceptions. Thus the whole planning process became not only
highly centralised but also b~reaucratised".~ Thus people had no direct role in
the planning process. Previously plans were imposed upon the people. The
317
whole picture has been changed due to the initiation of people's plan campaign.
The campaign seeks to ensure maximum participation of the people in the
planning process. Rajendran Nair has aptly noted, "The primary objective of the
campaign has been to motivate and empower the local governments to take up
the new challenge of the development planning. It was sought to be achieved by
mobilising people regardless of their political affiliation, religion, caste or
gender to help local government in all stages of development planning, from
plan formulation and implementation to maintenance of ecology and natural
resources available in the villages".7 The campaign empowers the Panchayati
Raj Institutions to chalk out their own plans taking into account the peculiarities,
resources and needs of the area with people's participation. The main objective
of the campaign is to involve the people in the planning and development
process. The following are the specific objectives of the campaign :
1. Decentralisation of planning process.
2. Making the 9th five year plan an instrument ofmass
conscientisation in respect of developmental issues.
3. Enabling the local bodies to prioritise and prepare schemes l
projects in a scientific manner leading to their selection on a
priority basis.
4. Creating an optimism among the people so that they can directly
participate in the planning process.
5 . Searching for additional resources of various kinds and trapping

318
those resources for the welfare of the people of an area.
6. Enabling the local bodies to perform their functions efficiently and
effectively for the sustainable development of an area.
7. Ensuring maximum voluntary labour and social contribution to the
development activities.
8. Instilling a sense of co-operation among the people for the growth
and development of an area.
9. Doing away with the contractors or other middlemen in the
implementation of the projects prepared by the Panchayats
In the People's Plan Campaign the Gram Sabhas have been assigned 'the
responsibility of identifying local problems and indicating priorities. Maximum
people's participation is sought to be ensured by local bodies at every stage of
the planning process. Bijukumar observes, "people's planning also intended to
create a greater awareness in economic development along with social progress
by way of closer association of scientists, experts, technocrats , administrators
and academicians for the common cause of the development of the state".'
6.5 Phases of People's Plan Campaign
The campaign is intended to bring together government officials in the
various line departments, retired official experts, volunteers and the mass of the
people under the leadership of local representatives for genuine grass root level
planning. The approach paper approved by the government through a formal
order envisaged a five stage planning process.'
6.5.1 Phase 1: Gram Sabha
Identification of the felt needs of the people is the first step in the
decentralised planning process. For that Gram Sabhas have to be convened
ensuring maximum participation of the people to discuss local development
problems.
Section 3 of Chapter I11 of the Kerala Panchayat Raj Act 1994, contains
the provision regarding Gram Sabha. Accordingly, each ward of a village
Panchayat can be considered as a village for the formation of Gram Sabha. It
consists of persons registered in the electoral roll of the ward concerned . Gram
Sabha must be convened minimum twice in a year in a place decided by the
village Panchayat. Gram Sabha has the following functions
a) To help in preparing developmental schemes and monitor and
evaluate their implementation.
b) To cultivate a sense of unity and harmony among people.
c) To mobilise voluntary work and to collect donations for the
developmental programmes.
d) To help in the identification of beneficiaries.
e) To discuss various developmental activities and give suggestions
The law fixed the quorum for the Gram Sabha at 50, which continued to

320
be in force until 1999 when the Kerala Panchayat Raj Act was amended. Since
then the quorum has been revised to 10% of the total membership.
6.5.2 Phase 2 : Development Seminars
The development seminars are organised at the Panchayat and Municipal
levels. These are convened to discuss the problems identified at the lower level,
organise a task force and to prepare schemes under various sectors. Based on the
report of task force, a Panchayat development plan would be drawn by an expert
group. The discussions in the development seminars are centred around the
Panchayat development reports. "Development reports were to be drafted on the
basis of the following exercises:
(i) Consolidation of Gram Sabha reports
(ii) Review of ongoing schemes
(iii) Collection of secondary date
(iv) Geographical study of the area and
(v) A brief survey of local hi~tory". '~
6.5.3 Phase 3: Task Forces
Sector wise task forces constituted at the grass root level convert solutions
into project proposals. The task of project preparation requires more officials
and technically qualified persons than those required at the earlier phases. A
simple and transparent format is proposed for the projects to be prepared by the
task force to ensure uniformity. The task force should make a detailed review of

32 1
the ongoing programmes in their respective sector, analyse the development
problems and solutions suggested at the seminar and prioritise and prepare
projects.
6.5.4 Phase 4 : Annual Plan Finalisation
After the third phase, every village Panchayat prepared a number of
projects. At this time, the grant-in-aid allocated to local body by the state
government was also made known. It was time to prioritise and incorporate the
projects into five year plans of the Panchayats, which was later revised to annual
plan on realistic grounds. The local bodies were also encouraged to take up
addtional schemes of their own. The plan allocation from the state could be
supplemented by voluntary contribution of money, material and labour.
Each Panchayat prepared a plan document comprising of eight chapters,
viz., introduction, the development strategy, resource mobilisation, sectoral
programmes intergrated development, welfare of scheduled caste and scheduled
tribes, women's development programmes and monitoring."
6.5.5 Phase 5 : Annual Plan Of Higher Tiers
The blocks and district Panchayats were to prepare their annual plans
after the preparation of annual plans by village Panchayats. " The sequential
ordering of the process was made in order to ensure that the plans of various tiers
are integrated and the plans of the higher tiers are complimentary to those of the

3 22
lower tiers".I2 The block and district Panchayats also organise seminars to
discuss their draft plans.
6.5.6 Phase 6: Plan Appraisal
It was found that a significant proportion of the projects prepared at the
village level had to be examined for their technical soundness and viability and
corrected before they are implemented. Voluntary Technical Corps (VTC)
consisting of experts were constituted. Retired technical experts and
professionals were encouraged to enrol themselves as volunteers, to appraise the
projects of local bodies and to rectify the weaknesses in technical details and
financial analysis. "Expert Committees were formed at Block (BLEC),
Municipal (MLEC) and District levels' (DLEC) drawing upon the VTC members
along with certain categories of mandatory officers. The District Planning
Committees approved the plan on the recommendations of those expert
committee^".'^
The expert committee cannot change the priorities set by the local bodies.
Their functions are to make technical and financial appraisal of the projects and
to suggest modification to make the projects feasible.
6.6 Guidelines for Sectoral Allocation
In order to ensure the overall thrust of the state plan certain broad
guidelines were given regarding sectoral allocation in the plans of local bodies.

The minimum and maximum percentage share of investments are indicated for
the three broad development sectors viz productive, service and infrastructure
sectors.
- -
Source: Economic Review 2000
The above guidelines are for the rural local bodies, which are different
from that of urban local bodies. The guidelines are applicable only to the
general sector grant- in- aid from the state goverment and not to the investiment
outlay to be financed from other sources. As for Special Component Plan (SCP)
and Tribal Sub Plan (TSP), the minimum share in the productive sector is not
insisted upon. The allocation of 10 % of grant in aid for women component plan
was made mandatory from 1998-99 onwards..
6.7 The "Ayalkkottant l t
The malayalam word 'ayalkkoottam' means neighbourhood forum. The
Table 6.1 Guidelines for Sectoral Allocation
'ayalkkoottams are taking shape and functioning below the Gram sabha in many
village in Kerala. It really marks the begining of a new development culture. An
'ayalkkoottam' consists of 20 to 50 families of a particular area of a ward. It
meets atleast once in a month where the members discuss matters of their
common interest and work on a co-operative basis to solve their probelms.
Sector
Productive Service Infrastructure
Allocation (in %)
40 - 50 30 - 40 10 - 30

3 24
According to Rajendran Nair, "As far as the planning process is concerned,
ayalkkoottams play a decisive role in making participation in Gram Sabhas
effective projectising issues at grass root levels with firm understanding and
selecting beneficiaries in a just manner and as monitoring committees of plan
programmes". l 4
In addition to the Gram Sabhas and ayalkkoottams, there are ward
committee, Panchayat development committe and execution committee in every
village Panchayat. The ward development committee consists of members
elected from the ayalkkoottam and ward member who is the ex-officio
Chairperson of the committee. The Panchayat development committee
comprises of two representatives elected from the various ayalkkoottams, ex-
office Chairperson of the ward development committees and less than ten
nominated members. The executive committee monitors the implementation of
the projects at the Panchayat level. After making a thorough evaluation of the
people's plan campaign, Franke and Chasin comment, " Three million people,
10 percent of the states population, took part in the Gram Sabha that aired
complaints and identified the major problems in their villages and urban
neighbourhoods in September and October 1996. Imagine 1.8 million New York
metropolitian area residents meeting for six hours arguing and electing
problems solving working groups to plan strategies for overcoming local
problems. Imagine thousands of them continuing to meet for weeks to hammer
325
out local plans for which a massive portion of federal and state funds would be
a l lo~ated" . '~ The planning process involves organising Gram Sabhas, seminars,
task forces, projects preparation, approval, implementation and appraisal of
projects. The people's campaign for the gth five year plan is a social movement
which is noteworthy. The wide popular participation of people in various stages
of planning and implementation ignoring the financial status, caste, creed
religion and political affiliation make the movement a model to others. Isaac
and Harilal have rightly pointed out, "First of all .the campaign promised to
break the strait-jacket of biopolar front politics in the state and usher in a new
era of unity for development action cutting across political affiliations."I6
The Panchayats have accepted the campaign as their own. They are
getting a substantial amount of finance from the State government as grant- in-
aid apart from new sources of finance. Oommen John's observation is right,
"The balance sheet would show that the P.R bodies in Kerala are in a better
position now when compared to previous years. Apart from constituional
protection, it has that resource - finance and that too in plenty - which it lacked
before. This time, the onus for its working lies on them and the balme cannot be
laid on the state goverment for lack of political will"." In addition to this, local
bodies are expected to use untapped resources. Most of the Gram Sabhas have
resolved to use beneficiary contributions and voluntary labour along with
goverment grants to implement schemes or projects undertaken by Panchayats.

People's Plan Campaign has created a new development culture among
the rural people. Goplalakrishnan Nair opines "The biggest achievement of the
people's plan campaign is that there has been marked change in .the attitude of
the people towards the planning process. . . . Previously people were found to
be lethargic to the needs of their village, today the people are concerned about
the probelms of their village".18 However, to get maximum from this new
initiative, political parties should have a rational approach to the developmental
issues of the state in general and that of a Panchayat in particular. They should
set aside their partisan interest while having the plan. Rajendran Nair rightly
observed. "In those Gram Panchayats where Gram Sabhas are functioning
effectively, the experience is that people can overcome narrow political
considerations and come together for doing things which are so far left
undone". l 9
The planning process at the grassroot level through local bodies is a
unique experiment . But it is not free from limitations and weaknesses.
However, these should not discourage us. To quote Oommen John, "Though
there has been shortcomings in the work done by local bodies so far as the
implementation process is concerned one need not be pessimistic about its
future. There are bound to be teething problems in any new plan being
introduced for the first time".20 One has to learn lessons from failures. Kerala is
much ahead of other states in terms of social indicators like education, sanitation

327
and health. It can achieve the goals set up for economic development through
decentralised planning. The state government is committed to ensure that the
local bodies take a firm root and play an active role in the decentralised planning
process
Part I1
6.8 Finance Under Peoples Plan Campaign
Before the People's Plan Campaign the share ofplan expenditure by local
bodies was negligible . Their involvement in the plan was confined to the
utilization of the relatively smaller amounts of untied plan grants and amounts
under governlent sponsored schemes. The entire scenario changed drastically
with the initiation of decentralised planning. The plan grant-in-aid is now the
most important receipt of local bodies. Consequently, there is a drastic change
in the pattern of expenditure too.
6.9 Devolution of Plan Funds
In 1996-97 Kerala state Budget, Rs 69 crores was provided for the urban
local bodies and Rs 143 crores for the rural local bodies as untied plan grant. Of
the untied funds to the rural local bodies Village Panchayats were allocated
RslOO crores, Block Panchayats Rs 15 crores and District Panchayats Rs 28
crores.
A higher plan allocation was provided to the local bodies in the following
years. The following table shows it.

328
Table 6.2 Share of Local Governments in State Plan (Rs. In Crores)
I I I I 1
Source : Economic Review. 2000
Year
1997-98 1998-99
1999-2000 2000-200 1
The grant- in- aid to the local bodies has two components- (a) Untied
funds and (b) State sponsered schemes. In addtion to that, funds are given to
local bodies to undertake projects under centrally sponsored schemes.
Grant-in-aid
749 950 1020 1045
A remarkable feature of the grant- in- aid is that it consists of a high
proportion of untied grant. It means that maximum autonomy is given to the
local bodies in the planning process. The budgetary provision for the grant-in-
aid to the local bodies has three components - General Sector Plan, Special
Component Plan (SCP) and Tribal Sub Plan (TSP). Plan funds under each of the
above heads are allocated between urban and rural local bodies on the basis of
population ratio. As for rural local bodies; the total general sector allocation is
distributed to Gram Panchayats block Panchayats and district Panchayats in the
ratio 70: 15: 15. For the special component plan, the share of 20 percent each was
fixed for higher tiers. In the case of Tribal sub plan it was distributed among the
Gram Panchayat, block Panchayat and district Panchayat in the ratio 20:20:60
in 1997-98. During 1998-99, greater weightage was assigned to the Gram
State sponsored scheme
276 166.50 134.40 224.27
Total
1025 11 16.50 1 154.40 1269.27

Panchayats and the ratio is 40:20:40. The allocation of grant- in- aid among
various tiers of local bodies can be noted from the following table.
Table 6.3 Distribution of Plan Grant-in-aid to Local Bodies (Rs. in crores)
1997 - 98 -
Local body
Gram Panchayats Block Panchayats District Panchayats Municipalities Corporations
Total
(Table Continued) 1998 - 99
Local body
Gram Panchayats Block Panchayats District Panchayats Municipalities Corporations
Total
Local body
Gram Panchayats Block Panchayats District Panchayats Municipalities Corporations
Total
Total
420.49 108.69 123.94 62.34 33.54
749.00
General
307.02 65.79 65.79 49.54 27.86
5 16.00
General
426.02 9 1.29 91.29
' 71.18 36.22
7 16.00
General
464.10 99.45 99.45 77.5 1 39.49
780.00
SCP
105.85 35.28 35.28 12.15 5.44
194.00
TSP
7.62 7.62
22.87 0.65 0.24
39.00
SCP
11 1.03 37.0 1 37.0 1 10.38 4.57
200.00
Total
549.54 135.02 142.67 81.89 40.88
950.00
SCP
108.21 36.07 36.07 10.17 4.48
195.00
TSP
15.31 7.66
15.3 1 0.54 0.18
39.00
TSP
19.88 7.95
1 1.93 0.24
-
40.00
Total
595.01 144.41 148.39 88.13 44.06
1020.00

Source : Economic Review, 2000
2000 - 2001
The total grant -in -aid received by Gram Panchayat in 1997-98 was Rs
420.49 crores It increased gradually and came to Rs 608.91 crores in
2000-2001. The grant- in -aid to other tiers of Panchayats and to Municipalities
and Corporations also showed increase every year. The grant-in-aid under
general sector plan increased every year in the case of the three tiers of
Panchayats, Municipalities and Corporations. In the case of special component
plan, the amount of grant is showing an increase every year for each of the three
tiers of Panchayats. But the grants under special component plan to
municipalities and corporations slightly decline in the year 1998-99.
Local body
Gram Panchayats Block Panchayats District Panchayats Municipalities Corporations
Total
Tribal Sub Plan grant shows and increasing trend every year in the case
of Gram Panchayat and block Panchayats. However, there is a decline of this
grant to district Panchayats, municipalities and corporations during 1998-99 and
1999-2000.
General
467.08 100.09 100.09 78.00 39.74
785.00
SCP
120.46 40.16 40.16 11.26 4.96
2 17.00
TSP
2 1.37 8.55
12.82 0.26
-
43 .OO
Total
608.91 148.80 153.07 89.52 44.70
1045.00

33 1
6.10 Investment Pattern of State Plan Assistance
The following table is a comparative statement of the total outlay among
various development sectors for the years 1997-98 to 1999-2000.
Table 6.4 Sectoral Investment Pattern of Plan Funds
Source : Based on data from Economic Review, 2000
In the first year of people's plan campaign 33.93% of the grant-in-aid has
been invested in the productive sector. In 1998-99 the percentage of investment
in productive sector to the grant-in-aid sharply increased to 40.66. However it
declined to 28.3 1 in 1999-2000.
Year
97-98 98-99 99-00
The service sector got due weightage in terms of the number of projects
and allocation of funds. In 1997-98,41.63% of the grant was spent in the service
sector while it was 38.06 in 1998-99. In 1999-2000, a sharp increase of the
percentage of allocation can be noted, i.e., it rose to 48.35.
In the case of infrastructure there is no wide variation in the percentage
of investment in various years. The percentages are 24.44, 21.28 and 23.34
respectively for 1997-98, 1998-99 and 1999-2000.
Productive Sector
110 of projects
24932 32585 44435
Grant in aid %
33.93 40.66 28.3 1
Service Sector Infrastructure
No of projects
256 18 37476 55813
No of projects
17216 29493 59602
Grant in aid %
4 1.63 38.06 48.35
Grant in aid %
24.44 2 1.28 23.34

332
6.1 1 Finance Under People's Plan Campaign in Selected Panchayats.
The revenues and expenditure of Panchayat under the campaign are taken
separately here for analysis
The revenues of Panchayat under the campaign consists mainly of plan
funds, amount transferred from own h n d s of Panchayats, beneficiary
contributions and others. The plan fund devolved to the Panchayat constitutes
the main item of revenue. The following table shows the plan funds recieved by
Panchayat from 1997-98 to 2000-2001.
6.11.1 Plan Funds From State Government
Table 6.5 Plan Funds Received
The plan funds devolved to Panchayat do not clearly show a trend if the
data related to each Panchayat is taken individually. In the case of Champakulam
Panchayat it was Rs 264 1000 in 1997-98. A sharp increase is noted in plan funds
in 1998-99 where as, it declined slightly in 1999-2000. However Champakulam
Panchayat received the highest amount of plan h n d in 2000-2001, ie Rs
48,43,166.

333
In the case of Kainakary Panchayat, higher amounts of plan funds have
been received by it year after year except in 2000-2001. In that year there is a
slight decline in the amount of plan fund. In the year 1999-2000 the plan fund
received is Rs 45,82,2650 compared to Rs 22,83,3000 received in 1997-98.
Nedumudy Panchayat also received higher amounts of plan funds year
after year for the first three years. It was Rs 28,32, 60 in 1997-98 which
increased to the maximum of Rs 58,43,013 in 1999-2000. In 2000-0 1, i t declined
to Rs 45,41,250. It is to be noted here that, of the plan funds received by six
Gram Panchayats in each year, Nedumudy received the highest amount, i.e., Rs
58,43, 013 received in 1999-2000.
Edathua Panchayat received Rs 34,30,000 in 1997-98 as plan fund. In
1998-98 and in 1999-2000, the plan funds received increased while in 2000-0 1,
it declined. They are respectively Rs 5 1,94,000, Rs 56,78,000 and Rs 45,12,500
in three years from 1998-99 to 2000-01
Thakazhy Panchayat received Rs. 33,86,000 in 1997-98 by way of plan
fund from the government. It increased to Rs. 52, 37,000 in 1998-99. But in
the following two years, it declined gradually, the amount being Rs. 44,00,634
and Rs. 39,43,8 10 respectively.
Thalavady Panchayat received the maximum plan fund in 1999 - 2000,
the amount being Rs. 53,17,0000. In the first year of the plan, it received Rs

334
34,81,0000 which was the highest amount of plan fund recieved by a Panchayat
among six Panchayats in that year. In 1998-99 it increased to Rs 48,75,000 and
in 1999-00 to Rs. 53,17,000. However, in 2000-01 it declined to Rs 46,39,4 15.
The averages of plan funds recieved by various Panchayats in different
years give an overall picture. The average plan fund is Rs 30,08,927 in 1997-98.
It increased to Rs 47,31,861 in 1998-99 and Rs 49,56,439 in 1999-2000 while
the corresponding figure in 2000-0 1 is Rs 44,90,6 1 1 recording a slight decline
Analysis of Variance
Two way analysis of variance is made to assess whether there in any
significant difference between various years and to assess whether there is
significant difference between Panchayats in respect of plan funds received.
Table 6.6
Between Years (Rows)
The calculated value of F is greater than the table value at 5% level of
significance. Hence there is much difference between the amount of plan funds
received in various years.
335
Between Panchayats. (Columns)
As the calculated value of F is less than the table value at 5% level of
significance there is no significant difference between Panchayats in respect of
plan fund received.
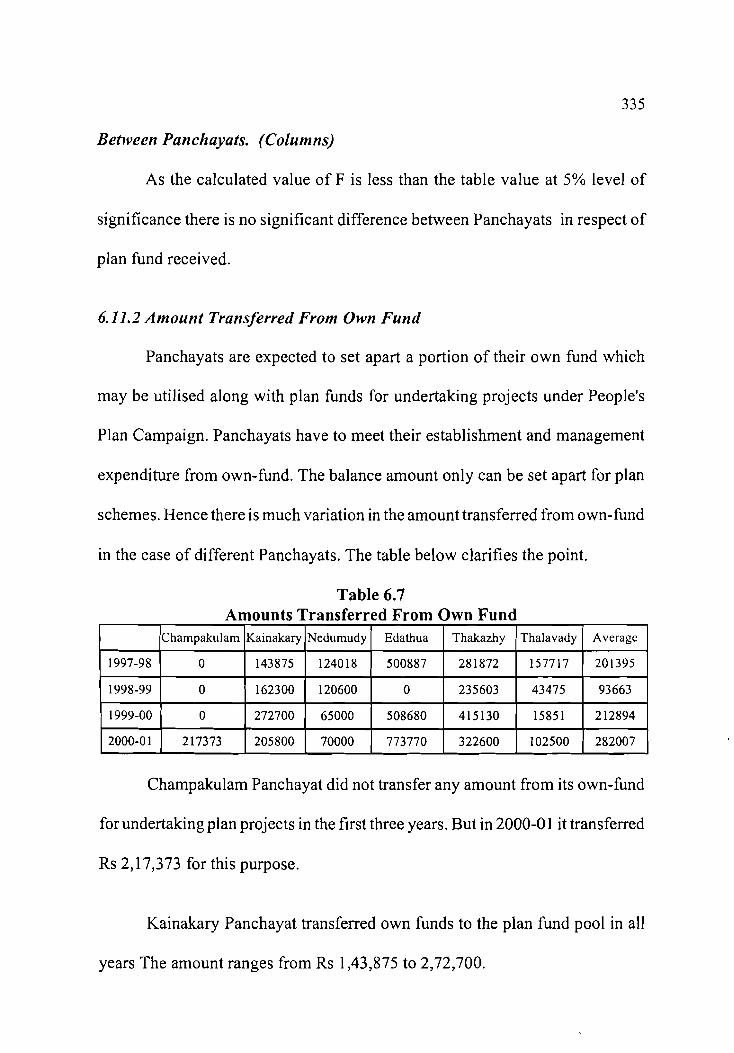
6.1 1.2 Amount Transferred From Own Fund
Panchayats are expected to set apart a portion of their own fund which
may be utilised along with plan finds for undertaking projects under People's
Plan Campaign. Panchayats have to meet their establishment and management
expenditure from own-fund. The balance amount only can be set apart for plan
schemes. Hence there is much variation in the amount transferred from own-fund
in the case of different Panchayats. The table below clarifies the point.
Table 6.7 Amounts Transferred From Own Fund
Champakulam Panchayat did not transfer any amount from its own-fund
for undertaking plan projects in the first three years. But in 2000-0 1 it transferred
Rs 2,17,373 for this purpose.
1997-98
1998-99
1999-00
2000-01
Kainakary Panchayat transferred own funds to the plan fund pool in all
years The amount ranges from Rs 1,43,875 to 2,72,700.
Champakulam
0
0
0
217373
Kainakary
143875
162300
272700
205800
Thalavady
157717
43475
15851
102500
Thakazhy
281872
235603
415130
322600
Nedumudy
124018
120600
65000
70000
Averagc
201395
93663
212894
282007
Edathua
500887
0
508680
773770

Nedumudy Panchayat also made the contribution from its own fund for
undertaking planned projects in all the years under review. It was Rs 1,24,0 18
in 1997-98 which is the maximum in Nedumudy. It declined in 1998-99 to
Rs 1,20,600. It further declined to a mere Rs 65,000 in 1999-2000. In 2000-200 1
the amount transferred was Rs 70,000.
In Edathua Panchayat a substantial amount of Rs 5,00,887 came from
own-fund in 1997-98 for planned investment. However, in 1998-99, no amount
has been transferred from own fund for this purpose. In 1999-2000 and in
2000-2001, Rs.5,08,680 and Rs.7,73,770 respectively were transferred from own
fund. Compared to the amounts spent by other Panchayats under study these
amounts are much larger.
Thakazhy Panchayat transferred a certain portion of own -fund to the total
plan fund in all .the years. The amount here ranges from Rs.2,35,603 to
Rs.4,15,130
There is much variation in the amount of money transferred from own
fund in the case of Thalavady Panchayat. In the first year it was Rs. 1,57,7 17
while it was Rs.43,475 in 1998-99 Rs. 15,85 1 in 1999-2000 and Rs71,02,500 in
2000-0 1.
The variation of transferred amounts in different Panchayats is very well

reflected in the average figures. The average amount of transferred fund of six
Panchayats in 1997-98 is Rs.2,01,395 while it is only Rs.93,663 in 1998-99. In
1999-2000, it is Rs.2,12,894 while in 2000-01 it is Rs.2,82,007.
Between Years (Rows)
Table 6.8 Analysis of Variance
The two way analysis of variance made,shows that there is no significant
Source of
Variation Lows Zolumns 7 -nor Total
different between various years in respect of own funds transferred.
Between Panchayats (Columns)
However, there is significant difference between various Panchayats in
respect of own hnds transferred.
F crit
3.2873828 2.9012952
SS
1.09054E+ 1 1 4.80202E+ 1 l 2.82003E+11 8.7 1259E+11
6.11.3 Beneficiary Contribution
Panchayats do not merely rely on the plan grants and own funds to
df
3 5
15 23
implement plan projects . Local people are also expected to contribute towards
it. Individuals or group of people receiving the benefit of the scheme or projects
MS
36351425851 96040364439 18800198841
implemented under the people's plan campaign make the contributions. They
make the contributions in terms of cash or service (Sramadan). A close analysis
F
1.933566031 5.108475993
of the amount of beneficiary contribution reveals that there is much variation
between Panchayats in respect of beneficiary contributions.
P-value
0.167550038 0.0062 14083
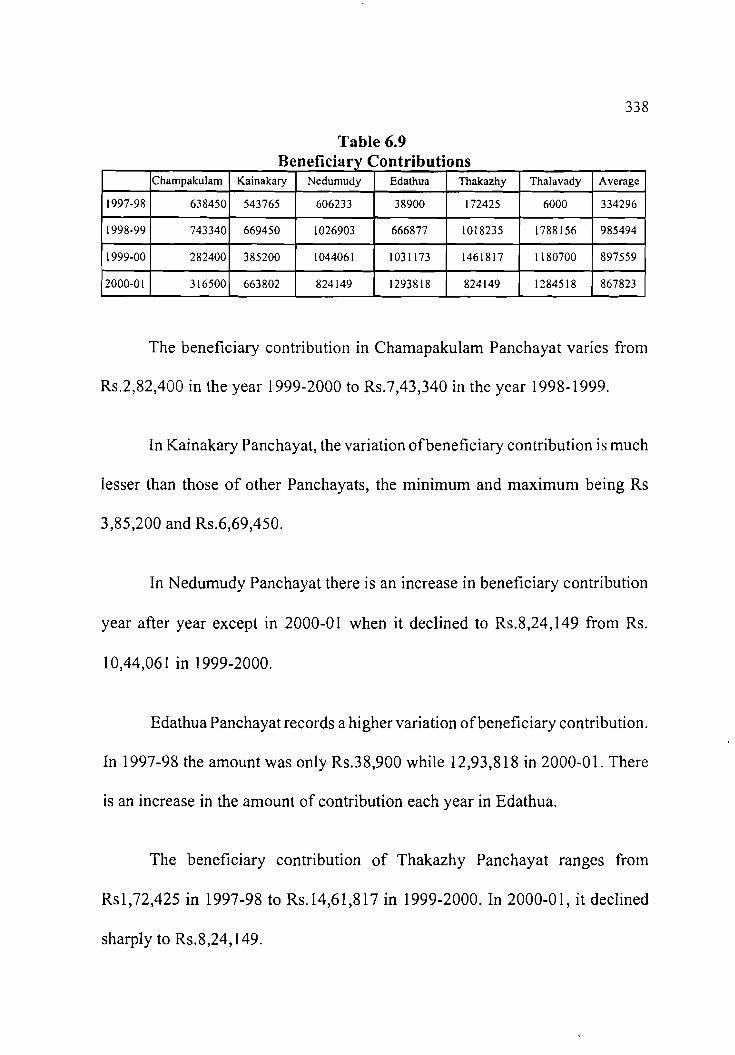
The beneficiary contribution in Chamapakulam Panchayat varies from
Rs.2,82,400 in the year 1999-2000 to Rs.7,43,340 in the year 1998-1999.
Table 6.9 Beneficiary Contributions
In Kainakary Panchayat, the variation ofbeneficiary contribution is much
lesser than those of other Panchayats, the minimum and maximum being Rs
3,85,200 and Rs.6,69,450.
In Nedumudy Panchayat there is an increase in beneficiary contribution
year after year except in 2000-01 when it declined to Rs.8,24,149 from Rs.
10,44,06 1 in 1999-2000.
1997-98
1998-99
1999-00
2000-0 1
Edathua Panchayat records a higher variation of beneficiary contribution.
In 1997-98 the amount was only Rs.38,900 while 12,93,8 18 in 2000-0 1. There
is an increase in the amount of contribution each year in Edathua.
Champakulam
638450
743340
282400
3 16500
The beneficiary contribution of Thakazhy Panchayat ranges from
Rs1,72,425 in 1997-98 to Rs. 14,61,817 in 1999-2000. In 2000-01, it declined
sharply to Rs.8,24,149.
Average
334296
985494
897559
867823
Kainakary
543765
669450
385200
663802
Nedumudy
606233
1026903
104406 1
824 149
Edathua
38900
666877
1031173
1293818
Thakazhy
172425
1018235
1461817
824 149
Thalavady
6000
1788 156
1180700
12845 18

In Thalavady Panchayat the beneficiary contribution in 1997-98 was a
meagre Rs.6,000 while it was Rs17,88,156 in 1998-99 followed by Rs. 1 1,80,700
in 1999-2000 and Rs. 12,84,5 18 in 2000-01.
The average beneficiary contribution of six Panchayats for the four years
reveals that the amount is the highest during 1998-99. In the first year, i.e., in
1997-99 i t is that lowest which is Rs3,34,296. The highest average comes to
Table 6.10 Analysis of Variance
Between Years (Rows)
The two way analysis of variance shows that the calculated value of F
(rows) is greater than the table value (F Crit) at 5% level of significance. Hence
there is significant difference between various years in respect of beneficiary
contribution.
Between Panchayats (Columns)
The calculated value of F (columns) is less than the table value (F Crit)
at 5% level of significance. Hence there is no significant difference between
Panchayats in respect of beneficiary contribution.
- -
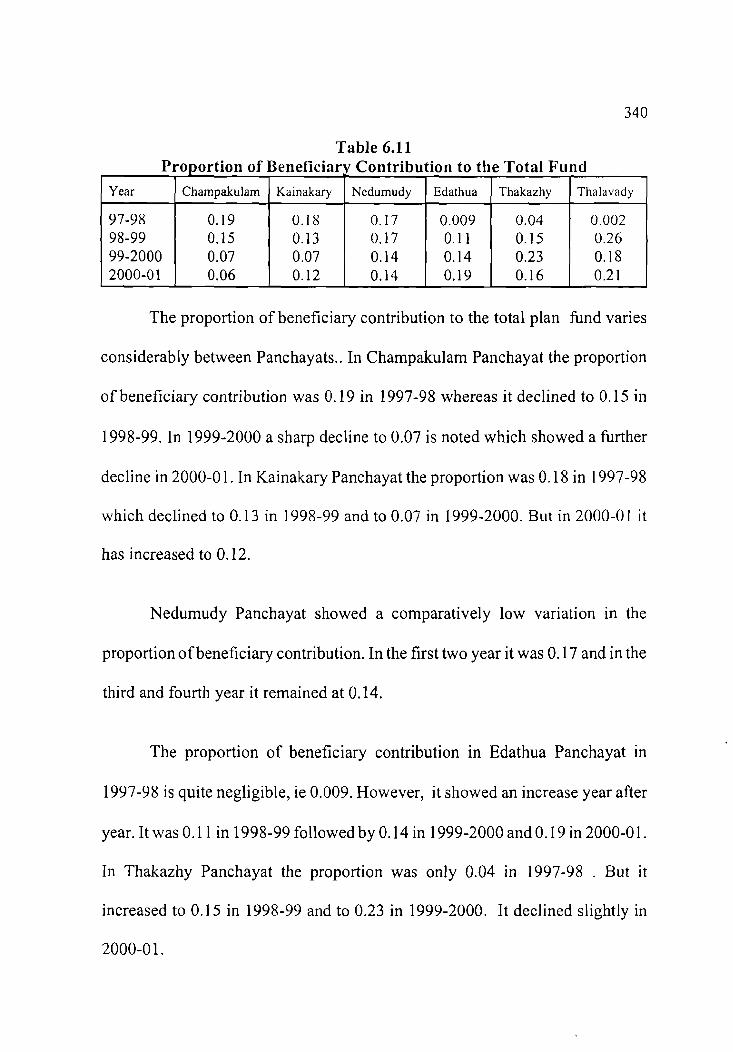
The proportion of beneficiary contribution to the total plan fund varies
considerably between Panchayats.. In Champakulam Panchayat the proportion
of beneficiary contribution was 0.19 in 1997-98 whereas it declined to 0.15 in
1998-99. In 1999-2000 a sharp decline to 0.07 is noted which showed a further
decline in 2000-0 1. In Kainakary Panchayat the proportion was 0.18 in 1997-98
which declined to 0.13 in 1998-99 and to 0.07 in 1999-2000. But in 2000-0 1 it
has increased to 0.12.
Table 6.11 Proportion of Beneficiary Contribution to the Total Fund
Nedumudy Panchayat showed a comparatively low variation in the
proportion of beneficiary contribution. In the first two year it was 0.17 and in the
third and fourth year it remained at 0.14.
Year
97-98 98-99 99-2000 2000-0 1
The proportion of beneficiary contribution in Edathua Panchayat in
1997-98 is quite negligible, ie 0.009. However, it showed an increase year after
year. It was 0.1 1 in 1998-99 followed by 0.14 in 1999-2000 and 0.19 in 2000-0 1.
In Thakazhy Panchayat the proportion was only 0.04 in 1997-98 . But i t
increased to 0.15 in 1998-99 and to 0.23 in 1999-2000. It declined slightly in
2000-0 1.
Champakulam
0.19 0.15 0.07 0.06
Kainakary
0.18 0.13 0.07 0.12
Nedumudy
0.17 0.17 0.14 0.14
Thalavady
0.002 0.26 0.18 0.2 1
Edathua
0.009 0.1 1 0.14 0.19
Thakazhy
0.04 0.15 0.23 0.16

34 1
Thalavady has the lowest and highest proportion of the beneficiary
contribution among the six Panchayats, ,the lowest being 0.002 in 1997-98 and
the highest being 0.26 in 1998-99.
6.1 1.4 Total Plan Fund
The total plan fund consists mainly of the above discussed items of
revenue. When all these are taken together, the Gram Panchayats have
substantial amounts of money to undertake developmental activities. The table
below shows the total fund at the disposal of Panchayats for planned activities
under People's Plan Campaign during the four years from 1997-98 to 2000-01.
Table 6.12 Total Revenue
The total plan fund for the four years under study does not give a clear
trend. In some years it shows an increase while in other years it declines. Only
in Kainakary Panchayat it is steadily increasing. In Nedumudy and Edathua
Panchayats it shows a gradual increase for the first three years but there after it
declines. In Champakulam, Thakazhy and Thalavady Panchayats, no specific
pattern can be noted. The lowest amount of total plan fund in shown by
Kainakary Panchayat in the year 1997-98 and the highest amount is shown by

342
Edathua in the year 1999-2000 which is Rs.72,17,853. Year wise conlparison
shows that all the Panchayats had the lowest amount in 1997-98.
The average total revenue increases in the first three years while it decline
in the third year. The average ranges from Rs.35,7 1,17 1 to Rs 6 1,17,208.
Table 6.13 Analysis of Variance
Between Years (Rows)
The analysis of variance makes it clear that there is significant difference
between various years in respect of total plan fund as the calculated value of F
(row) is greater than the table value at 5% level of significance.
Between Panchayats (Columns)
There is also significant difference between various Panchayats in respect
of total plan h n d as the calculated value of F (column) is greater than the table
value at 5% level of significance.
6.12 Investment Of Plan Funds
Plan funds have been invested in productive sector, service sector and
infrastructure.

6.12.1 Productive Sector
Agriculture, animal husbandry, fisheries, afforestation, soil and water
conservation, minor irrigation , sericulture, co-operatives in agricultural and
industrial sector, cottage and small scale industries and other industries come
under the productive sector. Gram Panchayats are expected to invest 40 to 50%
of plan funds in the productive sector. The table below shows the amount of
money invested by the six Panchayats in the productive sector in various years.
Table 6.14 Total Investment in Productive Sector
In respect of investment in productive sector in the six Panchayats a clear
trend does not emerge. In some years the amount invested increased while in
some other years it declined.
1997-98
1998-99
1999-00
Champakulam Panchayat invested Rs13,11,780 in productive sector
during 1997-98. It increased to Rs.21,82,396 in 1998-99 while it declined in
1999-2000. However it again increased in 2000-0 1
Kainakary Panchayat shows an increasing trend. In fact i t is the only
Panchayat among the six Panchayats showing a clear trend. In the first year of
the campaign its total investment in the productive sector was Rs. 12, 3 1,7 10.
Champakulam
1311780
2182396
1595898
Kainakary
1231710
1961695
1963900
' ~ e d u m u d ~
1418031
2233297
2827504
Edathua
1475845
2222737
2813642
Thakazhy
1253868
2058066
1892344
Thalavady
683149
2392364
2398812
Average
1229064
2175093
2248683

344
The investment here gradually increased every year and reached Rs. 2 1,67,498
in 2000-01
In Nedumudy, Edathua and Thalavady Panchayats the investment in
productive sector increased for the first three years of the campaign, but it
declined in the fourth year. However Thakazhy Panchayat shows amixed pattern
showing an increase followed by a decline and again an increase.
The average investment in productive sector in various years shows that
for the first three years it increased steadily followed by a slight decline in the
fourth year.
Table 6.15 Analysis of Variance
Between Years (Rows)
The calculated value of F (rows) is much higher than the table value F
Crit at 5% level of significance. Hence there is significant difference between
various years in respect of investment in productive sector.
Between Panchayats (Columns)
The calculated value of F (columns) is less than the table value at 5%
level of significance. Hence there is no significant difference between

Panchayats in respect of investment in productive sector.
6.12.2. Investment in Service Sector
Environment protection, education, health, sports, arts, culture, drinking
water, sanitation, housing, slum development, housing co-operative societies, I
anganvadi employment and labour welfare, other social welfare, tourism, public
distribution burial ground, planning 'surveys and studies and consumer
co-operative societies are the main heads coming under service sector. As per the
general guidelines 30 to 40% of the plan funds can be invested in this sector.
The following table shows the amount invested in this sector by the six
Panchayats b
Table 6.16 Investment in Service Sector
Thalavady Average
On a closer analysis it is seen that only Nedumudy Panchayat shows a
clear trend of increase in investment in service sector in various years. In the
case of Kainakary, Edathua, Thakazhy and Thalavady, the investment in service
sector increased in the first three years while it declined in the fourth year. In the
case of Champakulam Panchayat it does not show a clear trend, recording in
increase in 1998-99 a decline in 1999-2000 and again an increase in 2000-01

346
The average investment in service sector in 1997-98 was Rs. 1 1,80,184.
Thereafter it increased to Rs 17,23,943 in 1998-99 and to Rs.18,00,902 in
1999-2000. But the average investment in the sector declined to Rs. 16,70,829
Table 6.17 Analysis of Variance
Between Years (Rows)
The calculated value of F (rows) is more than the table value of F Crit at
5% level of significance. Hence there is significant difference between various
years in respect of investment in service sector.
Between Panchayats (Colunzns)
As the calculated value of F (columns) is less than the table value of F
Crit at 5% level of significance, there is no significant difference between
Panchayats in respect of investment in Service sector.
6.12.3 Investment in Infrastructure
Power production, power distribution, development of non-conventional
energy, energy conservation, roads and bridges, inland water transport, other
modes of transport, waiting sheds, bus stand and public buildings are the main
items coming under infrastructure here. Gram Panchayats can invest 10 to 30%

of the plan h n d in infrastructure as per the general guidelines on sectoral
allocation.
Table 6.18 Investment in Infrastructure
In the case of Champakulam and Kainakary Panchayats the investment
in infrastructure shows increasing trends. In the case of Nedumudy, Edathua
and Thakazhy the amounts invested in infrastructure increased for the first three
years and then decreased. In Thalavady Panchayat an increased amount was
invested in 1998-99 in infrastructure. But thereafter the amount of investment in
this sector started declining.
1997-98
The average investment in infrastructure in 1997-98 was Rs.7,58,752. It
started to increase thereafter showing Rs.12,63,072 in 1998-99 and
Rs.15,00,807 in 1999-2000. But in the fourth year it declined to Rs.13,90,842
Champakulam
555645
Average
758752
Kainakary
403848
Nedumudy
601702
Thakazhy
870449
Edathua
941326
Thalavady
1179539
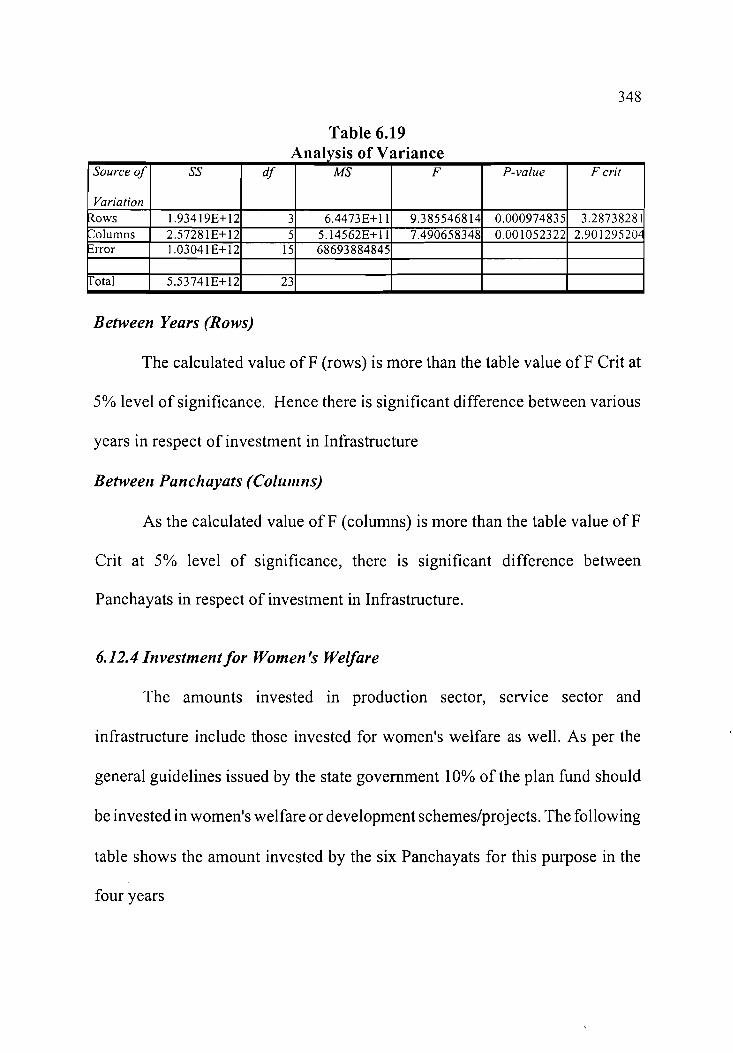
Table 6.19
Between Years (Rows)
Analysis of Variance
The calculated value of F (rows) is more than the table value of F Crit at
Source of
Variation Rows 2olurnns 7
'rror
Total
5% level of significance. Hence there is significant difference between various
years in respect of investment in Infrastructure
Between Panchayats (Coluntns)
F crit
3.2873828 1 2.901295201
SS
1.93419E+12 2.5728 1E+12 1.03041E+12
5.53741E+12
As the calculated value of F (columns) is more than the table value of F
Crit at 5% level of significance, there is significant difference between
df
3 5
15
23
Panchayats in respect of investment in Infrastructure.
6.12.4 In vestment for Women 's Welfare
MS
6.4473E+11 5.14562E+11 68693884845
The amounts invested in production sector, service sector and
infrastructure include those invested for women's welfare as well. As per the
F
9.3855468 14 7.490658348
general guidelines issued by the state government 10% of the plan fund should
P-value
0.000974835 0.001052322
be invested in women's welfare or development schemes/projects. The following
table shows the amount invested by the six Panchayats for this purpose in the
four years

Table 6.20 Investment for Women's Welfare
For Champakulam Panchayat, Rs. 1,99,906 is the lowest amount invested
for women's welfare, which was made in 1999-2000. It invested the highest
amount in 2000-01 which was Rs. 6,56,715.
Kainakary Panchayat also invested the highest amount in this sector in
2000-0 1, which came to Rs.5,11,114. It made the lowest investment in this
sector in 1997-98, the amount being Rs.3,34,144.
Average Champakulam
In Nedumudy Panchayat there was an increase in ,the amounts invested
for women's welfare up to 1999-2000. In the last year it declined slightly.
1
Edathua Panchayat clearly shows a gradual increase year after year in
respect of the investment in women's welfare schemes, the amount ranges from
Rs 2,23,127 in 1997-98 to Rs.7,22,459 in 2000-01.
In the case of Thakazhy Panchayat an annual increase in the amount of
investment is noted up to 1999-2000. In 2000-01 a slight decline is noted.
Kainakary
Thalavady Panchayat didn't spend any amount in 1997-98 for women's
development programmes. But in 1998-99 it spent Rs.6,30,570 for the same. It
Edathua Nedumudy Thakazhy Thalavady

350
also spent Rs.4,53,069 and Rs.5,24,358 in 1999-2000 and 2000-0 1 respectively.
On analysing the average amount invested for women component plan in
different years, it is clearly noted that, there is an increasing trend. The average
amount of Rs 2,75,695 increased gradually in four years to reach Rs.5,90,610 in
2000-0 1.
Table 6.21 Analysis of Variance
Between Years (Rows)
The calculated value of F (rows) is more than the table value of F Crit at
5% level of significance. Hence there is significant difference between various
years in respect of investment in Women's Welfare Schemes
Between Panchayats (Colcintns)
As the calculated value of F (columns) is less than the table value of F
Crit at 5% level of significance, there is no significant difference between
Panchayats in respect of investment in Women's Welfare Schemes
6.12.5 Investment for the Welfare of Scheduled Castes
Panchayats have been given plan grants under special component plan to
make investment for the welfare of scheduled castes. The amount so given

should be utilised only for that purpose. The following table shows the
investment in this sector by the various Panchayats under study.
Table 6.22 Investment for the Welfare of Scheduled Castes
Champakulam Panchayat invested Rs.4,17,448 in 1997-98 for the welfare
of scheduled castes. It increased in 1998-99 followed by a slight decrease in
1999-2000.But in 2000-0 1 an amount of Rs 1 1,86,568 was invested for the same.
In Kainkary Panchayat, the highest amount invested was in the year
1998-99 the amount being Rs.8,73,578. In 1999-2000 it declined to Rs.6,5 1,497,
but in 2000-01 it again showed a slight increase.
In Nedumudy Panchayat no clear trend is noted. There, the highest
amount invested for the welfare of scheduled castes is welfare of scheduled caste
is Rs.13,000,28 in the year 1998-99, the lowest being Rs 8,41,734 in 2000-91.
In Edathua Panchayat the highest amount invested is Rs.10,72,750 in
1999-2000, the lowest being Rs.6,83,885 in 1998-99
Thakazhy Panchayat invested Rs.10,49,369 for the welfare of scheduled

352
castes in 1997-98 which was the highest in that year when compared to the same in
other Panchayats under study. It increased to Rs.12,22,642 in 1998-99. But it started
declining thereafter.
In the case of Thalavady Panchayat the amount invested for the welfare of
scheduled castes ranged from Rs 7,35,752 to Rs 9,03,239.
On a average the amount invested in special component plan was
Rs.7,24,057 in 1997-98 which increased to Rs 9,33,545 in 1998-99. However the
average declined in 1999-2000 and in 2000-01.
Table 6.23 Analysis of Variance
Source of SS df MS F P-value F crir Variation
1.36889E+11 3 45629568886 1.00828 193 0.41638997 1 3.2873828 1 4.83929E+11 5 96785717188 2.138685333 0.1 1665587 2.90129520' 6.78822E+1 I 15 45254772040
Between Years (Rows)
The calculated value of F (rows) is less than the table value of F Crit at 5%
level of significance. Hence there is no significant difference between various years
in respect of investment for the welfare of scheduled castes.
Between Panchayats (Colulnlls)
As the calculated value of F (columns) is less than the table value of F Crit

353
at 5% level of significance, there is no significant difference between Panchayats
in respect of investment in for the welfare of scheduled castes.
6.13 Expenditure Before and During the People's Plan Campaign
A comparative picture of expenditures made by the Panchayats before the
peoples plan campaign and during the campaign will throw light on the extent of
decentralisation and effectiveness of the people's plan campaign. For that a
comparative analysis of the average amounts of expenditure under each head in each
Panchayat from 1990-9 1 to 1996-97 and from 1997-98 to 2000-01 is made. The
table below gives the con~parative picture.

Table : 6.24 Averages : Before and During the Plan

6.13.1 Management Expenditure
Management expenditure includes honorarium, sitting fee and T.A of the
members of Panchayat committee, salaries, allowances and other perquisites of
the employees ofpanchayats, office expenses, establishment charges, stationary,
election expenses and expenses of meetings convened by the Panchayat.
Except in Thalavady Panchayat in all the Panchayats under study the
management expenditure during the people's plan campaign is more than double
the corresponding amount before that. In Thalavady Panchayat also there is a
substantial increase in the average management expenditure from Rs.4,8 1,855
to Rs.9,28,064.
Fig. 6.1 Management Expenditure (Before and During People's Plan Campaign)
0
C hampakulam Kainakary Nedumudy Edathua Thakazhy Thalavady
P anchayats

356
6.13.2 Public Works and Infrastructure
There has been substantial increase in the amount spent for public works
and infrastructure during people's plan campaign as compared to that spent
before the campaign. In Champakulam, Kainakary and Thalavady Panchayats
the average amount invested in public works and infrastructure during the
campaign is more than double the amount invested for the same before the
campaign. In Nedunludy Panchayat and Thakazhy Panchayat, the average
amount during -the people's plan campaign is more than the three times the
average amount before the plan period. In Edathua Panchayat an almost five fold
increase in the amount invested in the public works and infrastructure is noted
during the plan period compared to that of the preceding period. The. following
figure gives the idea at a glance.
Fig. 6.2 Public Works and Infrastructure
(Before and During People's Plan Campaign)
Chaqakulam Kainakary Nedumdy Mathua Thakazhy Thalavady
Panchay ats
I ~ e f o r e N during I
6.13.3 Productive Sector
With People's Plan Campaign in operation, funds have been earmarked
for investment in productive sector like agriculture, fishing, animal husbandry
and cottage industries. Before that there was no such provision and most of the
Panchayats did not spend a single paise in most of the years in the productive
sector.
Edathua Panchayat did not have any investment in this sector in seven
years before the people's plan campaign. However the average annual investment
in productive sector during the plan campaign is Rs. 22,61,811 in Edathua
Panchayat.
For Champakulam Panchayat the average annual investment in productive sector
during the plan period is Rs. 17,48,932 while the corresponding figure before the
said period is only Rs. 1,466. In the case of Kainakary Panchayat the average
annual investment in productive sector rose from Rs. 12,432 to Rs. 18,3 1,202.
Nedumudy, Thakazhy and Thalavady Panchayat also show a sharp
increase in the average annual investment in productive sector

Fig. 6.3 Productive Sector (Before and During People's Plan Campaign)
Chanpakulam Kainakary Nedurmdy Mathua Thakazhy Thalavady
Panchay ats
Before &I during 1
6.13.4 Social Service Sector
Investment in service sector is also encouraged under people's plan
campaign. As Panchayats have to invest between 30 to 40 % of the plan funds
in service sector it is quite natural that the total investment in social service
shows a substantial increase during the people's plan campaign
In Champakulam Panchayat, the average investment in this sector during
the plan period is more than eleven times that of the preceding period. In
Kainakary it is more than 12 times while in Nedumudy it is 10.75 times that of
the proceeding period. In Edathua Panchayat the service sector investment
during the plan period is 10 times that of the period before it while they are 9.09
times in Thakazhy Panchayat and 6.67 times in Thalavady Panchayat.

Fig. 6.4 Social Service (Before and During People's Plan Campaign)
2000000
2 1500000 3
E a ioooooo
500000
0 Chan-pakularn Kainakary Nedumdy Mathua Thakazhy Thalavady
Panchayats
1 C] Before During I
Thus a significantly large increase in the service sector investment has
taken place during the people's plan campaign.
For items like education and culture, Panchayat properties, and debt
heads there has been significant increase in expenditure during the plan period
as compared to that of the proceeding period. But such an increase is not so
substantial as in the case of investment in productive sector, public works and
infrastructure and service sector
Many institutions have been transferred to village Panchayats for their
management along with the required h n d s for the same during the plan period.
Hence there has been considerable increase in the money spent for the
management of institutions during the plan period.

360
Many pensions have been distributed through village Panchayat now.
State goverement started allocating funds to village Panchayats for the same in
1996-97. It is not a part of the people's plan campaign
6.14 Opinion Survey Analysis
For having a clear picture of the finances of Gram Panchayats under
people's plan campaign and to supplement the secondary data analysis an
opinion survey analysis related to the same has been made here. Several
questions were put to the respondents to ascertain their views regarding the
finances under people's plan campaign. The different views are analysed and
presented in tables.
6.14.1 Share of Plan Fund Table 6.25
Among the members of Panchayat majority ie 59% opined that their
Panchayat is not getting the due share of plan fund from the state government 32
% of them are of the view that the Panchayat is getting the due share of plan
Share of Plan Fund
Getting Due share Not getting due share Do not know
Total
Members Employees
Frequency
2 2 41 6
69
Frequency
9 3 -
12
Percentag e
32 5 9 9
100
Percentage
7 5 25
100

36 1
funds. However 9% of the members do not know about the due share of plan
funds. It is to be particularily noted that plan funds are substantially large, and
even among the members of Panchayats who are expected to have a clear idea
about the finance of Panchayats, there are people who have no idea about it.
Majority of the employees have a different opinion. 75% of theill think
that the Panchayat is getting the due share of plan funds. Only 25% of them
think otherwise. Thus there is a wide difference of opinion between the members
and employees of Panchayats in this regard.
6.14.2 Formula for the Allocation of Plan Funds
State government allocates funds to various Panchayats on the basis of a
formula. There is difference of opinion among the members of Panchayats as
well as among the employees regarding the existing formula. It is shown in the
following table.
Table 6.26 Existing Formula for Allocation of Funds
Should be changed Should not be changed Don't know
Total
Members
Frequency
3 4 30 5
69
Employees
Percentag e
50 43 7
100
Frequency
2 10 -
12
Percentage
17 8 3 -
100

3 62
50% of the members think that the formula for the allocation of plan
funds among Panchayats must be changed. Most of them express the opinion
that due weightage should be given not only to population but also to economic
backwardness, social backwardness, inadequacy of infrastructure, number of
unemployed people and area under cultivation in allocating the funds. But
43%of the members are of the view that the existing formula should be
continued. 7% of the member do not have any idea with regard to this.
Among the employees 83% think that the existing formula should be
continued only 17% of them are in favour of changing the fornlula. The
members and the employees of Panchayat widely differ in their opinion in this
regard while 50% of the members are in favour of changing the formula, only
17% of the employees favour that.
6.14.3 Sectoral Allocation
Sectoral allocation of funds has been made under people's plan campaign.
For that three sectors have been identified - productive sector, service sector and
infrastructure. Opinions regarding the sector to which highest proportion of
funds should be allocated are collected and analysed. They are given in the
following table
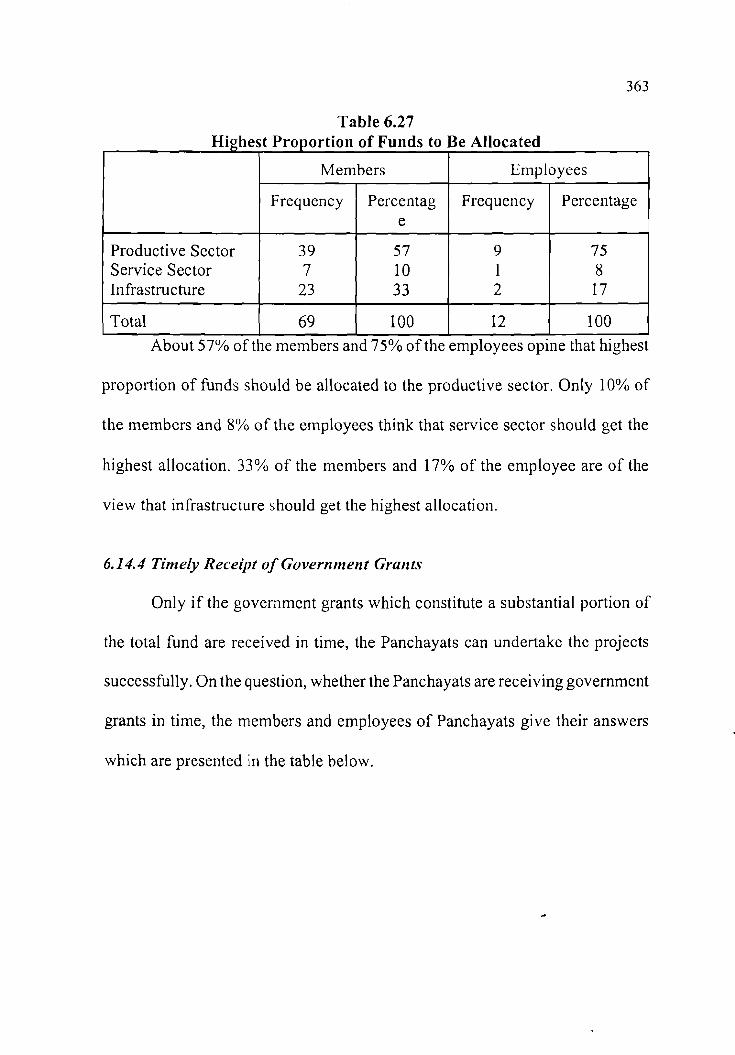
proportion of funds should be allocated to the productive sector. Only looh of
the members and 8% of the employees think that service sector should get the
highest allocation. 33% of the members and 17% of the employee are of the
view that infrastructure should get the highest allocation.
Table 6.27 Highest Proportion of Funds to Be Allocated
6.14.4 Timely Receipt of Government Grants
Only if the government grants which constitute a substantial portion of
.the total fund are received in time, the Panchayats can undertake the projects
successfully. On the question, whether the Panchayats are receiving government
grants in time, the members and employees of Panchayats give their answers
which are presented in the table below.
Productive Sector Service Sector Infrastructure
Total About 57% of the members and 75% of the employees opine that highest
Members
Frequency
39 7
23
69
Employees
Percentag e
57 10 33
100
Frequency
9 1 2
12
Percentage
7 5 8 17
100

Table 6.28 Receipt of Government Grants
I I I
Total 1 69 1 100 1 12 1 100
Members
Received in time Not received in time Do not know
Majority of both categories of respondents think that the Panchayats are
not getting grants -in -aid in time. While 83% of the members hold the view that
the funds are not received in time. 92% of the employees express the same
opinion. Only 17% of the members and 8% of the employees believe that the
grants are received in time.
Employees
Frequency
6.14.5 Broad Guidelines for Sectoral Allocation
Frequency Percentag
12 57 -
The state government has given broad guidelines for sectoral allocation
Percentage
. The following table shows the opinion of the respondents in this regard .
e
17 8 3 -
1 11 -
Table 6.29 Guidelines for Sectoral Allocation
8 92 -
To be continued Should be more flexible Should be more rigid Should be taken away Do not know
Total
Members Employees
Frequency
15 10 3
41 -
69
Frequency
10 1 - 1 -
12
Percentage
22 15 4 59 -
100
Percenta g e
84 8 -
8 -
100
365
While majority of the members of Panchayat (59%) say that the broad
guidelines for sectoral allocation should be taken away, majority of the
employees (84%) state that .the existing broad guidelines must be continued.
Only 22% of the members hold the view that the existing guideline may be
continued 15% of the members and 8% of the employee agree that the guidelines
should be made more flexible 4% of the members only say that it should be
made more rigid.
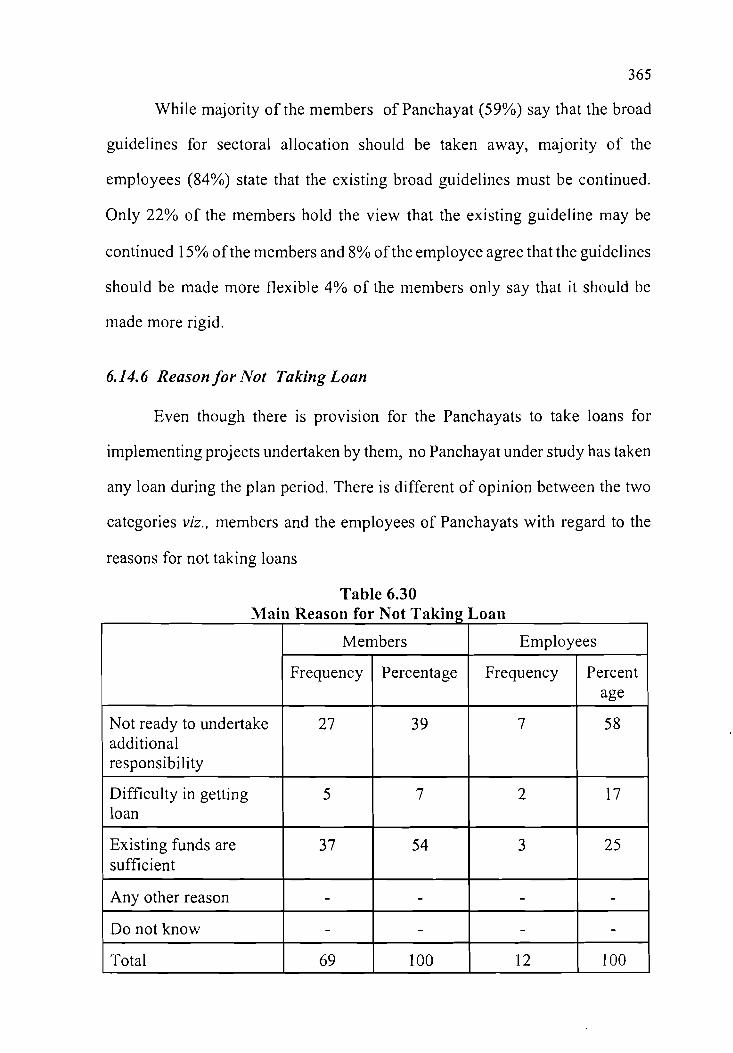
6.14.6 Reason for Not Taking Loan
Even though there is provision for the Panchayats to take loans for
implementing projects undertaken by them, no Panchayat under study has taken
any loan during the plan period. There is different of opinion between the two
categories viz., members and the employees of Panchayats with regard to the
reasons for not taking loans

366
While majority of the members point out that the available funds with the
Panchayats are sufficient to undertake the projects under people's plan campaign,
majority of the employee say that loan's are not taken mainly because nobody
likes to take the additional responsibility connected with the availing of such
loans. Difficulty in getting loans in the main reason for not taking the loan
according to 7% of the members and 17% of employees,
6.14.7 Adequacy of Beneficiary Contribution
Panchayats can collect contributions from the beneficiaries of the
projects undertaken by them. Different Panchayats follow different practices in
receiving beneficiary contribution. This is because of the absence of any hard
and fast rule prescribed in deciding and receiving beneficiary contribution. There
is difference of opinion among the members as well as employees in respect of
the adequacy of beneficiary contribution.
Table 6.31 Adequacy of Beneficiary Contribution
Seventy Four percent of the members of Panchayat are of the view that
Adequate Inadequate Do not know
Total
Members
Frequency
5 1 15 3
69
Employees
Percentag e
74 22 4
100
Frequency
5 7 -
12
Percentage
42 58 -
100

367
the beneficiary contribution in quite adequate. But majority of Panchayat
employee think otherwise. Fifty eight percent of them say that it is made
inadequate and 42% say that it is adequate. Only 22% of the members hold the
view that beneficiary contribution is inadequate. 4% of them don't known about
the adequacy of beneficiary contribution.
6.14.8 Spending of Funds by Beneficiaries
For the implementation of certain projects, funds are directly handed over
to the beneficiaries. Difference of opinion can be noted among the members of
Panchayat and employees with regard to whether the amounts have been spent
for the purpose for which they are given directly to the beneficiaries.
Table 6.32 Spending of Funds by Beneficiaries
Majority of the members as well as employees agree that the beneficiaries
are spending the money for the purpose for which it is given to them. The
Spend for the purpose for which they are given
Spend not for the purpose for which they are given
Do not know
Employees
Frequency
7
4 .
1
12
Members
Percentage
58
3 4
8
100
Frequenc Y
44
16
9
69
Percentage
64
2 3
13
100
368
percentage of members and employees having this view are 64 and 58
respectively. Twenty three percent and thirty four percent of the members and
employees have a negative opinion in this case 9% of the member and 8% of the
employee have no idea at all as to whether the amounts have been spent
properly.
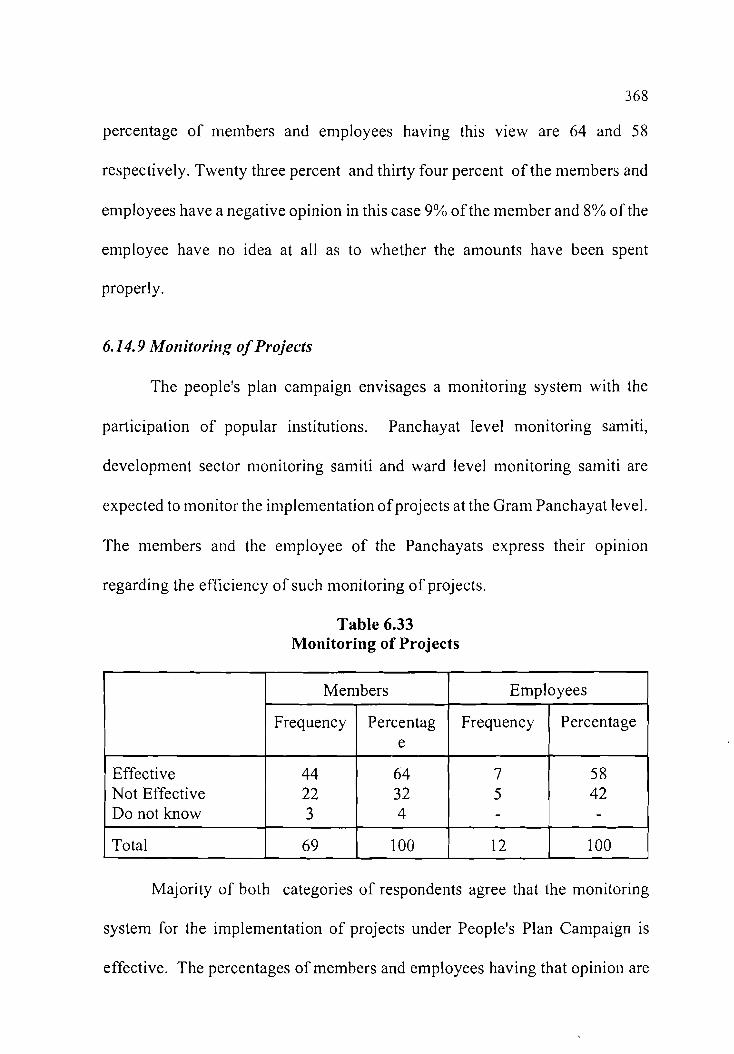
6.14.9 Mon itoritlg of Projects
The people's plan campaign envisages a monitoring system with the
participation of popular institutions. Panchayat level monitoring samiti,
development sector monitoring samiti and ward level monitoring samiti are
expected to monitor the in~plen~entation of projects at the Gram Panchayat level.
The members and the employee of the Panchayats express their opinion
regarding the efficiency of such monitoring of projects.
Table 6.33 Monitoring of Projects
Majority of both categories of respondents agree that the monitoring
system for the implementation of projects under People's Plan Campaign is
effective. The percentages of members and employees having that opinioil are
Effective Not Effective Do not know
Total
Members Employees
Frequency
44 22 3
69
Frequency
7 5 -
12
Percentag e
64 32 4
100
Percentage
58 42 -
100

369
64 and 58 respectively. However 32% of the members and 42% of the
enlployees have a different view. 4% of the members have no idea about the
effectiveness of the monitoring system.
6.14.10 Collectioiz of Own Fund
The own fund of Gram Panchayat consists of taxes and non-tax revenues
such as license fees registration fees other fees other fees and income from
properties. Direct tax and non-tax own revenue are to be collected directly by
the Panchayats. Many have complained .that the additional work load due to
people's plan campaign has adversely affected the own fund collection. The
following table reveals the opinion of the members and employees of Panchayat
is this regard
Table 6.34 Collection of Own Fund
Majority of both categories of respondents - 81% of nlembers and 92%
of employees - state that the additional work load of people's plan campaign has
adversely affected the own fund collection of Panchayats. Nineteen percent of
the members and 8% of the enlployees think it has not affected the collection of
Adversely affected Not affected Do not know
'Total
Members Employees
Frequency
56 13 -
6 9
Frequency
1 1 1 -
12
Percentag e
8 1 19 -
100
Percentage
9 2 8 -
100

own funds
6.15 Conclusion
Kerala's decentralised planning with people's participation at the grass
root level attracted the attention of economist politicians, sociologist and people
at large. Fernandes and Mukhopadhyay pointed out " The strength of the
Panchayats in Kerala derives not necessarily from the foresight of bureaucrats
sitting in Thiruvanthapuram but is consequent to the dynamics of political
mobilization of grass root organization in pressurising the state elected bodies
to make decision making more participatory, democratic and transparent".22
But the significant question here is whether such an initiative ofgrass root
level democracy helps in achieving economic growth and development. The
people's plan campaign makes use of the strength of mass movement to meet the
current needs for economic growth and development. However it is not without
demerits. In some case it has been noted that even the elected representatives of
Panchayat do not have any idea related to certain aspects of financial matters of
their Panchayats. In the case of certain Panchayats large amount of plan funds
remain unspent. Budgeting which can be made a very effective tool in planning
and controlling the affairs of Panchayats is not at all effective. With people's
participation more productive ventures can be undertaken by the Panchayat. For
that loans can be availed from banks, other financial institution and from
co-operative banks. Collection of own find in adversely affected is many

37 1
Panchayats because of the additional work load in connection with the people's
plan campaign.
Despite these limitations in decentralised planning, Kerala is much
ahead of the rest of India in participatory planning. With more powers assigned
to the local bodies and large amounts of funds devolved they can play a vital role
in the development of the area under their jurisdiction. As George Mathew
comments "when democracy is in the hands of ordinary citizen it can conquer
poverty ensure economic growth with equity sustain healthy environment and
work for human right^".^'
People's plan campaign seeks to realise the dream of Mahatma Gandhi.
Prof. Madhu Dantavate's opinion is worth noting here. "Though Gandhiji's
samadhi is in Rajghat, his soul will be with the people of Kerala as they are in
the process of fulfilling his vision and advice".24

372
Notes and References
1,Richard W Franke and Barbare H Chasin, "Power to the Malayalee
people" Economic and Political Weekly, Nov. 29,1997.) p. 3065.
2.P. Kamalkutty, "People's planning- A new venture", Kerala calling
(Public relations department, TVM. Vol. 19, April 1999.p. 10.
3.E. K.Nayanar. "Govt committed to perpetuation of local bodies",
Kerala Calling, Public Relations Department, TVM vol. 19, April 1999, p. 3.
4. V. Rajendran Nair., Empowerment of community through Panchayati
raj institutions: The Kerala experiment", ISDA Journal., TVM July-Dec., 1999
vo1.9. P.263
5.Richard w Franke and Barbare H Chasin. Op. cit., p. 3067
6. I.S. Gulati and K.M Shajahan, People's Planning: Some Thoughts on
Kerala Exercise" Loyola Journal of Social Science, TVM Vol. xi., NO.l
Jan-July 1997.p. 12.
7. V Rajendrean Nair Op. cit., p. 264.
8. V. BijuKumar, In Response to Development Crisis: Decentralised
Planning and Development in Kerala , Journal of Rural Development .,Vol. 19.,
NIRD Hyderabad. p.345.
9. When the plan campaign was launched only five phases were
visualised. Later on a sixth phase was added for the technical and financial
appraisal of projects.
10. Economic Review 2000, Planning Board Government of Kerala, TVM
1 1. Ibid
12. Ibid

13. Ibid
14. V.Rajendran Nair., Op cit. p.274.
15. Richard W Franke and Barbara Chasin., Op cit., p. 306 1 .
16. T. M. Thomas Isaac and K. N. Harilal., Planning for Empowerment
: People's Campaign for Decentralized planning in Kerala. Economic and
Political Weekly. Vol. XXXII., Jan - 4-1 1, 1997., p. 58.
17. Oommmen John, Panchayat Raj At Work in Kerala: An Analysis
Kurukshetra, Oct 1998. p. 43.
18. R, Gopalakrishnan Nair. Peoples Planning in Kerala, Loyola Journal
of Social Science, TVM vo1:xxi. No 1 Jan- July 1997. p.
19. V Rajendran Nair, Op cit. P. 27 1
20. Oommen John., Op cit. P. 43.
2 1. For details, refer Methodology in Chapter I
22. A Fernandes and P. Mukhopadhyay "Re-designing Panchayat finance
and attitudes: A case study of Goa". Journal of Rural Development vol 1. 18(1)
1999. p. 62.
23. George Mathew, Restructuring the Polity, the Panchayat Raj., Loyola
Journal of Social Science , TVM Vol Xi. No1 Jan-July 1997. P. 33.
24. Madhu Dandavate, quoted in R. Gopalakrishnan Nair (editorial).,
Loyola Journal of Social Sciences., Trivandrum., Vol. xi, no. 1. Jan - July.
1997.