Embed Size (px)
Citation preview

Characterisation of the reversible formate
dehydrogenases of Shewanella.
Jonathan Alexander Davies
PhD
University of East Anglia
September 2017
This copy of the thesis has been supplied on condition that anyone who consults it is
understood to recognise that its copyright rests with the author and that use of any
information derived there from must be in accordance with current UK Copyright
Law. In addition, any quotation or extract must include full attribution.
1
Abstract
The reversible action of tungsten or molybdenum-containing formate
dehydrogenase (FDH) enzymes in reducing CO2 to formate has been proposed
for storing renewably produced electricity with concomitant CO2 sequestration.
Previous attempts have highlighted the unfeasibility of using purified enzyme
systems for biotechnological purposes. In response the possibility of using the
exoelectrogenic bacteria Shewanella oneidensis in association with a cathode to
drive intracellular CO2 reduction is proposed. Since the native FDH enzymes of
S.oneidensis have not been previously studied, this work concerns their
characterisation and directionality to inform both on native physiology and
possible future biotechnological applications. This thesis demonstrates that the
native FDH enzymes of S.oneidensis are capable of CO2 reductase activity. Both
forward (Km 39 µM) and reverse (Km 1.43 mM) directions of FDH catalysis in
whole cell cultures are maximal when cultured in the presence of W. When
grown under such conditions, two FDH isoforms (Fdh1αβγ and Fdh2αβγ)
contribute to these activities, with protein purification confirming Fdh2αβγ as a
tungstoenzyme. CO2 reductase activity in S.oneidensis cultures could be driven
by a cathode in simple three electrode electrochemical experiments without
exogenous mediators with high coloumbic efficiency, representing an interesting
paradigm for future inexpensive microbial electrosynthetic study.

2
Acknowledgments
Everyone both at UEA and Schlumberger for supporting me during the last four
years, financially, academically and otherwise, with special thanks to Marcus,
Tom, Julea, David and Seth for guidance and supervision throughout.
My family for shaping and making me who I am today, (Mother, Father, Brother
and Sister), the onus is on you.
Laura for humouring my interests and hobbies, in multiple languages.
Mike for the memories and drinks we shared around the world.
In many ways, to many more people, I just want to say Tak, Obrigado, Gracias,
Gràcies, Спасибо and Thank you.

3
Table of Contents
Abstract ..................................................................................................... 1
Acknowledgments .................................................................................... 2
Table of Contents ..................................................................................... 3
Table of Figures ....................................................................................... 8
Abbreviations ......................................................................................... 11
1 Introduction ..................................................................................... 13
1.1 Formate metabolism .................................................................... 16
1.2 Formate dehydrogenases (FDH) .................................................. 23
1.2.1 Metal independent FDH. ............................................................................... 23
1.2.2 Metal dependent FDH................................................................................... 26
1.3 Shewanella oneidensis ................................................................. 39
1.4 Electrochemical applications ....................................................... 47
1.1.1 Microbial fuel cells (MFCs) ............................................................................ 49
1.1.2 Microbial remediation cells (MRCs) .............................................................. 52
1.1.3 Microbial electrolysis cells (MECs) ................................................................ 52
1.1.4 Microbial electrosynthesis (MES) .................................................................. 53
1.5 Perspective ................................................................................... 60
1.6 References..................................................................................... 60
2 Materials and methods ................................................................... 71
2.1 Buffer preparation ........................................................................ 71
2.2 Minimal media composition ......................................................... 71
2.3 Bacterial strains ........................................................................... 73
2.4 Shewanella growth in minimal media ......................................... 76
2.5 Shewanella growth in LB ............................................................. 76
2.6 Bacterial growth analysis ............................................................ 77

4
2.7 Monod constant determination .................................................... 78
2.8 ICP analysis ................................................................................. 79
2.9 Polymerase chain reaction ........................................................... 79
2.10 Agarose gel electrophoresis ....................................................... 79
2.11 Genomic DNA extraction .......................................................... 80
2.12 RNA extraction.......................................................................... 80
2.13 Reverse Transcription ............................................................... 81
2.14 RT-qPCR.................................................................................... 81
2.15 Cell preparation/quantification for colourimetric assays......... 82
2.16 Cell lysis - Sonication ................................................................ 83
2.17 Membrane separation for enzymatic localisation studies. ....... 83
2.18 BCA assay ................................................................................. 83
2.19 Bradford assay .......................................................................... 84
2.20 FDH activity assay. ................................................................... 84
2.21 CO2 reductase activity assay .................................................... 85
2.22 Fumarate reductase activity assay ........................................... 86
2.23 Specific activity calculations ..................................................... 87
2.24 Enzymatic pH dependence studies ........................................... 87
2.25 NMR .......................................................................................... 88
2.26 Kinetic analysis ......................................................................... 89
2.27 Purification of SO_4513 ............................................................ 89
2.27.1 Growth and lysis ........................................................................................... 89
2.27.2 Cell fractionation and inner-membrane solubilisation. ................................. 90
2.27.3 Anion exchange chromatography ................................................................. 91
2.27.4 Size exclusion chromatography .................................................................... 91
2.27.5 Mass spectrometry – Peptide fingerprinting. ............................................... 92
2.27.6 Acid digestion for ICP-MS protein analysis. .................................................. 93

5
2.27.7 SDS-PAGE ...................................................................................................... 93
2.28 Electrochemical cell design ....................................................... 94
2.29 Bacterial culture for electrochemistry ...................................... 96
2.30 Cyclic voltammetry ................................................................... 97
2.31 Chronoamperometry ................................................................. 97
2.32 First derivative of Cyclic voltammetry traces .......................... 97
2.33 Integration of chronoamperometry data. ................................. 98
2.34 References ................................................................................. 99
3 FDH characterisation in WT Shewanella oneidensis MR-1 in
response to metal supplementation ................................................. 100
3.1 Media optimisation..................................................................... 100
3.2 Determination of Monod constant for formate. ......................... 102
3.3 Growth studies with metal supplementation ............................ 104
3.4 Growth studies with increasing metal supplementation. ......... 107
3.5 FDH gene expression in response to metal supplementation. .. 109
3.6 FDH activity in response to metal supplementation. ............... 110
3.7 Discussion ................................................................................... 112
3.8 References................................................................................... 120
4 Kinetic and protein studies of Shewanella oneidensis MR-1
FDH and CO2 reductase activities .................................................... 123
4.1 Suitability of redox dyes for CO2 reductase assay ..................... 123
4.2 CO2 reductase activity in response to metal supplementation. 124
4.3 Azide inhibition of FDH and CO2 reductase activity. ............... 126
4.4 Confirmation of CO2 reduction to formate by NMR .................. 126
4.5 FDH and CO2 reductase pH dependence ................................... 129
4.6 FDH and CO2 reductase activities in cellular fractions. ........... 130

6
4.7 Kinetic parameters for formate oxidation and CO2 reduction. . 133
4.8 FDH and CO2 reductase activities of S.oneidensis grown in
Lysogeny-broth media. ......................................................................... 136
4.9 Purification of Fdh2α when grown in tungstate supplemented
minimal media. .................................................................................... 138
4.10 ICP-MS analysis of Fdh2α when grown in tungstate
supplemented minimal media. ............................................................ 141
4.11 Attempted purification of Fdh2α when grown in molybdate
supplemented minimal media. ............................................................ 141
4.12 Screening of alternative Shewanella strains for FDH and CO2
reductase activity. ................................................................................ 142
4.13 Discussion ............................................................................... 145
4.13.1 Establishing quantitative FDH and CO2 reductase assays. .......................... 145
4.13.2 FDH and CO2 reductase activities in S.oneidensis MR-1. ............................. 149
4.13.3 Initial purification of FDH and CO2 reductase activities .............................. 152
4.13.4 Native protein purification of Fdh2α. ......................................................... 153
4.13.5 Aspects of FDH and CO2 reductase activities for further investigation ....... 157
4.14 References ............................................................................... 160
5 FDH characterisation in Shewanella oneidensis MR-1 deletion
mutants in response to metal supplementation ............................ 165
5.1 Microbial physiology and formate oxidation.............................. 168
5.1.1 Growth and formate oxidation of triple deletion strain (ΔFDH) .................. 168
5.1.2 Importance of Fdh1 for growth and formate oxidation .............................. 169
5.1.3 Importance of Fdh2 for growth and formate oxidation .............................. 173
5.1.4 Importance of Fdn for growth and formate oxidation ................................ 176
5.1.5 Relative isoform contributions to WT growth and FDH activity .................. 178
5.2 Contribution of FDH isoforms to WT CO2 reductase activity ... 181
5.2.1 Importance of Fdh1 for CO2 reduction ........................................................ 181
5.2.2 Importance of Fdh2 for CO2 reduction ........................................................ 183
5.2.3 Importance of Fdn for CO2 reduction .......................................................... 185

7
5.2.4 Relative isoform contributions to WT CO2 reductase activity ...................... 186
5.3 Kinetics of FDH deletion mutants in lysogeny broth ................ 187
5.4 Discussion ................................................................................... 189
5.4.1 Comparing FDH specific activity and cell growth ........................................ 189
5.4.2 Comparing kinetic parameters for deletion strains .................................... 191
5.4.3 FDH isoform contributions to WT CO2 reductase activity............................ 192
5.4.4 Regulatory role of Fdn under tungstate containing growth........................ 193
5.4.5 Role of Fdn in the absence of tungstate...................................................... 194
5.4.6 Fdh1 significance under both tungstate and molybdate supplementation . 194
5.4.7 Extended lag phase duration ...................................................................... 194
5.4.8 Areas for future research ............................................................................ 195
5.5 References................................................................................... 197
6 Electrode driven reversible S.oneidensis FDH activity ........ 198
6.1 Results ........................................................................................ 204
6.1.1 Electrode driven reversible FDH activity with S.oneidensis and MV. ........... 204
6.1.2 Electrochemically driven non-mediated CO2 reduction by S.oneidensis ...... 208
6.2 Discussion ................................................................................... 214
6.2.1 Mechanistic discussion of non-mediated CO2 reductase activity. ............... 216
6.2.2 Biotechnological development ................................................................... 218
6.3 References................................................................................... 221
7 Discussion ....................................................................................... 225
7.1 References................................................................................... 230

8
Table of Figures
Figure 1-1 Formate linked energy generation/conservation in gram negative bacteria. ................. 17
Figure 1-2 Formate assimilation pathways. .................................................................................... 20
Figure 1-3 FDH regenerating NAD(P)+ in the industrial synthesis of chiral compounds. .............. 24
Figure 1-4 Proposed mechanism for reversible catalysis by Mo/W-bisPGD FDH enzymes. ............ 28
Figure 1-5 Structure of respiratory FDH-N from E.coli. .................................................................. 30
Figure 1-6 Schematic overview of electrochemical study of isolated FDH enzymes. ........................ 37
Figure 1-7 Anaerobic respiratory pathways of S.oneidensis MR-1. ................................................. 41
Figure 1-8 Genetic loci concerning formate metabolism in S.oneidensis MR-1. ............................... 45
Figure 1-9 Schematic overview of bioelectrochemical systems (BESs). ............................................ 48
Table 2-1 Composition of minimal media used in this work........................................................... 72
Table 2-2 Bacterial strains used during this thesis. ........................................................................ 74
Figure 2-1 Example of growth curve analysis. ................................................................................. 77
Table 2-3 PCR primers for SO_1777 fragment used as gDNA marker ............................................ 81
Table 2-4 RT-qPCR primers for cDNA amplification ...................................................................... 82
Figure 2-2 Typical Initial rate (v0) determination for formate oxidation assay. .............................. 85
Figure 2-3 Typical Initial rate (v0) determination for CO2 reduction assay. .................................... 86
Figure 2-4 Schematic of bioreactor used for electrochemical studies. .............................................. 94
Figure 3-1 Aerobic and anaerobic S.oneidensis growth in formate containing minimal media. ... 101
Figure 3-2 Anaerobic S.oneidensis growth in minimal media with sodium formate. .................... 103
Figure 3-3 Anaerobic growth of S.oneidensis with W/ Mo at 3 µM. .............................................. 105
Table 3-1 ICP-MS data after 0 h growth during 3 µM metal supplementation growth studies. .... 105
Table 3-2 ICP-MS data after 24 h growth during 3 µM metal supplementation growth studies. .. 106
Figure 3-4 S.oneidensis growth with increasing molybdate and tungstate concentrations. ........... 108
Table 3-3 ICP-MS data after 0 h growth during 150 µM metal supplementation growth studies. 109
Figure 3-5 Fdh gene expression in response to metal supplementation. ......................................... 110
Figure 3-6 FDH activity in response to metal supplementation in minimal growth media. .......... 111
Figure 4-1 Methyl and benzyl viologen coupled FDH and CO2 reductase activity in S.oneidensis 124
Figure 4-2 FDH and CO2 reductase activities in response to metal supplementation. ................... 125
Figure 4-3 Azide inhibition of FDH and CO2 reductase activities in S.oneidensis cells. ............... 126

9
Figure 4-4 NMR analysis of CO2 reductase assays detecting formate production. ........................ 127
Figure 4-5 pH dependence of FDH and CO2 reductase activities in S.oneidensis. ......................... 130
Figure 4-6 Localisation of fumarate reductase, FDH and CO2 reductase activities. ...................... 132
Figure 4-7 S.oneidensis formate oxidation and CO2 reduction Michaelis-Menten plots. ............... 135
Figure 4-8 FDH and CO2 reductase activities of S.oneidensis grown in Lysogeny-broth media. ... 137
Figure 4-9 Purification of Fdh2α when grown with 3 µM tungstate. ............................................. 140
Figure 4-10 Purification of Fdh2α when grown with 3 µM molybdate. ......................................... 142
Table 4.1 Shewanella strains assayed for FDH and CO2 reductase activities. .............................. 143
Figure 4-11 Analysis of reversible FDH activity in alternative Shewanella strains. ..................... 144
Table 5-1 Details of mutant strains used in Chapter 5 and corresponding genotypes. .................. 166
Figure 5-1 Growth of triple deletion strain ΔFDH in minimal media. .......................................... 168
Figure 5-2 Growth of deletion strains ΔFdh1 and Fdh1+ in minimal media. ............................... 169
Figure 5-3 Relative FDH activities of ΔFdh1 and Fdh1+ compared to WT. ................................. 170
Figure 5-4 Michaelis-Menten plot for formate oxidation in Fdh1+ cells grown +W. ...................... 172
Figure 5-5 Michaelis-Menten plot for formate oxidation in Fdh1+ cells grown +Mo. ................... 172
Figure 5-6 Growth of deletion strains ΔFdh2 and Fdh2+ in minimal media. ............................... 173
Figure 5-7 Relative FDH activities of ΔFdh2 and Fdh2+ compared to WT. ................................. 174
Figure 5-8 Michaelis-Menten plot for formate oxidation in whole Fdh2+ cells grown +W. ............ 175
Figure 5-9 Growth of deletion strains ΔFdn and Fdn+ in minimal media. ................................... 176
Figure 5-10 Relative FDH activities of ΔFdn compared to WT. .................................................... 177
Table 5-2 Collection of kinetic parameters determined for formate oxidation. .............................. 180
Figure 5-11 CO2 reductase activities of ΔFdh1 and Fdh1+........................................................... 182
Figure 5-12 Michaelis-Menten plots for CO2 reduction in whole Fdh1+ cells grown +W. .............. 183
Figure 5-13 CO2 reductase activities of ΔFdh2 and Fdh2+........................................................... 184
Figure 5-14 Michaelis-Menten plot for CO2 reduction in whole Fdh2+ cells grown +W. ............... 185
Figure 5-15 CO2 reductase activities of ΔFdn. .............................................................................. 186
Table 5-3 Collection of kinetic parameters determined for CO2 reduction. .................................... 186
Figure 5-16 FDH and CO2 reductase activities in FDH mutant strains after growth in LB. ........ 188
Figure 6-1 Fundamental concept underlying following electrochemical techniques. ..................... 198
Figure 6-2 Cyclic voltammetry (CV) conceptualisation. ................................................................. 200
Figure 6-3 Non-catalytic electrochemistry and CV traces. ............................................................. 202

10
Figure 6-4 Catalytic (turnover) electrochemistry and CV traces. ................................................... 203
Figure 6-5 Reversible electrochemical FDH activity of S.oneidensis MR-1 with MV. .................... 205
Figure 6-6 Chronoamperometry of S.oneidensis in response to sodium carbonate, MV and azide.208
Figure 6-7 CO2 reductase activity of WT S.oneidensis MR-1, LS527 and lysed WT MR-1 cultures
without exogenously added mediator. ............................................................................................ 209
Figure 6-8 Extended CO2 reductase activity of S.oneidensis MR-1 (+W) after addition of 50 mM
sodium carbonate. .......................................................................................................................... 212
Figure 6-9 Possible mechanisms for CO2 reductase activity at the working electrode (WE)........... 216
Table A1 Collection of growth and kinetic data for deletion mutants in different conditions. ....... 232
Figure A-1 Example NMR traces for analysis of CO2 reductase assays ......................................... 234

11
Abbreviations
ATP – Adenosine triphosphate
ADP – Adenosine diphosphate
BCA - Bicinchoninic acid
BES - Bioelectrochemical systems
CA – Chronoamperometry
cDNA - Complementary DNA
CE – Counter electrode
CoA - Coenzyme A
Ct – Threshold cycle
CV – Cyclic voltammetry
DEAE - Diethyl-aminoethyl
DDM - n-Dodecyl β-D-maltoside
DNA – Deoxyribonucleic acid
dNTP(s) – Deoxynucleotide(s)
DMSO - Dimethyl sulfoxide
DTT – Dithiothreitol
E – Potential (V)
EDTA - Ethylenediaminetetraacetic
acid
EET – Extracellular electron
transfer
EPS - Extracellular polymeric
substances
F - Faraday’s constant
FDH – Formate dehydrogenase
Fdnαβγ - Gene products of
SO_0101-0103
Fdh1αβγ - Gene products of
SO_4509-4511
Fdh2αβγ - Gene products of
SO_4513-4515
FHL – Formate hydrogen lyase
complex
g - Gravitational acceleration
gDNA – Genomic DNA
HDCR – Hydrogen dependent CO2
reductase
HEPES -4-(2-hydroxyethyl)-1-
piperazineethanesulfonic acid
ICP-MS - Inductively coupled
plasma mass spectrometry
kcat – Enzymatic turnover number
Km - Michaelis constant
Ks - Monod constant
LB – Lysogeny broth
LDH – Lactate dehydrogenase

12
MALDI-TOF - Matrix-Assisted
Laser Desorption/Ionization Time of
Flight (Mass Spectrometry)
MEC – Microbial electrolysis cell
MES - 2-(N-Morpholino)
ethanesulfonic acid
MDC – Microbial desalination cell
MFC – Microbial fuel cell
mRNA – Messenger RNA
Mtr – Metal reducing
MQ – Menaquinone
MQH2 - Menaquinol
MV – Methyl Viologen
NAD(P) - Nicotinamide adenine
dinucleotide (phosphate)
NAG -N-Acetylglucosamine
NMR - Nuclear magnetic resonance
spectroscopy
OD – Optical density
PCR – Polymerase chain reaction
PFV – Protein film voltammetry
PGD - Pyranopterin guanine
dinucleotide
pKa - -log10(Ka, acid dissociation
constant)
PMF – Proton motive force
RE – Reference electrode
RNA - Ribonucleic acid
RT-qPCR – Quantitative reverse
transcription PCR
Sarkosyl - Sodium lauroyl
sarcosinate
SD – Standard deviation
SDS-PAGE - Sodium dodecyl
sulphate polyacrylamide gel
electrophoresis
SEM – Standard error of the mean
TAE - Tris-acetate-EDTA
Tris – Tris (hydroxymethyl)
aminomethane
TMAO - Trimethylamine N-oxide
Vmax - Maximal velocity (enzymatic)
WE – Working electrode
WT – Wildtype
+W - Growth with 3 µM tungstate
+Mo - Growth with 3 µM molybdate
+W/+Mo - Growth with 3 µM
tungstate and molybdate
-W/-Mo - Growth with neither
tungstate nor molybdate

13
1 Introduction
The continued depletion of fossil fuels (Goli et al. 2016) and increases in human
population (Gerland et al. 2014) necessitate the development of renewable and
efficient energy solutions to meet soaring demand (Pant et al. 2012). A wide
range of novel technologies is currently being developed alongside more
established methods such as photovoltaic technologies (Panwar et al. 2011). A
pertinent, albeit niche, example includes the use of certain exoelectrogenic
microorganisms, capable of coupling intracellular metabolism to extracellular
electrodes for electricity production in microbial fuel cell (MFC) devices (Franks
& Nevin 2010). A principal concern for many of these technologies however is
that their fluctuating electrical outputs are not storable, leading to a host of
secondary technologies relating to energy storage including the popular
hydrogen economy approach which stores this reductive potential in the form of
hydrogen (Nikolaidis & Poullikkas 2017). However a range of other technologies
are beginning to emerge including those that use carbon based molecules as
energy storage. These have a number of benefits including the fact that many
are non-volatile liquids capable of being stored using existing infrastructure
(Nevin et al. 2011) and when derived from atmospheric carbon dioxide have the
added benefit of being carbon neutral, thereby mitigating associated climate
change effects (Goli et al. 2016). Despite being an attractive proposition the
thermodynamic and kinetic stability of CO2 (Crable et al. 2011) means that the
majority of CO2 fixation is still performed by natural processes (Ducat & Silver
2013).
Biological autotrophic carbon dioxide (CO2) fixation, responsible for the
prehistoric reservoirs of reduced carbon currently used to meet over 80% of the
world’s energy requirements (Ducat & Silver 2013), (and concomitantly
producing 87% of anthropomorphic CO2 emissions (Goli et al. 2016)) is also the
principal contributor to the (re-)sequestration of atmospheric CO2, primarily
through photosynthetic organisms (Armstrong & Hirst 2011). The majority of
such carbon fixation occurs in plants, algae and cyanobacteria via the reductive
pentose phosphate pathway (Calvin cycle) (Ladapo & Whitman 1990) which
relies on the notoriously slow RuBisCO (Ribulose-1,5-bisphosphate
carboxylase/oxygenase) enzyme (< 10s-1) (Maia et al. 2015).

14
Four other pathways, including the reductive tricarboxylic acid (reductive-TCA)
cycle exist for autotrophic growth. These fix CO2 by incorporating inorganic
carbon directly into existing acetyl-coenzyme A (acetyl-CoA) or succinyl-CoA
molecules (Ducat & Silver 2013).
A final fifth alternative pathway for autotrophic growth is via the reductive
acetyl-CoA (Wood Ljungdahl) pathway, in which (for acetogenic bacteria) CO2 is
initially reduced to formate (Ragsdale & Pierce 2008). The single proton, two
electron reduction of CO2 to formate in this pathway represents a simple and
attractive process to be replicated for CO2 fixation to a renewable energy storage
molecule. The accompanying technologies for formate use as a fuel are already
developing with formic acid fuel cells being designed with a view to replace
traditional lithium ion batteries in small portable devices (Lum et al. 2012). In
addition to use as an energy storage solution, formate has also been proposed to
be an effective synthon for the fine chemical industry (Reda et al. 2008).
However in order to be economically viable the reduction of CO2 to formate
requires a catalyst that operates selectively, efficiently, and under mild
conditions (Bachmeier & Armstrong 2015).
Considering the simple underlying chemistry, a variety of chemical catalysis
methods have been suggested for the reduction of CO2 not just to formate but
also methanol or CO (Armstrong & Hirst 2011). Of these, examples of
ruthenium, iron, manganese, and copper based catalysts have been shown to
reduce CO2 electrochemically, but with poor selectivity and requiring large
energy inputs (high overpotentials) (Bassegoda et al. 2014). In a similar manner
chemical electrodes, made of lead, mercury, indium, and thallium are capable of
direct CO2 reduction with high specificity but also require high overpotentials
(Reda et al. 2008).
Considering the limited success of such chemical approaches, recent focus has
returned to biology for inspiration, with extensive study of the family of formate
dehydrogenase (FDH) enzymes that catalyse the reaction for the Wood
Ljungdahl pathway. After several unsuccessful biomimetic chemical approaches
(Groysman & Holm 2007), research has focused on the electrochemical study of
purified enzymes, demonstrating reversible, efficient, selective catalysis under
mild conditions without significant overpotentials (Bassegoda et al. 2014).

15
Despite this success it has been stressed that the described enzymatic systems
are not economically viable or scalable due to the time and costs associated with
enzyme purification and adhesion to an electrode (Armstrong & Hirst 2011). To
resolve these limitations it is proposed here that bacterial species capable of
interacting with electrodes, for example the model exoelectrogen Shewanella
oneidensis MR-1 (Logan 2009), could be used as a self-renewing biocatalyst,
coupling a cathode to the intracellular reduction of CO2 by FDH enzymes within
the protective environment of the bacterial cell, enabling the benefits of the
previously characterised enzymatic catalysis without the need for costly enzyme
purification and with the scope for further chemical transformation using the
genetically tractable metabolic machinery of S.oneidensis (Kane et al. 2013).
Since the biochemistry of the FDH of S.oneidensis has not been previously
studied, questions about their reversibility and native properties are raised,
concerning not just their viability as CO2 reductase enzymes for biotechnology
but also concerning their native function and how they contribute to native
microbial physiology. To sufficiently introduce these aspects, four topics will be
discussed at length below, (A) the metabolism of formate, (B) the relevant FDH
enzymes, (C) An introduction to the relevant physiology of S.oneidensis, and (D)
the potentially relevant biotechnological and electrochemical applications.

16
1.1 Formate metabolism
Formate (HCOO-) plays an important role in a variety of different biological
contexts and a range of organisms, including humans. Despite this the enzymes
responsible for interconversion between formate and CO2, (FDH), are not seen
in higher eukaryotes, restricted to plants and simple eukaryotic organisms such
as yeast and prokaryotic life (Maia et al. 2015). Although FDH are not found in
higher eukaryotes, formate still plays an important biosynthetic role for serine
and nucleic acid metabolism, a role it also plays in plants and many prokaryotes
(Bar-even 2016).
In plants and indeed some species of pathogenic bacteria and fungi, formate has
been implicated in initiating stress responses (Alekseeva et al. 2011). Extensive
research in potato cultivars has revealed the role of FDH as a stress protein in
response to chemical stress, low temperature, drought and ultraviolet light
(Tishkov & Popov 2004), under these conditions FDH expression is thought to be
required to reduce formate and proline accumulation, although the specifics
remain unclear. Concerning stress responses in plants and promising the
generation of more hardy crop strains (Hanson et al. 2000) this area has
received a large amount of academic interest.
The low reduction potential (E0’) of the CO2/HCOO- couple at -0.42 V (vs SHE at
pH 7, 1M formate, CO2 (g) 1atm) (Armstrong & Hirst 2011) makes it well suited
for providing reducing equivalents for reduction of terminal electron acceptors
as part of energy generating respiratory chains or fermentation pathways in
prokaryotic organisms as well as for energy conservation, including the
regeneration of biological reducing agents such as NAD(P)H (Tishkov & Popov
2004). In these contexts FDH catalyses the oxidation of formate to CO2
according to eq. (1.1) below.
𝐻𝐶𝑂𝑂− → 𝐶𝑂2 + 2𝑒− + 𝐻+ (1.1)
When contributing to the respiratory needs of gram negative bacteria, formate
oxidation typically occurs in the periplasm and can be coupled to a wide range of
electron acceptors that typically generate proton motive force (Wang &
Gunsalus 2003) either directly or indirectly.

17
In many such respiratory chains the electrons abstracted from the oxidation of
formate (releasing a proton) in the periplasm are relayed via internal redox
centers of FDH enzymes to the cytoplasm for the reduction of quinones in
quinone/quinol redox pools (removing cytoplasmic protons). As such catalysis
contributes to the establishment of an electrochemical proton gradient across
the inner membrane (Jormakka et al. 2002). Such reduced quinones then
transfer the reducing equivalents to terminal electron acceptors, which may in
turn contribute further to PMF generation as seen in Figure 1-1 (A).
Figure 1-1 Formate linked energy generation/conservation in gram negative bacteria. (A) Overview of a simple redox loop demonstrating the periplasmic oxidation of formate by FDH
coupled to reduction of a quinone pool and subsequent reduction of a terminal electron acceptor,
where the pictured example is cytoplasmically facing as proposed when coupled to nitrate reductase
(Jormakka, S Törnroth, et al. 2002). (B) Overview of FDH in complex with coupled reductase, as
seen for FHL complex for which the associated protein is a hydrogenase enzyme. Both FDH and
coupled protein partner are presented here as cytoplasmically facing as proposed for FHL of E.coli.
(C) Overview of simple FDH enzymes responsible for energy conservation by regeneration of
reduced species such as NADH, presented here in the cytoplasm as has been demonstrated for a
range of organisms including several methylotrophic bacteria and Cupriavidus necator (previously
Ralstonia eutropha) (Maia et al. 2015). In all panels protons contributing to PMF generation are
coloured green.
The canonical example of such a redox loop has been extensively described for
E.coli, linking a FDH, (FDH-N) with a nitrate reductase enzyme, NarGHI.
FDH-N and NarGHI couple to generate proton motive force in a simple redox
loop (Jormakka et al. 2003b), achieved through opposite orientations of the two
enzymes in the inner membrane, seen in Figure 1-1 (A), and linkage through
the menaquinone pool. In this loop formate is first oxidised by FDH-N,
producing CO2 and a single proton in the periplasm, the electrons produced are
shuttled through the redox centres of FDH-N to a cytoplasmic b type heme
where two cytoplasmic protons are utilised in the reduction of menaquinone.
This menaquinol is then free to traverse the membrane until it is oxidised in the

18
menaquinol oxidation site of Nar, releasing the two protons into the periplasm,
finally the electrons from this oxidation shuttle though redox centers in Nar to
be delivered to the cytoplasmic active site where nitrate is reduced to nitrite,
incorporating another two cytoplasmic protons. In summary one such cycle of
this loop removes four cytoplasmic protons and provides three periplasmic
protons, a net contribution of seven per complete cycle (Jormakka et al. 2003b;
Bagramyan & Trchounian 2003).
Other than nitrate, FDH enzymes have been shown to be able to couple to a
wide range of other terminal electron acceptors including nitrite,
trimethylamine N-oxide, dimethyl sulfoxide, sulphate, polysulphide, fumarate,
carbon dioxide, arsenate, Fe3+, oxygen, protons and NAD(P)+ (Maia et al. 2015)
(Wang & Gunsalus 2003).
Not all of these acceptors require intermediary redox pools and indeed not all
are periplasmic and contribute to PMF in the manner described above. For
example certain simple FDH enzymes are cytoplasmic and contribute to energy
conservation simply by coupling formate oxidation to the regeneration of
NAD(P)H, Figure 1-1 (C) (Tishkov & Popov 2004). Others are membrane
associated but simply bypass the need for redox shuttles, instead forming
protein complexes allowing direct electron transfer. The most commonly
recognised complex concerning FDH are formate-hydrogen lyase (FHL)
complexes, where FDH is found in association with a hydrogenase, allowing
formate oxidation to be coupled to proton reduction (Bagramyan & Trchounian
2003), either as a terminal electron acceptor allowing removal of unwanted
reducing equivalents in the form of diffusible hydrogen, as a way of storing
reducing equivalents for later re-oxidation by hydrogenases capable of re-
oxidising dihydrogen or even for detoxifying formate accumulation as described
below. The thermodynamic driving force for this reaction is small, but thought
to be favoured due to the volatility of the products (hydrogen and CO2)
(McDowall et al. 2014).
The most well characterised FHL complex is that of E.coli. A FDH (FDH-H,
hydrogenase associated) is associated with a nickel-iron hydrogenase enzyme
(Rossmann et al. 1991) conceptualised in Figure 1-1 (B). Such a FHL complex is
thought to contribute to energy conservation in a distinct manner to the
previously described periplasmic FDH enzymes, indeed FDH-H is

19
cytoplasmically facing and expressed during mixed fermentation when formate
accumulates in the cytoplasm, the accumulation of such organic acids can
dissipate proton motive force by acidifying the cytoplasm so by removing
formate and protons, FHL is thought to prevent these toxic effects (Bagramyan
& Trchounian 2003).
In actuality two FHL complexes exist in E.coli, both use the same FDH-H
component but differ in the associated hydrogenase. FHL-1 uses Hyd-3 whereas
FHL-2 uses Hyd-4 (Andrews et al. 1997). In both cases the hydrogenase is of the
NiFe variety (Bagramyan & Trchounian 2003). Recently a functional FHL-1
complex has been purified from E.coli which retains FHL activity in vitro
(McDowall et al. 2014) and an arrangement for the component subunits in the
membrane has been suggested with numerous comparisons having been made
to complex one (McDowall et al. 2014). Even more recently this FHL complex
has been shown to be reversible, both in vitro and in vivo, capable of catalysing
the oxidation of hydrogen and reduction of CO2 although only under artificial
conditions and such formate assimilation is not thought to play a role in native
metabolism (Pinske & Sargent 2016). However it has been proposed that such a
system may have allowed pyruvate synthesis before the evolution of the
required glycolytic pathways (McDowall et al. 2014).
Although formate is usually considered an electron donor as described above,
certain metabolic pathways use formate assimilation as a biomass precursor.
They are not numerous however, with a pKa of 3.75, (Maia et al. 2015) formate
tends to be deprotonated, making it a poor electrophile. It is also a poor
nucleophile due to the difficulty in establishing a negative charge on the single
carbon atom. To enable formate assimilation those pathways that do exist either
first activate formate via phosphorylation (at the cost of ATP) or use radical
reaction chemistry.

20
Figure 1-2 Formate assimilation pathways.
(A) Condensation of formate and acetyl-CoA by pyruvate formate lyase (PFL). (B) Activation of
formate by formate-tetrahydrofolate ligase (FTL) and subsequent condensation to methylene-THF.
(C) Overview of Wood-Ljungdahl pathway for acetogenic bacteria with branches contributing
methyl and carbonyl groups for acetyl-CoA formation indicated. (D) Metabolically expensive
(requiring multiple reducing equivalents) serine pathway.
There are two known mechanisms for formate assimilation used for microbial
growth and both use an initial step catalysed by formate-tetrahydrofolate ligase
(FTL) seen in Figure 1-2 (B). FTL catalyses two reactions, the initial
phosphorylation of formate to formyl-phosphate, followed by reaction with
tetrahydrofolate (THF) to form formyl-THF (Bar-even 2016). This electrophilic
molecule is then further converted to methylene-THF. Methylene-THF can then
enter two distinct pathways for formate assimilation, the bacterial Wood-
Ljungdahl pathway, or serine pathway, described below.
The Wood Ljungdahl pathway, or reductive acetyl-CoA (Coenzyme A) pathway
Figure 1-2 (C), is used by both acetogenic (Ragsdale & Pierce 2008) and
methanogenic (Borrel et al. 2016) microorganisms for carbon fixation. In
acetogenic bacteria is it used to make acetate for ATP synthesis, or the fixed
carbon is used for biomass generation. In archaeal methanogens the pathway

21
can also be coupled to methanogensis, thermodynamically more favourable than
acetogenesis (Ragsdale & Pierce 2008).
The pathway can be largely split into two branches, the carboxyl branch, which
provides the carboxyl group for acetyl CoA formation (via reduction of CO2 to
CO) (Figure 1-2) and the methyl branch, which provides a methyl group. The
methyl group in methanogenic archaea is derived from the direct reduction of
CO2 to formyl-methanofuran and so does not involve a formate intermediate
(Borrel et al. 2016), for this reason the methanogenic Wood-Ljungdahl pathway
is not discussed further here. The methyl branch of the acetogenic Wood-
Ljungdahl pathway does involve formate, typically derived from the reduction of
CO2, (by FDH enzymes, discussed subsequently) (Ragsdale & Pierce 2008)
followed by further reductions to formyl-THF, methylene-THF, and then
methyl-THF seen in Figure 1-2 (B + C). The methyl and carboxyl groups are
then combined with CoA to form acetyl-CoA by an acetyl CoA synthase complex
outlined in Figure 1-2. The resultant acetyl-CoA can then be used to generate
ATP via acetogenesis or directed into central metabolism, in acetogenic bacteria
this is predominantly via pyruvate synthase (Bar-even 2016).
The second pathway for formate assimilation is via the serine pathway,
exploiting the same initial reactions as the Wood-Ljungdahl pathway, with the
sequential reduction of formate to methylene-THF, which then joins glycine to
make serine. Serine then cycles through phosphoenolpyruvate, oxaloacetate
and malate, as seen in Figure 1-2 (D), which is combined with CoA to make
malyl-CoA before cleavage to glyoxylate (returns to glycine) and acetyl CoA. The
produced acetyl CoA can then be used for biomass production by entering
central metabolism. Both the glyoxylate shunt (via acetyl-CoA to succinate) or
ethylmalonyl-coA pathways have been shown to support such growth (Bar-even
2016).
The serine and Wood-Ljungdahl pathways are the only known methods of
formate assimilation capable of supporting microbial growth. Other pathways,
including the reductive glycine pathway are capable of assimilating formate, but
this cannot be coupled to growth (Bar-even 2016). Another method of formate
assimilation which has been shown to be theoretically possible, but until
recently not demonstrated experimentally, is the direct reduction of formate and
acetyl-coA to pyruvate by a pyruvate-formate lyase (PFL) enzyme (Figure 1-2

22
A). This enzyme is normally considered to generate ATP from the conversion of
pyruvate to formate and acetyl CoA during anaerobic fermentation but has been
shown to be reversible in vivo in E.coli using a strain unable to assimilate
acetate via the glyoxylate shunt therefore relying on PFL formate fixation
(Zelcbuch et al. 2016).
Although not an example of formate assimilation, it is also worth noting that
formate is capable of serving as the sole carbon source for some organisms by
being oxidised to CO2, generating reducing equivalents that can be used to fix
CO2 by other pathways, for example the well-known Benson-Bassham-Calvin
cycle (Biel & Fomina 2015), 3-hydroxypropionate cycle or the reductive
tricarboxylic acid cycle (reverse Krebs cycle) (Huugler et al. 2005).
Finally formate is also an important metabolite in bacterial syntrophic
interactions, secreted in conjunction with dihydrogen as a way of facilitating
internal redox balancing during a number of fermantaion pathways. These
metabolites are then scavenged by syntrophic partners (Maia et al. 2015) (Kane
et al. 2016).

23
1.2 Formate dehydrogenases (FDH)
1.2.1 Metal independent FDH.
The simplest category of formate dehydrogenase (FDH) enzymes are
characterised by their oxidation of formate coupled to NAD+ reduction, (Figure
1-1 (C)) and so are commonly referred to as NAD+ dependent FDH (EC 1.2.1.2).
Such enzymes are simple single subunit or homodimers lacking complicated
metal cofactors and are found abundantly in a variety of organisms including
aerobic bacteria, yeasts, fungi and plants (Maia et al. 2015). Due to the
simplicity of formate oxidation such enzymes are often used as model enzymes
for studying hydride ion transfer in dehydrogenases and so have been
characterised thoroughly. Considering the lack of redox cofactors, catalysis in
these enzymes is thought to proceed by the enzyme positioning formate and
NAD+ in close proximity and allowing the direct hydride transfer between the
two (Maia et al. 2015).
In plants such metal independent/NAD+ dependent FDHs are mitochondrial
proteins and have been shown to be found in a variety of different species
ranging from English oak (Quercus robur) to potato (Solanum tuberosum)
(Alekseeva et al. 2011). The distinctive feature of plant FDHs is an N-terminal
signal peptide responsible for transport from the cytoplasm into the
mitochondria (Alekseeva et al. 2011). NAD+ dependent FDHs are also found in
methylotrophic microbial species with extended N-terminal proline rich rigid
loop which give rise to a significantly higher thermostability than FDHs from
other sources (Tishkov & Popov 2004).
Industrial applications for these types of NAD+ dependent FDHs are becoming
more commonplace, principally in enzymatic syntheses (Ernst et al. 2005). Due
to increasingly stringent demands for ultra-pure optically active chiral
compounds for pharmaceutical usage, enzymatic systems are being increasingly
turned to due to their extremely high stereospecificity, in particular
dehydrogenases (Tishkov & Popov 2004). However, many of these enzymes use
(costly) NADH as a cofactor making these reactions economically unviable
without a way to regenerate the cofactor, a role in which FDH excels (Figure
1-3) and is already fulfilling in the industrial production of L-leucine for
Degussa (Leuchtenberger et al. 2005).

24
Figure 1-3 FDH regenerating NAD(P)+ in the industrial synthesis of chiral compounds.
From a protein engineering perspective, the plant FDH from Soybean (Glycine
max) (SoyFDH), has garnered particular interest due to its remarkably low
Michaelis constant for both formate (Km = 0.6 mM) and NAD+ (Km = 5.7 µM)
(Alekseeva et al. 2011). All previously studied NAD+ dependent FDHs
demonstrated similar Michaelis constants for formate, (ranging from 3-10 mM)
and NAD+ (ranging from 35-90 µM) in part due to their high degree of homology,
with all sharing at least 55% sequence identity (Tishkov & Popov 2004).
SoyFDH has been a focus of research due to its potential as a enzymatic catalyst
for NADH regeneration in the synthesis of optically active compounds
(Alekseeva et al. 2011) described above.
In a similar manner the higher thermostability of bacterial FDHs make them
attractive for an industrial NADH regenerative role. In particular a FDH of
Pseudomonas sp. 101 is the most thermostable NAD+ dependent FDH
investigated (Tishkov et al. 1993) and is often quoted as a standard by which
other such FDH enzymes are compared. Extensive mechanistic studies and
multiple crystal structures have been solved for this enzyme (Tishkov & Popov
2004). Attempts have been made to change the specificity of such enzymes from
NAD+ to NADP+ to widen their industrial applications, allowing the
regeneration of NADPH in chemical syntheses, important considering the
significantly higher cost of NADPH over NADH (Katzberg et al. 2010).
CO2 reductase activity exhibited by NAD+ dependent FDHs is not normally
considered, principally due to its irrelevance to the normal physiological role of

25
the enzyme and its unfavourable thermodynamics, (the reduction potential of
NAD+ is more positive than that of CO2, (-0.32 V and -0.42 V respectively) (Reda
et al. 2008; Olson et al. 2000), despite this several examples of CO2 reductase
activity by NAD+ dependent FDH enzymes have been reported. The FDH from
Candida boidinii CbFDH is a very well characterised example of a reversible
NAD+ dependent FDH (Slusarczyk et al. 2000) with published values for CO2
reduction substrate-binding affinity and turnover number of 31.28 mM and
0.015/s respectively (Choe et al. 2014). However these rates are still very low
and have prompted research into more efficient enzymes. A recent study found
FDH from Thiobacillus sp. KNK65MA (TsFDH) had a 21 fold higher CO2
reduction turnover number and favoured the reduction over oxidation more
than 85 times more than the previous CbFDH (Choe et al. 2014). This higher
CO2 reductase activity of TsFDH over CbFDH was attributed to the extended C-
terminal end of the protein which interacts with the substrate binding channel
(Choe et al. 2014). CO2 reductase activity has also been seen in NADPH specific
FDHs, where NADPH produced by photosystem one is coupled to the reduction
of CO2 in vivo creating a light driven CO2 fixation mechanism (Ihara et al. 2013).
Although such NAD+ dependent FDH reduction catalysis is interesting, and free
of the complications of oxygen sensitive cofactors, maximal specific activities of
12.2, 9.5, 8.7, and 4.0 mU/mg enzyme at pH 5.5, 6.0, 6.5, and 7.0, were seen for
TsFDH, the fastest of these enzymes, (Choe et al. 2014), importantly still far
lower than those reported for metal dependent FDHs.

26
1.2.2 Metal dependent FDH.
In contrast to the previously discussed FDHs, another group of FDHs exist,
expressed exclusively by prokaryotes (Maia et al. 2015) referred to as metal
dependent FDHs. These FDHs are characterised by formate oxidation at a
metal containing active site. This active site couples, not to NAD+, but to
ferredoxins and/or cytochromes (EC 1.2.2.1) in the catalytic subunit, (Jormakka,
S Törnroth, et al. 2002). Significantly however such enzymes may then
subsequently pass these electrons to other associated proteins/subunits which
reduce protons, quinones or NAD(P)+ (Reda et al. 2008). As such examples of
metal dependent/NAD+ dependent FDH activity can be observed, but these use
NAD+ only as a subsequent electron acceptor.
The metal containing active sites of such FDH enzymes can either coordinate a
mononuclear Mo atom, collectively referred to as Mo-FDH, or a mononuclear W
atom, referred to as W-FDH (Jormakka et al. 2003a). In either case in such FDH
enzymes the metal is coordinated by four sulphur atoms from the cis-dithiolene
groups of two pyranopterin guanine dinucleotide (PGD) cofactors in addition to
two other groups, either a selenium or sulphur atom (from a selenocysteine or
cysteine residue) and an additional terminal sulpho group (Maia et al. 2015).
Such coordination places the Mo-FDH in the dimethyl sulfoxide (DMSO)
reductase family (family III) of molybdoenzymes, characterised by containing a
Mo-bisPGD cofactor (Magalon et al. 2011). Although demonstrating the same
coordination W-FDH are often categorised separately as tungstoenzymes but
collectively with the DMSO reductase family have been referred to as
molybdenum/tungsten-bis pyranopterin guanosine dinucleotide enzymes (Mo/W-
bis PGD) (Maia et al. 2015).
In contrast to the metal independent/NAD+ dependent FDH enzymes the active
site of metal dependent FDH enzymes is thought to directly mediate transfer of
electrons for catalysis, with the redox active site metal cycling between a 6+ and
4+ oxidation state during catalysis (Silva et al. 2011). Other generally conserved
features of the active site include a catalytically essential arginine and histidine
residue in addition to the selenocysteine/cysteine residue contributing to the
metal coordination sphere, although each of these features is discussed further
in the context of individual proteins to avoid ambiguity.

27
Other than the identity of the active site, Mo/W-bis PGD enzymes are a
heterogeneous group of proteins consisting of a variable number of subunits
with a diverse range of redox centers (typically variable numbers of ferredoxins,
but also including flavins and both b and c type hemes). These less conserved
subunits often coordinate electron transfer elements that allow them to fulfil a
range of functions, from membrane associated interaction with quinones to the
regeneration of NADH in the cytoplasm (Jormakka, S Törnroth, et al. 2002)
(Figure 1-1). To use the sub-classification method used to describe DMSO
reductase family molydoenzymes, these can be generalised as those belonging to
the three subunit membrane bound complex iron-sulphur molybdoenzyme
(CISM) group (here the complex iron-sulphur Mo/W-bis PGD (CISMW) group),
or the simpler soluble single subunit variety (Magalon et al. 2011) although not
all studied Mo/W-bis PGD enzymes fall into these categories.
Over the past twenty years multiple reaction mechanisms have been proposed
for Mo/W-bis PGD FDH enzymes. Many of these were based on the resolved
crystal structure of the FDH-H enzyme from E.coli in which a terminal hydroxyl
group, coordinated to the catalytic Mo atom, was proposed to play an important
part in catalysis (Jormakka et al. 2002). Subsequent re-evaluation of the
crystallographic data suggests this ligand to be a terminal sulpho group, as
described above, not just in this enzyme, but in all known W-FDH and Mo-FDH
enzymes (Maia et al. 2017). Other mechanistic suggestions involved the active
role of the widely, but not absolutely, conserved SeCys residue in the two
electron, one proton abstraction from formate to generate CO2 (Maia et al. 2015).
However in light of combined experimental data from a variety of sources an
elegant alternative catalytic mechanism is currently thought to apply to all
known Mo/W-bis PGD FDH enzymes, regardless of the presence of a
selenocysteine residue (Yu et al. 2017). This mechanism suggests a reversible
direct hydride transfer reaction involving the terminal sulpho group as seen in
Figure 1-4 and described below (Niks et al. 2016). In the following description
only the Mo center will be discussed for clarity, but the described mechanism
also applies for W-FDH.

28
Figure 1-4 Proposed mechanism for reversible catalysis by Mo/W-bisPGD FDH enzymes.
Where X represents either the redox active W or Mo atom and Y either a selenium or sulphur atom
(from selenocysteine or cysteine respectively) which complete the hexacoordinate binding sphere of
the catalytic metal with four sulphur ligands from two PGD cofactors and a terminal sulpho group.
This sulpho group can either be deprotonated to act as a hydride acceptor for formate oxidation (A)
or protonated to act as a hydride donor for CO2 reduction (B) (Maia et al. 2016)(Yu et al. 2017).
Hydrogen relating to hydride transfer coloured green in both reactions.
In the proposed mechanism the oxidation state of the metal plays an essential
part in catalysis by determining the protonation state of the sulpho group, the
pKa values for the oxidised and reduced metals being dramatically different.
When the metal is reduced, the protonated group is expected (Mo4+-SH) which is
capable of acting as a hydride donor for CO2 reduction. In contrast when the
metal is oxidised the deprotonated group is expected (Mo6+=S) which is an
effective hyride acceptor for formate oxidation (Maia et al. 2016). The oxidation
state of the active site metal (and therefore direction of catalysis) is influenced
by the remaining redox centers of the protein which can either supply electrons
to reduce the active site (Mo4+-SH) for CO2 reduction or accept them to maintain
the oxidised (Mo6+=S) for formate oxidation (Maia et al. 2016).
To expand, formate oxidation is initiated by formate binding to the oxidised
active site, the conserved arginine and histidine residues thought to correctly
orient the C-H group of formate for effective hydride transfer to the Mo6+=S

29
group, resulting in the reduced Mo4+-SH moiety, catalysis is then completed by
the diffusion of CO2 out of the active site and transfer of two electrons from the
metal centre via other redox centers to re-generate the oxidised Mo6+, which as a
result of the pKa, becomes deprotonated for the next catalytic cycle (Maia et al.
2016).
In contrast CO2 reduction is initiated by CO2 binding to the reduced active site,
the conserved arginine and histidine residues thought to correctly orient the
carbon atom of CO2 for effective hydride transfer from the Mo4+-SH group,
resulting in the oxidised Mo6+=S, catalysis is then completed by the diffusion of
formate out of the active site and reduction of the metal centre by other redox
centers to re-generate Mo4+, which as a result of the pKa, becomes protonated
for the next catalytic cycle (Maia et al. 2016).
This proposed mechanism does not consider the Se atom (from selenocysteine)
or the S atom (of the alternative cysteine residue) to directly contribute to
catalysis, instead having them simply complete a hexa-coordination sphere for
the active site metal (Yu et al. 2017). It is possible this coordination is important
in regulating the reduction potential of the metal or it has also been proposed
this steric hindrance would prevent these enzymes from promiscuously
catalysing oxygen transfer reactions seen by other members of the DMSO
reductase family (Maia et al. 2017). Despite this, it has not been demonstrated
that such a sixth ligand is necessary for catalysis, and may not even be present
in the presence of substrate as suggested by one FDH-H crystal structure
(Raaijmakers & Romao 2006), although considering the energetic burden
required for selenocysteine incorporation it seems likely to have some function.
1.2.2.1 Previously characterised FDH
The most well characterised example of such metal dependent FDHs is FDH-N
from E.coli. With several high resolution crystal structures and numerous
expression studies it is by far the most well characterised FDH of this type and
discussion of common/unique structural elements in other such enzymes is best
done by first describing in turn FDH-N and the other FDHs of E.coli to provide
meaningful comparisons.
FDH-N consists of three subunits, the periplasmic catalytic α subunit containing
a Mo containing active site and a single 4Fe4S cluster, the transmembrane β

30
subunit which contains four more 4Fe4S clusters and the membrane bound γ
cytochrome b subunit (Jormakka et al. 2002) (Figure 1-5). The redox centres of
these three subunits allow electrons from the oxidation of formate in the
periplasm to be passed through the membrane to reduce menaquinone in the
cytoplasm as seen in Figure 1-5 (B) (Sawers 1994). All distances between redox
centers in this schematic are within 14 Å allowing effective electron transfer
(Jormakka et al. 2003b). Although not shown in Figure 1-5, FDH-N crystallises
in a trimer, thought to be physiologically relevant, giving it an overall
mushroom shaped topology in the membrane (Jormakka et al. 2002).
Figure 1-5 Structure of respiratory FDH-N from E.coli.
(A) Surface representation of the heterotrimer with the catalytic α subunit and associated Mo-
bisPDG and 4Fe4S cofactors shown in blue, β subunit and four associated 4Fe4S clusters shown in
orange and γ subunit with associated b type hemes shown in green (in which the redox active iron
is shown in red, coordinated by four nitrogen atoms (dark blue). Also shown are relevant Secysα196,
Hisα197 and Argα446 residues coloured blue. (B) Transfer of electrons during formate oxidation
within FDH-N via redox active Mo atom (light blue) via ferredoxins and cytochromes to
menaquinone (MQ) binding site. Figure made using pymol and PBD file 1KQF.
The α subunit of FDH-N is very similar to those solved for other similar FDHs
including FDH-H from E.coli and DgW-FDH from Desulfovibrio gigas
(Raaijmakers et al. 2002) as well as catalytic subunits from related enzymes

31
including DMSO reductase and periplasmic nitrate reductase (Jormakka, S
Törnroth, et al. 2002).
The redox active Mo metal is coordinated by four sulphur atoms from the two
pterin cofactors in addition to the selenium atom of a selenocysteine residue
(SeCysα196) and a final sixth sulpho ligand. The active site is completed by the
inclusion of His α197, the nitrogen of which had been proposed to abstract the
proton from formate during previous mechanistic models of oxidative catalysis,
and Arg α446 (found at the bottom of the substrate binding pocket) which is
thought to correctly orient formate within the active site (Maia et al. 2015). The
active site itself is found buried in a substrate channel containing multiple
positively charged residues thought to be important for substrate interaction
(Jormakka et al. 2003b). As well as containing the active site this subunit also
contains a [4Fe-4S] cluster, referred to as FeS-0, to which electrons from the
active site are passed (Jormakka et al. 2003a).
The β subunit of FDH-N is principally responsible for electron transfer through
the inner bacterial membrane, a process it achieves using a further 4 [4Fe-4S]
clusters designated FeS1-4, using such notation, electrons pass from the α
subunit to FeS-1 then FeS-4, FeS-2 and finally FeS-3, in likeness to an electrical
wire. Such clusters can be identified genetically from the repeated [4Fe-4S]
cluster binding motif, (CxxCxxCxnCP, or slight variations, where n represents
36-38 residues) (Jormakka et al. 2003b). These type of electron transfer domains
are common among membrane bound oxidoreductases and can also be found in
[NiFe] hydrogenase, succinate dehydrogenase, nitrate reductase and countless
others (Yoch & Carithers 1979). The C terminal end of this subunit includes a
transmembrane helix which anchors it to the membrane allowing it to associate
with the membrane bound γ subunit.
The γ subunit, a membrane bound cytochrome b, consists of 4 transmembrane
helices which coordinate two b type heme groups, the first, heme b (periplasmic)
is located on the periplasmic side of the membrane and receives electrons from
the final FeS cluster in the β subunit, which it then passes onto the second
heme, heme b (cytoplasmic), which can reduce menaquinone directly, with the
menaquinone oriented in close proximity after binding to a histidine residue
(Hisγ169) (Jormakka et al. 2003b). Like the above ferredoxin moieties such

32
hemes are common electron transfer elements with comparable subunits found
in NiFe-hydrogenase, thiosulfate reductase and fumarate reductase enzymes
(Jormakka et al. 2003a).
As well as FDH-N, the genome of E.coli also encodes two other FDH isoenzymes.
The first, FDH-O (formerly FDH-Z), shares the same three subunit composition
as FDH-N, as well as a high degree of sequence homology including the presence
of the selenocysteine residue, with FDH-N antibodies also binding strongly to
FDH-O (Abaibou et al. 1995). FDH-O is in contrast to FDH-N however as it is
expressed aerobically, or more specifically, independently of FNR/ArcA or O2 or
nitrate levels (Abaibou et al. 1995). It is proposed to link the aerobically
expressed nitrate reductase, Nar-Z, in a respiratory loop akin to that explained
for FDH-N allowing E.coli to generate PMF from formate and nitrate whilst the
predominant enzymes for these conditions, FDH-N and Nar-A, are synthesised
(Wang & Gunsalus 2003). Finally there is some evidence that FDH-O can couple
to O2 as a terminal electron acceptor (Abaibou et al. 1995) due to this it is
sometimes called formate oxidase (Sawers 1994). This proposed role has been
reinforced by the finding that FDH-O may form part of a supercomplex
assembly containing FDH with bo3 and bd oxygen reductases (Sousa et al.
2011).
The final FDH of E.coli (FDH-H) forms a FHL catalysing the cytoplasmic
oxidation of formate to CO2 and molecular hydrogen as described previously
(Bagramyan & Trchounian 2003). FDH-H is predominantly thought to be a
single subunit enzyme (Boyington & Gladyshev 1997), although it has been
suggested that hycB, found in the hyc operon of E.coli may have pleiotropic
effects and act as a small additional FDH-H subunit (Bagramyan & Trchounian
2003). Importantly the large main catalytic subunit of FDH-H is very similar to
the α subunit of FDH-N, containing an intrinsic selenocystiene (SeCys140)
coordinating the redox active molybdenum atom in combination with four
sulphur atoms from the two PGD cofactors and another sulphur completing the
coordination sphere as seen from multiple resolved crystal structures
(Boyington & Gladyshev 1997). As seen for FDH-N, the conserved Arg333 and
His141 residues complete the active site and an 4Fe-4S cluster is located in the
same subunit thought to facilitate electron transfer from the active site
(Boyington & Gladyshev 1997).

33
This catalytic subunit of FDH-H is encoded by fdhF, a monocistronic gene that
is supressed by both O2 and nitrate and upregulated by formate (Bagramyan &
Trchounian 2003). This is in line with the reported role of FHL, expressed
during fermentation in E.coli to detoxify formate and neutralise the pH in the
cytoplasm (Bagramyan & Trchounian 2003).
Other than FDH-N and FDH-H of E.coli, the W-FDH of Desulfovibrio gigas is
the only other metal dependent FDH for which a crystal structure has been
resolved (Moura et al. 2004). Composed of two subunits, the large α subunit
resembles the catalytic subunit of FDH-N and FDH-H containing a single 4Fe4S
cluster and a bis-PGD containing active site with catalytically important His159,
and Arg407 and SeCys158 residues, the last being thought to coordinate the W
along with the two PGD cofactors with the final ligand being the
mechanistically vital terminal sulpho group (Raaijmakers et al. 2002). This
FDH differs from FDH-H and FDH-N with the presence of a disulphide bridge
close to the active site on the protein surface, which when reduced widens the
formate cleft allowing catalysis. It has been proposed that the oxidation of such
a disulphide bridge would allow careful regulation under aerobic conditions,
preventing substrate entry, possibly explaining why this FDH is found to not be
irreversibly inactivated by oxygen (Raaijmakers et al. 2002).
Physiologically this enzyme is thought to couple periplasmic formate oxidation
to the reduction of periplasmic c type cytochromes (Raaijmakers et al. 2002) for
PMF generation as is thought to be the case for a number of Desulfovibrio
species. For such sulphate reducing bacteria formate is an important electron
donor and the FDH of this genus have been extensively studied and are
remarkably diverse (Silva et al. 2011). In contrast to the dimeric W-FDH of
D.gigas, D.desulfuricans oxidises formate with a trimeric selenocysteine
containing Mo-FDH (Maia et al. 2015) and D.alaskensis and D.vulgaris both
contain three FDH isoforms. Of these six, four have been studied, a W-FDH
from D.alaskensis, a Mo-FDH from D.vulgaris, and more intriguingly an isoform
from each strain that retains FDH activity when grown with W or Mo (Mota et
al. 2011)(Silva et al. 2011). This ability to incorporate either metal for formate
oxidation is thought to be a result of the environment of such sulphate reducers,
which are likely to experience high sulphide concentrations, conditions that

34
reduce the bioavailability of Mo (Silva et al. 2011), and so the redundancy may
represent a selective advantage.
Despite this, sulphate reducing bacteria are not the only prokaryotes that have
been demonstrated to contain FDH isoforms capable of catalysis with either W
or Mo, for example the selenocysteine containing FDH of the methanogenic
archaea Methanococcus vannielii (Maia et al. 2015) which physiologically
couples to F420, a flavin derived cofactor commonly used in methanogens
(Doddema & Vogels 1978). The Mo-FDH of another methanogen,
Methanobacterium formicium couples to F420 in a similar way (Schauer &
Ferry 1980) and is notable as it lacks a selenocysteine residue, containing
cysteine instead (Maia et al. 2015).
Other examples include the methylotroph Methylobacterium sp. RXM which is
thought to contain only a single metal dependent/NAD+ dependent enzyme that
can incorporate either metal (Maia et al. 2015). The methylotroph
Mycobacterium vaccae is also thought to be able to substitute both metals,
although here a Mo-FDH is favoured (Laukel et al. 2003). Formate oxidation is
critical for a wide range of methylotrophic bacteria (Chistoserdova et al. 2004)
and as such multiple metal-dependent FDH enzymes other than those
mentioned above have been studied including an NAD+ dependent W-FDH of
Methylobacterium extorquens AM1 (Laukel et al. 2003).
In addition to the above, a range of other metal dependent FDH enzymes
thought to physiologically oxidise formate have been studied, including, but not
limited to, the NAD+ dependent Mo-FDHs of Cupriavidus necator (previously
Ralstonia eutropha) (Niks et al. 2016), Methylosinus trichosporium, Cupriavidas
oxalaticus, and Rhodobacter capsulatus, (which all contain cysteine rather than
selenocysteine) (Maia et al. 2015), as well as the preferentially W-FDH enzymes
of Campylobacter jejuni (Smart et al. 2009) and the gram positive Eubacterium
acidaminophilum (Graentzdoerffer et al. 2003).
Whilst several of the above enzymes that physiologically catalyse the oxidation
of formate have been shown to be reversible under non-physiological conditions,
including FHD-H of E.coli (Pinske & Sargent 2016), the NAD+ dependent FDHs
of Pseudomonas oxalaticus (Ruschig et al. 1976) and the FDH of Cupriavidus
necator (FdsABG) (Yu et al. 2017) to name three, many more enzymes have been

35
studied for their physiologically relevant CO2 reductase catalysis and are
explored below.
The most obvious examples are those metal dependent FDH enzymes from
acetogens involved in the first reduction of CO2 to formate in the acetogenic
Wood-Ljungdahl pathway. The first such described enzyme was the
selenocysteine containing, NADP+ dependent, W-FDH from Moorella
thermoacetica, (previously Clostridium thermoaceticum), a model acetogen
(Ragsdale & Pierce 2008). Subsequent examples include the NAD(P)+ dependent
W-FDH enzymes of Clostridium formicoaceticum and Clostridium
carboxidivorans (Maia et al. 2015), and the Mo-FDH of Clostridium
pasteurianum (Liu & Mortenson 1984).
Another Mo-FDH thought to physiologically catalyse CO2 reduction is that of
another acetogen, Acetobacterium woodii, in complex with a hydrogenase
enzyme that catalyses hydrogen oxidation, in effect creating a reverse formate
hydrogen lyase system, referred to as a hydrogen-dependent carbon dioxide
reductase (HDCR) (Schuchmann & Müller 2013).
One of the most well characterised examples of physiologically releveant CO2
reductase activity is by the FDHs of Syntrophobacter fumaroxidans, which
expresses two W-FDHs (de Bok et al. 2003). Both of these enzymes, FDH-1 and
FDH-2, show extremely high levels of CO2 reductase activity, with specific
activities, determined using dithionite-reduced methyl viologen as the electron
donor, of 900 U/mg and 89 U/mg for FDH-1 and FDH-2 respectively (de Bok et
al. 2003) Importantly the two are thought to be functionally distinct.
The first W-FDH, FDH-1 is similar to those described for other acetogenic
bacteria, fixing CO2 for the Wood- Ljungdahl pathway (de Bok et al. 2003) whilst
FDH-2 is implicated in syntrophic interactions. the CO2 reductase activity of
FDH-2 thought to be responsible for removing unwanted reducing equivalents,
in the form of formate, which can then be excreted and oxidised by syntrophic
partners, hydrogen has been described to play a similar role for syntrophic
exchange of reducing equivalents but formate is increasingly recognised as a
common alternative (Stams & Plugge 2009).

36
Both FDH-1, consisting of three subunits, and FDH-2, a heterodimer, have been
purified and have been found to be selenocysteine containing W-FDH enzymes.
Interestingly both required reducing conditions, using dithionite, at all stages
for successful purification (de Bok et al. 2003), a precaution noted for
purification of a number of other W-FDHs from M. thermoacetica and E.
acidaminophilum (de Bok et al. 2003) but not in the case of D. gigas (Almendra
et al. 1999).
In addition, partially reducing conditions were required to assay in vitro
activity both for CO2 reduction using methyl viologen and formate oxidation
using methyl or benzyl viologen (de Bok et al. 2003). When conducting such
assays ‘reactivation’ times of up to 10 minutes with redox dyes were required
before assaying to see maximal rates (de Bok et al. 2003). This may be
attributed to ‘reductive activation’ a relatively well characterised phenomena in
equivalent molybdoenzymes where the reduction of the active site Mo-PGD
cofactor is required for a catalytically active form of an enzyme (Jacques et al.
2014). A phenomena proposed for other DMSO reductase family members
(Fourmond et al. 2008).
The fact that both FDHs of Syntrophobacter fumaroxidans contain W and
exhibit CO2 reductase activity is probably not coincidental, all of the above
examples catalysing physiologically relevant CO2 reduction are W-bis PGD
enzymes rather than Mo-bis PGD, with the exception of those from
C.pasteurianum and A.woodi. From a thermodynamic perspective W-FDH
enzymes, rather than Mo-FDH enzymes, are better suited for reductive catalysis
as although the two metals have very similar chemical and catalytic properties
(Silva et al. 2011), the reduction potential of W4+ is lower than that of Mo4+
(Armstrong & Hirst 2011). Despite this it seems that Mo-FDH enzymes are also
capable of reversible catalysis, as seen in the examples above and even more are
thought to be reversible under non-physiological conditions (Bassegoda et al.
2014).
1.2.2.2 Electrochemical studies of enzymatic CO2 reduction
Prokaryotic metal dependent FDH enzymes from multiple sources have been
investigated in protein film voltammetry (PFV) studies. The fact that these
enzymes physiologically couple to independent redox partners, commonly
quinones, distinct hydrogenase enzymes or nicotinamide adenine dinucleotides
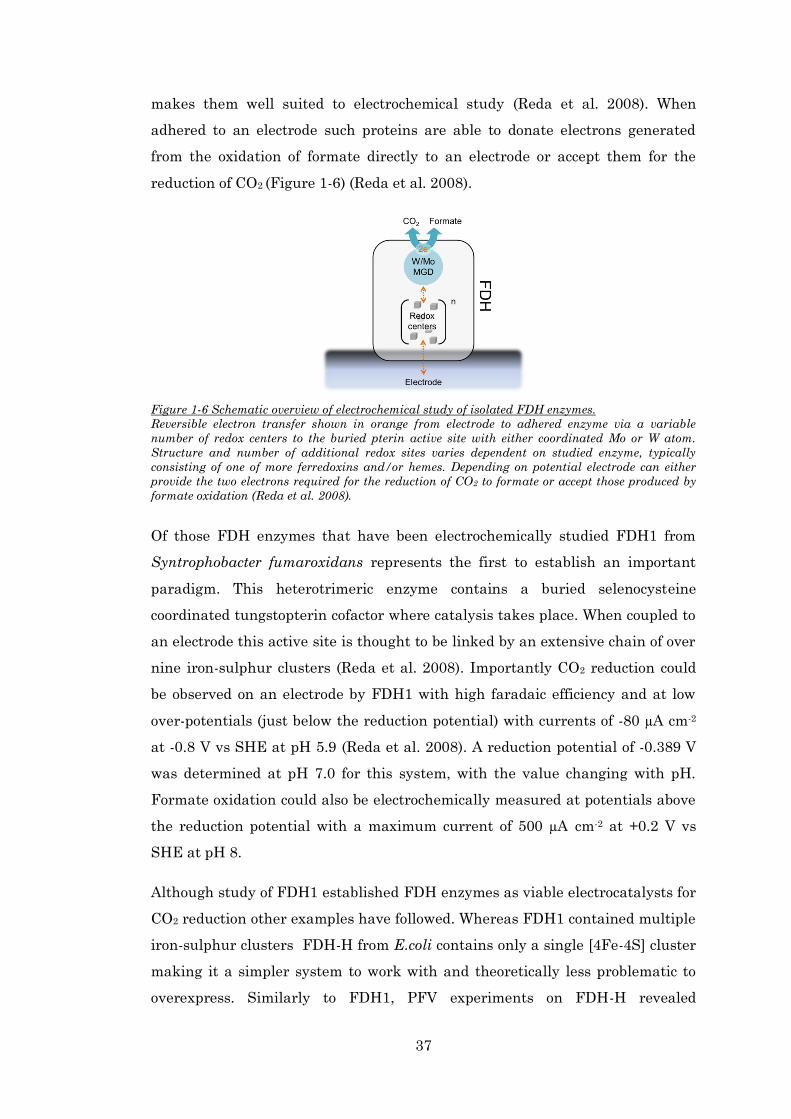
37
makes them well suited to electrochemical study (Reda et al. 2008). When
adhered to an electrode such proteins are able to donate electrons generated
from the oxidation of formate directly to an electrode or accept them for the
reduction of CO2 (Figure 1-6) (Reda et al. 2008).
Figure 1-6 Schematic overview of electrochemical study of isolated FDH enzymes.
Reversible electron transfer shown in orange from electrode to adhered enzyme via a variable
number of redox centers to the buried pterin active site with either coordinated Mo or W atom.
Structure and number of additional redox sites varies dependent on studied enzyme, typically
consisting of one of more ferredoxins and/or hemes. Depending on potential electrode can either
provide the two electrons required for the reduction of CO2 to formate or accept those produced by
formate oxidation (Reda et al. 2008).
Of those FDH enzymes that have been electrochemically studied FDH1 from
Syntrophobacter fumaroxidans represents the first to establish an important
paradigm. This heterotrimeric enzyme contains a buried selenocysteine
coordinated tungstopterin cofactor where catalysis takes place. When coupled to
an electrode this active site is thought to be linked by an extensive chain of over
nine iron-sulphur clusters (Reda et al. 2008). Importantly CO2 reduction could
be observed on an electrode by FDH1 with high faradaic efficiency and at low
over-potentials (just below the reduction potential) with currents of -80 µA cm-2
at -0.8 V vs SHE at pH 5.9 (Reda et al. 2008). A reduction potential of -0.389 V
was determined at pH 7.0 for this system, with the value changing with pH.
Formate oxidation could also be electrochemically measured at potentials above
the reduction potential with a maximum current of 500 µA cm-2 at +0.2 V vs
SHE at pH 8.
Although study of FDH1 established FDH enzymes as viable electrocatalysts for
CO2 reduction other examples have followed. Whereas FDH1 contained multiple
iron-sulphur clusters FDH-H from E.coli contains only a single [4Fe-4S] cluster
making it a simpler system to work with and theoretically less problematic to
overexpress. Similarly to FDH1, PFV experiments on FDH-H revealed
38
reversible FDH catalysis with CO2 reduction observed at low overpotentials
with maximal CO2 reduction rates of -80 µA cm-2 and formate oxidation rates of
180 µA cm-2. Under comparable conditions the the previously studied FDH1,
demonstrated rates of 5 µA cm-2 for CO2 reduction and 160 µA cm-2 for formate
oxidation (Bassegoda et al. 2014). That FDH-H can catalyse these reactions
when coupled to an electrode faster than FDH1, especially the reverse reduction
of CO2, under certain conditions is interesting considering the typical assertion
that W containing FDH enzymes are better suited to driving CO2 reduction due
to their comparatively lower reduction potentials (Crable et al. 2011). The
limitations of FDH1 may lie with the higher number of FeS clusters causing a
bottleneck in electron transfer from an electrode.
The emphasis of this thesis is the reduction of CO2 to formate but it should also
be noted that carbon monoxide dehydrogenase (CODH) enzymes have also been
electrochemically studied for the reduction of CO2 to CO. The Ni containing
CODH I of Carboxydothermus hydrogenoformans has been shown to be an
effective reversible electrocatalyst when adhered to an electrode capable of facile
CO2 reduction at low overpotentials (Parkin et al. 2007). Other examples include
the Ni containing CODH from Moorella thermoacetica which instead of being
performed as a classical PFV experiment used methyl viologen as a mediator to
allow CO2 reduction to CO at potentials below -0.57 vs SHE (Shin et al. 2003).
The use of methyl viologen as an electrochemical mediator for enzymatic CO2
reduction is not new and indeed has been used to show that the FDH of
Pseudomonas oxalaticus could generate formate from CO2 as early as the 1980s
(Parkinson & Weaver 1984). Unfortunately its use as a mediator especially at
high concentrations has been described as undesirable due to its relative cost
and significant toxicity (Suntres 2002).

39
1.3 Shewanella oneidensis
The Shewanella genus encompasses a range of gram negative, facultative
anaerobes in the γ-Proteobacteria class found in a wide range of aquatic
environments including both marine and freshwater sediments or living as
symbionts or epibionts within higher aquatic organisms (Hau & Gralnick 2007).
Named in honour of Dr. James Shewan, the Shewanella genus contains
approximately 40 species capable of using a wide range of terminal electron
acceptors during respiration. These include the reduction of trimethylamine-N-
oxide (TMAO) to trimethylamine, sulphur/polysulphide/sulphite/thiosulphate to
H2S, Dimethylsulphoxide (DMSO) to dimethylsulphide, arsenate to arsenite,
fumarate to succinate, nitrate to nitrite, Fe(III) to Fe(II), Mn(III and IV) to
Mn(II), Although the above have all been shown to support respiratory growth
Shewanella is also able to reduce a wide range of other compounds, including a
range of radioactive and toxic compounds such as uranium (VI), technetium
(99TcVII), plutonium and arsenic (Beliaev et al. 2005) (Hau & Gralnick 2007)
(Fredrickson et al. 2008) (Pinchuk et al. 2011).
In addition to their versatility regarding respiratory substrates Shewanella
species are commonly characterised by their ability to produce omega-3 fatty
acids. The role of these lipids is unclear but they have been suggested to play a
role in respiration, symbiotic relationships with higher organisms, or the ability
for psychrotolerant growth, (i.e. at temperatures below 5oC), another hallmark
of the genus, although the temperature optimum for many species is much
higher (Hau & Gralnick 2007).
Shewanella oneidensis MR-1, isolated from lake Oneida, is the best
characterised Shewanella species, widely used as a model organism for a range
of potential biotechnological purposes, broadly concerning its versatile range of
terminal electron acceptors, which is hoped to be exploited for the
bioremediation of several of the above substrates including U(VI) and (99TcVIII)
for which the reduced forms are insoluble and therefore less likely to
contaminate water sources. In addition S.oneidensis has received considerable
attention due to its ability to use electrodes as terminal electron acceptors as
described in the microbial fuel cell section, in such a context S.oneidensis is
referred to as an exoelectrogen (Logan 2009) and is discussed later.

40
This ability to use a wide range of terminal electron acceptors is in part due to
extensive metabolic and regulatory plasticity. Shewanella oneidensis contains
high numbers of signal transduction proteins, including chemotaxis proteins,
thought to allow exquisite regulation of metabolic pathways in response to
changing environmental factors and available substrates (Fredrickson et al.
2008). S.oneidensis has an extensive and complicated electron transport system,
with 42 c type cytochromes encoded in the genome (Beliaev et al. 2005). Many of
these have unknown function but others are better understood including the
components of the metal reducing (Mtr) pathway (Figure 1-7 (A).
For electrons from internal respiration to be coupled to the reduction of
insoluble extracellular metals such as Fe(III) or Mn (III or IV) the insulating
outer membrane presents a problem. To resolve this, S.oneidensis constitutively
expresses the Mtr pathway, consisting principally of OmcA, MtrC, MtrA, MtrB,
CymA and STC (Coursolle et al. 2010). Two decahaem proteins, MtrA and MtrC,
traverse the outer membrane, orientated by the porin MtrB (Edwards et al.
2015), the heme groups of these proteins are arranged in a chain like
configuration and allow intracellular electrons to shuttle across the membrane,
in likeness to an electrical wire (Davies et al. 2017). This MtrCAB complex
receives electrons from the menaquinone pool, via CymA (and STC) which serve
as intracellular electron transfer elements (Qian et al. 2011). In addition to
these transfer proteins and the MtrCAB complex, another decaheme protein,
OmcA, is also encoded on the same mtr operon, sharing a high degree of
homology to MtrC and thought to act in a similar way as a terminal reductase
for iron reduction (Liang et al. 2009).

41
Figure 1-7 Anaerobic respiratory pathways of S.oneidensis MR-1.
(C) Lactate metabolism when provided as sole electron donor and carbon source. Lactate oxidation
catalysed by lactate dehydrogenase (LDH) and the resultant pyruvate is either cleaved to acetyl-
CoA and formate by pyruvate-formate lyase (PFL) or to acetyl-coA and CO2 by pyruvate
dehydrogenase (PDH). Both pyruvate or acetyl-coA can enter central metabolism for generation of
biomass. Alternatively acetyl-CoA can enter the Pta-AckA pathway (B) where substrate level
phosyphorylation by the combined action of acetate kinase (AcKA) and acetyltransferase (Pta)
contributes to anaerobic ATP synthesis. Formate, produced by PFL is exported into the periplasm
by the formate transporter (FocA) where it is oxidised by FDH enzymes. Resultant electrons are
shuttled to cytoplasmic menaquinone (MQ) reduction sites where they are reduced to menaquinol
(MQH2). This MQ pool couples either directly to terminal reductases (represented in orange) or via
CymA, as seen for the metal reducing pathway (A) couples to extracellular electron acceptors.
Electron transfer occurs via CymA, via STC to the outer membrane cytochromes MtrC and MtrA,
coordinated by the porin MtrB. MtrC and OmcA (not shown) are proposed to transfer electrons via
a variety of mechanisms (see text). Electron transfer shown in orange, formate metabolism in blue
and processes contributing to energy conservation or generation in green.
Considering the ability of S.oneidensis to couple not only to extracellular
minerals but also electrodes, the specifics of extracellular electron transfer
(EET) continue to be the focus of multiple research groups. The described Mtr
pathway has been shown to be important for such interactions, but the direct
interaction of the terminal reductases of the pathway with extracellular
minerals are not the only proposed mechanisms of EET. Other mechanisms
include the role of electron shuttles such as flavins or low molecular weight Fe
complexes which may act to transfer electrons from the cofactors of MtrC and
OmcA to the surface of insoluble mineral/electrode surfaces (Edwards et al.
2015). In addition, outer membrane extensions coated with the terminal

42
reductases MtrC and OmcA have been suggested, called nanowires, in line with
extended conductive structures seen in other iron reducing bacteria such as
Geobacter species (Bond et al. 2012).
In addition to being able to use a wide range of terminal electron acceptors, the
carbon metabolism pathways of S.oneidensis are also remarkably diverse. The
genome of S.oneidensis encodes pathways for the catabolism of multiple organic
acids, fatty acids, amino acids, peptides and nucleotides, with many proposed to
be able to act as sole electron donor and carbon source (Fredrickson et al. 2008).
However not all of these have been experimentally corroborated, with most
experimental studies using the well-established lactate, pyruvate, formate or
hydrogen, or more recently N-acetylglucosamine, (NAG) (the primary
component of chitin) (Kane et al. 2016), when selecting an electron donor for
defined growth studies.
The metabolism of lactate, pyruvate, formate and hydrogen are all intimately
connected in S.oneidensis (Figure 1-7 (C)). Lactate is able to be used as sole
carbon and energy source for both aerobic and anaerobic growth (Pinchuk et al.
2009). Lactate is initially oxidised to pyruvate using membrane-bound lactate
dehydrogenase complexes specific for the L or D isomer (Lld encoded by
SO_1520-1518 and Dld encoded by SO_1521 respectively) with concomitant
reduction of a quinone molecule (Brutinel & Gralnick 2012).
The produced pyruvate is either oxidised by the action of a pyruvate
dehydrogenase (PDH) complex (aceEFG (SO_0424 to SO_0426)) to acetyl CoA
and CO2 with the reduction of a NAD+ molecule, or converted to acetyl CoA and
formate by a pyruvate formate-lyase enzyme (pflB encoded by SO_2912)
(Kouzuma et al. 2015).
At this stage during aerobic respiration acetyl CoA can enter the tricarboxylic
acid (TCA) cycle where it is completely oxidised to CO2 (Kouzuma et al. 2015). In
contrast, during anaerobic respiration the produced acetyl-CoA enters the
phosphotransacetylase-acetate kinase (Pta-AckA) pathway (Figure 1-7 (B)). This
pathway consists of the conversion of acetyl-CoA to acetylphosphate (by
acetyltransferase (pta encoded by SO_2916) and subsequent conversion to
acetate by acetate kinase (ackA encoded by SO_2915). This last substrate-level

43
phosphorylation step is considered the major source of ATP synthesis during
anaerobic respiration (Hunt et al. 2010).
Formate, from the cleavage of pyruvate to formate and acetyl-coA by PFL
during anaerobic respiration in the cytoplasm is transported by a bidirectional
formate transporter (FocA, encoded by SO_2911) into the periplasm where its
oxidation by FDH enzymes (discussed in detail below) is thought to contribute to
proton motive force by driving the reduction of the menaquinone pool (Kane et
al. 2016) (abstracting cytoplasmic protons) in a redox loop with CymA (Marritt
et al. 2012), which is thought to act as a hub diverting electrons to available
terminal electron acceptor pathways including the described Mtr pathway or via
simpler systems such as a periplasmic fumarate reductase (Maier et al. 2003).
Several older publications claim that formate could be used as the sole carbon
and electron source for growth of S.oneidensis (Scott & Nealson 1994). In such
cases it was suggested that formate assimilation would occur by entering the
energetically expensive serine cycle, but more recent bioinformatics approaches
concluded this would not be energetically viable, suggesting the only viable
method of formate assimilation would be via the action of a pyruvate-formate
lyase complex in reverse (Fredrickson et al. 2008), a reaction that has never
been observed to be physiologically relevant in vivo, not just in S.oneidensis, but
any known organism (Bar-even 2016). Indeed it is widely considered that
S.oneidensis is not capable of formate assimilation and the initial observations
were in fact the result of amino acids present in the growth media acting as the
carbon source, whilst formate acted only as electron donor (Fredrickson et al.
2008).
Hydrogen has been shown to be able to act as an electron donor in S.oneidensis
coupled to reduction of both soluble and insoluble terminal electron acceptors
(Liu et al. 2002). In addition, the reverse reaction has also been suggested to
occur in S.oneidensis under anaerobic conditions with the depletion of terminal
electron acceptors (Meshulam-Simon et al. 2007). In such a scenario formate
oxidation has been suggested to couple to proton reduction catalysed by the two
periplasmic hydrogenases of S.oneidensis (Pinchuk et al. 2011). S.oneidensis
encodes both a Fe-Fe, hydrogen producing type hydrogenase (HydAB, encoded
by SO_3920-SO_3926) and a reversible Ni-Fe type (HyaB, encoded by SO_2089
to SO_2099) (Meshulam-Simon et al. 2007).

44
Due to apparent coupling of formate oxidation to proton reduction the presence
of a FHL complex has been proposed in S.oneidensis (Meshulam-Simon et al.
2007). Several papers claim that the presence of an assigned fdh gene in the
middle of the hydAB operon, (SO_3922) is evidence for the existence of a
cotranscribed FHL complex consisting of a FDH and HydAB (Meshulam-Simon
et al. 2007). However the gene product in question bears similarity only to the γ
subunit of known FDH enzymes and is unlikely to catalyse formate oxidation,
more likely acting as an electron transfer element for the hydrogenase complex.
Despite this a periplasmically facing FHL complex in S.oneidensis is still
possible, the described hydrogenases complexing with the FDH enzymes
described in detail below. Alternatively formate oxidation could couple to proton
reduction via the menaquinone pool as suggested by some authors (Serres &
Riley 2006).
The genome of S.oneidensis MR-1 encodes three periplasmic FDH complexes. All
three are heterotrimers similar in topology to the respiratory FDH enzymes of
E.coli, FDH-N and FDH-O, consisting of a catalytic α subunit and β and γ
subunits for subsequent electron transfer from the α subunit. As detailed above
these proteins are thought to act as primary dehydrogenases, contributing to
PMF maintenance across the cytoplasmic membrane and the reduction of the
menaquinone pool (Mordkovich et al. 2013). The three FDH complexes are
encoded by SO_0101-SO_0103, henceforth referred to as Fdnαβγ, SO_4509-
SO_4511 (Fdh1αβγ) and SO_4513-SO_4515 (Fdh2αβγ) as seen in Figure 1-8.

45
Figure 1-8 Genetic loci concerning formate metabolism in S.oneidensis MR-1.
Respiratory heterotrimeric FDH complexes coloured in orange blue and green respectively,
consisting of Mo/W-bis PGD and 4Fe4S binding α catalytic subunit, β subunit coordinating a
further four ferredoxins and a cytochrome b, quinone binding, γ subunit. SO_0988 encodes a further
isolated α catalytic subunit. Bidirectional formate transporter encoded by SO_2911 upstream of
pyruvate formate lyase (PFL) machinery and components of the Pta-AckA pathway (see text).
Remaining genes in grey (excluding SO_2914) thought to be accessory proteins for FDH assembly
or activity. Predicted binding site of transcriptional regulator EtrA shown in yellow.
The first of these FDHs, Fdnαβγ, is encoded by the region SO0101-0103. This is
thought to be orthologous to FDH-N in E.coli (ecFDH-N for clarity), coupling
formate oxidation to nitrate reduction in a respiratory loop, contributing to
PMF, a role supported by microarray data which found the cluster to be
significantly upregulated in response to nitrate (Beliaev et al. 2005). Fdnαβγ
shares a high degree of sequence homology with the equivalent subunits in
ecFDH-N, specifically 63%, 56% and 42% for the α, β and γ subunits
respectively. Importantly the residues responsible for binding of the catalytic
Mo/W-bis PGD and 4Fe4S cofactors in the α subunit are also found, in addition
to those for binding of four further ferredoxins in the β subunit and two b type
heme groups in the γ subunit. The fdnαβγ genes lie directly upstream of the
accessory proteins encoded by 0101-0108, of which SO_0104 and SO_0107 are
thought to encode homologs of FdhE (Lüke et al. 2008) and FdhD (Schlindwein
et al. 1990) in E.coli, responsible for correct Fdnαβγ maturation and assembly.
SO_0105 and SO_0106 encode the proteins SelA and SelB required for the
incorporation of the selenocysteine residue predicted by a UGA codon in the
catalytic Fdnα subunit (Axley et al. 1991).

46
The other two respiratory FDH complexes, Fdh1αβγ and Fdh2αβγ, are thought
to have resulted from an ancestral gene duplication event (Kane et al. 2016)
and are found together in the genome. Indeed at the amino acid level the α
subunits (74% identical, 85% similar), β subunits (88% identical, 94% similar)
and γ subunits (54% identical, 70% similar) are highly conserved. Like the
Fdnαβγ isoform the α subunits are predicted to contain both a catalytically
important Mo/W-bis PGD and 4Fe4S cofactor. Likewise the β subunits are
predicted to bind a further four ferredoxins and the γ subunit to contain two b
type hemes and a quinone binding site. Indeed the only distinguishing feature of
these isoforms is the lack of the selenocysteine residue predicted in the Fdn
isoform, replaced in these enzymes by a cysteine residue (Cys193 in both
proteins). In a genetic context Fdh1αβγ is preceded by the genes SO_4504 to
4508, these are accessory proteins of unknown function. Notably a homolog of
one of these, the small tat sequence containing protein (FdhX) encoded by
SO_4508, also proceeds Fdh2αβγ in the form of SO_4512.
Despite the predicted similarities between the two isoforms Fdh1αβγ and
Fdh2αβγ it has been suggested they are under distinct regulatory control,
primarily due to the presence of a binding site (ACTGTTCTAGATCAAA) for the
transcriptional regulator EtrA upstream of SO_4512 (Figure 1-8). This is
supported by study of an EtrA deletion strain, in which SO_4512-4515 (Fdh2)
expression was repressed and SO_4508-4511 (Fdh1) expression, in contrast, was
not (Cruz-García et al. 2011). The transcriptional regulator EtrA (electron
transport regulator protein) is thought to play a comparable role to Fnr
(fumarate and nitrate reduction regulator) in E.coli, sharing 73% amino acid
sequence identity and restoring wild type physiology to an E.coli fnr deletion
mutant (Cruz-García et al. 2011). Both are thought to act as transcription
regulators in response to the presence of oxygen, but whilst Fnr is considered
absolutely essential for anaerobic respiration in E.coli (Gao et al. 2010) the
analogous EtrA in S.oneidensis is instead thought to fine tune metabolic
responses, the alternative global regulator CRP (cyclic-AMP receptor protein)
adopting many of the functions of Fnr in E.coli and being essential for anaerobic
growth (Gao et al. 2010).
Other than the three heterotrimeric FDH complexes described above the
genome of S.oneidensis also encodes a single orphaned FDH α subunit encoded

47
by SO_0988 predicted to contain both Mo/W-bis PGD and 4Fe4S cofactors. In
contrast to the other described α subunits SO_0988 does not contain a tat
binding sequence suggesting it remains within the cytoplasm. However the
inability of a deletion strain lacking the three respiratory isoforms (Fdnαβγ,
Fdh1αβγ and Fdh2αβγ) to grow suggests SO_0988 alone is not capable of
substituting for their activity (Kane et al. 2016).
1.4 Electrochemical applications
Electrochemistry is used to study exoelectrogenic bacteria (such as Shewanella)
in a variety of different contexts, from fundamental academic research that
characterises and explores the native microbial physiology to industrially
focussed biotechnologies that exploit the interactions of these bacteria with
electrodes. Of course the two areas are fundamentally connected, with better
understanding of the physiological processes allowing improvements to
biotechnological designs and biotechnological applications resulting in increased
academic research spending.
One principal area of academic research is elucidating how electrogenic bacteria
are able to interact with electrodes, allowing for future improvements of
biotechnologies that exploit them. Three principal mechanisms have been
suggested, direct electron transfer from the bacteria to electrodes via dedicated
cytochrome proteins on the cell surface (Richardson et al. 2012), transfer
through conductive nanowires (Kumar et al. 2015) and via mediators, either
exogenous or those produced by the cell (Marsili et al. 2008), illustrated in
Figure 1-9 and previously discussed in the context of S.oneidensis.
When discussing biotechnologies relating to electrogenic bacteria the term
bioelectrochemical systems (BESs) is frequently used (Pant et al. 2012). BESs
encompass a wide range of emergent technologies that share a common
paradigm. In all such systems bacteria exploit exogenous electrodes as either
electron acceptors or electron donors, coupling them to their internal
metabolism (Figure 1-9).

48
Figure 1-9 Schematic overview of bioelectrochemical systems (BESs).
BESs can include either an anodic compartment (left) a cathodic compartment (right) or both,
separated by an ion permeable exchange membrane (dashed black lines). In the anodic
compartment of a BES, exoelectrogenic bacteria use extracellular electrodes as electron acceptors
coupled to internal catabolism to generate electrical current. The cathodic compartment can either
be abiotic (B), as in MFC devices, or biotic (A) where exoelectrogenic bacteria accept reducing
equivalents from a cathode for intracellular reduction reactions. Also shown in orange are the three
commonly accepted modes of electron transfer from electrogenic bacteria to electrodes (1) Direct
electron transfer, (2) Transfer through conductive nanowires (3) Mediated electron transfer,
although these mechanisms are thought to overlap, see text.
Although this underlying principle is relatively simple, the permutations and
applications are varied. The most common BESs are microbial fuel cells (MFCs)
in which electrogenic bacteria transfer electrons generated from their
intracellular catabolism to an extracellular electrode, generating an electrical
current (Logan et al. 2006). Microbial electrolysis cells (MECs) expand on this
premise, coupling the current produced in the biotic anodic compartment to
reduce protons in a connected cathodic compartment (Kadier et al. 2016).
Microbial electrosynthesis (MES) focuses solely on the cathodic compartment
and concerns the use of a cathode to drive intracellular reductive metabolism to
products of commercial value (Rabaey & Rozendal 2010). An overview of these
concepts is seen in Figure 1-9 but a detailed exploration of each in addition to
other more niche applications using the same principles follow.

49
1.1.1 Microbial fuel cells (MFCs)
The concept of microbial electricity generation, the fundamental concept behind
microbial fuel cells (MFCs) has been studied sporadically for over a century
(Potter 1911), with the first commercial patent filed in 1967 by John Davis
(Pant et al. 2012). Despite this history it is only in the last few decades that
research in this area has intensified in response to a growing need for
environmentally sustainable energy sources (Lovley & Nevin 2011).
As outlined above and in Figure 1-9, MFCs operate due to bacterial colonisation
of an anode, which acts as a terminal electron acceptor, accepting electrons
generated from intracellular oxidation reactions, principally catabolism of a
range of organic molecules to CO2 (Yi-chi et al. 2015). The bioenergetics of this
process is sufficient to support the respiratory needs of these microbes and when
connected to a distinct cathode, a continuous current can be produced from the
self-sustaining bacterial culture, requiring only a continued source of oxidisable
substrates (Logan et al. 2006).
The flow of electrons from the anode to cathode requires charge balance and so
many MFCs include ion permeable exchange membranes to allow cations in the
anolyte to migrate to the cathode as seen in Figure 1-9 (Rahimnejad et al. 2014).
The cathodic compartment coupled to the biotic anode in a MFC was classically
aerobic, allowing the abiotic reduction of oxygen to water at the cathode surface
(Bullen et al. 2006). However subsequent variations have demonstrated a
variety of other molecules that can accept the electrodes at the cathode,
including ferricyanide, nitrate or sulphate with others providing the basis for
other BESs, including MECs, MES systems, and microbial remediation cells
(MRCs), which are discussed subsequently (Wang & Ren 2013).
The first MFC examples used defined substrates, principally acetate, glucose or
other simple substrates in the anodic compartment. To make them economically
attractive they have since been demonstrated to function with a wide range of
different waste waters, from a range of industrial and domestic sources,
allowing the partial decomposition of organic waste and simultaneous energy
production. More ambitious devices also incorporate polymer degrading bacteria
in combination with electrogenic bacteria, the polymer degraders breaking down

50
polymers into simple molecules that electrogenic bacteria can couple to
electricity production (Wang & Ren 2013).
Of all the BESs, MFCs are the most well established, and significant advances
have been made in many aspects of their design. Of these the most significant
are the development of single chamber MFCs with an air cathode that bypass
the need for the costly cation exchange membranes that prevented many
previous iterations being economically viable (Pant et al. 2012). The use of
multiple stacked MFCs in series or parallel has also allowed significant
increases in both voltage and current (another shortcoming of early devices), as
well as increased substrate oxidation (Aelterman et al. 2006). Other
developments such as tubular MFCs, with improved flow to reduce resistance
and various other improvements have culminated in a significant increase in
the power output of these devices. A previous study concluded that MFCs would
need to produce more than 0.5 kW/m3 to be commercially and environmentally
viable (Pant et al. 2012), Current laboratory scale MFCs have been shown to
produce 2.87 kW/m3 of power (Wang & Ren 2013), making their future use
promising.
Despite the significant improvements to MFC devices, several issues and
considerations remain, successful scaling of these technologies to an industrial
level being the most concerning. It has been repeatedly shown that the
maximum power density generated by a MFC is not proportional to the surface
area of the anode (Pant et al. 2012)(Logan et al. 2006), suggesting the power
outputs seen for small laboratory scale experiments extrapolated to larger scales
may be optimistic. In addition to issues with scaling, MFCs must prove
themselves to be viable in comparison with other competing technologies, for
example anaerobic digesters, and so the need for further improvements to these
technologies still exists.
Improvements to MFC design, including those discussed above typically use
electrochemistry as a quantative way of studying various design elements
(Menicucci et al. 2006) including choice of anode material, (Hindatu et al. 2017)
the nature of the coupled cathode (Franks & Nevin 2010), and other material or
electrical component improvements (Logan et al. 2006).

51
Electrochemistry is also used to study those aspects of the MFC relating to the
bacteria themselves and ways to exploit existing physiological responses to
promote power generation (Logan 2009). Study of microbe-anode interactions is
a common area of study with a variety of perspectives including those
studying/optimising the relevant biochemical, microbiological and material
aspects. For recent reviews of these aspects see (Santoro et al. 2017), (Kumar et
al. 2015) and (Hindatu et al. 2017) respectively.
All of these approaches however use electrochemistry to ultimately assess the
improvements made by their investigations, typically quoted as maximum
power outputs (Yi-chi et al. 2015) or in the case of more fundamental research
by more refined cyclic voltammetry or chronoamperometry data.
Although many envisage the future of MFCs as intrinsically linked to waste
water treatment a variety of other applications for MFC exist, with some in
current, albeit niche, commercial use. For example, sediment MFCs, (also
referred to as benthic MFCs) exploit the natural potential difference on the
ocean floor, the anode is embedded in the anoxic sediment capable of supporting
bacterial growth and the cathode in the oxic seawater above, allowing current
generation for marine sensors, with a number of successful long term tests
having already been carried out (Franks & Nevin 2010).
Other variations include microbial solar cells, which add a layer of complexity to
existing MFC designs by having the substrates used by electrogenic bacteria
being provided by photosynthesis by either plants, photoautotrophic bacteria or
algae in situ (Strik et al. 2011).
Another use for MFCs exploits the potential difference between anode and
cathode to drive water desalination in microbial desalination cells (MDCs). At
their simplest, these devices resemble MFCs with an extra third compartment
between anodic and cathodic compartments, as current flows from anode to
cathode, anions (including Cl-) in the central chamber migrate to the anode and
cations (including Na+) migrate to the cathode through anion and cation
exchange membranes respectively to balance the transferred charge, as a result
the central compartment becomes desalinated (Saeed et al. 2015).

52
1.1.2 Microbial remediation cells (MRCs)
The ability of BES’s to oxidise or reduce a range of compounds has already been
alluded to. In the case of MFCs, the removal of organic waste from wastewater
is a convenient benefit to what is primarily a means of producing energy,
however in certain cases the bioremediation effects of such devices can be of
more significance than their energy production.
A principal example of such bioremediation is for decolourisation of dyes from
the textile industry. The dye Congo red has been effectively degraded in BESs
devices with concomitant current production and the toxic azo dyes have also
been shown to be detoxified both by oxidation and reduction in the anodic and
cathodic chambers of BES’s respectively (Pant et al. 2012).
The use of microbial remediation devices has also been used to accelerate
subsurface bioremediation. By coupling an aerobic cathode on the surface to an
anode in contaminated area the oxidation of petroleum contaminants and diesel,
ethanol, 1,2-dichloroethane and pyridine have been shown to be dramatically
accelerated (Wang & Ren 2013). This concept can also be extended to waste
water treatment, which although not able to produce electrical current has been
shown to improve wastewater treatment processes in a procedure referred to as
microbial electrochemical snorkelling (Erable et al. 2011).
In contrast to the above anodic remediation devices a poised cathode can also be
colonised for bioremediation, both in the environment and in dedicated MRC
devices, the reduction of chlorinated solvents, perchlorate (Wang & Ren 2013),
chromium, uranium (Cheng et al. 2012) as well as denitrification (Rabaey &
Rozendal 2010) have all been shown.
1.1.3 Microbial electrolysis cells (MECs)
First conceived in 2005, microbial electrolysis cells are an extension of MFC
technologies. The electrons generated from the microbial decomposition of
organic substrates in the anodic compartment are not used to generate electrical
power, but instead are combined with the additional voltage required to drive
proton reduction to dihydrogen at the cathode, with a view to use hydrogen as a
renewable energy source (Pant et al. 2012). In earlier devices this extra voltage
had to be externally provided, but recent versions exploit complex reverse

53
electrodialysis techniques to prevent external input of power (Kadier et al.
2016). As with their parent MFC predecessors, the ion exchange membrane
components proved limiting and the development of membrane-less MEC
devices has allowed higher hydrogen production, although a common drawback
is the generation of methane by methanogens. Although this generation of
methane is largely seen as a hindrance it has recently also been considered as a
fuel in its own right, as described in the microbial electrosynthesis discussion
below (Eerten-jansen et al. 2012).
1.1.4 Microbial electrosynthesis (MES)
The term microbial electrosynthesis was first used in 2010 to refer to the
reduction of CO2 to multi carbon compounds by microbes on a cathode but has
since been widely expanded and redefined as any microbial synthesis of
chemical compounds in electrochemical cells, (Rabaey & Rozendal 2010) thus
accounting for the wide range of transformations possible using BESs.
Using the above definition the above MEC devices would fall under this
classification as the hydrogen synthesis at the chemical cathode is microbially
driven at the anode (Hasany et al. 2016). More varied applications become
available however when the cathode is also colonised, allowing access to the full
diversity of reductive microbial metabolism.
The use of a bacterial community catalysing a reductive transformation using
electrons from a cathode is an attractive prospect for a number of reasons.
Primarily biocathodes are favoured over conventional chemical alternatives due
to their relatively cheap cost and potential to self-regenerate in addition to their
ability to act as biocatalysts for a wide range of substrates, allowing both
bioremediation or synthesis of a range of value-added chemicals (Sharma et al.
2014) and as such study in this field has intensified in the last decade.
The supply of electrons from a cathode to influence microbial metabolism can
have a diverse range of uses as explored below, it can be used to drive and
exploit respiration or influence the flux of metabolites in fermentation pathways
to drive production of useful metabolites, a process referred to as
electrofermentation (Sharma et al. 2014). Electrofermentation has already been
used to demonstrate the effective production of L-glutamic acid and other

54
research hopes to drive production of butanol and ethanol (Rabaey & Rozendal
2010).
The first microbial electrosynthetic reactions concerned the reduction of CO2 to
small organic molecules, principally acetate, that could potentially be used as
renewable energy sources, these transformations being particularly attractive
considering the concomitant removal of CO2 and fuel production. This area has
remained a focus of the field, with the biocathodic reduction of CO2 being used to
produce acetate, methane, syngas, hydrogen, ethylene, methanol, dimethyl
ether and urea with varying degrees of success (Sadhukhan et al. 2016). Of
these the most promising remain acetate and methane and are discussed in turn
below.
The reduction of CO2 to acetate by acetogenic bacteria has remained a focus of
many research groups since the first demonstration by cultures of Sporomusa
ovata capable of generating acetate, and small quantities of 2-oxobutyrate, from
a cathode and CO2 alone (Nevin et al. 2010). Physiologically acetogenic bacteria
naturally produce acetate using hydrogen as an electron donor, but a wide range
of organisms including various Clostridia species and Sporomusa species appear
able to use a cathode to provide these reducing equivalents (Wang & Ren 2013).
The reduction of CO2 to methane by methanoogenic bacteria is also of
considerable interest, as previously mentioned the generation of methane in
MECs was considered problematic, but recently a number of research groups
have focused on optimising methane generation at a cathode surface as an
alternative fuel source in a process known as electromethanogensis
(Sadhukhan et al. 2016). Electromethanogensis has since been shown in pure
cultures of the archaeon Methanobacterium palustre with high efficiency (Cheng
et al. 2009). However the production of methane is not ideal, methane itself is a
potent greenhouse gas, indeed per molecule, it absorbs infrared radiation much
more strongly than carbon dioxide (Lashof & Ahuja 1990). This problem is
compounded by issues with methane being gaseous which raises issues with
transportation infrastructure, indeed leakage is already a considerable issue
(Alvarez et al. 2012).
Considering some of the issues with acetate or methane as fuels many research
groups have retained the focus on renewable fuel sources but instead have

55
addressed the generation of more complex fuel molecules, often using simple
organic molecules such as pyruvate, formate, acetyl-coenzyme A, acetate or
methane as building blocks (Khosravanipour et al. 2017). Considerable work
has been invested in the transformation of acetate to ethanol using microbial
electrosynthesis, (Rabaey & Rozendal 2010) with current examples requiring
the use of mediators such as methyl viologen (Wang & Ren 2013). In a similar
manner the diversion from acetyl coenzyme A conversion to acetate in
acetogenic bacteria to more desirable fuel products such as butanol has also
been the focus of work re-engineering the metabolism of Clostridium
ljungdahlii (Rosenbaum & Henrich 2014). Other studies have investigated
acetyl-CoA as a building block for the formation of various other alcohols and
long chain fatty acids (Rosenbaum & Henrich 2014).
Alternative microbial electrosynthesis studies have focused on more niche
reductive transformation reactions, these are less concerned with renewable
energy production and address more the generation of high value compounds,
i.e. those of more commercial value than their precursors. A relevant example is
the bioanode driven production of hydrogen peroxide from the reduction of
oxygen at a chemical cathode (Pant et al. 2012). The produced hydrogen
peroxide can then be sold to a variety of industries where it is frequently used
for Fenten reaction chemistry (Rabaey & Rozendal 2010). In a similar manner
the consumption of protons at the cathode of BES devices and corresponding
rise in pH values has been used to make caustic solutions intended for
industrial use as cheap disinfectants (Wang & Ren 2013). Reduction of fumarate
to succinate is another commonly studied transformation having been shown by
Anaeromyxobacter dehalogenans (Nevin et al. 2011), cultures of Actinobacillus
succinogenes when mediated by neutral red (Rabaey & Rozendal 2010) and in
non-mediated systems by the model organisms Geobacter metallireducens
(Rabaey & Rozendal 2010) and Shewanella oneidensis (Ross et al. 2011). Other
examples of value-added products being investigated for microbial
electrosynthesis include various precursors for polymers and carbonate species
for construction industries (Sadhukhan et al. 2016).
Microbial electrosynthesis has also been used for bioremediation with the
reduction of unwanted waste products, as already partially described for MRC
devices. Of these denitrification has been particularly well studied (Blackall et

56
al. 2007), with the reduction of nitrate to nitrite being demonstrated without
mediators or hydrogen acting as an intermediate for a pure culture of Geobacter
metallireducens (Gregory et al. 2004). Other demonstrated examples of
microbial electrosynthetic bioremediation include the degradation of phenol
(Sharma et al. 2014) and recovery of phosphate as struvite (Wang & Ren 2013).
More unusual applications involve the recovery of various nanomaterials
including nanomagnets, nanocatalysts and quantum dots (Sadhukhan et al.
2016).
Information on the range of bacterial species capable of accepting electrons from
cathodes is remarkably sparse considering the interest in the area. As already
previously mentioned a range of acetogenic bacteria have been shown to be able
to accept reducing equivalents from cathodes including many of the gram
positive Clostridium species including C. beijerinckii,, C. acetobutylicum, C.
saccharobutylicum, C. pasteurianum and C. ljungdahlii (Khosravanipour et al.
2017). Other acetogenic bacteria including several Sporomusa species, thought
to be phylogenetically related to Clostridia (Yutin & Galperin 2013) and
Moorella thermoacetica, a model acetogen, have also been studied (Nevin et al.
2011).
Model organisms have been the focus of a number of other reported microbial
electrosynthetic investigations, including the model dechlorinator
Anaeromyxobacter dehalogenans for the reduction of dehalogenate-2-
chlorophenol (Nevin et al. 2011), the model methanogen, Methanobacterium
palustre for methane production and the model exoelectrogens Geobacter
sulfurreducens (Rabaey & Rozendal 2010) and Shewanella oneidensis (Ross et
al. 2011) for the reduction of fumarate. Importantly in the case of S.oneidensis
the well characterised Mtr pathway was proposed to function in reverse to
enable such catalysis (Ross et al. 2011).
A variety of other studies have studied bacterial communities and co-cultures in
which those species responsible for cathode interactions are not always
apparent (Hasany et al. 2016). Indeed through the use of exogenously added
mediators a wide range of bacterial species not typically considered as
electrotrophs have been studied (Khosravanipour et al. 2017).

57
A surprisingly unexplored area is the use of chemolithotrophs such as
Acidithiobacillus ferrooxidans (Yarzábal et al. 2002) in microbial
electrosynthesis systems. These species oxidise extracellular iron in order to
obtain reducing equivalents for CO2 fixation or ATP generation although the
underlying mechanisms are currently largely unclear. A few examples do exist
however including study of Rhodopseudomonas palustris with a consideration
for microbial electrosynthesis (Doud & Angenent 2014) and the cultivation of
certain iron-oxidising bacteria on cathodes including Mariprofundus
ferrooxydans PV-1 (Summers et al. 2013). One limitation however may be the
extensive time required to culture such organisms making them unfeasible for
economic exploitation (Yarzábal et al. 2002).
Knowledge of the mechanisms of electron transfer from a cathode to biocatalysts
has already been highlighted as being of fundamental importance for future
development of microbial electrosynthesis technologies. Despite this little is
known, even relating to those systems closest to commercialisation (Lovley
2011).
The simplest mechanism of electron transfer between cathodes and microbes is
through the use of exogenously added mediators, these cycle between redox
states, transferring electrons from the cathode surface to the biocatalysts.
Common examples of mediators include neutral red, thionin and methyl
viologen (Park & Zeikus 2000), although higher potential alternatives such as
Anthraquinone-2,6-disulfonate (AQDS) can also be used (Thrash et al. 2007).
Disadvantages of such systems is that many mediators can be unstable or toxic
necessitating their removal from electrosynthetic products which can be costly
(Rabaey & Rozendal 2010).
Certain bacterial species appear to secrete their own mediators to act in a
similar capacity to those described above, many of these are secondary
metabolites including various flavin molecules (Marsili et al. 2008) and
phenazines (Wang et al. 2013), but sulphur species produced by Pelobacter
carbinolicus have also been observed (Rabaey & Rozendal 2010).
Hydrogen generated at the surface of a cathode has been shown to drive
reductive metabolism for electrosynthesis in a manner similar to that described
for the mediators described above. Hydrogen has been used to promote

58
denitrification (Sakakibara & Kuroda 2004), acetate production in acetogens
and poly-β-hydroxybutyrate production by Cupriavidus necator (Rabaey &
Rozendal 2010). Despite these successes hydrogen also has a number of
drawbacks including its low solubility compared to the above mediators and
energetically inefficient generation at an uncatalysed electrode which requires
overpotentials below -0.41V vs SHE (Rabaey & Rozendal 2010). It is relevant to
mention that for electrosynthetic conversions requiring particularly low
potentials the accompanying electrolysis and hydrogen production can
complicate analysis. This becomes a particular obstacle when trying to
demonstrate that electron transfer proceeds without the presence of hydrogen.
Another mechanism suggested for electron transfer to electrodes is the
involvement of iron species, which like the mediators and dihydrogen above,
cycle between redox states shuttling between the cathode and biocatalyst
(Rabaey & Rozendal 2010). Such a mechanism is already recognised as a
metabolic strategy used by iron oxidising bacteria and has been shown to be
applicable for cathodic interactions by Rhodopseudomonas palustris (Doud &
Angenent 2014).
Concerning co-culture and bacterial community studies it is relevant to
highlight that not all species involved in microbial electrosynthetic processes
need interact with the cathode. In such scenarios, electrotrophs may accept
electrons from a cathode, producing intermediate building block organic
molecules like acetate or formate which are syntrophically provided to other
species which further reduce them to the final, more complex, electrosynthetic
products (Rabaey & Rozendal 2010).
Of most interest are the mechanisms by which certain bacteria accept electrons
directly from cathodes, i.e. direct electron transfer. Examples of such
interactions are restricted to those model organisms principally studied as iron-
reducers including Geobacter sulfurreducens (Rabaey & Rozendal 2010) and
Shewanella oneidensis (Liang et al. 2009). The anodic interactions of both
species are well documented, but in contrast relatively little is known about
their ability to couple to cathodes. It is tempting to assume that many of the
metabolic elements responsible for anodic and cathodic interactions would
overlap but that does not seem entirely the case (Rabaey & Rozendal 2010).

59
In Geobacter species the intensively studied outer-surface Omc cytochromes
(Liang et al. 2009) required for utilising electrodes as electron acceptors, have
been demonstrated to play no major part in electron transfer into cells
(Strycharz et al. 2011). This is in direct contrast to Shewanella oneidensis where
the equally intensively studied Mtr pathway is thought to be reversible and
responsible for both electron shuttling in and out of cells (Ross et al. 2011).
Despite recent advances in the field, such technologies are still in their infancy
and require considerable more study to make them commercially viable. These
technologies share many of the concerns presented for the future of MFCs
including the viability of scaling many of these processes (Sharma et al. 2014).
Many of the issues concern economic viability and relate to several points
regarding efficiency including high overpotentials and internal resistances
observed for certain transformations (Pant et al. 2012). Other considerations
include limitations imposed by substrate/ion diffusion (Rabaey & Rozendal
2010), pH changes (Pant et al. 2012) as well as bacterial electron uptake
limiting production and the unavailability of desired metabolic functions
(Rosenbaum & Henrich 2014). Many of these issues may be resolved by
engineering and electronic refinements, with a variety of unexplored
configurations and improvements having already been proposed (Recio-garrido
et al. 2016). The last two constraints however concerning improved microbe-
cathode interactions and metabolic diversity will require a developed
understanding of the fundamental biochemistry underlying these processes and
advances in the field will likely come from synthetic biology approaches to
optimise both electrode interactions and optimise the relevant metabolic
pathways (Rabaey & Rozendal 2010).

60
1.5 Perspective
As introduced at the beginning of this literature review, the following work aims
to determine whether S.oneidensis MR-1 is capable of acting as a biocatalyst for
CO2 reduction and subsequently determining whether such activity can be
driven by a cathode as a potential biotechnological energy storage system for the
simultaneous production of formate and fixation of CO2. To do this the native
FDH enzymes of S.oneidensis must first be characterised and their normal
physiological role explored. As such this project will simultaneously inform on
the role of the key anaerobic metabolite formate during the respiration of the
model organism S.oneidensis MR-1.
1.6 References
Abaibou, H., Pommier, J. & Benoit, S., 1995. Expression and characterization of the Escherichia
coli fdo locus and a possible physiological role for aerobic formate dehydrogenase. Journal of
Bacteriology, 177(24), pp.7141–7149.
Aelterman, P., Rabaey, K. & Verstraete, W., 2006. Continuous Electricity Generation at High
Voltages and Currents Using Stacked Microbial Fuel Cells. Environmental Science and
Technology, 40(10), pp.3388–3394.
Alekseeva, A.A., Savin, S.S. & Tishkov, V.I., 2011. NAD + -dependent Formate Dehydrogenase
from Plants. Acta Naturae, 3(11), pp.39–54.
Almendra, M.J. et al., 1999. Purification and characterization of a tungsten-containing formate
dehydrogenase from Desulfovibrio gigas. Biochemistry, 38(49), pp.16366–72.
Alvarez, R. a et al., 2012. Greater focus needed on methane leakage from natural gas
infrastructure. Proceedings of the National Academy of Sciences of the United States of
America, 109(17), pp.6435–40.
Andrews, S. et al., 1997. A 12-cistron Escherichia coli operon (hyf) encoding a putative proton-
translocating formate hydrogenlyase system. Microbiology, (1 997), pp.3633–3647.
Armstrong, F. a & Hirst, J., 2011. Reversibility and efficiency in electrocatalytic energy conversion
and lessons from enzymes. Proceedings of the National Academy of Sciences of the United
States of America, 108(34), pp.14049–54.
Axley, M.J., Böck, A. & Stadtman, T.C., 1991. Catalytic properties of an Escherichia coli formate
dehydrogenase mutant in which sulfur replaces selenium. Proceedings of the National
Academy of Sciences of the United States of America, 88(19), pp.8450–4.

61
Bachmeier, A. & Armstrong, F., 2015. Solar-driven proton and carbon dioxide reduction to fuels -
lessons from metalloenzymes. Current opinion in chemical biology, 25C, pp.141–151.
Bagramyan, K. & Trchounian, A., 2003. Structural and functional features of formate hydrogen
lyase, an enzyme of mixed-acid fermentation from Escherichia coli. Biochemistry.
Biokhimii ͡a, 68(11), pp.1159–70.
Bar-even, A., 2016. Formate Assimilation: The Metabolic Architecture of Natural and Synthetic
Pathways. Biochemistry, 55, pp.3851–3863.
Bassegoda, A. et al., 2014. Reversible Interconversion of CO2 and Formate by a Molybdenum-
Containing Formate Dehydrogenase. Journal of the American Chemical Society, 136(44),
pp.15473–6.
Beliaev, A. et al., 2005. Global transcriptome analysis of Shewanella oneidensis MR-1 exposed to
different terminal electron acceptors. Journal of bacteriology, 187(20), pp.7138–45.
Biel, K. & Fomina, I., 2015. Benson-Bassham-Calvin cycle contribution to the organic life on our
planet. Photosynthetica, 53(June), pp.161–167.
Blackall, L.L. et al., 2007. Microbial ecology meets electrochemistry: electricity-driven and driving
communities. The ISME Journal, 1, pp.9–18.
de Bok, F. a. M. et al., 2003. Two W-containing formate dehydrogenases (CO2-reductases) involved
in syntrophic propionate oxidation by Syntrophobacter fumaroxidans. European Journal of
Biochemistry, 270(11), pp.2476–2485.
Bond, D.R. et al., 2012. On electron transport through Geobacter biofilms. ChemSusChem, 5(6),
pp.1099–105.
Borrel, G., Adam, P.S. & Gribaldo, S., 2016. Methanogenesis and the Wood – Ljungdahl Pathway:
An Ancient, Versatile, and Fragile Association. Genome Biol. Evol., 8(6), pp.1706–1711.
Boyington, J. & Gladyshev, V., 1997. Crystal structure of formate dehydrogenase H: catalysis
involving Mo, molybdopterin, selenocysteine, and an Fe4S4 cluster. Science, 275(4), p.1305.
Brutinel, E.D. & Gralnick, J.A., 2012. Preferential Utilization of D -Lactate by Shewanella
oneidensis. Applied and environmental microbiology, 78(23), pp.8474–8476.
Bullen, R. a. et al., 2006. Biofuel cells and their development. Biosensors and Bioelectronics,
21(11), pp.2015–2045.
Cheng, S. et al., 2009. Direct biological conversion of electrical current into methane by
electromethanogenesis. Environmental science & technology, 43(10), pp.3953–8.
Cheng, Y., Holman, H. & Lin, Z., 2012. Remediation of Chromium and Uranium Contamination.
Elements, (April), pp.107–112.
Chistoserdova, L. et al., 2004. Multiple Formate Dehydrogenase Enzymes in the Facultative

62
Methylotroph Methylobacterium extorquens AM1 Are Dispensable for Growth on Methanol.
Journal of bacteriology, 186(1), pp.22–28.
Choe, H. et al., 2014. Efficient CO2-Reducing Activity of NAD-Dependent Formate Dehydrogenase
from Thiobacillus sp. KNK65MA for Formate Production from CO2 Gas. PloS one, 9(7),
p.e103111.
Coursolle, D. et al., 2010. The Mtr respiratory pathway is essential for reducing flavins and
electrodes in Shewanella oneidensis. Journal of bacteriology, 192(2), pp.467–74.
Crable, B.R. et al., 2011. Formate formation and formate conversion in biological fuels production.
Enzyme research, 2011, p.532536.
Cruz-García, C. et al., 2011. Fnr (EtrA) acts as a fine-tuning regulator of anaerobic metabolism in
Shewanella oneidensis MR-1. BMC microbiology, 11(1), p.64.
Davies, J.A., Clarke, T.A. & Butt, J.N., 2017. Making Connections: An Amphiphilic Ferrocene
Stimulates Bacterial Electricity Production. Chem, 2(2), pp.164–167.
Doddema, H. & Vogels, G., 1978. Improved Identification of Methanogenic Bacteria by
fluorescenece microscopy. Applied and environmental microbiology, 36(5), pp.752–754.
Doud, D.F.R. & Angenent, L.T., 2014. Toward Electrosynthesis with Uncoupled Extracellular
Electron Uptake and Metabolic Growth : Enhancing Current Uptake with
Rhodopseudomonas palustris. Environmental Science and Technology Letters, 56, pp.351–
355.
Ducat, D. & Silver, P., 2013. Improving Carbon Fixation Pathways. Current Opinion In Chemical
Biology, 16, pp.337–344.
Edwards, M.J. et al., 2015. Redox Linked Flavin Sites in Extracellular Decaheme Proteins
Involved in Microbe-Mineral Electron Transfer . Nature Publishing Group, 5(11677).
Eerten-jansen, M.C.A.A. Van et al., 2012. Microbial electrolysis cells for production of methane
from CO2 : long-term performance and perspectives. International Journal of Energy
Research, 36, pp.809–819.
Erable, B., Etcheverry, L. & Bergel, A., 2011. From microbial fuel cell (MFC) to microbial
electrochemical snorkel (MES): maximizing chemical oxygen demand (COD) removal from
wastewater. Biofouling, 7014(July).
Ernst, M. et al., 2005. Enantioselective reduction of carbonyl compounds by whole-cell
biotransformation, combining a formate dehydrogenase and a (R)-specific alcohol
dehydrogenase. Applied microbiology and biotechnology, 66(6), pp.629–34.
Fourmond, V. et al., 2008. Major Mo(V) EPR signature of Rhodobacter sphaeroides periplasmic
nitrate reductase arising from a dead-end species that activates upon reduction. Relation to
other molybdoenzymes from the DMSO reductase family. The journal of physical chemistry.

63
B, 112(48), pp.15478–86.
Franks, A. & Nevin, K., 2010. Microbial Fuel Cells, A Current Review. Energies, pp.899–919.
Fredrickson, J.K. et al., 2008. Towards environmental systems biology of Shewanella. Nature
reviews. Microbiology, 6(8), pp.592–603.
Gao, H. et al., 2010. Physiological Roles of ArcA , Crp , and EtrA and Their Interactive Control on
Aerobic and Anaerobic Respiration in Shewanella oneidensis. PloS one, 5(12).
Gerland, P. et al., 2014. World population stabilization unlikely this century. Scientific Reports,
346(6206).
Goli, A. et al., 2016. An overview of biological processes and their potential for CO2 capture.
Journal of Environmental Management, 183, pp.41–58.
Graentzdoerffer, A. et al., 2003. Molecular and biochemical characterization of two tungsten- and
selenium-containing formate dehydrogenases from Eubacterium acidaminophilum that are
associated with components of an iron-only hydrogenase. Archives of Microbiology, pp.116–
130.
Gregory, K.B., Bond, D.R. & Lovley, D.R., 2004. Graphite electrodes as electron donors for
anaerobic respiration. Environmental microbiology, 6(6), pp.596–604.
Groysman, S. & Holm, R.H., 2007. Synthesis and Structures of Bis ( dithiolene ) tungsten ( IV , VI
) Thiolate and Selenolate Complexes : Approaches to the Active Sites of Molybdenum and
Tungsten Formate Dehydrogenases. Inorganic chemistry, 46(10), pp.1826–1832.
Hanson, A., Gage, D. & Shachar-Hill, Y., 2000. Plant one-carbon metabolism and its engineering.
Trends in plant science, 1385(1997), pp.81–87.
Hasany, M., Mardanpour, M.M. & Yaghmaei, S., 2016. Biocatalysts in microbial electrolysis cells :
A review. International journal of hydrogen energy, 41, pp.1477–1493.
Hau, H.H. & Gralnick, J. a, 2007. Ecology and biotechnology of the genus Shewanella. Annual
review of microbiology, 61(August), pp.237–58.
Hindatu, Y., Annuar, M.S.M. & Gumel, A.M., 2017. Mini-review : Anode modification for improved
performance of microbial fuel cell. Renewable and Sustainable Energy Reviews, 73(June
2015), pp.236–248.
Hunt, K.A. et al., 2010. Substrate-Level Phosphorylation Is the Primary Source of Energy
Conservation during Anaerobic Respiration of Shewanella oneidensis Strain MR-1. J.
Bacteriol., 192(13), pp.3345–3351.
Huugler, M. et al., 2005. Evidence for Autotrophic CO2 Fixation via the Reductive Tricarboxylic
Acid Cycle by Members of the ε Subdivision of Proteobacteria. Journal of Bacteriology,
187(9), pp.3020–3027.

64
Ihara, M. et al., 2013. Light driven CO2 fixation by using cyanobacterial photosystem I and
NADPH-dependent formate dehydrogenase. PloS one, 8(8), p.e71581.
Jacques, J.G.J. et al., 2014. Reductive activation in periplasmic nitrate reductase involves
chemical modifications of the Mo-cofactor beyond the first coordination sphere of the metal
ion. Biochimica et biophysica acta, 1837(2), pp.277–86.
Jormakka, M., Törnroth, S., et al., 2002. Molecular basis of proton motive force generation:
structure of formate dehydrogenase-N. Science, 295(March), pp.1863–1868.
Jormakka, M., Törnroth, S., et al., 2002. Purification and crystallization of the respiratory
complex formate dehydrogenase-N from Escherichia coli. Acta Crystallographica Section D:
Biological Crystallography, 58(1), pp.160–162.
Jormakka, M., Byrne, B. & Iwata, S., 2003a. Formate dehydrogenase – a versatile enzyme in
changing environments. Current Opinion in Structural Biology, 13(4), pp.418–423.
Jormakka, M., Byrne, B. & Iwata, S., 2003b. Protonmotive force generation by a redox loop
mechanism. FEBS Letters, 545(1), pp.25–30.
Kadier, A. et al., 2016. A comprehensive review of microbial electrolysis cells ( MEC ) reactor
designs and configurations for sustainable hydrogen gas production. Alexandria Engineering
Journal, 55(1), pp.427–443.
Kane, A.L. et al., 2016. Formate metabolism in Shewanella oneidensis generates proton motive
force and prevents growth without an electron acceptor. Journal of Bacteriology, 198(8),
pp.1337–1346.
Kane, A.L., Bond, D.R. & Gralnick, J. a, 2013. Electrochemical analysis of Shewanella oneidensis
engineered to bind gold electrodes. ACS synthetic biology, 2(2), pp.93–101.
Katzberg, M. et al., 2010. Engineering cofactor preference of ketone reducing biocatalysts: A
mutagenesis study on a γ-diketone reductase from the yeast Saccharomyces cerevisiae
serving as an example. International journal of molecular sciences, 11(4), pp.1735–58.
Khosravanipour, A. et al., 2017. Microbial electrosynthesis of solvents and alcoholic biofuels from
nutrient waste: A review. Journal of Environmental Chemical Engineering, 5(1), pp.940–
954.
Kouzuma, A. et al., 2015. Catabolic and regulatory systems in Shewanella oneidensis MR-1
involved in electricity generation in microbial fuel cells. Frontiers in Microbiology, 6(JUN),
pp.1–11.
Kumar, R. et al., 2015. Exoelectrogens in microbial fuel cells toward bioelectricity generation : a
review. International journal of energy research, (February), pp.1048–1067.
Ladapo, J. & Whitman, W.B., 1990. Method for isolation of auxotrophs in the methanogenic
archaebacteria : Role of the acetyl-CoA pathway of autotrophic CO2 fixation in

65
Methanococcus maripaludis. Proceedings of the National Academy of Sciences of the United
States of America, 87(August), pp.5598–5602.
Lashof, D.A. & Ahuja, D.R., 1990. Relative contributions of greenhouse gas emissions to global
warming. Nature, 344(6266), pp.529–531.
Laukel, M. et al., 2003. The tungsten-containing formate dehydrogenase from Methylobacterium
extorquens AM1: Purification and properties. European Journal of Biochemistry, 270(2),
pp.325–333.
Leuchtenberger, W., Huthmacher, K. & Drauz, K., 2005. Biotechnological production of amino
acids and derivatives: current status and prospects. Applied microbiology and biotechnology,
69(1), pp.1–8.
Liang, S. et al., 2009. The roles of outer membrane cytochromes of Shewanella and Geobacter in
extracellular electron transfer. Environmental microbiology reports, 1(4), pp.220–7.
Liu, C. et al., 2002. Reduction kinetics of Fe(III), Co(III), U(VI), Cr(VI), and Tc(VII) in cultures of
dissimilatory metal-reducing bacteria. Biotechnology and bioengineering, 80(6), pp.637–49.
Liu, C. & Mortenson, L., 1984. Formate Dehydrogenase of Clostridium pasteurianum. Journal of
bacteriology, 159(1), pp.375–380.
Logan, B.E., 2009. Exoelectrogenic bacteria that power microbial fuel cells. Nature Reviews
Microbiology, 7, pp.375–381.
Logan, B.E. et al., 2006. Microbial fuel cells: Methodology and technology. Environmental Science
and Technology, 40(17), pp.5181–5192.
Lovley, D.R., 2011. Powering microbes with electricity: direct electron transfer from electrodes to
microbes. Environmental microbiology reports, 3(1), pp.27–35.
Lovley, D.R. & Nevin, K.P., 2011. A shift in the current: new applications and concepts for
microbe-electrode electron exchange. Current opinion in biotechnology, 22(3), pp.441–8.
Lüke, I. et al., 2008. Biosynthesis of the respiratory formate dehydrogenases from Escherichia
coli : characterization of the FdhE protein. Archives of Microbiology, 190, pp.685–696.
Lum, K., Kamarudi, K. & Daud, W.R.W., 2012. Overview on Dirrect Formic Acid Fuel Cells (DF
AFCs) as an Energy Source. APCBEE Procedia, 3, pp.33–39.
Magalon, A. et al., 2011. Molybdenum enzymes in bacteria and their maturation. Coordination
Chemistry Reviews, 255(9–10), pp.1159–1178.
Maia, L.B. et al., 2016. Reduction of Carbon Dioxide by a Molybdenum-Containing Formate
Dehydrogenase: A Kinetic and Mechanistic Study. Journal of the American Chemical
Society, 138(28), pp.8834–8846.
Maia, L.B., Moura, I. & Moura, J.J.G., 2017. Molybdenum and tungsten-containing formate

66
dehydrogenases: aiming to inspire a catalyst for carbon dioxide utilization. Inorganica
Chimica Acta, 455(2), pp.350–363.
Maia, L.B., Moura, J.J.G. & Moura, I., 2015. Molybdenum and tungsten ‑ dependent formate
dehydrogenases. J Biol Inorg Chem, 20, pp.287–309.
Maier, T.M. et al., 2003. Identification of the gene encoding the sole physiological fumarate
reductase in Shewanella oneidensis MR-1. J. Basic Microbiol, 43(4), pp.312–327.
Marritt, S.J., Lowe, T.G. & Bye, J., 2012. A functional description of CymA , an electron- transfer
hub supporting anaerobic respiratory flexibility in Shewanella. J. Biochem., 444, pp.465–
474.
Marsili, E. et al., 2008. Shewanella secretes flavins that mediate extracellular electron transfer.
Proceedings of the National Academy of Sciences of the United States of America, 105(10),
pp.3968–73.
McDowall, J.S. et al., 2014. Bacterial formate hydrogenlyase complex. Proceedings of the National
Academy of Sciences of the United States of America, 111(38), pp.E3948-56.
Menicucci, J. et al., 2006. Procedure for determining maximum sustainable power generated by
microbial fuel cells. Environmental science & technology, 40(3), pp.1062–8.
Meshulam-Simon, G. et al., 2007. Hydrogen metabolism in Shewanella oneidensis MR-1. Applied
and environmental microbiology, 73(4), pp.1153–65.
Mordkovich, N.N. et al., 2013. Effect of NAD+-dependent formate dehydrogenase on anaerobic
respiration of Shewanella oneidensis MR-1. Microbiology, 82(4), pp.404–409.
Mota, C.S. et al., 2011. Effects of Molybdate and Tungstate on Expression Levels and Biochemical
Characteristics of Formate Dehydrogenases Produced by Desulfovibrio alaskensis NCIMB
13491. Journal of Bacteriology, 193(12), pp.2917–2923.
Moura, J.J.G. et al., 2004. Mo and W bis-MGD enzymes: nitrate reductases and formate
dehydrogenases. Journal of biological inorganic chemistry, 9(7), pp.791–9.
Nevin, K.P. et al., 2011. Electrosynthesis of Organic Compounds from Carbon Dioxide Is
Catalyzed by a Diversity of Acetogenic Microorganisms ᰔ. Applied and environmental
microbiology, 77(9), pp.2882–2886.
Nevin, K.P. et al., 2010. Microbial Electrosynthesis : Feeding Microbes Electricity to Convert
carbon Dioxide and Water to Multi Carbon Extracellular Organic Compounds. mBio,
1(January), pp.e00103-10.
Nikolaidis, P. & Poullikkas, A., 2017. A comparative overview of hydrogen production processes.
Renewable and Sustainable Energy Reviews, 67, pp.597–611.
Niks, D. et al., 2016. Spectroscopic and Kinetic Properties of the Molybdenum- containing , NAD+
67
-dependent Formate Dehydrogenase from Ralstonia eutropha. The Journal of biological
chemistry, 291(3), pp.1162–1174.
Olson, B.J.S.C. et al., 2000. Formate dehydrogenase in Arabidopsis thaliana: characterization and
possible targeting to the chloroplast. Plant Science, 159(2), pp.205–212.
Pant, D. et al., 2012. Bioelectrochemical systems (BES) for sustainable energy production and
product recovery from organic wastes and industrial wastewaters. RSC Advances, 2,
pp.1248–1263.
Panwar, N.L., Kaushik, S.C. & Kothari, S., 2011. Role of renewable energy sources in
environmental protection: A review. Renewable and Sustainable Energy Reviews, 15(3),
pp.1513–1524.
Park, D.H. & Zeikus, J.G., 2000. Electricity Generation in Microbial Fuel Cells Using Neutral Red
as an Electronophore. Applied and Environmental Microbiology, 66(4), pp.1292–1297.
Parkin, A. et al., 2007. Rapid and Efficient Electrocatalytic CO2 / CO Interconversions by
Carboxydothermus hydrogenoformans CO Dehydrogenase I on an Electrode. Journal of the
American Chemical Society, 129, pp.10328–10329.
Parkinson, B. & Weaver, P., 1984. Photoelectrochemical pumping of enzymatic CO2 reduction.
Letters to Nature, 309(10), pp.148–9.
Pinchuk, G.E. et al., 2009. Genomic reconstruction of Shewanella oneidensis MR-1 metabolism
reveals a previously uncharacterized machinery for lactate utilization. Proceedings of the
National Academy of Sciences of the United States of America, 106(8), pp.2874–2879.
Pinchuk, G.E. et al., 2011. Pyruvate and lactate metabolism by Shewanella oneidensis MR-1
under fermentation, oxygen limitation, and fumarate respiration conditions. Applied and
environmental microbiology, 77(23), pp.8234–40.
Pinske, C. & Sargent, F., 2016. Exploring the directionality of Escherichia coli formate
hydrogenlyase : a membrane- bound enzyme capable of fixing carbon dioxide to organic
acid. MicrobiologyOpen, 5(5), pp.721–737.
Potter, M.C., 1911. Electrical Effects Accompanying the Decomposition of Organic Compounds.
Proceedings of the Royal Society B: Biological Sciences, 84(571), pp.260–276.
Qian, Y. et al., 2011. Mapping the iron binding site(s) on the small tetraheme cytochrome of
Shewanella oneidensis MR-1. Biochemistry, 50(28), pp.6217–24.
Raaijmakers, H., Macieira, S. & Dias, J., 2002. Gene Sequence and the 1.8 Å Crystal Structure of
the Tungsten-Containing Formate Dehydrogenase from Desulfovibrio gigas. Structure,
10(2), pp.1261–1272.
Raaijmakers, H.C.A. & Romao, M., 2006. Formate-reduced E . coli formate dehydrogenase H : the
reinterpretation of the crystal structure suggests a new reaction mechanism. J Biol Inorg

68
Chem, 11, pp.849–854.
Rabaey, K. & Rozendal, R. a, 2010. Microbial electrosynthesis - revisiting the electrical route for
microbial production. Nature reviews. Microbiology, 8(10), pp.706–16.
Ragsdale, S.W. & Pierce, E., 2008. Acetogenesis and the Wood-Ljungdahl Pathway of CO2
Fixation. Biochimica et Biophysica Acta, 1784(12), pp.1873–1898.
Rahimnejad, M., Bakeri, G. & Ghasemi, M., 2014. A review on the role of proton exchange
membrane on the performance of microbial fuel cell. Polymers advanced technologies, 25,
pp.1426–1432.
Recio-garrido, D., Perrier, M. & Tartakovsky, B., 2016. Modeling , optimization and control of
bioelectrochemical systems. Chemical Engineering Journal, 289, pp.180–190.
Reda, T. et al., 2008. Reversible interconversion of carbon dioxide and formate by an electroactive
enzyme. Proceedings of the National Academy of Sciences of the United States of America,
105(31), pp.10654–8.
Richardson, D.J. et al., 2012. Exploring the biochemistry at the extracellular redox frontier of
bacterial mineral Fe(III) respiration. Biochemical Society transactions, 40(3), pp.493–500.
Rosenbaum, M.A. & Henrich, A.W., 2014. Engineering microbial electrocatalysis for chemical and
fuel production. Current opinion in biotechnology, 29, pp.93–98.
Ross, D.E. et al., 2011. Towards electrosynthesis in Shewanella: energetics of reversing the mtr
pathway for reductive metabolism. PloS one, 6(2), p.e16649.
Rossmann, R., Sawers, G. & Böck, A., 1991. Mechanism of regulation of the formate-
hydrogenlyase pathway by oxygen, nitrate, and pH: definition of the formate regulon.
Molecular microbiology, 5(11), pp.2807–14.
Ruschig, U. et al., 1976. CO2 reduction to formate by NADH catalysed by formate dehydrogenase
from Pseudomonas oxalaticus. European journal of biochemistry / FEBS, 70(2), pp.325–330.
Sadhukhan, J. et al., 2016. A critical review of integration analysis of microbial electrosynthesis (
MES ) systems with waste biorefineries for the production of biofuel and chemical from
reuse of CO2. Renewable and Sustainable Energy Reviews, 56, pp.116–132.
Saeed, H.M. et al., 2015. Microbial desalination cell technology : A review and a case study.
Desalination, 359, pp.1–13.
Sakakibara, Y. & Kuroda, M., 2004. Electric Prompting and Control of Denitrification.
Biotechnology and Bioengineering, 42(4), pp.535–537.
Santoro, C. et al., 2017. Microbial fuel cells : From fundamentals to applications . A review.
Journal of Power Sources, 356, pp.225–244.
Sawers, G., 1994. The hydrogenases and formate dehydrogenases of Escherichia coli. Antonie van

69
Leeuwenhoek, 66(1–3), pp.57–88.
Schauer, N.L. & Ferry, J.G., 1980. Metabolism of Formate in Methanobacterium formicicum.
Journal of Bacteriology, 142(3), pp.800–807.
Schlindwein, C., Giordano, G. & Santini, C., 1990. Identification and Expression of the
Escherichia coli fdhD and fdhE Genes , Which Are Involved in the Formation of Respiratory
Formate Dehydrogenase. J. Bacteriol., 172(10), pp.6112–6121.
Schuchmann, K. & Müller, V., 2013. Direct and Reversible Hydrogenation of CO2 to Formate by a
Bacterial Carbon Dioxide Reductase. Science, 342(December), pp.1382–1386.
Scott, J.H. & Nealson, K.H., 1994. A biochemical study of the intermediary carbon metabolism of
Shewanella putrefaciens. Journal of bacteriology, 176(11), pp.3408–11.
Serres, M.H. & Riley, M., 2006. Genomic analysis of carbon source metabolism of Shewanella
oneidensis MR-1: Predictions versus experiments. Journal of bacteriology, 188(13), pp.4601–
9.
Sharma, M. et al., 2014. A critical revisit of the key parameters used to describe microbial
electrochemical systems. Electrochimica Acta, 140, pp.191–208.
Shin, W. et al., 2003. Highly Selective Electrocatalytic Conversion of CO2 to CO at - 0 . 57 V (
NHE ) by Carbon Monoxide Dehydrogenase from Moorella thermoacetica. Journal of the
American Chemical Society, pp.14688–14689.
Silva, S.M. da et al., 2011. Tungsten and molybdenum regulation of formate dehydrogenase
expression in Desulfovibrio vulgaris Hildenborough. Journal of bacteriology, 193(12),
pp.2909–16.
Slusarczyk, H. et al., 2000. Stabilization of NAD-dependent formate dehydrogenase from Candida
boidinii by site-directed mutagenesis of cysteine residues. European Journal of
Biochemistry, 267(5), pp.1280–1289.
Smart, J.P., Cliff, M.J. & Kelly, D.J., 2009. A role for tungsten in the biology of Campylobacter
jejuni: tungstate stimulates formate dehydrogenase activity and is transported via an ultra-
high affinity ABC system distinct from the molybdate transporter. Molecular microbiology,
74(3), pp.742–57.
Sousa, P.M.F. et al., 2011. Supramolecular organizations in the aerobic respiratory chain of
Escherichia coli. Biochimie, 93(3), pp.418–25.
Stams, A.J.M. & Plugge, C.M., 2009. Electron transfer in syntrophic communities of anaerobic
bacteria and archaea. Nature Reviews Microbiology, 7(august), pp.568–577.
Strik, D.P.B.T.B. et al., 2011. Microbial solar cells : applying photosynthetic and electrochemically
active organisms. Trends in Biotechnology, 29(1), pp.41–49.
70
Strycharz, S.M. et al., 2011. Gene expression and deletion analysis of mechanisms for electron
transfer from electrodes to Geobacter sulfurreducens. Bioelectrochemistry (Amsterdam,
Netherlands), 80(2), pp.142–50.
Summers, Z.M., Gralnick, J. a & Bond, D.R., 2013. Cultivation of an obligate Fe(II)-oxidizing
lithoautotrophic bacterium using electrodes. mBio, 4(1), pp.e00420-12.
Suntres, Z.E., 2002. Role of antioxidants in paraquat toxicity. Toxicology, 180, pp.65–77.
Thrash, J.C. et al., 2007. Electrochemical Stimulation of Microbial Perchlorate Reduction.
Environ. Sci. Technol., 41(5), pp.1740–1746.
Tishkov, V. et al., 1993. Catalytic Properties and Stability of a Pseudomonas sp. 101 Formate
Dehydrogenase Mutants Containing Cys-255-Ser and Cys-255-Met Replacements.
Biochemical and Biophysical Research Communications, 192(2), pp.976–981.
Tishkov, V. & Popov, V., 2004. Catalytic mechanism and application of formate dehydrogenase.
Biochemistry (Moscow), 69(11), pp.1252–1267.
Wang, H. & Gunsalus, R., 2003. Coordinate regulation of the Escherichia coli formate
dehydrogenase fdnGHI and fdhF genes in response to nitrate, nitrite, and formate: roles for
NarL and NarP. Journal of bacteriology, 185(17), pp.5076–5085.
Wang, H. & Ren, Z.J., 2013. A comprehensive review of microbial electrochemical systems as a
platform technology. Biotechnology Advances, 31(8), pp.1796–1807.
Wang, V.B. et al., 2013. Engineering PQS biosynthesis pathway for enhancement of bioelectricity
production in Pseudomonas aeruginosa microbial fuel cells. PloS one, 8(5), p.e63129.
Yarzábal, A. et al., 2002. The High-Molecular-Weight Cytochrome c Cyc2 of Acidithiobacillus
ferrooxidans Is an Outer Membrane Protein. J. Bacteriol., 184(1), pp.313–317.
Yi-chi, Z., Zhao-hong, J. & Ying, L.I.U., 2015. Application of Electrochemically Active Bacteria as
Anodic Biocatalyst in Microbial Fuel Cells. Chinese Journal of Analytical Chemistry, 43(1),
pp.155–163.
Yoch, D.C. & Carithers, R.P., 1979. Bacterial Iron-Sulfur Proteins. Microbiological reviews, 43(3),
pp.384–421.
Yu, X. et al., 2017. Efficient reduction of CO2 by the molybdenum-containing formate
dehydrogenase from Cupriavidus necator (Ralstonia eutropha). Journal of Biological
Chemistry, pp.1–20.
Yutin, N. & Galperin, M., 2013. A genomic update on clostridial phylogeny: Gram-negative spore-
formers and other misplaced Clostridia. Environmental microbiology, 15(10), pp.2631–2641.
Zelcbuch, L. et al., 2016. Pyruvate Formate-Lyase Enables Efficient Growth of Escherichia coli on
Acetate and Formate. Biochemistry, 55, pp.2423–2426.

71
2 Materials and methods
2.1 Buffer preparation
All buffer components were purchased from Sigma™ and buffers made using
analytical grade water (Fisher). Adjustments to pH were made using 10 M HCl
in small additions until the correct pH was determined by pH electrode (VWR
International). All buffers were then vacuum filtered through 0.2 µM filters
(Sartorius) to remove insoluble material.
2.2 Minimal media composition
For metal dependent experiments a minimal medium was used. To prevent
metal contamination analytical grade water and acid washed
glassware/equipment were used for media preparation, 50% Nitric acid was
used, followed by three thorough rinses with analytical water. Disposable plastic
alternatives to glassware were used to reduce contamination risk where
possible.
Basal medium containing 0.46 g/L NH4Cl, 0.225 g/L K2HPO4, 0.225 g/L KH2PO4,
0.117 g/L MgSO4, 1 g/L DL-Serine, 1 g/L DL-Arginine, 1 g/L DL-Glutamine,
23.83 g/L HEPES, 3.4 g/L Na Formate and 8 g/L Na Fumarate was adjusted to
pH 7.2 using NaOH before autoclaving. Subsequently filter sterilised vitamin
and mineral mixes were added at 5 ml/L, these were not autoclaved to avoid
precipitation.
Vitamin mix; 0.002 g/L Biotin, 0.002 g/L Folic acid, 0.02 g/L pyridoxine HCl,
0.005 g/L Thiamine, 0.005 g/L Nicotinic acid, 0.005 g/L Pantothenic acid, 0.0001
g/L Vitamin B12, 0.005 g/L p-aminobenzoic acid, 0.005 g/L thioctic acid.
Mineral mix; 1.5 g/L Nitrilotriacetic acid, 0.1 g/L MnCl2, 0.3 g/L FeSO4, 0.17 g/L
CoCl2, 0.1 g/L ZnCl2, 0.04 g/L CuSO4, 0.005 g/L AlK(SO4)2, 0.12 g/L NiCl2, 0.1 g
Na2SeO4, 0.005 g/L H3BO3.
Filter sterile 1.5 mM or 15 mM solutions of Na tungstate and Na molybdate
were used to supplement media as required by specific experiments. Such
additions did not alter the pH of the media, even at high concentrations.

72
Unless stated otherwise all references to minimal media experiments in
subsequent text refer to those using the above growth medium. A summary
table including final concentrations of all components is included for ease of
reference.
Table 2-1 Composition of minimal media used in this work.
Component Final concentration in mM
HEPES 100.00
Na Formate 50.00
Na Fumarate 50.00
DL-Serine 9.52
DL-Arginine 5.75
DL-Glutamine 6.85
NH4Cl 8.68
K2HPO4 1.29
KH2PO4 1.65
MgSO4 0.98
Mineral Component Final concentration in µM
Nitrilotriacetic acid 39.27
Na2SeO4 2.65
MnCl2 11.90
FeSO4 5.59
CoCl2 3.85
ZnCl2 3.68
CuSO4 1.26
AlK(SO4)2 0.10
NiCl2 4.62
H3BO3 0.40
Na2WO4 As specified
Na2MoO4 As specified
Vitamin Component Final concentration in nM
Thiamine (B1) 94
Nicotinic acid (B3) 203
Pantothenic acid (B5) 2
Pyridoxine HCl (B6) 147
Biotin (B7) 40
Folic acid (B9) 226
Cobalamin (B12) 18
p-Aminobenzoic acid 182
Thioctic acid 121

73
2.3 Bacterial strains
A list of the strains used in this thesis including origin and genotype is
presented in Table 2-2.
All mutants in this study were created using in frame deletion mutagenesis as
routinely described for Shewanella (Saltikov & Newman 2003). Briefly, all
mutant strains were generated by amplification of approximately 1kb flanking
regions upstream and downstream of a deletion target, which when combined in
a crossover fusion PCR and cloned into a suicide vector (pSMV3) (Kane et al.
2016) or (pDS3.1) (LS527). Conjugation into S.oneidensis allowed for screening
of homologous recombinants where the wild type version of a gene was replaced
by the truncated version on the suicide plasmid. All mutants used in this work
are in frame deletion mutants verified by sequencing. These strains were not
generated as part of this work and their origins are detailed in Table 2-2.

74
Table 2-2 Bacterial strains used during this thesis.
Where Pacific Northwest National Laboratory refers to those strains provided by the group of Dr
Liang Shi in Washington, now at Wuhan University.
Strain Genotype Origin
Shewanella oneidensis MR-1 Wild Type (Richardson et al. 2012)
Shewanella oneidensis MR-1
(ΔFdh1) ΔSO_4509-4511 (Kane et al. 2016)
Shewanella oneidensis MR-1
(ΔFdh2) ΔSO_4513-4515 (Kane et al. 2016)
Shewanella oneidensis MR-1
(ΔFdn) ΔSO_0101-0103 (Kane et al. 2016)
Shewanella oneidensis MR-1
(Fdh1+)
ΔSO_0101-0103
ΔSO_4513-4515 (Kane et al. 2016)
Shewanella oneidensis MR-1
(Fdh2+)
ΔSO_0101-0103
ΔSO_4509-4511 (Kane et al. 2016)
Shewanella oneidensis MR-1
(Fdn+)
ΔSO_4509-4511
ΔSO_4513-4515 (Kane et al. 2016)
Shewanella oneidensis MR-1
(ΔFDH)
ΔSO_0101-0103
ΔSO_4509-4511
ΔSO_4513-4515
(Kane et al. 2016)

75
Strain Genotype Origin
Shewanella oneidensis MR-1
(LS527)
ΔSO_1776 (mtrB)
ΔSO_1777 (mtrA)
ΔSO_1778 (mtrC)
ΔSO_1779(omcA)
ΔSO_1780(mtrF)
ΔSO_1781 (mtrE)
ΔSO_1782 (mtrD)
Pacific Northwest National
Laboratory
Shewanella amazonensis SB2B Wild Type Pacific Northwest National
Laboratory
Shewanella baltica OS185 Wild Type Pacific Northwest National
Laboratory
Shewanella baltica OS195 Wild Type Pacific Northwest National
Laboratory
Shewanella baltica OS223 Wild Type Pacific Northwest National
Laboratory
Shewanella loihica PV4 Wild Type Pacific Northwest National
Laboratory
Shewanella putrifaciens 200 Wild Type Pacific Northwest National
Laboratory
Shewanella putrifaciens CN-32 Wild Type Pacific Northwest National
Laboratory
Shewanella putrifaciens W3-18-1 Wild Type Pacific Northwest National
Laboratory
Shewanella sp. ANA-3 Wild Type Pacific Northwest National
Laboratory
Shewanella oneidensis MR-4 Wild Type Pacific Northwest National
Laboratory
Shewanella oneidensis MR-7 Wild Type Pacific Northwest National
Laboratory

76
2.4 Shewanella growth in minimal media
Single bacterial colonies from LB-agar plates were inoculated into 100 ml LB
liquid cultures grown aerobically at 30oC with agitation. After 24 h 50 ml
aliquots of cultures were centrifuged at 5540 x g for 15 min. Cell pellets were
then washed thrice, each wash consisting of centrifugation at 5540 x g for 15
min followed by resuspension in 25 ml of basal medium in an attempt to prevent
metal introduction from inoculum.
After the final wash each 50 ml pellet was re-suspended in 5 ml of basal media.
These were then diluted to an OD600 of 8 using additional basal media. 2 ml/L
was then used to inoculate minimal media growth experiments (i.e. a 2 %
inoculum). Experiments monitoring growth were conducted in 500 ml Durans
with septum sealed lids that could be pierced to take samples to determine
OD600 readings. The same lids were used for 1 L or 5 L Duran growths for
protein purifications.
Once inoculated, each Duran was sparged with N2 gas passed through a 0.45 µm
filter and a needle submerged in the media for 10 min to remove oxygen from
the headspace of the Duran and promote anaerobicity. Durans were then
incubated at 30oC without agitation for 10/24 h for RNA extraction/colorimetric
assay analysis respectively.
2.5 Shewanella growth in LB
Lysogeny broth was prepared from premixed powder (Formedium) of which 25 g
was dissolved per litre of distilled water. Once prepared, the media contained 10
g/L tryptone, 10 g/L NaCl and 10 g/L yeast extract.
Single bacterial colonies from LB-agar plates were inoculated into 100 ml LB
liquid cultures grown aerobically at 30oC with agitation or anaerobically as
described below.
Experiments monitoring anaerobic growth were conducted in 500 ml Durans
with septum sealed lids that could be pierced to take samples to determine
OD600 readings. Note sodium fumarate was supplemented at 50 mM to act as a
terminal electron acceptor in these experiments. Once inoculated each Duran
was sparged with N2 gas passed through a 0.45 µm filter and a needle

77
submerged in the media for 10 min to remove oxygen from the headspace of the
Duran and promote anaerobicity. Durans were then incubated at 30oC without
agitation for 24 h.
2.6 Bacterial growth analysis
Analysis of growth curves in Chapter 5 was performed by determining three
parameters for each growth trace, corresponding to lag, exponential and
stationary phases of growth (Zwietering et al. 1990). An example trace analysis
is shown in Figure 2-1.
Figure 2-1 Example of growth curve analysis.
(A) Data plotted on linear axis demonstrating calculation of absorbance during stationary phase
(AStationary). A semi-log plot (B) is then used for determination of both lag phase duration and
specific growth rate (µ) where µ equals the gradient of a linear trend line fitted through points
during exponential growth.
The average absorbance during stationary phase (Astationary) was determined by
the mean absorbance at 600 nm for the last five time points during stationary
phase. For those traces which did not enter stationary phase during the 24 h
duration of the experiment instead the final absorbance value at 24 h is
presented. Population size is taken to be equivalent to turbidity in these
(t1 , A1)
(t2 , A2)
(Lag)
Y = (A Stationary)
Gradient during
exponential
phase = µ
(Lag)
Y = (Stationary)
A B

78
experiments, a common and established approach (Monod 1949) but which could
be complimented with alternative metrics (cfu/ml) that take into consideration
the viability of the cells within the cultures (Owens & Legan 1987).
Parameters for both lag and exponential phases were analysed by use of a semi-
log plot, where the natural logarithm of the absorbance at 600nm is plotted
against time (Figure 2-1). The duration of the lag phase was defined by the
length of time in hours where changes in OD600 were not detected prior to
entering exponential growth.
To report on the exponential phase of growth, specific growth rates (µ) were
calculated by determining the gradient of a linear trendline during exponential
growth, typically seen between 5 and 10 h of growth. Such specific growth rates
were also used to study growth kinetics (Owens & Legan 1987) as detailed in
the next section.
2.7 Monod constant determination
Specific growth rates (µ) were determined in triplicate for each concentration of
formate investigated. The resultant data were plotted and fitted by OriginPro
8.5 software to the Nonlinear curve fit:Hyperbl function, to represent the Monod
eq. below (2.1):
µ = µ𝑚𝑎𝑥
𝑆
𝐾𝑠 + 𝑆 (2.1)
Where µmax is the maximum specific growth rate, S is the substrate (formate)
concentration, and Ks is the half velocity or Monod constant (Owens & Legan
1987).

79
2.8 ICP analysis
A quadrupole based ICP mass spectrometer, Thermo Elemental X Series 1
(Thermo Scientific, Bremen, Germany) equipped with Peltier impact bead spray
chamber, glass expansion concentric nebuliser, Cetac ASX 520 auto sampler and
Plasma lab Software was used for ICP-MS measurements. ICP-MS
measurements were carried out using the standard mode with Xi cones.
Elements that were measured: 98 Mo, 186 W. All standards and samples were
measured in triplicate, with relative standard deviations lower than 2%.
2.9 Polymerase chain reaction
MyTaq™ DNA polymerase (Bioline) was used for low fidelity PCR amplification.
Each 20 µl reaction was prepared on ice and contained 10 µl Mytaq polymerase
master mix (2x), 8.2 µl of nuclease free water, 0.4 µl of Forward primer (20 µM)
and 0.4 µl of Forward primer (20 µM) and 1 µl of DNA template (100 ng/µl). A
PCR program was run using a TC-512 Thermal cycler (Techne) consisting of an
initial denaturation step at 95oC for 120 s. This was followed by 35 cycles of
denaturation at 95oC for 15 s, template annealing at 59oC for 15 s and
polymerase extension at 72oC for 10 s. A final extension step at 72oC for 300 s
completed the program and the resultant product was visualised using agarose
gel electrophoresis.
2.10 Agarose gel electrophoresis
DNA was visualised using agarose gel electrophoresis, the negatively charged
phosphate backbone of DNA causes it to migrate to the anode in an applied
electric field whilst the physical properties of the gel cause slower migration of
larger DNA fragments allowing size separation. Agarose gels, 1% (w/v) were
made by melting 1.2 g of agarose in 120 ml TAE buffer (45 mM Tris-acetate, 1
mM EDTA, pH 8.0). When cool enough to avoid evaporation, 10 µl of 10 mg/ml
ethidium bromide (Sigma-Aldrich) was added for DNA visualisation. Loading
dye, (40% sucrose (w/v), 20% Orange G (w/v) 40% H2O) was mixed 1:10 with
DNA before loading on gel. Hyperladder™ 1 kb (Bioline) was run on all gels for
size identification. A voltage of 120 V was applied across the gel submerged in

80
TAE buffer and once complete a BioRad Gel Doc XR UV transilluminator and
BioRad Quantity One imaging software were used for visualisation.
2.11 Genomic DNA extraction
Genomic DNA extraction from WT Shewanella oneidensis MR-1 was performed
using a QIAGEN Genomic prep kit according to the manufacturer’s instructions,
DNA was notably eluted in nuclease free water, not the provided elution buffer,
to avoid interference with subsequent analysis. DNA was extracted from
bacterial culture derived from a single bacterial colony from an LB-agar plate
inoculated into 10 ml LB liquid culture grown aerobically at 30oC with agitation
for 24 h.
2.12 RNA extraction
Throughout the entire RNA extraction meticulously clean working conditions
were maintained to prevent RNAse contamination. All surfaces and equipment
were regularly cleaned with both Distel detergent (Tristel solutions) and RNase
Zap™ (Ambion) and filtered pipette tips were used exclusively (TipOne® range
from Starlab).
Cells were harvested at mid-exponential growth for RNA extraction, as
determined from previous growth studies, typically upon reaching an OD600 of
0.1. A 50 ml aliquot of culture was centrifuged at 5540 x g for 15 min at 4oC
before being added to a pestle and mortar filled with liquid nitrogen and
surrounded by solid carbon dioxide. The pellet was then ground to a fine dust in
the mortar before allowing the liquid nitrogen to evaporate and being
transferred to a 50 ml falcon tube. TRI reagent (Sigma) was added at 2 ml per
50 ml pellet followed by 0.4 ml chloroform (99.99% purity) the mix was then
vortexed for 15 s before centrifugation at 18000 x g for 10 min in a 5424
microcentrifuge (Eppendorf). The upper aqueous phase was then collected.
Direct-zol RNA extraction kit (Zymo Research) was then used according to the
manufacturer’s instructions, including a DNase treatment step using TURBO-
DNase (Ambion). RNA was eluted in nuclease free water to avoid interference
with subsequent analysis.

81
RNA quality and quantity were then confirmed using a combination of nanodrop
(Nanodrop One, ThermoScientific), Experion automated electrophoresis
(according to manufacturer’s instructions) and PCR (described above) using
primers for the constitutively expressed MtrA (SO_1777) to confirm absence of
gDNA. Primers used:
Table 2-3 PCR primers for SO_1777 fragment used as gDNA marker
Forward primer 5’ AAGAACTGCCTAAAAATGAAAAACCTA 3’
Reverse primer 5’ GCGCTGTAATAGCTTGCCA 3’
2.13 Reverse Transcription
All reagents supplied as part of SuperScript™ II Reverse Transcripase kit
(Invitrogen). RNA (2 µg) in 11 µl nuclease free water was combined with 1 µl 10
mM dNTPs and 1 µl Random primers (300 ng/µl) before incubation 5 min at
65oC, followed by 1 min on ice. To each reaction 4 µl 5x First strand buffer and 2
µl 0.1M Dithiothreitol were added. Reaction was then incubated at 25oC for 2
min before adding 1 µl Superscript™ II reverse transcriptase. Incubation steps
at 25oC for 12 min, 42oC for 50 min and 70oC for 15 min followed using a TC-512
Thermal cycler (Techne). After a final 2 min on ice, 180µl nuclease free water
was added to each reaction to complete cDNA preparation.
2.14 RT-qPCR
Real time quantitative PCR (Rt-qPCR) was performed using an AriaMx Real-
Time PCR system (Aligent technologies). Each 20 µl reaction contained 10 µl
SensiFAST mix (Bioline), 8.2 µl nuclease free water, 0.4 µl 20 µM Forward
primer, 0.4 µl 20 µM Reverse primer and 1 µl of template. The template was
either cDNA, one of a series of dilutions of gDNA (100 ng/µl – 0.1 ng/µl), water
in the case of a no template control (NTC) or mRNA in the case of a reverse
transcriptase control (RT). 96-well full-skirt plates (Bioline) were used for Real
time PCR reactions, sealed with multi-well caps (Bioline) and kept on ice
throughout preparation to avoid RNA degradation. The PCR program used
consisted of an initial denaturation step at 95oC for 3 min, followed by 40 cycles
of 95oC for 5 s, 60oC for 10 s, and 72oC for 5 s. During the run the system was set

82
to detect the florescence emitted by the SYBER Green dye as it intercalated in
the accumulating double stranded DNA.
Note that each gene investigated, including the housekeeping gene RecA,
required a distinct set of primers, detailed in Table 2-4.
Table 2-4 RT-qPCR primers for cDNA amplification
Primer name Primer sequence
SO_0101 Forward primer 5’ GCATTCCTTCTGGGTGTGAT 3’
SO_0101 Reverse primer 5’ GAGAATAGGCCGTCATGGAA 3’
SO_4509 Forward primer 5’ GCGACCCAATTTGAAACCTA 3’
SO_4509 Reverse primer 5’ CAATCCCCACCTTTTTAGCA 3’
SO_4513 Forward primer 5’ CGTAAAAACGGCGTGTACCT 3’
SO_4513 Reverse primer 5’ AGATTCGAATAGCGGCTGAA 3’
SO_3430 (RecA) Forward primer 5’ AACCCAGAAACCACAACG 3’
SO_3430 (RecA) Reverse primer 5’ ACCAACCACCTCATCACC 3’
To analyse the resultant data, standard curves were constructed for each
investigated gene by plotting Ct against gDNA concentration. Ct is defined as
the PCR cycle number when florescence exceeds an arbitrary threshold value.
From these calibration curves, the gradients were used to determine primer pair
efficiencies. All primer pairs used in the following work had primer efficiencies
between 96% and 100% allowing qualitative comparisons. Ct values for
unknown samples could then be used to interpolate a quantity of cDNA for each
gene. These absolute quantification values were then normalised to the
housekeeping gene RecA and the relative expression presented for discussion.
2.15 Cell preparation/quantification for colourimetric assays.
To prepare culture samples for assay analysis, 50 ml of culture grown for 24 h in
either LB or minimal media were centrifuged at 5540 x g for 15 min. Cell pellets
were then washed thrice, each wash consisting of centrifugation at 5540 x g for
15 min followed by resuspension in 2 ml of 100 mM HEPES pH7.2 to clean the
cells and remove metabolites. After the final wash cell pellets were either flash
frozen at -80oC for later use or for immediate use resuspended in 1ml of 100 mM

83
HEPES pH7.2. This preparation was used when describing whole cell samples
in subsequent colourimetric assays.
Pellets, rather than cell suspensions, were flash frozen in liquid nitrogen, as
when frozen in solution noticeable decreases in specific activity were observed.
Note that lysed and fractionated samples were not suitable for frozen storage as
evident by decreased FDH activities.
2.16 Cell lysis - Sonication
After preparatory washes described above, 25 µl of EDTA free protease inhibitor
cocktail (Roche), made from 1 tablet dissolved in 10 ml of distilled water was
added to prevent subsequent protein degradation. Cells were then sonicated
(SONICS Vc50) on ice for 40 s in 10 s bursts (25 Watts) to prevent heat
denaturation. Samples were kept on ice where possible after this step to try and
limit degradation.
2.17 Membrane separation for enzymatic localisation studies.
Following cell lysis by sonication described above, membrane components were
ultracentrifuged at 205,076 x g (42000 rpm) for 2 h (45Ti rotor, Beckman
Optima XL-100k). The supernatant was retained and represents the soluble
cellular fractions whilst the pelleted components represent membrane
containing fractions.
2.18 BCA assay
To determine protein concentration, BCA reagent (Sigma) was used according to
the manufacturer’s instructions. To do this, 25 ml of BCA reagent A was
combined with 500 μl 4% (w/v) copper (II) sulphate pentahydrate solution to
make a working reagent. 200 μl of this was combined with 25 μl of either BSA
standard or unknown sample and incubated at 37oC for 30 min for the
colorimetric change to develop. Unknown samples were run in quadruplet at
two different dilutions to ensure consistent estimations. The absorbance at 562
nm was then recorded using a plate reader (FLUOstar Omega, BMG Labtech) in
a Nunc™ 96-Well Polypropylene MicroWell™ plate (ThermoFisher Scientific)
without lid to avoid condensation issues. A 6 point standard curve was

84
generated using a serial dilution in the range of 1-0 mg/ml of BSA. This
produced a standard curve with an R2 value over 0.99. Unknown protein
concentrations were then interpolated from the standard curve. Note when
determining protein concentration in whole cell samples, these were first lysed
via sonication as described in 2.16.
2.19 Bradford assay
As a complementary technique to the BCA assay, Bradford reagent (BioRad)
was used according to the manufacturer’s instructions. A standard curve was
first generated using a serial dilution with a top standard of 10 µg ranging down
to 1 µg lysozyme, each standard was measured in triplicate. This produced a
standard curve with an R2 value over 0.99. Unknown samples were then
analysed in triplicate at two different volumes to ensure consistent estimations.
All Bradford assays were either run in 1.1 ml volumes in 1.5 ml cuvettes; 1 ml
Bradford reagent, 100 µl sample, or in a 96 well plate using a volume of 210 µl;
200 µl Bradford reagent, 10 µl sample. Regardless of scale, absorbance at 595nm
was recorded and protein concentrations interpolated from the standard curve.
2.20 FDH activity assay.
Assays were conducted in 4 ml glass cuvettes containing 1940 µl of 100 mM
HEPES pH 7.2, 10 µl 100 mM methyl viologen (Final: 0.5 mM) and 40 µl of
sample prepared as described above (either whole cells, lysed cells or cellular
fractions). Each cuvette was then sealed with a no.9 suba seal and three layers
of parafilm. Each cuvette was then sparged for 25 min under a N2 atmosphere to
remove any atmospheric oxygen. The cuvette was then inverted 5 times and
absorbance measured at 578 nm for 600 s with a 0.2 s interval between
measurements in a spectrophotometer (Hitachi U-3310). For the first 100 s the
background absorbance change was observed, After 100 s, 10 µl of 2 M Na
formate solution (Final: 10 mM) was added to the cuvette (which was taken out
and inverted 5 times before being returned. Note with substrate final reaction
volume was 2 ml. If FDH activity was present the absorbance at 578 nm rose
after substrate addition, the gradient of this first linear section of increasing
absorbance is referred to as an initial rate (v0) which can be used in a variety of

85
ways, either comparatively or to establish kinetic constants. A typical data plot
for formate oxidation is seen in Figure 2-2.
Figure 2-2 Typical Initial rate (v0) determination for formate oxidation assay.
Determined from first linear section of increasing absorbance after addition of 10mM formate at
100 s.
For studies involving azide inhibition of enzymatic activity, a 2 M stock of
sodium azide (Sigma) was added at appropriate concentrations to reaction
cuvettes before sparging with nitrogen. Assays were otherwise conducted as
previously described.
2.21 CO2 reductase activity assay
Assays were conducted in 4 ml glass cuvettes containing 1940 µl of 100 mM
HEPES pH 7.2, 10 µl 100 mM methyl viologen (Final: 0.5 mM) and 40 µl of
sample prepared as described above (either whole cells, lysed cells or cellular
fractions). Each cuvette was then sealed with a no.9 suba seal and three layers
of parafilm. Each cuvette was then sparged for 25 min under a N2 atmosphere to
remove any atmospheric oxygen. To each cuvette 2.5 µl of 100 mM dithionite
(125 μM in cuvette) was added using a microsyringe (Hamilton). The cuvettes
are allowed to stand for 15 min, being inverted 5 times every 5 min to allow
cellular background reduction reactions to plateau. The cuvette was then
inverted 5 times and absorbance measured at 578 nm for 600 s with a 0.2 s
0
0.1
0.2
0.3
0.4
0.5
0.6
0.7
0.8
0 50 100 150 200 250 300 350 400
Ab
so
rba
nce
at 5
78
nm
Time (s)
m = v0

86
interval between measurements in a spectrophotometer (Hitachi U-3310). For
the first 100 s the background absorbance change was observed. After 100 s, 10
µl of 2 M Na carbonate solution (Final: 10 mM) were added to the cuvette (which
was taken out and inverted 5 times before being returned. Note with substrate
final reaction volume was 2 ml. If CO2 reductase activity was present the
absorbance at 578 nm fell after substrate addition, the gradient of this first
linear section of decreasing absorbance is referred to as an initial rate (v0) which
can be used in a variety of ways, either comparatively or to establish kinetic
constants. A typical data plot for CO2 reduction is seen below in Figure 2-3.
Figure 2-3 Typical Initial rate (v0) determination for CO2 reduction assay.
Determined from first linear section of decreasing absorbance after addition of 10mM carbonate at
100 s.
For studies involving azide inhibition of enzymatic activity, a 2 M stock of
sodium azide (Sigma) was added at appropriate concentrations to reaction
cuvettes before sparging with nitrogen. Assays were otherwise conducted as
previously described.
2.22 Fumarate reductase activity assay
Fumarate reductase activity was assayed using methyl viologen, using the same
procedure followed for CO2 reduction assays, only replacing the sodium
carbonate substrate with sodium fumarate 99.5% (Sigma).
0
0.2
0.4
0.6
0.8
1
1.2
0 50 100 150 200 250
Absorb
ance a
t 5
78nm
Time (s)
m = v0

87
2.23 Specific activity calculations
Once initial rates had been determined for formate oxidation and CO2 reduction
as absorbance/min further analysis was required to convert into specific activity
values. This was done as follows.
By rearranging the Beer-Lambert law, absorbance (A) can be expressed below in
eq. (2.2)
𝐴 = 𝐶 (𝑚𝑀) × 𝜀 (𝑚𝑀−1𝑐𝑚−1) × 𝑙 (𝑐𝑚) (2.2)
Where C represents concentration and ε the extinction coefficient at 578 nm,
9.7 mM-1 cm-1 for methyl viologen (de Bok et al. 2003) and the path length (l) is 1
cm. By rearranging eq. (2.2) and introducing a time component to give eq. (2.3),
rates with units of mM/min are calculated.
𝛥𝐶 (𝑚𝑀 𝑚𝑖𝑛−1) =
𝛥𝐴 (𝑚𝑖𝑛−1)
𝜀 (𝑚𝑀−1𝑐𝑚−1) × 𝑙 (𝑐𝑚) (2.3)
Since mM = mmol/L = µmol/ml, the units of these measurements can also be
written as µmol ml-1min-1. As each reaction was conducted in a 2 ml cuvette,
multiplication by 2 converts to µmol min-1 values, i.e. a quantitative amount of
product formed in each reaction. Since each reaction contains 0.04 ml of sample,
division by 0.04 converts to µmol min-1 ml-1. Since the protein concentration
(mg/ml) in each sample had been determined using the described BCA assay,
division by these values provided specific activities in µmol min-1 mg-1 for
formation of either the methyl viologen mono-cation (in the case of formate
oxidation) or di-cation (for CO2 reduction). However since formate oxidation or
CO2 reduction are two electron processes, only half the concentration of product
will be formed relative to the associated change in measured colourimetric
product, this is reflected in the presented specific activities for formate oxidation
and CO2 reduction throughout this work.
2.24 Enzymatic pH dependence studies
For investigating pH dependence for enzymatic assays, 100 mM HEPES was
replaced with Mcilvaine buffers of varying pH values, made using varying

88
concentrations of 0.2 M Na2HPO4 and 0.1 M citric acid solutions (McIlvaine
1921). Both solutions were made using analytical grade water and all pH values
verified before use.
2.25 NMR
For NMR confirmation of formate production for CO2 reductase activity,
reactions were conducted in 1.5 ml Eppendorfs in an anaerobic environment
(UniLabPlus ECO Glovebox workstation, MBraun) with oxygen levels below 0.5
ppm throughout.
Each reaction contained 1 ml of 100 mM HEPES pH7.2, and where appropriate,
combinations of 0.5 mM methyl viologen, 5 mM sodium dithionite, 10 mM
carbonate, 20 mM sodium azide and 20 µl of 1 mg/ml protein whole cell samples,
where the protein concentration was determined by BCA assay and all samples
from different growth conditions diluted to 1 mg/ml with 100 mM HEPES pH7.2
prior to the experiment. In each case, the substrate, i.e. sodium carbonate, was
added last with 5 inversions of each reaction to mix. Each reaction was allowed
to proceed for 30 min at 20oC in the anaerobic glovebox before anaerobic
centrifugation in a 5424 microcentrifuge (Eppendorf) at 14000 x g for 10 min.
Subsequently 400 µl of the reaction supernatant was mixed with an equal
volume of NMR buffer containing 22 mM NaH2PO4, 80 mM K2HPO4, 14 mM
sodium azide and 1 mM trimethylsilylpropanoic acid (TSP) which acted as an
internal NMR reference. Once mixed with buffer samples were flash frozen and
stored at -20oC.
NMR Samples were run by the Quadram Institute of Bioscience, (previously the
Institute for Food Research, Norwich). For analysis, samples were transferred to
5 mm NMR tubes. 1H NMR spectra were recorded at 600 MHz on a Bruker
Avance spectrometer with cryoprobe (Bruker BioSpin) using Topspin 2.0
software. Each 1H NMR spectrum was acquired with 64 scans, a spectral width
of 12300 Hz, an acquisition time of 2.7 s, and a relaxation delay of 3.0 s. The
“noesypr1d” presaturation sequence was used to suppress the residual water
signal with a low-power selective irradiation at the water frequency during the
recycle delay and a mixing time of 10 ms. Spectra were transformed with a 0.3
Hz line broadening, manually phased, baseline corrected, and referenced by
setting the TSP methyl signal to 0 ppm. Formate was quantified using the

89
software Chenomx NMR suite 7.6™ using characteristic resonance peaks and
their relative amplitudes to known calibration concentrations.
2.26 Kinetic analysis
For determining kinetic parameters, specific activities were plotted for varying
concentrations of substrate, determined in triplicate, and data were fitted by
OriginPro 8.5 software to the Nonlinear curve fit:Hyperbl function, to represent
the Michaelis-Menten eq. (2.4) below:
𝑣0 =
𝑉𝑚𝑎𝑥 [𝑆]
𝐾𝑚 + [𝑆] (2.4)
Where v0 is the initial reaction rate, Vmax is the maximum reaction rate, [S] is
the substrate concentration, and Km is the Michaelis constant (Schnell & Maini
2003). When varying substrate concentrations for these experiments substrates
were prepared in a serial dilution to avoid changes in total reaction volume
greater than 10 µl.
2.27 Purification of SO_4513
2.27.1 Growth and lysis
In 5 L Durans, 10 L of an MR-1 mutant containing only the SO_4513-4515 FDH
isoform, i.e a SO_450101-0103 and SO_4509-4511 deletion strain (Fdh2+), was
grown in minimal media anaerobically as described in section 2.4 at 30oC for 22
h.
After growth cells were pelleted aerobically (5540 x g for 20 min, 8oC, JLA8.100
rotor, Beckman Avanti J-20) before resuspending combined pellets in 100 ml of
100 mM HEPES pH7.2. Cells were resuspended/washed three times with 100
ml of 100 mM HEPES pH7.2 buffer, re-pelleting cells between each wash by
centrifuging at 5540 x g for 15 min. This was to remove media contaminants
which can interfere with subsequent assays
Before lysis, 4 mM Dithiothreitol (DTT) and 500 µl of EDTA free protease
inhibitor cocktail (Roche), made from 1 tablet dissolved in 10 ml of distilled
water, were added to 50 ml of cell concentrate. DTT was added to help maintain
a reducing environment for the protein, an important factor for other FDH

90
purifications (Jormakka et al. 2002), and the protease inhibitor prevents protein
degradation by intracellular proteases released by cell lysis.
Cells were then lysed, keeping lysate on ice throughout. The cell concentrate
was passed through a chilled French press cell disruptor (Thermo Fisher) set at
16000 psi twice, producing a transparent red lysate.
Performing the above cell harvesting and lysis purification steps under
anaerobic conditions had no effect on measured FDH/CO2 reductase activities,
subsequent purification steps however required anaerobic conditions to avoid
loses in activity. Even so, harvesting and lysis were performed quickly followed
by sparging of the lysate with N2 for 15 min in suba sealed (no.53) falcon tubes
to remove atmospheric oxygen. All purification steps from this point were
conducted in a glovebox (Belle) with oxygen levels below 20 ppm throughout.
Aerobic preparations from this point onwards rapidly lost all observable
enzymatic activity.
2.27.2 Cell fractionation and inner-membrane solubilisation.
To remove unlysed cells and aggregated cell debris, lysate was sealed
anaerobically and centrifuged at 5540 x g for 15 min. The supernatant was then
anaerobically diluted to 56 ml using 100 mM HEPES pH7.2 and
ultracentrifuged at 205,076 x g (42000 rpm) for 2 h (45Ti rotor, Beckman
Optima XL-100k). The supernatant following this ultracentrifugation step is
henceforth referred to as the soluble fraction, i.e. anything that did not pellet
with the membranes during this procedure.
To limit soluble fraction carryover, the membrane fraction pellet was gently
washed with 1 ml of 100 mM HEPES pH 7.2 buffer, being careful not to disturb
the pellet. Subsequently the pellet was resuspended in 56 ml of 20 mM MES
pH6 with 5 mg/ml sodium lauroyl sarcosinate (sarkosyl) and mixed by agitation
in a beaker for 1 hour in the glovebox at ambient temperature (20oC). This step
exploits the preferential solubilisation of bacterial inner membranes over outer
membranes by sarkosyl (Brown et al. 2010). After this solubilisation step
membranes were ultracentrifuged at 45000 x g (19700 rpm ) for 1 hour (45Ti
rotor, Beckman Optima XL-100k). The pelleted material is henceforth referred

91
to as the outer membrane fraction, and the supernatant referred to as the inner
membrane fraction assuming the selective solubilisation described above.
2.27.3 Anion exchange chromatography
Anion exchange chromatography was used to purify SO_4513 from inner
membrane fractions. A 5 ml Q sepharose HP cartridge column was used in
combination with an ÄKTA prime plus (GE Healthcare) within a glovebox
(Belle). All steps were carried out with a flowrate of 1 ml/min. Initially the
column was equilibrated using 25 ml of loading buffer, (20 mM MES buffer pH 6
containing 0.01% DDM and 25 mM NaCl). Once equilibrated, 10 ml of inner
membrane fraction was loaded onto the column, followed by a further 25 ml of
loading buffer, to remove any non-bound material. Bound SO_4513 was then
eluted in 20 ml of elution buffer, (identical to loading buffer but containing 415
mM NaCl), This 20 ml elution was collected following a rise in absorbance at
280 nm using the integrated UV detector.
2.27.4 Size exclusion chromatography
Following the anion exchange separation detailed above, SO_4513 was further
purified using a Superdex 200 25 ml size exclusion column. In order to load onto
this column the previous 20 ml of purified protein from the Q sepharose column
was concentrated down to a combined volume of 0.5 ml using 0.5 ml centrifugal
filters (Amicon) which theoretically remove molecules less than 50 kDa in size.
This concentration step was performed anaerobically in a 5424 microcentrifuge
(Eppendorf) at 14000 x g.
The size exclusion column was run anaerobically in a glovebox (Belle) using an
ÄKTA prime plus (GE Healthcare) with all steps carried out with a flow rate of
0.3 ml/min. Initially the column was equilibrated with 75 ml of size exclusion
buffer (20 mM HEPES pH7.2 containing 0.01% DDM and 150 mM NaCl). Once
equilibrated the protein sample was loaded using a sample loop onto the
column. Once loaded, 0.5 ml fractions of eluent were collected using a fraction
collector, monitoring absorbance at 280 nm and conductivity. SO_4513 eluted
after 15 ml of buffer had been collected, in the first of two UV absorbance peaks.
Fractions containing FDH activity, determined using the described methyl
viologen assay, were combined and concentrated using 0.5 ml centrifugal filters
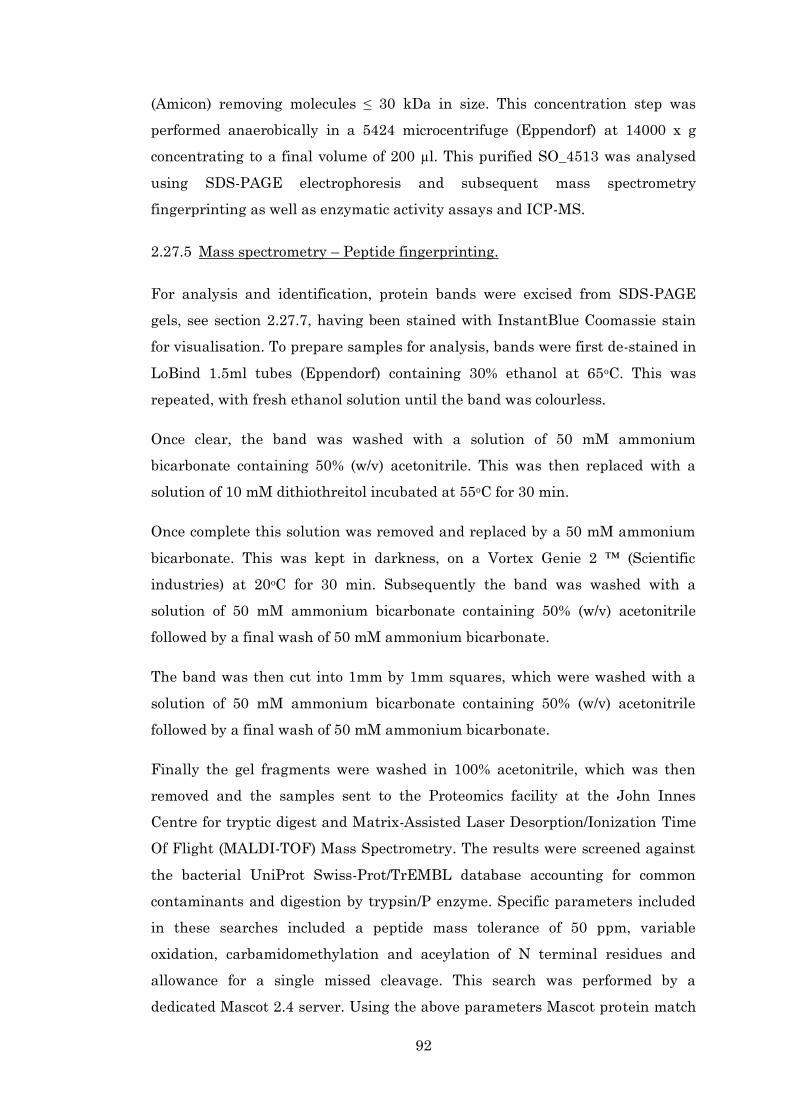
92
(Amicon) removing molecules ≤ 30 kDa in size. This concentration step was
performed anaerobically in a 5424 microcentrifuge (Eppendorf) at 14000 x g
concentrating to a final volume of 200 µl. This purified SO_4513 was analysed
using SDS-PAGE electrophoresis and subsequent mass spectrometry
fingerprinting as well as enzymatic activity assays and ICP-MS.
2.27.5 Mass spectrometry – Peptide fingerprinting.
For analysis and identification, protein bands were excised from SDS-PAGE
gels, see section 2.27.7, having been stained with InstantBlue Coomassie stain
for visualisation. To prepare samples for analysis, bands were first de-stained in
LoBind 1.5ml tubes (Eppendorf) containing 30% ethanol at 65oC. This was
repeated, with fresh ethanol solution until the band was colourless.
Once clear, the band was washed with a solution of 50 mM ammonium
bicarbonate containing 50% (w/v) acetonitrile. This was then replaced with a
solution of 10 mM dithiothreitol incubated at 55oC for 30 min.
Once complete this solution was removed and replaced by a 50 mM ammonium
bicarbonate. This was kept in darkness, on a Vortex Genie 2 ™ (Scientific
industries) at 20oC for 30 min. Subsequently the band was washed with a
solution of 50 mM ammonium bicarbonate containing 50% (w/v) acetonitrile
followed by a final wash of 50 mM ammonium bicarbonate.
The band was then cut into 1mm by 1mm squares, which were washed with a
solution of 50 mM ammonium bicarbonate containing 50% (w/v) acetonitrile
followed by a final wash of 50 mM ammonium bicarbonate.
Finally the gel fragments were washed in 100% acetonitrile, which was then
removed and the samples sent to the Proteomics facility at the John Innes
Centre for tryptic digest and Matrix-Assisted Laser Desorption/Ionization Time
Of Flight (MALDI-TOF) Mass Spectrometry. The results were screened against
the bacterial UniProt Swiss-Prot/TrEMBL database accounting for common
contaminants and digestion by trypsin/P enzyme. Specific parameters included
in these searches included a peptide mass tolerance of 50 ppm, variable
oxidation, carbamidomethylation and aceylation of N terminal residues and
allowance for a single missed cleavage. This search was performed by a
dedicated Mascot 2.4 server. Using the above parameters Mascot protein match

93
scores greater than 85 were judged to be significant (p<0.05). In the case of
SO_4513 identification a score of 125 was obtained.
2.27.6 Acid digestion for ICP-MS protein analysis.
To determine the metal content of purified SO_4513 protein, 100 µl of 3 µM
protein was added to an equal volume of 35% nitric acid and incubated at 95oC
for 90 min. Once cooled the sample was centrifuged in a 5424 microcentrifuge
(Eppendorf) at 14000 x g for 10 min. The supernatant (200 µl) was added to
1800 µl analytical grade water (Fisher) and the sample run according to the
ICP-MS procedure detailed in 2.8. In addition to the protein sample, pure
analytical water and standard solutions containing known concentrations of W
and Mo were also run as negative and positive controls respectively.
2.27.7 SDS-PAGE
To separate protein samples by size, sodium dodecyl sulphate polyacrylamide
gel electrophoresis (SDS-PAGE) was used. Polyacrylamide gels consisted of two
parts, the lower resolving gel, which separates depending on proteins
differential rates of migration through an acrylamide gel, exploiting the fact
that the detergent SDS binds the hydrophobic regions of peptides (Rath et al.
2009) and confers an approximately uniform net negative charge. The upper
stacking gel aligns all protein samples by concentrating them between charge
fronts that occur under an applied potential at pH 6.8 allowing for higher
resolution separation.
Prior to loading on SDS-PAGE gels, samples were denatured by incubation at
70oC for 15 min in TruPAGE™ LDS Sample Buffer (Sigma) supplemented with
TruPAGE™ DTT Sample Reducer (Sigma) according to the manufacturer’s
instructions.
For images prepared for this work, precast TruPAGE™ 4-20% polyacrylamide
gradient gels (Sigma) were used, run submerged in TruPAGE™ TEA-Tricine
SDS Running Buffer (Sigma) in a Mini-protean II gel electrophoresis tank
(BioRad). Gels were run for 70 min at 180 V before staining with InstantBlue
Coomassie stain (Expedeon) for 60 min on a rocking platform before being
washed and stored in analytical grade water (Fisher).

94
2.28 Electrochemical cell design
All electrochemical investigations were conducted in a three electrode
bioreactor. This bioreactor was specifically designed to facilitate these and
future whole cell biochemical experiments and for which a scheme is shown in
Figure 2-4.
Figure 2-4 Schematic of bioreactor used for electrochemical studies.
Where R, W and C represent reference, working and counter electrodes respectively and 1, 2 and 3
are the remaining apertures for gas/substrate injections during experiments.
To ensure correct potential measurement the reference electrode was designed
to be located as close to the working electrode as possible and outside the path of
ion migration between WE and CE. This was done to limit the resistance of the
electrolyte between WE and RE causing unwanted decreases in the solution
potential according to Ohm’s law (Harnisch & Freguia 2012).
The cell itself was made in house (University of East Anglia Chemistry
Department). The inverted truncated cone shaped reaction chamber holds a
maximum volume of 55 ml (working volume 30 ml) and the flattened base
allows optional stirring using a magnetic micro stirrer.
An outer water sleeve enables temperature control via an external water bath
since more typical incubation methods used for bacterial study are logistically
challenging in an anaerobic environment. Cast in one piece the top face contains
five apertures, with either a 15mm glass screw thread fitting (for working and

95
reference electrode) or 13 mm glass screw thread fitting (for counter electrode
and remaining apertures). The apertures not containing electrodes are designed
for experimental flexibility, two allow for continual gas purging of the cells
should the bioreactors be used outside the glovebox and the last allows additions
to be made throughout experiments. These apertures are sealed with suba seals
(no. 9) during all described experiments and along with all electrodes are
further sealed from the external environment with parafilm.
Before each electrochemical experiment each bioreactor was thoroughly cleaned
by washing 5 times with ethanol 99.9% (Sigma) followed by a further 5 washes
with analytical water, with a resistance below 18.2 MΩ.cm. Remaining water
was then evaporated using argon gas. The working, counter and reference
electrodes are then assembled as described below and the assembly transferred
to the glovebox. Oxygen levels were below 10 ppm throughout all conducted
experiments.
Throughout these experiments 102 mm long, 6.15 mm diameter 99.9995%
graphite rods (Alfa Aesar) were used as working electrodes. Before use each was
polished 10 times with cotton wool coated in aluminium oxide 99.99% (Alfa
Aesar) before sonication for 30 s to remove loose imperfections. This polishing
step was repeated a further 3 times before rinsing the electrode in analytical
water and assembling in the bioreactor with a silicone rubber ring (SciLabware
Limited) and cap, further sealed by parafilm.
During each experiment a 7.5 mm Ag/AgCl saturated KCl ‘’Red Rod’’ reference
electrode (Radiometer analytical) was used. After ensuring each electrode
contained saturated KCl solution, indicated by KCl crystals, the reference
electrode was rinsed with analytical water and assembled in the bioreactor with
a silicone rubber ring (SciLabware Limited) and cap, further sealed by parafilm.
To convert potentials quoted against this electrode 197 mV was added to all
measurements to provide values quoted against SHE (Field et al. 2005).
The counter electrode in all electrochemical studies was made of 10 cm of
platinum wire, 0.25mm diameter, 99.9% purity (Sigma Aldrich) threaded
through a plastic sleeve filled with the same electrolyte as the remainder of the
bioreactor, typically 100mM HEPES, 8.7 mM NH4Cl, 1.3 mM K2HPO4, 1.7 mM
KH2PO4 and 1mM MgSO4, pH7.2. The counter electrode was isolated from the

96
analyte by a CoralPor tip (Basi), a porous glass frit commonly used for such
purposes (Mousavi & Bühlmann 2013). The counter electrode was then
assembled in the bioreactor with a silicone rubber ring (SciLabware Limited)
and cap, further sealed by parafilm.
Each electrochemical experiment contained 30 ml of aqueous electrolyte solution
containing 100mM HEPES, 8.7 mM NH4Cl, 1.3 mM K2HPO4, 1.7 mM KH2PO4
and 1mM MgSO4, pH7.2, i.e. the components of the previously described
minimal media without minerals, vitamins, carbon source, electron donor or
acceptor. Due to the high buffer concentration pH values, determined by pH
probe, did not change by more than 0.1 pH unit from the start to finish of any
electrochemical experiment or upon addition of any cell cultures or substrate
additions. Experiments were conducted in a faradaic cage to limit electrical
interference.
Electrochemical measurements were either made using a DropSens
Multipotentiostat μStat 8000P potentiostat (Metrohm) controlled by Dropview
8400 software or an Autolab AUT73338 potentiostat (Metrohm) using NOVA 1.0
software. In both cases the same three electrode cells described above were
used. The AUT73338 equipment was predominantly used for its higher
sensitivity and was used unless specified otherwise, the multichannel
equipment was reserved for those experiments requiring faster throughput and
which are highlighted as such in the results.
2.29 Bacterial culture for electrochemistry
Cultures used for electrochemical experiments were grown anaerobically using
50 mM sodium fumarate as electron acceptor according to the above protocols
for S.oneidensis culture in minimal media. Unless specified otherwise cultures
were grown in 1L Durans supplemented with 3 µM sodium tungstate (+W) for
24 h before harvesting for electrochemical study. After growth cells were
pelleted aerobically (5540 x g for 20 min, 8oC, JLA8.100 rotor, Beckman Avanti
J-20).
Cell pellets for each litre of culture were resuspended/washed three times with
25ml of 100 mM HEPES, 8.7 mM NH4Cl, 1.3 mM K2HPO4, 1.7 mM KH2PO4 and
1mM MgSO4, , pH7.2., (the same electrolyte used in bioreactors), re-pelleting

97
cells between each wash by centrifuging at 5540 x g for 15 min. This was to
remove media contaminants and substrates which can interfere with
electrochemical analysis. Each litre pellet was finally resuspended in 2 ml of
electrolyte. To ensure normalisation cultures were diluted so cell suspensions of
the same OD were introduced into the electrochemical cells, subsequent
analysis showed comparable protein content (20 mg/ml) as determined by BCA
assay. When adding such cultures to bioreactors 2 ml of previous electrolyte was
removed and replaced by 2 ml of S.oneidensis culture (inoculum), maintaining a
reaction volume of 30 ml.
2.30 Cyclic voltammetry
Typical cyclic voltammetry staircase experiments were conducted for the
bioreactor set up described above. Each study consisted of two complete scans
using the following parameters; Initial potential (Lower vertex potential, E1) -
0.76 vs Ag/AgCl (Sat KCl), Final potential (Upper vertex potential, E2) 0.22 vs
Ag/AgCl (Sat KCl), Step potential: 1mV/s, Scan rate (v): 1mV/s. For those
experiments when scan rate was increased, the step potential was scaled
accordingly. All experiments were conducted anaerobically with O2 levels below
10 ppm at 25oC.
2.31 Chronoamperometry
Chronoamperometry experiments were conducted for the bioreactor set up
described above. After poising the working electrode at -0.757 vs Ag/AgCl (Sat
KCl)(-0.56 V vs SHE) the system was allowed to equilibrate for 5 s before
current measurements were taken either every second or 2 min for extended
poise experiments. All experiments were conducted anaerobically with O2 levels
below 10 ppm at 25oC.
2.32 First derivative of Cyclic voltammetry traces
Postacquisition analysis of CV data to determine first derivative plots of the
catalytic current with respect to applied potential was performed using
OriginPro 8.5 software. Derivative data was determined using the mathematics:
differentiation tool followed by first order Savitsky-Golay smoothing of data
using a 50 point window. Smoothened plots were used only to limit background

98
noise and were individually confirmed not to mask or distort peak features from
unsmoothed datasets.
2.33 Integration of chronoamperometry data.
Postacquisition integration of chronoamperometry data to determine the charge
transferred to analyte after addition of sodium carbonate was performed using
OriginPro 8.5 software. This was done using the integration gadget, using the
absolute area determination and integrating using a constant Y axis value as a
baseline, the choice of baseline was determined by the capacitive current
observed prior to addition of sodium carbonate and was typically defined as -4
µA.

99
2.34 References
de Bok, F. a. M. et al., 2003. Two W-containing formate dehydrogenases (CO2-reductases) involved
in syntrophic propionate oxidation by Syntrophobacter fumaroxidans. European Journal of
Biochemistry, 270(11), pp.2476–2485.
Brown, R.N. et al., 2010. Mapping the subcellular proteome of Shewanella oneidensis MR-1 using
Sarkosyl-based fractionation and LC-MS/MS protein identification. Journal of Proteome
Research, 9(9), pp.4454–4463.
Field, S.J. et al., 2005. Reductive activation of nitrate reductases. Dalton Transactions, 2005(21),
pp.3580–3586.
Harnisch, F. & Freguia, S., 2012. A basic tutorial on cyclic voltammetry for the investigation of
electroactive microbial biofilms. Chemistry, an Asian journal, 7(3), pp.466–75.
Jormakka, M. et al., 2002. Purification and crystallization of the respiratory complex formate
dehydrogenase-N from Escherichia coli. Acta Crystallographica Section D: Biological
Crystallography, 58(1), pp.160–162.
Kane, A.L. et al., 2016. Formate metabolism in Shewanella oneidensis generates proton motive
force and prevents growth without an electron acceptor. Journal of Bacteriology, 198(8),
pp.1337–1346.
McIlvaine, T., 1921. A buffer solution for colorimetric comparison. Journal of Biological
Chemistry, pp.183–186.
Monod, J., 1949. The growth of bacterial cultures. Annual Reviews in M, 3(Xl), pp.371–394.
Mousavi, M.P.S. & Bühlmann, P., 2013. Reference electrodes with salt bridges contained in
nanoporous glass: An underappreciated source of error. Analytical Chemistry, 85(19),
pp.8895–8901.
Owens, J.D. & Legan, J.D., 1987. Determination of the Monod substrate saturation constant for
microbial growth. FEMS Microbiology Reviews, 46, pp.419–432.
Rath, A. et al., 2009. Detergent binding explains anomalous SDS-PAGE migration of membrane
proteins. Proceedings of the National Academy of Sciences of the United States of America,
106(6), pp.1760–5.
Richardson, D.J. et al., 2012. Exploring the biochemistry at the extracellular redox frontier of
bacterial mineral Fe(III) respiration. Biochemical Society transactions, 40(3), pp.493–500.
Saltikov, C.W. & Newman, D.K., 2003. Genetic identification of a respiratory arsenate reductase.
Proceedings of the National Academy of Sciences of the United States of America, 100(19),
pp.10983–8.
Schnell, S. & Maini, P.K., 2003. A Century of Enzyme Kinetics: Reliability of the Km and Vmax
Estimates. Comments on Theoretical Biology, 8, pp.169–187.
Zwietering, M.H. et al., 1990. Modeling of the bacterial growth curve. Applied and Environmental
Microbiology, 56(6), pp.1875–1881.

100
3 FDH characterisation in WT
Shewanella oneidensis MR-1 in
response to metal supplementation
3.1 Media optimisation
In order to study formate metabolism in S.oneidensis MR-1 it was necessary to
develop an appropriate growth medium. Although many types of minimal media
have been used for study of growth of S.oneidensis in the past almost all use
lactate or pyruvate as the principal energy and carbon source (Pinchuk et al.
2011). Since this investigation was focused on the role of formate, a media using
formate as the sole energy source was developed.
Anaerobic growth conditions were used for growth studies due to the proposed
role of formate in S.oneidensis and its main function contributing to anaerobic
respiration and maintenance of proton motive force (Kane et al. 2016). The
media was developed using fumarate as a terminal electron acceptor under
anaerobic conditions, as opposed to aerobically using oxygen. No growth was
observed with aeration, either in the presence or absence of fumarate (Figure
3-1 panel A), suggesting the unsuitability of this media for aerobic growth, and
in agreement with the importance of formate in menaquinone coupled
anaerobic, and not aerobic, respiration (Kane et al. 2016) when the alternative
ubiquinone pool is used (Chen & Wang 2015).
A major consideration for these experiments was the importance of the metals
tungsten and molybdenum, essential cofactors for all identified putative FDH
enzymes in the genome of S.oneidensis. Since this study aimed to examine the
impact of each metal it was vital to develop a media without significant traces of
either. This proved difficult, despite use of analytical grade water and acid
washed equipment, due to the tryptic digests within earlier media iterations,
which contained µM concentrations of metal yet were essential carbon sources.
These are replaced in the final iteration by the addition of three amino acids,
Glutamine, Serine and Arginine which provide the same function yet contain
comparatively lower metal traces. Figure 3-1B demonstrates the importance of
each of these media components, the electron donor sodium formate, electron
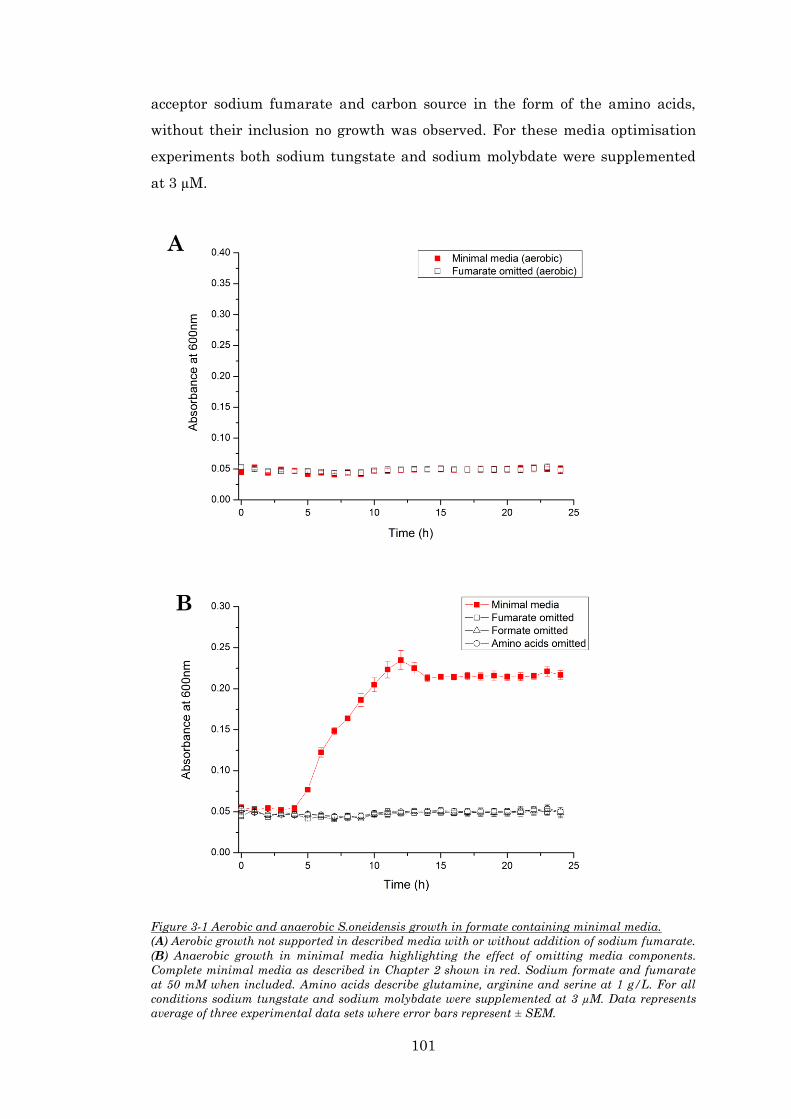
101
acceptor sodium fumarate and carbon source in the form of the amino acids,
without their inclusion no growth was observed. For these media optimisation
experiments both sodium tungstate and sodium molybdate were supplemented
at 3 µM.
Figure 3-1 Aerobic and anaerobic S.oneidensis growth in formate containing minimal media.
(A) Aerobic growth not supported in described media with or without addition of sodium fumarate.
(B) Anaerobic growth in minimal media highlighting the effect of omitting media components.
Complete minimal media as described in Chapter 2 shown in red. Sodium formate and fumarate
at 50 mM when included. Amino acids describe glutamine, arginine and serine at 1 g/L. For all
conditions sodium tungstate and sodium molybdate were supplemented at 3 µM. Data represents
average of three experimental data sets where error bars represent ± SEM.
B
A

102
3.2 Determination of Monod constant for formate.
Once a suitable growth medium was established, i.e. that described in section
3.1, using 50 mM fumarate as terminal electron acceptor, an optimal amount of
formate for growth was determined. As can be seen in Figure 3-2A, maximal
OD600 values were obtained when media contained 50 mM formate or higher,
hence for all subsequent minimal media experiments, 50 mM sodium formate
was used as electron donor for growth. By plotting the specific growth rate (µ)
against concentration of formate it is possible to graphically represent the
Monod equation. This is seen in Figure 3-2B with the derived µmax, 0.272 ± 0.024
h-1, (the maximum specific growth rate of S.oneidensis on formate under these
growth conditions) and the Ks (Monod constant) of 20.3 ± 6 mM (SEM) (which
corresponds to the concentration of formate when the specific growth rate is half
that of µmax). Both these cellular kinetic coefficients are direct parallels to the
more commonly encountered Vmax and Km found in enzyme kinetics.

103
Figure 3-2 Anaerobic S.oneidensis growth in minimal media with sodium formate.
(A) Growth curves with increasing formate concentration. Maximum OD600 becomes independent of
formate concentration above 50 mM, shown in red. For all conditions sodium tungstate and
sodium molybdate were supplemented at 3 µM with sodium fumarate as electron acceptor Data
represents average of three experimental data sets where error bars represent ± SEM. (B)
Determination of Monod constant. Plot of specific growth rate, µ, determined from (A) as described
in Chapter 2 plotted against formate concentration in media. Average of three experimental data
sets shown where error bars represent ± SEM. Data was then fitted by OriginPro 8.5 software to
Michaelis-Menten hyperbolic function shown in red. From this the Ks and µmax were determined as
described in the text.
B
A

104
3.3 Growth studies with metal supplementation
Having established a suitable growth medium, the effect of W and Mo
supplementation in the optimised media was investigated. Note that for both
metals, as in previous experiments, the more bioavailable sodium salts of these
metals were used in the form of sodium tungstate and sodium molybdate. The
majority of minimal bacterial growth media only include low µM concentrations
of these metals, typically in the range of 0.3 µM to 3 µM, only ranging higher in
dedicated studies, (Laukel et al. 2003)(Gates et al. 2003)(Kouzuma et al. 2010).
Typically only molybdate is included in many experiments, with tungstate only
rarely considered (Kisker et al. 1997). Considering this, the following
experiments were supplemented with 3 µM tungstate and/or molybdate.
Figure 3-3 shows the effect on growth when 3 µM tungstate (+W), 3 µM
molybdate (+Mo), 3 µM of both metal ions (+W/+Mo) or neither metal ions (-W/-
Mo) are added to cultures. Notably all four growth conditions supported growth.
This deserves attention as the growth condition containing no supplementation
(-W/-Mo) was capable of growth on formate, despite apparently lacking the
essential metals needed for its enzymatic oxidation. When supplemented with
solely tungstate, growth is almost indistinguishable from non-supplemented
cultures, this is also true for cultures supplemented with tungstate and
molybdate. The only observed increase in growth was when supplemented with
molybdate alone.
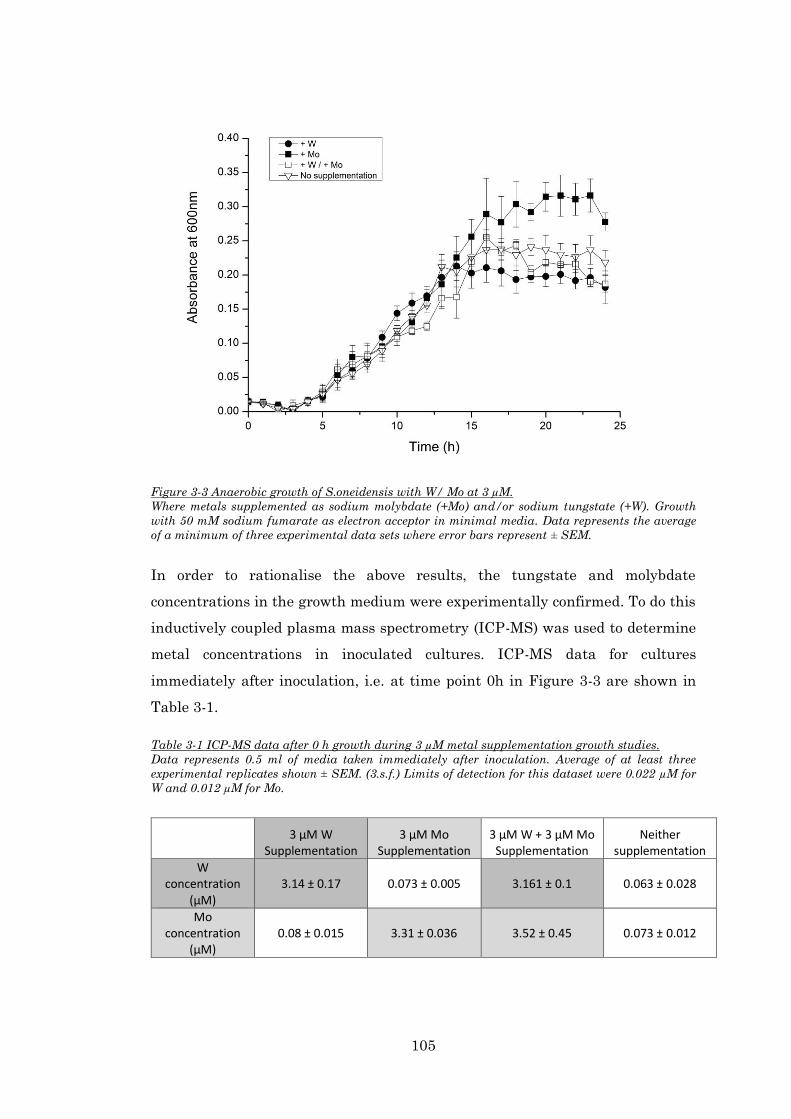
105
Figure 3-3 Anaerobic growth of S.oneidensis with W/ Mo at 3 µM.
Where metals supplemented as sodium molybdate (+Mo) and/or sodium tungstate (+W). Growth
with 50 mM sodium fumarate as electron acceptor in minimal media. Data represents the average
of a minimum of three experimental data sets where error bars represent ± SEM.
In order to rationalise the above results, the tungstate and molybdate
concentrations in the growth medium were experimentally confirmed. To do this
inductively coupled plasma mass spectrometry (ICP-MS) was used to determine
metal concentrations in inoculated cultures. ICP-MS data for cultures
immediately after inoculation, i.e. at time point 0h in Figure 3-3 are shown in
Table 3-1.
Table 3-1 ICP-MS data after 0 h growth during 3 µM metal supplementation growth studies.
Data represents 0.5 ml of media taken immediately after inoculation. Average of at least three
experimental replicates shown ± SEM. (3.s.f.) Limits of detection for this dataset were 0.022 µM for
W and 0.012 µM for Mo.
3 µM W Supplementation
3 µM Mo Supplementation
3 µM W + 3 µM Mo Supplementation
Neither supplementation
W concentration
(µM) 3.14 ± 0.17 0.073 ± 0.005 3.161 ± 0.1 0.063 ± 0.028
Mo concentration
(µM) 0.08 ± 0.015 3.31 ± 0.036 3.52 ± 0.45 0.073 ± 0.012

106
Expected metal concentrations match those determined using ICP-MS (Table
3-1). However, it is also noticeable that even without supplementation traces of
tungstate and molybdate remain at around 70-80 nM. Considering these
samples are from inoculated cultures these traces could originate from either
the inoculum, despite prior wash steps, or the media itself.
To try and clarify this point ICP-MS was also conducted on media prior to
inoculation and on the inoculum independently. The media contained 74 nM ±
15 (SEM) Mo and 112 nM ± 21 (SEM) W suggesting the cause of the trace
amounts of metal were due to components of the media itself rather than metal
carry over from the inoculum. However the inoculum (after wash steps) did
contain both metals, at 744 nM ± 90 (SEM) Mo and 130 nM ± 48 (SEM) W which
although considerably higher does not consider that cultures are only inoculated
at 2%, meaning metal contributions from the inoculum are small (around 3nM
for W and 15nM for Mo) compared to the bulk media. As these traces of metals
proved impossible to remove, further analysis was done with this as a caveat,
accepting that traces of both metals may complicate analysis.
Table 3-2 ICP-MS data after 24 h growth during 3 µM metal supplementation growth studies.
Data represents 0.5 ml of media taken after 24 h growth and subsequent centrifugation. Average of
at least three experimental replicates shown ± SEM. (3.s.f.) Limits of detection for this dataset were
0.022 µM for W and 0.012 µM for Mo.
3 µM W
Supplementation 3 µM Mo
Supplementation 3 µM W + 3 µM Mo
Supplementation Neither
supplementation
W concentration
(µM) 3.01 ± 0.153 0.058 ± 0.013 3.121 ± 0.116 0.053 ± 0.010
Mo concentration
(µM) 0.053 ± 0.016 3.041 ± 0.218 3.485 ± 0.212 0.059 ± 0.012
Table 3-2 shows ICP-MS data for centrifuged media samples, taken after 24 h of
growth, corresponding to the growth seen in Figure 3-3. These experiments were
conducted to determine if metal uptake could be observed by S.oneidensis
cultures, making the assumption that decreases in metal content before and
after growth would correspond to uptake by the cells. Although the metal
concentration values in Table 3-2 after growth are lower than those at
inoculation (i.e, Table 3-1) the relatively large errors associated with these
measurements are frequently larger than the decreases in metal concentrations

107
over the 24 hour period, complicating any analysis. Despite the theoretical
possibility of discerning such changes considering the sensitivity of the
equipment used, the variability between cultures made this unfeasible without
further investment of time. Although it is impossible to quantify exact changes,
it can be said that changes of no more than 100 nM were seen for either metal in
any of the studied growth conditions, suggesting such concentrations are
capable of supporting the growth seen in Figure 3-3.
3.4 Growth studies with increasing metal supplementation.
By careful selection of reagents, using acid washed glassware and analytical
water it was possible to limit W and Mo concentrations to 112 nM and 74 nM
respectively in the investigated minimal media. These values represent a lower
limit to W and Mo in this media but the effect of higher concentrations was
unknown. An excess of metal (W or Mo) not capable of facilitating enzymatic
formate oxidation may compete with the required metal due to their atomic
similarity and therefore inhibit growth. Examples of such phenomena already
exist in the literature (Dudev & Lim 2014). As seen in Figure 3-4 increasing
sodium tungstate supplementation in the minimal media had no effect on
growth even at 150 µM as seen in the green growth trace in panel A. In contrast
an equivalent concentration of sodium molybdate supplementation inhibited all
growth, (red trace in panel B). Supplementation of both metals at 150 µM had a
negligible effect on growth, (blue trace in panel C). Together these results
suggest that a high Mo:W ratio (233:1, Table 3-3) is detrimental to growth.
One explanation for the observed results is that sodium molybdate is more
cytotoxic to S.oneidensis than sodium tungstate in a manner unrelated to FDH
inhibition, however supplementation of 150 µM tungstate, molybdate or both
metals to equivalently grown anaerobic cultures in LB media (Figure 3-4 panel
D), rather than minimal media, show no growth inhibition under any condition,
supporting, but not proving, the competitive FDH inhibition explanation since
formate is not the principal energy source in these LB growth conditions. A
counter proposal that the LB media is able to sequester or chelate and therefore
nullify the toxicity of the metals is an avenue that still needs to explored but
seems unlikely considering the broad range of microorganisms capable of

108
growth in LB and the necessity of these metals for many of these organisms
(Magalon et al. 2011).
Figure 3-4 S.oneidensis growth with increasing molybdate and tungstate concentrations.
Growth curves for S.oneidensis MR-1 grown anaerobically with sodium fumarate as electron
acceptor in minimal media with 50 mM formate (A,B,C) or LB (D) supplemented with sodium
molybdate and/or sodium tungstate. Data represents average of a minimum of three experimental
data sets where error bars represent ± SEM. (A) Increasing tungstate supplementation in minimal
media. (B) Increasing molybdate supplementation in minimal media. (C) Increasing tungstate and
molybdate supplementation in minimal media. (D) 150 µM metal supplementation in anaerobic LB
with 50 mM fumarate as terminal electron acceptor.

109
Table 3-3 ICP-MS data after 0 h growth during 150 µM metal supplementation growth studies.
Data represents 0.5 ml of media taken immediately after inoculation. Average of at least three
experimental replicates shown ± SEM. (3.s.f.)
150 µM W Supplementation
(MM)
150 µM Mo Supplementation
(MM)
150 µM W + Mo Supplementation
(MM)
150 µM W + Mo Supplementation
(LB)
W concentration
(µM) 146 ± 5.98 0.612 ± 0.393 165 ± 6.01 165 ± 2.93
Mo concentration
(µM) 0.217 ± 0.025 143 ± 6.95 161 ± 9.31 154 ± 3.00
3.5 FDH gene expression in response to metal supplementation.
Having primarily addressed the importance of sodium tungstate and sodium
molybdate on bacterial population growth on formate S.oneidensis, gene
expression in response to these metals was also examined. Considering the focus
of this body of work, only the expression of the FDH enzymes were investigated,
in particular the putatively catalytic SO_0101, SO_4509 and SO_4513 (Fdnαβγ,
Fdh1αβγ and Fdh2αβγ), thought to be responsible for formate oxidation (Kane et
al. 2016). To do this, minimal media cultures grown supplemented with metals
at 3 µM as described previously were harvested at mid exponential growth
before extracting mRNA and subsequently using RT-qPCR to quantify
amplicons for each gene of interest and the constitutively expressed RecA
recombinase gene (Yang et al. 2010) used to normalise expression between
growth conditions. The relative expression of each gene compared to RecA is
presented in Figure 3-5 where sodium tungstate supplementation at 3 µM in the
growth media is indicated by +W and sodium molybdate supplementation at 3
µM is indicated by +Mo. The most notable and unexpected change in expression
is seen for SO_0101 which is upregulated solely when neither metal was
supplemented (-W/-Mo). Of the other two fdh genes of interest SO_4509 appears
upregulated in response to all three metal supplemented conditions, +W, +Mo
and +W/+Mo. SO_4513 is also upregulated when grown +Mo or +W/+Mo but
even higher upregulation (1.4 AU) is seen when grown +W.
Any conclusions made have to be carefully considered due to the number of
variables involved, but it can be stated with relative confidence that based on
these data alone, supplementation with either sodium tungstate and/or

110
molybdate at 3 µM under these conditions during exponential growth causes an
increase in amplicons for SO_4509 and SO_4513, with a particular increase in
SO_4513 amplicons in response to tungstate alone. In addition under these
conditions amplicons for SO_0101 are upregulated when sodium tungstate or
molybdate are at low concentrations (specifically around 70-80 nM as
determined in Table 3-1).
Figure 3-5 Fdh gene expression in response to metal supplementation.
Where +W indicates supplementation of sodium tungstate at 3 µM to anaerobic minimal media and
+Mo indicates sodium molybdate supplementation at 3 µM. Data represents absolute
determination of amplicon levels normalised to the housekeeping gene RecA in three experiments
where error bars represent ± SD.
3.6 FDH activity in response to metal supplementation.
To further characterise the effects sodium tungstate and molybdate have on
metabolism of formate in S.oneidensis the FDH activity in whole cells was
measured. This was carried out to elucidate which of the two metals might be
responsible for catalysis of formate oxidation. For these experiments cells were
harvested after 24 h of growth in minimal media supplemented with metals at 3
µM as described previously. These cells were then thoroughly washed to remove
metabolites that might interfere with the following assay. To monitor formate
oxidation the redox dye methyl viologen (MV) was used. By coupling formate

111
oxidation to reduction of methyl viologen it allows the progress of the reaction to
be monitored spectroscopically as the methyl viologen transitions from the
colourless [MV]2+ state to the blue [MV·]+ oxidation state (Illichmanová et al.
2011). The observed absorbance change at 598 nm is then converted to a FDH
specific activity normalised using total protein content. The specific activities
determined for each growth condition are presented in Figure 3-6 where +W and
+Mo indicate sodium tungstate and sodium molybdate growth supplementation
at 3 µM respectively in minimal media.
Figure 3-6 FDH activity in response to metal supplementation in minimal growth media.
Where +W indicates sodium tungstate at 3µM and +Mo indicates sodium molybdate at 3µM.
Activities obtained using colorimetric methyl viologen assay and normalised to total cellular
protein content in samples. Data represents average of a minimum of three experimental data sets
where error bars represent ± SEM.
Noticeable changes were observed in FDH activity between growth conditions in
Figure 3-6, with the lowest being observed in the control without +W or +Mo
supplementation, in keeping with these metals being important for catalysis.
+Mo supplementation alone caused a small 0.07 µmol min-1mg-1 increase in
specific activity. More significant increases were seen with +W or +W and +Mo
conditions with increases in specific activity of 0.49 and 0.33 µmolmin-1mg-1
compared to the non-supplemented control. Since the highest increases in FDH
activity are seen when tungstate is present it is concluded that tungstate, and
not molybdate, is required for maximal FDH activity in these conditions.

112
3.7 Discussion
Formate is a commonly cited electron donor used to support growth of
S.oneidensis MR-1 by generating proton motive force (Kane et al. 2016).
Although commonly alluded to, the enzymes involved have not been studied
thoroughly. This first collection of work aims to clarify and characterise the role
formate, and FDH enzymes, play in the metabolism of S.oneidensis MR-1.
Although S.oneidensis MR-1, and indeed many characterised Shewanella
strains, have been shown to be able to use formate as an electron donor (Kostka
& Nealson 1995) there has been a degree of controversy as to whether it can be
used as a sole carbon and energy source, with several older publications
claiming this to be true (Scott & Nealson 1994). Bioinformatic modelling studies
suggested possible formate assimilation pathways including a pyruvate-formate
lyase complex in reverse (acetyl CoA + formate pyruvate + CoA)
(Fredrickson et al. 2008) or use of enzymes comprising the serine or isocitrate
lyase serine pathways combined with elements of the central carbon metabolism
for Shewanella putrefaciens (Fredrickson et al. 2008)(Serres & Riley 2006).
Despite these observations, it was also suggested that carbon could alternatively
be sourced from amino acids commonly added as minimal media supplements to
previous experiments, namely glutamine, arginine and serine (Fredrickson et al.
2008). Serine in particular has been demonstrated to be a suitable carbon source
for growth of S.oneidensis (Scott & Nealson 1994). Despite their regular
inclusion in minimal media, it should be noted that S.oneidensis does not have
an auxotrophic dependence on these amino acids and their supplementation is
not required for successful growth in other growth conditions.
The data in Figure 3-1 supports this hypothesis, that formate is in fact capable
of acting as electron donor, but not sole carbon source, as when the same amino
acids were excluded from the minimal media no growth was observed
suggesting the importance of both components under these conditions.
Sodium fumarate is used as a terminal electron acceptor in these experiments.
Nitrate, nitrite, thiosulfate, trimethylamine N-oxide (TMAO) and dimethyl
sulfoxide (DMSO) have also been shown to be effective alternative soluble
electron acceptors (Gao et al. 2008). Fumarate was used because the enzymes
used to catalyse the reduction of many of these alternative acceptors are

113
predicted to be molybdopterin containing enzymes and since this study was in
part investigating the effect of molybdate on cell growth it was deemed the most
appropriate. The reduction of fumarate in S.oneidensis is catalysed by FccA, a
periplasmic flavocytochrome protein (Maier et al. 2003) with no known
requirement for either tungsten or molybdenum in its biosynthesis or
expression.
The determination of a substrate affinity constant, or Monod constant (Ks)
(Owens & Legan 1987) for formate in S.oneidensis MR-1 in the described growth
conditions is shown in Figure 3-2. A Ks of 20.4 ± 6 mM was determined.
Comparison with other literature values is difficult due to a general lack of
standardisation. Not only are there often conflicting experimental results, but
multiple methods to determine specific growth and a multitude of mathematical
models to fit data (Owens & Legan 1987). The result is that even for glucose in
Escherichia coli, one of the most well studied examples of cellular kinetics,
values for Ks vary by 3 orders of magnitude (Kovarova-Kovar & Egli 1998).
Despite this, the values estimated here do not seem unreasonable, similar to Ks
values obtained for formate as the sole energy and carbon source in
Pseudomonas oxalaticus OX1. A specific number is not quoted as depending on
the mathematical fitting used values ranged from 0.5-60 mM (Dijkhuizen &
Harder 1975) re-emphasising the previous point. Concerning suitability of
experimental design and analysis, the approaches used here were chosen for
their simplicity. Specific growth rates were determined from batch culture
rather than respirometry, i.e. the study of CO2 or other metabolomic products
(Du Plessis et al. 2001) due to experimental limitations and data was
computationally fitted by non-linear regression to the hyperbolic Monod
equation. This was partially to avoid the biases affecting arrangements such as
those often seen in Lineweaver-Burke plots (Schnell & Maini 2003) but also
because more complicated models have been the subject of much controversy
(Almquist et al. 2014). Although determining specific growth activities from
batch cultures is an established procedure, it does make the assumption that
cell responses to the substrate in question are immediate, and that cells do not
need time to adapt, an assumption that is not always true and further
complicates literature comparison (Owens & Legan 1987). The Ks value here
will likely only become important in the context of future work when it can be
compared to other strains growth under the same conditions.

114
Both tungsten and molybdenum have been shown to be catalytically important
in FDH enzymes in a variety of species (Moura et al. 2004). As yet there is no
definitive way of determining the required metal for putative molybdo/tungsto
pterin enzymes, and indeed because this is not commonly considered many
putative PGD enzymes may require tungsten or at least be able to use it as a
substitute in the absence of environmental molybdenum. The oxyanion forms of
these metals, tungstate (WO42−) and molybdate (MoO4
2−) are the bioavailable
forms of these metals found in the environment and both are recognised by the
ABC type transporters that transport them across bacterial membranes
(Magalon et al. 2011), hence their use over the elemental forms in these studies.
Figure 3-3 investigates the effect on growth of supplementing these metals to
growth media with the prediction that if one or other metal was essential its
absence would prevent growth on formate.
Surprisingly growth was seen without addition of either metal. This is likely to
be explained by the ICP-MS analysis of the media which suggests that despite
experimental efforts traces of both W (112 nM ± 21 (SEM)) and Mo (74 nM ± 15
(SEM)) remain in the non-supplemented media. It should be noted that ICP-MS
quantifies total metal content after acid digestion and a percentage of this metal
may not be in a bioavailable form.
Although seemingly low, such levels are in fact comparable to those found in
environments where Shewanella species are usually found, predominantly
aquatic environments. Molybdenum is the most abundant transition metal in
surface sea water, present at 100 nM (Butler 1998) whilst an average of around
20 nM has been suggested for lake derived water, with levels rising more than
200 fold in areas affected by quarrying (Hem 1985). To emphasise the
differences between different locations, another study found Mo concentrations
to vary between three eastern Sierra Nevada rivers from 12 nM to 3200 nM
(Johannesson et al. 2000) suggesting natural exposure and abundance can vary
greatly. With respect to W, the same study found values ranging from 0.8 nM to
1030 nM in line with the common observation that W is generally found less
abundantly than Mo in the current environment (Magalon et al. 2011).
Considering these values it is not surprising that the nanomolar range of trace
W and Mo found in the media are capable of supporting growth. The ability to
effectively scavenge cofactor metals found at such low concentrations is probably
115
due to the presence of highly specific ABC type transporters. Both putative
tungstate, TupA (SO_4719) (Kolker et al. 2005) and molybdate ModA (SO_3863)
and ModC (SO_3865) transporters are predicted to exist in S.oneidensis MR-1.
The inability to remove nanomolar traces of metals needed for cofactors from
media components using standard laboratory techniques has been previously
documented (Gates et al. 2003)(Davey et al. 1970) (Bruland et al. 2013). Indeed
many studies simply investigate genotypic and phenotypic changes in response
to increases in metal availability as opposed to the more absolute absence vs.
presence (Sullivan et al. 2013).
Figure 3-3 demonstrates a slight increase of around 0.1 absorbance units in
final OD600 when cultures were supplemented with molybdate alone prompting
the suggestion that Mo is important for FDH activity. However, as discussed in
the context of the FDH assay data later, this appears to not be the case. It is
therefore important to consider whether this could be a FDH independent
phenotype. Although this media was designed to emphasise formate dependent
phenotypes, bacterial metabolism is complicated and metabolic bottlenecks are
poorly understood in many cases (Goelzer & Fromion 2011). It is entirely
possible that another molybdate dependent process limits growth in these
conditions, either at a regulatory level or as a cofactor in another molybdopterin
protein. Possible candidates for such alternative molybdoenzymes include the
DMSO reductases encoded by SO_1429 and SO_4358 (Gralnick et al. 2006),
sulphite dehydrogenase (SO_0715), isoquinoline 1-oxidoreductase (SO_3048),
thiosulphate reductase / polysulphide reductase (SO_4062) and the periplasmic
nitrate reductase NapA (SO_0848). It is possible that these enzymes may
alleviate some metabolic bottleneck, for example NapA has been shown to
dissipate excess reducing energy for redox balance (Gavira et al. 2002) when
grown with nitrate, although this is not the case here, a homologous system may
exist involving one of the other listed enzymes.
Figure 3-4 demonstrates a seemingly higher toxicity of molybdate than
tungstate in the investigated conditions. This can be most easily explained by
first hypothesising that W is essential as a cofactor for maximal FDH activity.
Making this assumption it is not surprising that increasing tungstate does not
seem to affect growth, even at 150 µM. As a continuation of this hypothesis the
observed toxicity of molybdate at higher concentrations can also be explained, at

116
low concentrations of molybdate supplementation (3 µM) the traces of W found
in the media may still be effectively scavenged for cofactor incorporation,
however if the ratio of Mo:W in the environment increases, the Mo may begin to
competitively inhibit W incorporation into enzymes for formate oxidation, which
are unable to function and therefore unable to support growth on formate. This
is speculative but is supported by the observation that supplementation of both
metals at 150 µM restores growth in this media, and using the same rational as
before can be explained as the ratio of Mo:W in the environment is no longer
biased, preventing competitive inhibition by Mo. Evidence for W and Mo
oxyanion antagonism and subsequent enzyme inactivation has several
precedents in the literature; a very pertinent example is the tungsten
containing FDH of Campylobacter jejuni that is negatively affected by excess
molybdate during growth (Smart et al. 2009). The opposite relationship is more
regularly reported with molybdoenzyme activity inhibited after growth with
tungstate (Gates et al. 2003). Both nitrate and sulphite oxidoreductases are
typical tungsten-sensitive molybdoenzymes (Smart et al. 2009) in keeping with
the previous discussion explaining the higher OD600 reached when
supplemented with molybdate alone.
An alternative explanation for the results in Figure 3-4 might involve some
FDH independent toxicity effect, but this seems unlikely as when equivalent
concentrations (150 µM) of tungstate, molybdate and both metals were
supplemented to anaerobically grown LB media, which does not use formate as
its principal energy source, no differences in growth phenotypes were observed.
The exact compounds acting as electron donors in LB are generally accepted as
being catabolisable amino acids, with less than 100 µM sugar being present
(Sezonov et al. 2007).
Toxicity of transition metals at high concentrations is well documented in the
literature (Lemire et al. 2013). However examples of molybdate and tungstate
concentrations needed to completely inhibit growth as seen in Figure 3-4 Panel
B, tend to be considerable higher, for example complete inhibition of Paracoccus
pantotrophus growth required concentrations of 100 mM tungstate (Gates et al.
2003) further supporting Mo causing toxicity by competitive antagonism. The
ability of S.oneidensis to grow despite high concentrations of tungstate has been
previously documented, with cultures able to grow up to concentrations of 250

117
mM (Mumy & Doyle 2010), unfortunately this study did not make comparative
measurements with molybdate.
The preceding discussion has not differentiated between different FDH isoforms
within S.oneidensis MR-1. Three gene clusters have been identified as being
important for respiratory formate oxidation, the active heterotrimeric FDH
enzymes encoded by SO_0101-0103 (Fdnαβγ), SO_4509-4511 (Fdh1αβγ) and
SO_4513-4515 (Fdh2αβγ) (Kane et al. 2016). The previous results have discussed
formate oxidation, but it is important to appreciate that the relative
contributions of the three isoforms may vary depending on the growth
conditions. This was investigated in Figure 3-5 concerning the expression of the
catalytically active alpha subunits of these three isoforms, SO_0101, SO_4509
and SO_4513.
Expression of SO_0101 was considerably higher when neither W nor Mo were
supplemented in the growth media raising several non-mutually exclusive
hypotheses. The first is that SO_0101 does not require either metal for catalysis
and is capable of functioning in some Mo/W independent manner and is
expressed to compensate when the Mo/W dependent isoforms are unavailable.
The second hypothesis is that SO_0101 is repressed by expression of the other
isoforms to prevent waste of resources in metabolic redundancy. A further
possibility is repression of SO_0101 by either the presence of tungstate and/or
molybdate at 3 µM. The final possibility is that this isoform is upregulated in
response to low levels of cofactor metal availability and is capable of benefiting
from incredibly efficient scavenging mechanisms in a way other isoforms are
not, potentially by virtue of SO_0107, a putative assembly/maturation protein,
FdhD, or by SO_0108, a protein of unknown function, equivalents of both which
are missing in the other two gene clusters. Studies in E.coli have demonstrated
homologous FdhD proteins to be important for cofactor insertion (Sawers 1994)
supporting this line of reasoning. The above scenario could hold true but making
the distinction that SO_0101 is downregulated in response to higher
concentrations of cofactor metals, as opposed to upregulated without them,
without understanding the underlying mechanisms both are possible. Such
sensitive but usually complicated changes in metabolic gene expression relating
to metal limitation are well recorded, with upregulation of systems better able
to make use of available resources (Merchant & Helmann 2012).

118
Concerning the other two isoforms SO_0509 and SO_4513, the qPCR data
suggests that in the four growth conditions studied the SO_4509 isoform was
constitutively expressed when tungstate and/or molybdate were supplemented.
The SO_4513 isoform was also expressed in these three conditions and was up-
regulated most when tungstate alone was added to media. From this data alone
it can be suggested that under metal supplemented conditions SO_4509 and
SO_4513 are likely to play an important role in formate oxidation, with
tungstate being of particular importance for SO_4513. Such enzymatic changes
in response to availability of different cofactor metals would not be a unique
finding. During Fe2+ deprivation there are numerous cases whereby Mn2+ is
instead incorporated into mononuclear Fe2+ enzymes including ribulose-5-
phosphate 3-epimerase, cytosine deaminase, peptide deformylase, and
threonine dehydrogenase, this particular substitution is not only initiated in
response to Fe scarcity, but also in response to oxidative stress as the Mn2+
containing enzyme is less susceptible to oxidative inactivation by H2O2 (Dudev
& Lim 2014).
The gene expression presented here is limited in a number of ways. Initially it
only addresses expression of the catalytic alpha subunits, whilst information on
expression of other gene cluster proteins including the accessory proteins
described above would be of interest as would be expression of the transporters
TupA , ModA and ModC . It should also be noted that RNA was extracted for
these experiments during mid exponential growth, and further changes may
appear in later stages of growth. In addition to the current qPCR data presented
here a more thorough future approach would conduct microarray or RNA
sequencing experiments to establish all genetic changes in response to W and
Mo but this was not the principal focus of this work. A final caveat with this
work is that it is not assumed that an increase in mRNA gene transcripts as
monitored here necessarily translates into an increase in functional protein,
with post translational regulation playing an important role (Greenbaum et al.
2003).
The colorimetric whole cell assays presented in Figure 3-6 add an extra layer of
complexity to this discussion. When considering formate oxidation, specific
activities are significantly higher when cultures are grown with tungstate,
raising a number of further questions and possibilities. 1) There is higher FDH

119
expression in these conditions, as already suggested above in regards to
SO_4513. 2) Only tungstate is capable of being incorporated into active FDH
enzymes and the activity in non-tungstate supplemented conditions reflects the
enzyme population with tungstate traces in the media. 3) Tungstate may be
required for maximal FDH activity not as a cofactor, but as a regulatory
element, or both. 4) FDH isoform(s) can contain either tungsten or molybdenum
but there is a resultant change in enzyme kinetics, possible evidence for this
point comes from the small increase in specific activity when supplemented with
Mo compared to the non-supplemented control suggesting at least a proportion
of FDH activity is Mo dependent. Since these questions are multi-faceted
several experiments in subsequent Chapters will aim to address different
elements. The question of whether W is incorporated into a cofactor is addressed
by purification of active protein in Chapter 4. The contribution of different
isoforms to specific activity is investigated in Chapter 5 with use of mutants to
allow examination of each isoform in turn. This Chapter also will attempt to
address whether both metals can be incorporated into catalytically active
cofactors.
The work presented here begins to explore the role of formate in S.oneidensis.
The initial aim to simply characterise the microbial physiology and the native
systems involving formate oxidation evolved into a more complicated study with
a number of interesting findings that suggest far more complicated systems
than first expected. It was observed that S.oneidensis is capable of effectively
scavenging Mo and W at nM concentrations to support growth. Further
tungstate supplementation at 3 µM caused increases not only in gene expression
for SO_4513 and SO_4509 but also in whole cell FDH activity. Combined with
the possible inhibitory effects of Mo, but not W on growth, it can be summarised
that W seems to play an important role in formate oxidation in S.oneidensis.
Although unexpected considering the effectiveness of Mo containing enzymes in
the majority of bacterial species, with W containing enzymes typically being
associated with archaea (Silva et al. 2011) and the natural predominance of Mo
in the environment, this is a novel discovery in Shewanella and warrants
further study, addressed in the following section of work.

120
3.8 References
Almquist, J. et al., 2014. Kinetic models in industrial biotechnology - Improving cell factory
performance. Metabolic Engineering, 24, pp.38–60.
Bruland, K.W., Middag, R. & Lohan, M.C., 2013. Controls of Trace Metals in Seawater. Treatise
on Geochemistry: Second Edition, 8, pp.19–51.
Butler, A., 1998. Acquisition and utilization of transition metal ions by marine organisms. Science,
281(5374), pp.207–210.
Chen, Y. & Wang, F., 2015. Insights on nitrate respiration by Shewanella. Frontiers in Marine
Science, 1(January), pp.1–9.
Davey, E.W. et al., 1970. Removal of Trace Metals from Marine Culture Media. Limnology and
Oceanography, 15(3), pp.486–488.
Dijkhuizen, L. & Harder, W., 1975. Substrate inhibition in Pseudomonas oxalaticus OX1: a kinetic
study of growth inhibition by oxalate and formate using extended cultures. Antonie van
Leeuwenhoek, 41(1), pp.135–146.
Dudev, T. & Lim, C., 2014. Competition among metal ions for protein binding sites: Determinants
of metal ion selectivity in proteins. Chemical Reviews, 114(1), pp.538–556.
Fredrickson, J.K. et al., 2008. Towards environmental systems biology of Shewanella. Nature
reviews. Microbiology, 6(8), pp.592–603.
Gao, H. et al., 2008. Probing regulon of ArcA in Shewanella oneidensis MR-1 by integrated
genomic analyses. BMC genomics, 9(Iii), p.42.
Gates, A.J. et al., 2003. Properties of the periplasmic nitrate reductases from Paracoccus
pantotrophus and Escherichia coli after growth in tungsten-supplemented media. FEMS
Microbiology Letters, 220(2), pp.261–269.
Gavira, M. et al., 2002. Regulation of nap Gene Expression and Periplasmic Nitrate Reductase
Activity in the Phototrophic Bacterium Rhodobacter sphaeroides DSM158. Journal of
bacteriology, 184(6), pp.1693–1702.
Goelzer, A. & Fromion, V., 2011. Bacterial growth rate reflects a bottleneck in resource allocation.
Biochimica et Biophysica Acta - General Subjects, 1810(10), pp.978–988.
Gralnick, J. a et al., 2006. Extracellular respiration of dimethyl sulfoxide by Shewanella
oneidensis strain MR-1. Proceedings of the National Academy of Sciences of the United States
of America, 103(12), pp.4669–74.
Greenbaum, D. et al., 2003. Comparing protein abundance and mRNA expression levels on a
genomic scale. Genome Biol, 4(February 2017), p.117.
Hem, J.D., 1985. Study and Interpretation of the Chemical Characteristics of Natural Water
Illichmanová, a et al., 2011. Nitrate reductase whole-cell assay: side effects associated with the
use of benzyl viologen. Folia microbiologica, 56(1), pp.72–6.
Johannesson, K.H. et al., 2000. Oxyanion concentrations in Eastern Sierra Nevada Rivers - 3.
Boron, Molybdenum, Vanadium, and Tungsten. Aquatic Geochemistry, 6(1), pp.19–46.
Kane, A.L. et al., 2016. Formate metabolism in Shewanella oneidensis generates proton motive
force and prevents growth without an electron acceptor. Journal of Bacteriology, 198(8),
pp.1337–1346.
Kisker, C., Schindelin, H. & Rees, D.C., 1997. Molybdenum cofator containing enzymes: Structure
and Mechanism. Annu. Rev. Biochem, 66, pp.233–67.
Kolker, E. et al., 2005. Global profiling of Shewanella oneidensis MR-1: expression of hypothetical

121
genes and improved functional annotations. Proceedings of the National Academy of Sciences
of the United States of America, 102(6), pp.2099–104.
Kostka, J.E. & Nealson, K.H., 1995. Dissolution and reduction of magnetite by bacteria.
Environmental science & technology, 29(10), pp.2535–40.
Kouzuma, A. et al., 2010. Disruption of the putative cell surface polysaccharide biosynthesis gene
SO3177 in Shewanella oneidensis MR-1 enhances adhesion to electrodes and current
generation in microbial fuel cells. Applied and environmental microbiology, 76(13), pp.4151–
7.
Kovarova-Kovar, K. & Egli, T., 1998. Growth Kinetics of Suspended Microbial Cells: From Single-
Substrate-Controlled Growth to Mixed-Substrate Kinetics. Microbiol. Mol. Biol. Rev., 62(3),
pp.646–666.
Laukel, M. et al., 2003. The tungsten-containing formate dehydrogenase from Methylobacterium
extorquens AM1: Purification and properties. European Journal of Biochemistry, 270(2),
pp.325–333.
Lemire, J. a, Harrison, J.J. & Turner, R.J., 2013. Antimicrobial activity of metals: mechanisms,
molecular targets and applications. Nature reviews. Microbiology, 11(6), pp.371–84.
Magalon, A. et al., 2011. Molybdenum enzymes in bacteria and their maturation. Coordination
Chemistry Reviews, 255(9–10), pp.1159–1178.
Maier, T.M. et al., 2003. Identification of the gene encoding the sole physiological fumarate
reductase in Shewanella oneidensis MR-1. J. Basic Microbiol, 43(4), pp.312–327.
Merchant, S.S. & Helmann, J.D., 2012. Elemental Economy. Microbial Strategies for Optimizing
Growth in the Face of Nutrient Limitation. Advances in Microbial Physiology, 60, pp.91–
210.
Moura, J.J.G. et al., 2004. Mo and W bis-MGD enzymes: nitrate reductases and formate
dehydrogenases. Journal of biological inorganic chemistry, 9(7), pp.791–9.
Mumy, K. & Doyle, T., 2010. Impact of Sodium Tungstate and Tungsten Alloys on the Growth of
Selected Microorganisms with Environmental Significance. Naval Health Research Center
Detachment reports, (July), pp.1–30.
Owens, J.D. & Legan, J.D., 1987. Determination of the Monod substrate saturation constant for
microbial growth. FEMS Microbiology Reviews, 46, pp.419–432.
Pinchuk, G.E. et al., 2011. Pyruvate and lactate metabolism by Shewanella oneidensis MR-1
under fermentation, oxygen limitation, and fumarate respiration conditions. Applied and
environmental microbiology, 77(23), pp.8234–40.
Du Plessis, C.A. et al., 2001. Development of respirometry methods to assess the microbial activity
of thermophilic bioleaching archaea. Journal of Microbiological Methods, 47(2), pp.189–198.
Sawers, G., 1994. The hydrogenases and formate dehydrogenases of Escherichia coli. Antonie van
Leeuwenhoek, 66(1–3), pp.57–88.
Schnell, S. & Maini, P.K., 2003. A Century of Enzyme Kinetics: Reliability of the Km and Vmax
Estimates. Comments on Theoretical Biology, 8, pp.169–187.
Scott, J.H. & Nealson, K.H., 1994. A biochemical study of the intermediary carbon metabolism of
Shewanella putrefaciens. Journal of bacteriology, 176(11), pp.3408–11.
Serres, M.H. & Riley, M., 2006. Genomic analysis of carbon source metabolism of Shewanella
oneidensis MR-1: Predictions versus experiments. Journal of bacteriology, 188(13), pp.4601–
9.
Sezonov, G., Joseleau-Petit, D. & D’Ari, R., 2007. Escherichia coli physiology in Luria-Bertani
broth. Journal of Bacteriology, 189(23), pp.8746–8749.

122
Silva, S.M. da et al., 2011. Tungsten and molybdenum regulation of formate dehydrogenase
expression in Desulfovibrio vulgaris Hildenborough. Journal of bacteriology, 193(12),
pp.2909–16.
Smart, J.P., Cliff, M.J. & Kelly, D.J., 2009. A role for tungsten in the biology of Campylobacter
jejuni: tungstate stimulates formate dehydrogenase activity and is transported via an ultra-
high affinity ABC system distinct from the molybdate transporter. Molecular microbiology,
74(3), pp.742–57.
Sullivan, M.J. et al., 2013. Copper control of bacterial nitrous oxide emission and its impact on
vitamin B 12 -dependent metabolism. Proceedings of the National Academy of Sciences of the
United States of America, 110(49), pp.19926–31.
Yang, Y. et al., 2010. The tricarboxylic acid cycle in Shewanella oneidensis is independent of Fur
and RyhB control. BMC microbiology, 10(1), p.264.

123
4 Kinetic and protein studies of
Shewanella oneidensis MR-1 FDH and
CO2 reductase activities
4.1 Suitability of redox dyes for CO2 reductase assay
Previous work addressed formate oxidation in S.oneidensis and began to inform
on the importance of the cofactor metals W and Mo from a microbial physiology
perspective. Without a more detailed biochemical approach only limited
conclusions could be drawn. The formate oxidation assay described in the last
chapter was therefore used to further characterise FDH activity and address the
possibility of native CO2 reductase activity in S.oneidensis.
Before settling on the methyl viologen assay described in Chapter 3, a number
of alternative colourimetric redox dyes were investigated to monitor formate
oxidation. Formate-NAD+ reductase activity was not observed in agreement
with previous studies (Mordkovich et al. 2013). However both formate-methyl
viologen reductase and formate-benzyl viologen reductase activities were
observed at comparable levels (Figure 4-1).
To determine if this FDH activity was reversible a CO2 reductase assay was also
developed. CO2-methyl viologen oxidase activity was detectable but CO2-benzyl
viologen oxidase activity was not (Figure 4-1). For both cases Na dithionite was
used to artificially reduce the viologen to allow its re-oxidation, coupled to CO2
reduction, to be monitored.
Notably the use of the term CO2 reductase activity throughout this work is used
when describing the activity seen when sodium carbonate is used as a substrate.
The use of sodium carbonate to provide CO2 for CO2 reductase assays is reported
elsewhere (Bassegoda et al. 2014) and was used for experimental ease. It should
therefore be clarified that CO2 in such experiments is derived from the
dissociation of Na carbonate in water into CO2 and other carbonate species.
Although the possible implications of this are discussed, experiments using
gaseous CO2 (99.9%) sparged through a reaction cuvette in place of adding Na
carbonate solution showed equivalent enzymatic activity, 0.63 ± 0.1 µmolmin-

124
1mg-1 compared to 0.57 ± 0.03 µmol min-1mg-1. Importantly, regardless of
whether Na carbonate or gaseous CO2 was used as substrate in these assays,
the assay conditions were sufficiently buffered and the pH did not change more
than 0.1 pH unit from start to finish.
Figure 4-1 Methyl and benzyl viologen coupled FDH and CO2 reductase activity in S.oneidensis
Viologens used as coupled colourimetric redox dyes with activities normalised to protein content.
Cells grown in minimal growth media supplemented with sodium tungstate at 3 µM. Data
represents average of a minimum of three experimental data sets where error bars represent ±
SEM.
4.2 CO2 reductase activity in response to metal supplementation.
For all of the above investigations, cells were grown in minimal media
supplemented with 3 M W found to produce the highest FDH activities in
Chapter 3. Since FDH activity was metal dependent and the observed CO2
reductase activity was suspected to be due to FDH enzymes working in reverse,
CO2 reductase activity in these same four conditions was investigated (Figure
4-2). The data for formate oxidation determined in Chapter 3 is also presented
here for comparative purposes. CO2 reductase activity followed the same pattern
as formate oxidation, with highest activities when cultures were supplemented

125
with 3 M tungstate (+W). When growth was not supplemented (-W/-Mo), or
was only supplemented with 3 µM molybdate (+Mo), activities were comparably
low, 0.07 ± 0.02 and 0.06 ± 0.01 µmolmin-1mg-1 respectively suggesting W is
important for CO2 reductase activity.
It is also observed that the ratio of CO2 reduction compared to formate oxidation
is also dependent on tungstate supplementation. When grown +W or +W/+Mo,
reduction:oxidation ratios of 0.81:1 and 0.92:1 are observed, i.e. in these
conditions methyl viologen catalysed CO2 reduction is approximately equal to
formate oxidation. However when grown without tungstate, in +Mo or -W/-Mo
growth conditions, ratios of 0.21:1 and 0.34:1 are observed, suggesting formate
oxidation is favoured.
Figure 4-2 FDH and CO2 reductase activities in response to metal supplementation.
Specific activities for S.oneidensis cells grown in minimal media supplemented with either 3 µM
sodium tungstate (+W), 3 µM sodium molybdate (+Mo) supplementation of both metals (+W/+Mo)
or neither metal (-W/-Mo). Activities obtained using colorimetric methyl viologen assay and
normalised to protein content in samples. Data represents average of a minimum of three
experimental data sets where error bars represent ± SEM.

126
4.3 Azide inhibition of FDH and CO2 reductase activity.
Since both formate oxidation and CO2 reduction were believed to be
enzymatically catalysed by FDH enzymes the effect of increasing concentrations
of Na azide, a known FDH inhibitor, was assessed. These experiments were
performed using the assays established above with the resultant data found in
Figure 4-3 with FDH inhibition shown in panel A and CO2 reductase inhibition
in panel B. Inhibition of both activities by sodium azide in a concentration
dependent manner supports enzymatic catalysis. It is notable that even with 20
mM azide complete inhibition was not observed, with 78 % inhibition seen for
formate oxidation and 88 % for CO2 reduction.
Figure 4-3 Azide inhibition of FDH and CO2 reductase activities in S.oneidensis cells.
For both formate oxidation (A) and CO2 reduction (B) S.oneidensis grown in minimal growth
media supplemented with 3 µM tungstate. Activities obtained using colorimetric methyl viologen
assay and normalised to protein content. Data represents average of a minimum of three
experimental data sets where error bars represent ± SEM.
4.4 Confirmation of CO2 reduction to formate by NMR
Addition of sodium carbonate to whole cells caused the oxidation of methyl
viologen. To confirm that CO2 was reduced to formate 1H nuclear magnetic
resonance spectroscopy was used to quantify formate products in methyl
viologen mediated assay conditions. These experiments were conducted
identically to previous CO2 reduction assays with minor modifications to better
suit NMR analysis. Previous assays contained only 125 µM dithionite to reduce
methyl viologen as higher concentrations would result in inappropriately high
absorbance values at 578 nm to monitor spectroscopically. The constraint of this
is that even if allowed to continue to completion, only 125 µM of formate will be

127
formed, with the assumption that 1 M of dithionite dissociates into 2 M of SO2−
radical in solution (Mayhew 1978) capable of reducing 2 M of methyl viologen
which in turn reduces 1 M of CO2, (the validity of these assumptions are
discussed later ). Since 125 µM formate proved too low to be accurately detected,
5mM dithionite was used in these experiments on the assumption that it would
allow formate to be generated at quantifiable levels. This difference is
highlighted here for completeness, but is unlikely to invalidate comparisons
with previous assay experiments. Example NMR spectra are included in the
appendix (Figure A-1) but collated formate concentration data are presented
below for ease of comparison.
Figure 4-4 NMR analysis of CO2 reductase assays detecting formate production.
Methyl viologen CO2 reductase assays were conducted using cells grown in minimal growth media
where +W indicates sodium tungstate supplementation at 3 µM and +Mo indicates sodium
molybdate supplementation at 3 µM. Following these assays and whole cell removal, supernatant
was analysed for formate content. Quantitative formate determinations are shown on left axis and
theoretical faradaic efficiency on the right. This efficiency assumes 100% conversion of electrons
supplied by dithionite being available for CO2 reduction (described in text). Where present, azide
(Az) at 20 mM in the CO2 reduction assay. Data represents average of a minimum of three
experimental data sets where error bars represent ± SEM.
The data from these experiments (Figure 4-4), correlated with the trends
observed in the initial velocity colourimetric assays in Figure 4-2. Accounting for
the assay reaction volume and dilutions in preparation for NMR analysis, 4.25
mM ± 0.24 formate was detected in assays with +W grown cells and 2.53 mM ±

128
0.06 when using +W/+Mo grown cells. Less than 0.1 mM formate was detected
in assays containing +Mo or -W/-Mo grown cells. It is possible that despite CO2
reductase activity being present, formate is quickly re-oxidised by the reverse
reaction, to further inform on this the Km values for both reactions are
subsequently presented.
Figure 4-4 indicates not only the quantified formate concentration in these
experiments, but also suggests the theoretical faradaic efficiency considering the
concentration of reducing equivalents, i.e. 5 mM Na dithionite, added to the
reaction. Using the above assumptions 100% efficiency would result in 5 mM
formate production. Interestingly CO2 reduction appeared to have a high
faradaic efficiency, approaching 85% when cells were grown +W.
Although not graphically presented here it is important to note that a series of
control experiments using NMR analysis confirmed the absolute requirement of
all assay components for formate generation. If methyl viologen, dithionite,
carbonate, the S.oneidensis cells, or any combination of the above were omitted
no formate was detected. This provides strong evidence against the observed
CO2 reduction being abiotic, i.e. these results suggest that reduced methyl
viologen alone is not sufficient for the reaction to proceed. This is in agreement
with comparative controls in the colourimetric assay which could not measure
methyl viologen oxidation at 587 nm in the presence of CO2 without addition of
S.oneidensis culture.
Figure 4-4 also presents data for formate generation when 20 mM azide was
added to assay reactions containing cells grown +W. Only 1.36 mM ± 0.03
formate was seen compared to 4.25 mM ± 0.24 without the inclusion of azide.
This is in agreement with the inhibition of CO2 reductase activity by azide seen
in Figure 4-3.

129
4.5 FDH and CO2 reductase pH dependence
The effect of pH was investigated on rates of FDH and CO2 reductase activity,
again using the established methyl viologen assays. Since growth +W gave both
the highest FDH and CO2 reductase activities as well as the most formate
generation according to NMR, this condition alone was used for these studies.
The previous assays were conducted in 100 mM HEPES buffer pH 7.2, however
HEPES is only an effective buffer over the pH range 6.8–8.2 with a pKa of 7.55
at 20oC (Good et al. 1966). As such a range of McIlvaine buffers, consisting of
disodium phosphate and citric acid were used instead, due to their larger
effective pH range of 2.2-8.2 (McIlvaine 1921) and frequent use in investigating
pH dependence in enzymatic systems (Ruddock et al. 1996)(Michlmayr et al.
2011). As can be seen in Figure 4-5 specific activities for both reactions at pH
7.2 in this buffer were indistinguishable (within the experimental errors
determined) from those at pH 7.2 in HEPES buffer. Specifically formate
oxidation was 0.675 ± 0.069 µmol min-1mg-1 compared to 0.701 ± 0.014 µmol min-
1mg-1 in the equivalent HEPES containing assay. CO2 reduction was 0.692 ±
0.104 µmolmin-1mg-1 compared to 0.569 ± 0.026 µmolmin-1mg-1.
Regarding other pH values investigated it was observed (Figure 4-5) that
specific activities for formate oxidation rise with increasing pH and the inverse
is true for CO2 reduction, i.e. specific activity decreases with increasing pH.
There is a notable discrepancy between the previous statement that McIlvaine
buffers are appropriate in the pH range 2.2-8.2 and this study not investigating
lower than pH6.8. This was because although the buffer was appropriate it was
determined that the methyl viologen assay was not. It was found that at pH
values lower than 6.8 dithionite was unable to effectively reduce the methyl
viologen present, as demonstrated by being unable to reach an OD587 value
equivalent to those obtained at higher pH experiments. Even though initial
rates could be determined at these lower pH values, such experiments were not
considered for analysis considering the reduced concentration of reduced methyl
viologen and potential interference of bisulphite, discussed subsequently.

130
Figure 4-5 pH dependence of FDH and CO2 reductase activities in S.oneidensis.
Cells grown in minimal growth media supplemented with 3µM tungstate. Activities obtained using
colorimetric methyl viologen assay and normalised to protein content. Assays conducted in
Mcilvaine buffer at varying pH values. Data represents average of a minimum of three
experimental data sets where error bars represent ± SEM.
4.6 FDH and CO2 reductase activities in cellular fractions.
To determine subcellular location of the FDH and CO2 reductase enzymes the
FDH and CO2 reductase activities associated with membrane or soluble cell
fractions were measured. Whole cells were lysed via sonication and the
membrane fractions separated using ultracentrifugation. The supernatant was
retained and represents the soluble cellular fractions whilst the pelleted
membrane fractions were resuspended in 100 mM HEPES pH7.2.
The localisation of both FDH, CO2 reductase and fumarate reductase activities
were measured for both soluble and membrane fractions. Fumarate reductase
activity was measured as S.oneidensis MR-1 encodes a single well characterised
periplasmic fumarate reductase, FccA (Ross et al. 2011), as such fumarate
reductase activity could be used as a control for successful fractionation.
Fumarate reductase activity was investigated using a similar methyl viologen
based colourimetric assay as described for monitoring CO2 reduction.

131
For this control study the specific activities are reported normalised to the
combined protein content from both soluble and membrane fractions, allowing
clear visualisation of how the activity was divided between fractions.
Approximately 92% of fumarate reductase activity was observed in soluble
fractions (4.6 panel A), consistent with a soluble enzyme. However a small
amount of unexpected activity was also observed in the membrane fraction, but
can be attributed to the relatively crude method of cell fractionation and the
high abundance of FccA in the cell (Sundararajan et al. 2011) making complete
separation challenging. The fumarate reductase assays show successful
separation of membrane and soluble fractions. The same methodology was
therefore used to localise both FDH and CO2 reductase activity. These were
studied using the previously discussed methyl viologen assays with membrane
and soluble fractions in place of whole cell samples (Figure 4-6 Panel B).
The principal finding of this experiment was that all FDH and CO2 reductase
activities were membrane associated. When assayed, no activity was seen in any
of the soluble fractions regardless of the growth conditions used to prepare the
cells. This is in keeping with genomic predictions for all FDH enzymes in
S.oneidensis being part of membrane associated complexes (Kane et al. 2016).
Fumarate reductase activity in membrane and soluble fractions is presented in
Figure 4-6 normalised to the total combined protein content in both soluble and
membrane fractions to allow comparison between fractions. In contrast the lack
of soluble activity made equivalent quantitative comparisons between fractions
impossible for FDH and CO2 reductase activities. Accordingly these results are
presented as specific activities, normalised only to the protein content in the
membrane fraction allowing comparisons with the previous whole cell specific
activities instead.
Similarities can be observed in Figure 4-6 Panel B with the whole cell assays
presented in Figure 4-2, with +W/-Mo and +W/+Mo growth conditions
demonstrating greater FDH and CO2 reductase activities when compared to -
W/+Mo and -W/-Mo growth conditions. All specific activities are higher than
their whole cell equivalents due to the partial purification achieved by removing
soluble proteins. Due to this the relative differences between activities in growth
conditions are exaggerated, for example formate oxidation in +W grown cells is
2.5 times higher than +Mo grown cells in whole cell assays and 4.7 times higher

132
in membrane fraction experiments. Despite this, the ratio between CO2
reduction and formate oxidation should remain the same, and in +W growth
conditions this is the case, with reduction:oxidation ratios of 0.81:1 for whole
cells and 0.84:1 for membrane fractions. For +Mo grown cells, equivalent ratios
of 0.21:1 in whole cells and 0.12:1 in membrane fractions are seen.
Figure 4-6 Localisation of fumarate reductase, FDH and CO2 reductase activities.
(A) Fumarate reductase activity determined by methyl viologen colorimetric assay in membrane
and soluble cell fractions, normalised to combined protein content in membrane and soluble
fractions. (B) FDH and CO2 reductase activities determined by methyl viologen colorimetric assays,
normalised to protein content in membrane fraction alone. All assays conducted with fractions
from S.oneidensis cells grown in minimal media supplemented with 3 µM W. FDH and CO2
reductase activity was not detected in soluble fractions and is therefore not presented. Data
represents average of a minimum of three experimental data sets where error bars represent ±
SEM.
A
B

133
4.7 Kinetic parameters for formate oxidation and CO2 reduction.
Initial rate varies hyperbolically with substrate concentration for many
enzymes, including previously characterised FDH enzymes (Axley et al. 1991),
at low substrate concentrations not all active sites are occupied and rate is
proportional to substrate concentration giving rise to first order kinetics. As the
substrate concentration increases further all available active sites become
saturated and zero order kinetics are observed, this can be observed graphically
by plotting initial rate against substrate concentration and fitting the hyperbolic
curve to the Michaelis-Menten equation (4.1):
𝑣0 =
𝑉𝑚𝑎𝑥 [𝑆]
𝐾𝑚 + [𝑆] (4.1)
Where v0 is the initial rate, Vmax is the limiting initial rate when all active sites
are occupied, [S] is the substrate concentration and Km is the Michaelis
constant. As derived from Eq. (4.1) above, Km is the substrate concentration at
which the initial rate is half that of the Vmax value. As such the parameter is
given in units of molarity and is often given to report on the specificity of an
enzyme for a substrate.
In an attempt to determine kinetic parameters for the observed formate
oxidation and CO2 reductase activities in whole cells, initial rates were
determined upon addition of varying concentrations of substrate, either formate
or carbonate. These experiments were otherwise identical to previous methyl
viologen assays and importantly were conducted using cells grown +W as this is
when the greatest activities were previously observed.
As can be seen from Figure 4-7 Panel A, oxidation increased with formate
concentration before plateauing as Vmax approached. Higher concentrations of
formate were investigated from 15-50 mM, and for these concentrations of
substrate specific activities actually decreased with increasing substrate
concentration however these values are not included in Figure 4-7 as significant
changes in pH were also observed making this data incomparable. When fitted
to a hyperbolic function, the determined values for Km and Vmax are 39 ± 5 µM
and 0.74 ± 0.02 µmol min-1mg-1 respectively with a R squared value of 0.992.

134
A comparable graph for CO2 reduction can be seen in Figure 4-7 Panel B. As for
formate oxidation, initial rates increased with substrate concentration before
approaching Vmax. By fitting to the same hyperbolic function parameters of 1.43
± 0.26 mM and 0.58 ± 0.03 µmol min-1mg-1 for Km and Vmax were determined
with an R squared value of 0.984. The data set for CO2 reduction contains larger
errors partly due to the complex behaviour of carbonate as a substrate. When
using higher substrate concentrations, from 30 to 50 mM carbonate, specific
activities decreased with further increases in substrate concentration as seen for
formate oxidation, but as for formate oxidation, significant changes in pH were
also observed so these data were excluded from analysis but addressed in the
discussion.

135
Figure 4-7 S.oneidensis formate oxidation and CO2 reduction Michaelis-Menten plots.
For both formate oxidation (A) and CO2 reduction (B), cultures were grown in +W minimal media.
Initial rates determined by measuring increasing absorbance in colorimetric methyl viologen assay.
Data fitted to a hyperbolic function according to the Michaelis Menten equation. Each data point
represents average of a minimum of three experimental data sets where error bars represent ±
SEM.
B
A
136
4.8 FDH and CO2 reductase activities of S.oneidensis grown in
Lysogeny-broth media.
To this point all experiments had been conducted in carefully controlled
minimal media for a number of reasons, for consistency, to regulate availability
of cofactor metals and perceived optimisation for activities of interest. Indeed
initial experiments at the start of the project failed to detect FDH activity in
routine aerobically grown S.oneidensis cultures in LB media. This is confirmed
in Figure 4-8 which also failed to detect CO2 reductase activity in these cells.
Informed by the previous sections of work however an interesting observation
was made. When Na tungstate was added to cultures at 3 µM to aerobic LB
cultures, (i.e. the same concentration that increases FDH activity in minimal
media), both formate oxidation and CO2 reduction were observed (Figure 4-8). It
should be noted that the addition of this tungstate had no impact on the final
OD600 of such cultures suggesting this is not a factor limiting growth in these
conditions. This was still deemed an interesting result as aerobic growth in the
previously investigated minimal media is not supported and therefore this
represents the only evidence for active reversible FDH enzymes under aerobic
conditions in S.oneidensis and may bear future significance outlined in the
discussion.
Also of interest were equivalent experiments in anaerobically grown LB media.
For these experiments 50 mM Na fumarate was provided as a terminal electron
acceptor. Even without metal supplementation both FDH and CO2 reductase
activities were observed in anaerobically grown cells, in agreement with the
requirement for FDH in anaerobic respiration (Kane et al. 2016). However
increases in both formate oxidation, from 0.08 ± 0.01 µmol min-1mg-1 to 1.24 ±
0.09 µmol min-1mg-1 and CO2 reduction, from 0.03 ± 0.02 µmol min-1mg-1 to 0.41
± 0.14 µmol min-1mg-1 were observed when 3 µM tungstate was added to growth
media (Figure 4-8). Again, the addition of tungstate had no effect of the growth
of these cultures, with both supplemented and non-supplemented reaching an
OD600 of 0.23 after 24 h.
Despite these interesting observations, even when grown anaerobically with
tungstate supplementation, CO2 reductase specific activities were lower than
those observed in the established minimal media supplemented with tungstate

137
and considering the aimed application of this project, i.e. CO2 fixation, this was
considered a significant drawback. Exacerbating this aspect was the fact that
formate oxidation specific activities in these conditions were actually higher
than those seen in minimal media experiments, meaning these growth condition
were likely to be biased in favour of formate oxidation significantly more than
the minimal media growth conditions. As such subsequent experiments
continued to use the defined minimal media for growth rather than this simpler
alternative.
Figure 4-8 FDH and CO2 reductase activities of S.oneidensis grown in Lysogeny-broth media.
W supplemented as 3 µM sodium tungstate. Anaerobic cultures contained 50 mM fumarate as
electron acceptor. Activities determined using methyl viologen assay and normalisation to protein
content. Data represents average of a minimum of three experimental data sets where error bars
represent ± SEM.

138
4.9 Purification of Fdh2α when grown in tungstate supplemented
minimal media.
Due to the previous work suggesting the probable importance of SO_4513 in
both FDH and CO2 reductase activities the encoded protein, referred to as
Fdh2α from this point, was purified and analysed using ICP-MS to determine
the identity of any metal cofactor present. Previous work in Chapter 3 had
already highlighted that SO_4513 expression was upregulated in response to
tungstate supplementation in growth media but the identity of the cofactor
metal had not been demonstrated conclusively.
Purification of Fdh2α (SO_4513) consisted of the following steps. Cell growth,
lysis, cellular fractionation, (first separating membranes, then specifically the
inner membrane), followed by anion exchange and size exclusion
chromatography. This resulted in an isolated amount of Fdh2α which was then
able to be analysed by ICP analysis.
For the purification of Fdh2α an S.oneidensis MR-1 mutant strain containing
only the Fdh2αβγ (SO_4513-4515) Fdh isoform, i.e. a Fdnαβγ (SO_450101-0103)
and Fdh1αβγ (SO_4509-4511) knock out, was used. This was primarily to avoid
ambiguity, since the purification was monitored by the non-isoform specific
FDH assay, it would have been hard to distinguish ineffective purification
techniques from separation of different isoforms with different properties.
Considering previous results showing highest enzymatic activities when growth
was supplemented with tungstate, these same growth conditions in minimal
media were used for protein purification.
Cell lysis was performed using a French press as opposed to sonication which
was used previously for the experiments shown in Figure 4-6. Sonication was
not used here due to its inability to efficiently lyse larger volumes of cells,
whereas the use of a French press scales more effectively.
Ultracentrifugation separated membrane fractions of lysed cells from the
soluble components, i.e. the periplasm and cytoplasm. Subsequently the use of
Sarkosyl allowed the selective solubilisation of the inner membrane, since this is
where Fdh2α is predicted to be localised.

139
Following isolation of inner membranes, Fdh2α was purified based on its ionic
properties using anion exchange chromatography. This process involves
maintaining the protein sample in a mobile phase with a pH higher than the pI
of the protein of interest, resulting in a net anionic charge on the surface of the
protein, when passed down a anion exchange chromatography column the
negatively charged protein adheres to a matrix coated in cationic functional
groups, common examples include diethyl-aminoethyl groups (DEAE) or
quaternary amines (Q) attached to sepharose, an agarose derivative (Staby et
al. 2000). Once adhered, changes in ion strength in the mobile phase, usually
achieved by increasing NaCl concentration, allow the proteins to be eluted. As
the concentration of negative Cl ions begins to accumulate, they compete with
the bound protein to bind the positively charged groups on the column matrix,
in a protein mixture those that are bound weakest to the matrix will elute first,
followed by those with higher net positive charges, since each protein will vary
in its electrostatic interactions, this process allows separation.
The method described in this work was found to be a good compromise between
purifying Fdh2α away from large numbers of other membrane proteins, whilst
retaining an acceptable yield. Other methods, including those using alternative
detergents such as triton X-100 or alternative buffers (such as HEPES) were
less effective in one or both of these considerations. The use of a single NaCl
concentration elution step, as opposed to a linear gradient of increasing NaCl
concentration followed by pooling of relevant fractions, was found to be
important, with inferior recovery when using the second method.
Although anion exchange chromatography was an effective purification step
several lower molecular weight proteins were still found in addition to Fdh2α.
As such a further size exclusion purification step was used. This successfully
isolated Fdh2α, which ran as a band on SDS-PAGE gels just under 100 kDa.
NaCl was included at 150 mM in the size exclusion buffer to prevent matrix-
protein and protein-protein interactions.
A coomassie blue stained gel image after the final purification and
concentration step is shown in Figure 4-9 B. The successful isolation of Fdh2α
was confirmed by excision of this band and analysis following tryptic digestion
and peptide mass fingerprinting using mass spectrometry. This identification

140
was statistically significant, using a protein scoring system, score = -10Log(P)
where P is the probability the observed match is a random event and where
scores above 63 are considered significant (p<0.05). Fdh2α identification was
significant with a score of 153.
Figure 4-9 Purification of Fdh2α when grown with 3 µM tungstate.
(A) Reporting on total and specific FDH activity throughout purification, where specific activity
determined by normalising methyl viologen assay results to protein content, and total activities
report on activity in entire purification step. Purification steps refer to 1) Whole cells 2) Cell lysate
3) Total membrane fractions 4) Inner membrane following sarkosyl solubilsation 5) Following
anion exchange 6) Following Size exclusion. Data represents average of three measurements where
error bars represent ± SEM. (B) Purified Fdh2α following size exclusion and concentration steps,
running on a 4-20 % SDS-PAGE gel in right lane, with precision plus protein dual colour standard
in the left, with associated molecular weights marked for reference.
Throughout the purification it was possible to monitor FDH activity to report on
the effectiveness of individual purification steps. By determining protein
concentrations via BCA or Bradford assays, (some steps contained reagents
unsuitable for the typically used BCA methodology) it was possible to record
both specific and total FDH activities during the purification process. These
results are shown in Figure 4-9. As would be expected for any successful
purification, specific activity rose after each purification step, although only 7
fold throughout the purification. In contrast, the total activity throughout the
purification decreased, this is to be expected due to the losses in each step.
Explanations for the observed patterns and their relative magnitudes are
explored in the discussion below.

141
Since rates could be determined for purified Fdh2α, turnover values, or kcat
values could be determined for both formate oxidation and CO2 reduction. These
values were determined according to eq. (4.2), where ET is the concentration of
enzyme active sites, assumed in this case to be equivalent to enzyme
concentration. To determine the concentration of Fdh2α the given molecular
weight of 105.46 kDa was used.
𝑘𝑐𝑎𝑡 =
𝑉𝑚𝑎𝑥 (µ𝑚𝑜𝑙 𝑝𝑟𝑜𝑑𝑢𝑐𝑡 𝑠−1)
[𝐸𝑇] (µ𝑚𝑜𝑙 𝑒𝑛𝑧𝑦𝑚𝑒) (4.2)
Using eq. (4.2) turnover numbers of 12 ± 4.3 s-1 for formate oxidation and 10.7 ±
3.8 s-1 for CO2 reduction were determined.
4.10 ICP-MS analysis of Fdh2α when grown in tungstate
supplemented minimal media.
Following the purification of Fdh2α detailed above, 100 µl of 1.5 µM protein,
determined by BCA assay and assuming a molecular weight of 105.46 kDa was
digested using nitric acid and analysed for W and Mo content using ICP-MS.
When accounting for the acid dilution step 2 µM W and 0.002 µM Mo were
detected in the sample with the Mo value below the limit of detection for these
experiments. From this it was concluded that Fdh2α coordinated W and not Mo,
at approximately a 1.3:1 ratio of metal to protein.
4.11 Attempted purification of Fdh2α when grown in molybdate
supplemented minimal media.
In addition to purifying Fdh2α when grown in minimal media containing
tungstate, equivalent purifications were attempted when grown with molybdate,
to determine if this metal could also be incorporated. An identical procedure to
the previous protein purification was followed however the methodology was not
suitable for these conditions. This can be clearly seen by comparing the
maximum total activities seen in each purification, 230 µmol min-1 when grown
with molybdate Figure 4-10 and 3700 µmol min-1 when grown with tungstate
Figure 4-9. It was eventually concluded that the purification techniques were
too inefficient to retrieve suitably pure protein for ICP-MS analysis, the initial
quantities of Fdh2α in the cells were too low.

142
Figure 4-10 Purification of Fdh2α when grown with 3 µM molybdate.
Reporting on total and specific FDH activity throughout purification, where specific activity
determined by normalising methyl viologen assay results to protein content, and total activities
report on activity in entire purification step. Purification steps refer to 1) Whole cells 2) Cell lysate
3) Total membrane fractions 4) Inner membrane following sarkosyl solubilsation 5) Following
anion exchange 6) Following Size exclusion. Data represents average of three measurements where
error bars represent ± SEM.
4.12 Screening of alternative Shewanella strains for FDH and CO2
reductase activity.
The preceding work addressed the characterisation of FDH and CO2 reductase
activity in S.oneidensis MR-1. This focus was principally due to S.oneidensis
MR-1 being a well characterised model organism but the potential of other
members of the Shewanella genus were also investigated. The principal concern
of these experiments was not to characterise the metabolic or microbiological
physiology aspects of FDH in these strains, merely screen them for activity.
A variety of strains capable of growth in the minimal media conditions described
for S.oneidensis MR-1 in Chapter 3 were cultured under the same conditions,
supplemented with either 3 µM tungstate or 3µM molybdate. After growth, the
established FDH and CO2 reductase assays using methyl viologen were used to
investigate enzymatic activity. Those strains investigated are listed below in
Table 4.1.

143
Table 4.1 Shewanella strains assayed for FDH and CO2 reductase activities.
All are capable of growth in both LB media and the described minimal media and have complete
genome sequences available.
Species Strain
amazonensis SB2B
baltica OS185
baltica OS195
baltica OS223
loihica PV-4
putrifaciens 200
putrifaciens CN-32
putrifaciens W3-18-1
sp. ANA-3
oneidensis MR-1
oneidensis MR-7
oneidensis MR-4
As previously, the results of the colorimetric assays were normalised to total
protein concentration to present the specific activities seen in Figure 4-11. Each
strain is presented with FDH and CO2 reductase activity when grown with
tungstate supplementation and molybdate supplementation.
An immediately apparent observation is that, as seen for S.oneidensis MR-1,
formate oxidation is always significantly higher when grown with tungstate
compared to molybdate with the exception of S.baltica OS223 which
demonstrated no detectable formate oxidation in either growth condition. The
same relationship is also true of CO2 reduction, with activities being higher in
all strains when supplemented with tungstate, with the notable exception of
S.amazonensis SB2B which showed higher activity when grown with molybdate.

144
Figure 4-11 Analysis of reversible FDH activity in alternative Shewanella strains.
Cells grown anaerobically in minimal media with 50 mM sodium fumarate as terminal electron
acceptor, supplemented with 3 µM tungstate or molybdate for different Shewanella strains.
Determined at pH 7.2 using methyl viologen coupled redox assay. Results normalised to protein
concentration as determined by BCA assay. Full strain details can be found in Table 4.1 above.
A major consideration in this experiment was the relative ratio of formate
oxidation to CO2 reduction, since those that may favour CO2 reduction would
potentially be better suited catalysts for CO2 reduction in subsequent work. Of
the strains studied most showed similar relationships to S.oneidensis MR-1,
with slightly, or in some cases significantly, smaller CO2 reduction rates
compared to formate oxidation. Indeed in this respect S.oneidensis MR-1
demonstrated a suitable strain for this work as it catalysed one of the highest
CO2 reductase activities observed. Despite this the results obtained for CO2
reduction in S.amazonensis SB2B were of potentially more interest. Not only
were rates of CO2 reduction for this species relatively high when compared to
other strains, they were also observed regardless of which metal was
supplemented, with activities of 0.39 ± 0.06 µmolmin-1mg-1 and 0.61 ± 0.09
µmolmin-1mg-1 when grown with tungstate and molybdate respectively.
Furthermore formate oxidation in these conditions was either low, 0.07 ± 0.01
µmol min-1mg-1 when grown with tungstate, or not detected at all when grown

145
with molybdate, demonstrating the highest ratio of CO2 reduction to formate
oxidation observed and making S.amazonensis SB2B of potential interest for the
future.
4.13 Discussion
4.13.1 Establishing quantitative FDH and CO2 reductase assays.
The use of methyl viologen as a redox dye for development of FDH and CO2
reductase assays developed in this chapter was carefully considered. As seen in
Figure 4-1 the use of alternative dyes such as benzyl viologen were unable to
effectively facilitate CO2 reduction, even if they performed as well as methyl
viologen for the forward reaction. The most likely explanation for this
observation is the relative redox potentials of the two dyes. One of the principal
reasons for using methyl viologen was its low reduction potential at -446 mV vs
SHE (Illichmanová et al. 2011). In contrast benzyl viologen has a less negative
redox potential (-350 mV) which may not provide a sufficient driving force for
CO2 reduction considering the published reduction potential of the CO2/formate
couple at -420 mV vs SHE (Armstrong & Hirst 2011).
Another important consideration for this redox dye was membrane
permeability. Considering these assays were conducted on whole cell samples,
slow or ineffective diffusion of dyes across membranes would potentially cause
constraints. Indeed several classical studies demonstrated the inability of both
reduced methyl and benzyl viologen species, as well as the oxidised radical form
of methyl viologen, to permeate cytoplasmic membranes of gram negative
bacteria (Jones et al. 1976). This is an important distinction because in contrast
to methyl viologen the oxidised form of benzyl viologen is capable of diffusion
into the cytoplasm (Jones et al. 1976). Since equivalent FDH activities, (i.e. the
reactions requiring the oxidised form of the dyes), were observed regardless of
which bipyridilium dye was used (Figure 4-1) it can be implied that all FDH
activity is located in the periplasm, in keeping with genomic predictions. This
logic assumes that the dyes are otherwise comparable redox partners.
Despite the minor point above, the permeability of the redox dyes was not a
major consideration for these studies, it is assumed, since catalysis can be
readily observed in whole cells, that all redox states of these dyes are able to

146
pass into the periplasm, most likely via porin structures that make the outer
membranes of gram negative bacteria permeable to small molecules (Nikaido
2003).
Na carbonate was used as a substrate when investigating CO2 reductase
activity throughout this work rather than gaseous CO2. The use of Na carbonate
to provide CO2 for CO2 reductase assays is used in several publications
(Bassegoda et al. 2014) (Maia et al. 2016). Specifically the use of Na carbonate is
possible due to the dissociation of carbonate in water according to the following
reactions eq. (4.3) to (4.7):
𝑁𝑎2𝐶O3 ⇌ 2Na+ + 𝐶𝑂32− (4.3)
𝐶𝑂32− + 𝐻+ ⇌ HCO3 − (4.4)
𝐻𝐶𝑂3− + 𝐻+ ⇌ H2CO3 (4.5)
H2CO3 ⇌ CO2(aq) + 𝐻2𝑂 (4.6)
CO2(aq) ⇌ CO2(g) (4.7)
When dissolved in water carbonate (CO32-) undergoes a series of protonation
events, first into bicarbonate (HCO3-) (eq.(4.4)) followed by carbonic acid (H2CO3)
(eq.(4.5)). Carbonic acid will further equilibrate in water to produce dissolved
CO2 (CO2 (aq)) (eq.(4.6)) (Palmer & Vaneldik 1983). Although aqueous CO2 is
the substrate used in this study it is important to note a further equilibrium
(eq.(4.7)) that is established between the dissolved CO2 and that in the
surrounding atmosphere (CO2(g)) which is dependent upon the CO2 partial
pressure in the environment. Since these complicated equilibria exist
simultaneously it is difficult to determine exact substrate concentrations for
CO2 reductase assays, indeed it is possible that other carbonate species may
contribute to catalysis. This said, considering equivalent CO2 reductase activity
was observed when CO2 gas was injected into the same assay conditions, it does
not seem unreasonable to assume CO2 is indeed the substrate as found for other
metal dependent FDH enzymes (Maia et al. 2016). An important note here is
that changes in pH were not observed in these experiments. It could be
suggested that the equilibria described above would increase the pH however

147
this was not observed and the buffering capacity of the 100 mM HEPES in the
assay conditions proved sufficient to counter any such changes.
Whilst developing the CO2 reductase assay the suitability of other assay
components had to be considered. For example the use of HEPES as a buffer
was carefully considered as it has been reported to be capable of acting as an
electron donor in certain contexts (Ainsworth et al. 2016). However appropriate
controls demonstrated that HEPES alone was not able to reduce methyl
viologen, nor did it change assay results when replaced with Mcilvaine buffers.
This is largely expected as HEPES, a well-established biochemical reagent
(Good et al. 1966), is frequently used for redox studies (Ferreira et al. 2015)
Phosphate buffers were avoided due to their tendency not only to inhibit a wide
range of enzymatic functions, but also chelate metals, a major concern in these
studies (Ferreira et al. 2015).
As mentioned above phosphate buffers were avoided due to concerns about their
complexing with metal ions, such concerns were also raised about HEPES. No
literature exists on the ability of HEPES to chelate or complex with Mo or W,
the metals of most significance in these studies. However HEPES ability to
complex other metals has received attention. Despite the majority of studies
suggesting HEPES does not form metal complexes, and HEPES being
specifically marketed as ‘‘non-metal-coordinating’’ (Sokołowska & Bal 2005),
other studies have suggested low stability constants for Cu, Zn, Pb and Cd with
HEPES (Sokołowska & Bal 2005)(Ferreira et al. 2015). This suggests they may
complex to a small degree, although these findings are debated (Ferreira et al.
2015), and are noted as being minor compared to equivalent complexing
phenomena observed when using phosphate or Tris buffers (Sokołowska & Bal
2005). Indeed HEPES and MES have been observed to be the best zwitterionic
buffers to use for several metal sensitive experiments (Brom et al. 2012). Taken
together HEPES and MES (for anion exchange experiments) were deemed
appropriate buffer choices for these studies.
Whilst developing the CO2 reductase assay it was apparent a reductant would
be required to reduce methyl viologen prior to assessing CO2 reduction. Na
dithionite was chosen because of its frequent use in biochemistry but also
because of its unusually low redox potential at pH7 and 25 oC of -0.66 V vs SHE
(Mayhew 1978). Very few other compounds are capable of effectively reducing
148
methyl viologen. When used in this capacity, sodium dithionite (S2O42-) doesn’t
act directly as a reductant, instead it first transitions into the radical SO2- as
seen below in eq. (4.8). This radical species then provides the reductive
electrons, with concomitant conversion to bisulphite (HSO3-) (eq.(4.9).
𝑆2𝑂42− ⇌ 2𝑆𝑂2 ∙− (4.8)
2𝑆𝑂2 ∙− + 𝐻2𝑂 ⇌ 𝐻𝑆𝑂3− + 𝐻+ + 𝑒− (4.9)
The conversion to bisulphite is of significance as this reaction is not
unidirectional, indeed especially at lower pH values bisulphite can act to oxidise
methyl viologen (Mayhew 1978) the full importance of this is discussed for pH
dependent studies.
Considering the above details it was assumed that when considering CO2
reductase activity 1 M of dithionite would dissociate into 2 M of SO2-. This in
turn would reduce 2 M of methyl viologen according to eq. (4.10).
2𝑆𝑂2 ∙− + 2𝑀𝑉2+ ⇌ 2𝐻𝑆𝑂3− + 2𝑀𝑉 ∙+ (4.10)
Finally catalysed by CO2 reductase, 2 M of methyl viologen would facilitate
reduction of 1 M of CO2 to formate (HCO2-) eq. (4.11).
2𝑀𝑉 ∙+ + 𝐶𝑂2 → 𝐻𝐶𝑂2− + 2𝑀𝑉2+ (4.11)
Throughout CO2 reductase studies it was assumed the above reactions were
occurring. In reality however it is likely that each step was not 100% efficient.
One practical consideration for the developed CO2 reduction assay was the
extended amount of time samples were left to equilibrate with methyl viologen
in an anaerobic environment before assaying for CO2 reductase activity. First for
25 min with oxidised methyl viologen whilst sparging with nitrogen followed by
15 further minutes with reduced methyl viologen (via dithionite). These steps
were found to be important as without them, estimations of CO2 reduction
varied unpredictably between replicates. One explanation for this requirement
is that time was needed to allow background cellular reactions to abate,
consuming any available traces of metabolites not removed during the

149
proceeding wash steps. However, an alternative explanation involves reduction
reactivation. Many molybdopterin enzymes have been reported to need to be
reduced in order to function efficiently (Field et al. 2005). Unlike the irreversible
inactivation by oxygen of some proteins, examples of re-activation under
prolonged reductive conditions have been reported for several nitrate reductase
enzymes including NarG from E.coli, the cytoplasmic Nas of Synechococcus
elongatus and periplasmic Nap from Rhodobacter sphaeroides (Jacques et al.
2014), enzymes from the same W/Mo bis-PGD family as FDH.
4.13.2 FDH and CO2 reductase activities in S.oneidensis MR-1.
As seen in Figure 4-2 CO2 reductase activity mirrored FDH activity in the
minimal growth conditions studied. Highest activities of 0.57 ± 0.03 µmolmin-
1mg-1 were observed when growth was supplemented with tungstate, furthering
the case for FDH and CO2 reductase activities being catalysed by the same
enzyme population reversibly and that tungstate is important for their maximal
activity.
Assuming that W is naturally incorporated into the FDH PGD cofactor in
S.oneidensis MR-1 cells for formate oxidation to contribute to respiration, the
high levels of CO2 reduction activity demonstrated under W growth conditions
via methyl viologen assay seem counterintuitive. This is especially true
considering reduction rates were almost equal to formate oxidation rates (Figure
4-2). It is assumed that the observed reduction rates are not seen under normal
physiological conditions as such reversible activity would prevent PMF
generation. Indeed physiologically there would be a lack of a strong reductant
such as reduced methyl viologen to provide electrons at a suitable potential
making such activity unlikely without external influences.
Of possible interest is the relative ratio between reduction and oxidation under
these growth conditions. In Chapter 3 it was suggested that the FDH activity
seen when grown with +Mo or when not supplemented with metal may be due
to traces of tungstate being effectively scavenged resulting in a smaller
population of functional enzyme than when grown with W supplementation.
This was based partly on the assumption that only W could produce functional
enzyme. Following this logic, i.e. assuming the differences in activity between
growth conditions are purely based on the amount of enzyme present, and not

150
its physical characteristics, one would expect the ratio between oxidation and
reduction to be the same regardless of growth condition.
However what is observed is that CO2 reduction and formate oxidation are
almost equivalent when grown in W containing conditions, for example 0.7
µmolmin-1mg-1 for formate oxidation vs 0.56 µmolmin-1mg-1 for CO2 reduction
when grown +W. In contrast formate oxidation is 3-4 fold higher than CO2
reduction when grown without W, for example 0.28 µmolmin-1mg-1 for formate
oxidation vs 0.06 µmolmin-1mg-1 for CO2 reduction when grown +Mo. The CO2
reductase activity in these conditions without supplemented W may still be due
to the traces of W containing enzyme, but considering the higher FDH activity it
also seems plausible that at least some proportion of formate oxidation activity
is Mo associated. This will be further investigated in Chapter 5 with analysis of
each FDH isoform in isolation.
From a practical perspective the results in Figure 4-2 highlight the importance
of including W in growth conditions if CO2 reductase activity is to be
investigated. As such only growth in minimal media with tungstate
supplementation was used for culturing cells for other biochemical
investigations discussed below unless specified otherwise.
As seen in Figure 4-3, 20 mM azide inhibited over 80 % of both formate
oxidation and CO2 reduction. At first this appears a very high concentration to
inhibit activity, azide is known to almost completely inhibit FDH activity at
very low concentration for FDHs purified from other organisms, for example
0.01 mM azide induces 99 % inhibition in FDH from Candida boidinii (Schüte et
al. 1976) and similar values are given for FDHs from other organisms (Axley et
al. 1990) where azide is proposed to act as a transition state analog of formate
oxidation (Axley et al. 1990). However these studies are normally conducted on
purified enzyme and azide is a known nonspecific inhibitor of a vast range of
different enzymes, many of which will be present in whole cell assays. These
nonspecific interactions could decrease the concentration available for FDH
inhibition by binding other enzymes as well as other cell components. Other
considerations include potentially restricted access across the outer membrane
or detoxification pathways employed by the cells. Despite the apparently high
concentrations required, the inhibition of both oxidation and reduction by azide

151
supports the hypothesis that both formate oxidation and CO2 reduction are
enzymatically catalysed.
As previously mentioned pH dependent studies using the developed methyl
viologen assay below pH 6.8 were unsuitable. This is attributed to the role of
dithionite and its dissociation into bisulphite upon reduction of methyl viologen
outlined above. At lower pH values bisulphite is capable of re-oxidising methyl
viologen (Mayhew 1978) and thus an equilibrium is established between these
species. In this work, methyl viologen reduction was measured
spectrophotometrically at 578 nm, but below pH 6.8, even with additional
concentrations of dithionite, the equilibria could not be shifted to provide an
equivalent concentration of reduced methyl viologen as at higher pH
experiments for the subsequent CO2 reduction assay.
The pH dependence of reversible FDH activity seen in Figure 4-5 does largely fit
with expectations, with CO2 reduction prevailing at low pH and formate
oxidation at high pH. This is in accordance with studies of FDH1 from
Syntrophobacter fumaroxidans where increased CO2 reduction was observed at
lower pH. This is possibly due to a higher availability of protons for catalysis,
(Hayashi & Ogo 2003) or more favourable protein conformation, (Choe et al.
2014) it is also possible that the changing equilibrium of carbonate species in
solution at different pH may play a role, at lower pH CO2 is the predominant
form and catalysis would involve the 2e-, 1 proton reduction of CO2 to formate
whereas at higher pH bicarbonate and carbonate species predominate and
catalysis would require the 2e-, 2H+ reduction to formate (Reda et al. 2008).
Another explanation relates to proposed mechanistic model in Chapter 1 in
which the protonated active site sulpho ligand (Mo4+-SH), favoured at lower pH
values, would be better suited for CO2 reduction whilst the deprotonated
equivalent favoured at higher pH values (Mo6+=S) would enable formate
oxidation (Maia et al. 2016).
Of course a combination of these different effects may contribute to the increase
in observed reduction in increasingly acidic conditions. Regardless of the
explanation the observed increase in reduction at acidic pH can potentially be
exploited in a microbial electrosynthetic context where a lower pH bioreactor
environment would increase efficiency.

152
4.13.3 Initial purification of FDH and CO2 reductase activities
Fumarate reductase activity observed in Figure 4-6 panel A is in keeping with
previous observations (Ross et al. 2011). More practically these results
demonstrate that the methodology used here to normalise initial rates to protein
concentration is appropriate as suggested by the largely similar fumarate
reductase specific activities observed regardless of tungstate or molybdate
supplementation which have had no reported effect on fccA activity or
regulation.
The fact that CO2 reduction and formate oxidation could be observed in
membrane fractions is significant in that it suggests that no other periplasmic
components are essential for catalysis. No formate oxidation or CO2 reduction
was associated with the soluble cell fractions of cultures grown in any
conditions; this is in agreement with the prediction that all three primary FDH
clusters in the Shewanella oneidensis MR-1 genome are membrane associated.
It does however have an implication for the isolated single FDH subunit
encoded by SO_0988, which does not encode membrane associated elements, it
could be suggested this gene is not expressed under these conditions or is
associated with another complex, possibly a FHL complex as previously
described and speculated by some authors (Meshulam-Simon et al. 2007).
However study of formate oxidation in deletion strains in the following chapter
suggests this is not the case. Instead it seems likely that in the conditions
studied here, and by others (Kane et al. 2016), SO_0988 has no detectable role
in formate oxidation or CO2 reduction.
The ratio of formate oxidation to CO2 reduction would be expected to remain
constant between whole cells and membrane samples, since the same enzyme
population is expected to catalyse both. This is true in +W growth conditions,
with reduction:oxidation ratios of 0.81:1 for whole cells and 0.84:1 for membrane
fractions. However in +Mo grown cells, equivalent ratios of 0.21:1 in whole cells
and 0.12:1 in membrane fractions are observed. Due to the proportionally large
errors on these values conclusions should be made with caution, but if correct
may suggest either CO2 reductase activity is inactivated or inhibited by the
membrane separation procedure, (or that formate oxidation is augmented by the

153
procedure), and these effects only occur when growth is supplemented with
molybdate.
4.13.4 Native protein purification of Fdh2α.
To confirm a role in active catalysis for W, and not just a role as a regulatory
element, Fdh2α (SO_4513) was purified and analysed for metal content. Fdh2α
was chosen, over Fdh1α (SO_4509) or Fdnα (SO_0101), as gene expression
studies in Chapter 3 showed highest upregulation of SO_4513 in response to W.
To better monitor Fdh2α activity in isolation a genomic mutant lacking Fdh1αβγ
(SO_4509-SO_4511) and Fdnαβγ (SO_0101_SO_01013) was used for the
purification.
Fdh2α was successfully purified from minimal media containing W culture. The
purification steps and corresponding activities are shown in Figure 4-9. Of
interest is the initial rise in both specific and total activity between whole and
cell lysate samples. An equivalent rise was also seen in Figure 4-10 during a Mo
supplemented purification. It would be expected that total activity could not
increase during a purification but this does not account for the fact that the
whole cell environment may limit activity. Factors such as diffusion of methyl
viologen across outer membranes, accessibility of FDH enzyme within the
membrane to the redox dye, as well interactions with other cellular proteins or
the redox state of the periplasm and inner membrane may influence and limit
FDH activity in whole cells. Once cells are lysed such restrictions are removed
allowing higher rates of catalysis to be monitored by the same enzyme
population.
Whilst discussing cell lysis it is pertinent to highlight the fact that during
Fdh2α purification cells were lysed using French press, but previous studies on
localising enzymatic activity (Figure 4-6) used sonication for lysis. Sonication
was found to not scale well at the higher volumes required for protein
purification, with the extended sonication needed for complete lysis causing poor
recovery of active Fdh2α. Although less damaging it was found that after lysis
by French press, membrane separation by ultracentrifugation was less efficient
than seen after sonication. Whereas all FDH activity was membrane associated
in Figure 4-6, some activity remained in the soluble fraction when using French
press for lysis, partly explaining the poor recovery of Fdh2α activity between

154
lysate and membrane fraction steps in Figure 4-9 and Figure 4-10. Several
attempts failed to successfully isolate the Fdh2α activity found in the soluble
fraction hence purification from the membrane fraction.
Although a large fraction of total activity remained in the soluble fraction,
subsequent activity losses during purification were relatively low. Indeed almost
all activity was retained following selective sarkosyl solubilisation, with no
detectable FDH activity being associated with outer membrane fractions. This
highlights that for this methodology, sarkosyl very efficiently separated FDH
activity from other outer membrane proteins. This is in contrast to some studies
which only found this technique to be partially effective (Yarzábal et al. 2002).
Two chromatography steps were required for isolation of Fdh2α following
sarkosyl solubilisation. Optimisation of the anion exchange procedure showed
that it was possible to elute active Fdh2α from anion exchange matrices without
difficulty, but often with considerable concentrations of other proteins. These
initial attempts used pH 7.2 HEPES buffer, since this was above the theoretical
pI of Fdh2α. Following this limited success, cation exchange chromotorapghy
was attempted using a CAPTO-S column instead. For this investigation pH 6
MES buffer was used as this was below the theoretical pI of Fdh2α, implying a
net positive charge on the protein. In reality however Fdh2α failed to bind the
cation exchange membrane at this pH. Instead it was run on the previous
QSEPH anion exchange column were it was found to bind, even at pH 6.
(Negatively charged sarkosyl also binds such a matrix, limiting column binding
capacity.) This resolved a number of the above issues with Fdh2α eluting with
far fewer other contaminants than seen at higher pH values. The fact that
Fdh2α is able to effectively bind Q-sepherose matrices below its theoretical pI
suggests the actual pI value may be significantly different, as is often the case
between theoretical and actual pI values (Sillero & Ribeiro 1989). Whilst
optimising the anion exchange procedure it was found that different elution
profiles were observed if using elution gradients, i.e. gradually increasing NaCl
concentrations, as opposed to step gradients, when the NaCl was changed
abruptly. The latter was found to be more effective for Fdh2 purification, with
elution gradients causing slow elution over a large range of salt concentrations.

155
After anion exchange chromatrography Fdh2α was greatly enriched, with only
traces remaining of other lower molecular weight contaminants. As such the
final size exclusion step was required. Size exclusion chromatography was also
beneficial as it acted as an effective desalting step, with the salt eluting after
the fractions containing Fdh2α as determined by a single large peak in
conductivity. This step removed all other small molecular weight protein
contaminants co-purified with Fdh2α after the Q-Sepherose column, with the
only minor remaining contaminant running at 50 kDa. Figure 4-9 panel B. This
contaminant was minor and was at first thought to be either Fdh2β (SO_4514,
20.49 kDa) or Fdh2γ (SO_4515, 36.45 kDa), proteins expected to be purified with
Fdh2α (SO_4513). Considering the predicted sizes, only a complex of the two
proteins would be expected to run at such a weight, unlikely considering the
harsh SDS-PAGE environment. Mass spectrometry was used to try and identify
the contaminant unsuccessfully, although the single larger band was identified
as Fdh2α. Despite the minor contaminant, Fdh2α was considered suitably pure
for metal analysis.
Despite effective purification methods such as the sarkosyl solubilsation
discussed above, activity was lost throughout Fdh2α purification. When using
molybdate grown cultures Fdh2α could not be isolated using the same methods
used for isolation when grown +W. The purification steps were not suitable for
such comparatively low starting quantities of enzyme, 230 μmol min-1 (Figure
4-10), compared to 3768 μmol min-1 when grown with tungstate (Figure 4-9).
This is highlighted in Figure 4-10 where no active protein could be recovered
after size exclusion chromatography.
Although specific activity rises throughout the tungsten supplemented
purification, it only rises by a factor of 7 during the entire purification. This is in
contrast to many protein purifications which can rise by factors of several
thousand (Enoch & Lester 1975) or even more (Fox et al. 1989). This modest rise
in specific activity could be explained either by FDH protein comprising a large
percentage of total initial protein, or the more likely case of activity being lost
throughout the preparation. It is possible that Fdh2α activity is only optimal in
the presence of Fdh2β and Fdh2γ and by separating Fdh2α, activity is
diminished. Alternatively many FDH proteins have been shown to be quickly
and irreversibly inactivated by oxygen and although the purification steps

156
following lysis were conducted anaerobically these conditions only maintain
oxygen concentrations below 20 ppm.
Although this work refers to Fdh2α purification it is important to specify that
Fdh2α is likely purified in complex with Fdh2β and Fdh2γ for at least part of
this work. Since Fdh2α is not itself predicted to be membrane associated it
seems likely that this is the case as FDH activity was membrane associated
after both cell fractionation and sarkosyl solubilisation. Indeed for this reason
non-ionic detergents were included during both anion exchange and size
exclusion purification steps. Initial experiments were conducted using triton X-
100 at 1%, but due to the large micelle sizes formed, it was found to prevent
effective size exclusion separation. Instead 0.01% DDM was used, which
although just above the critical micelle concentration in water of 0.009%
(0.17mM) (Oliver et al. 2014) did not show comparable issues. Although
detergents were included to maintain membrane associated complexes, no
bands corresponding to Fdh2β (20.49 kDa) and Fdh2γ (36.45 kDa) or Fdh2βγ
(56.94 kDa) or the full complex, Fdh2αβγ (162.4 kDa) were seen in Figure 4-9
panel B as discussed above. This suggests that at some point during the
purification Fdh2α dissociates from Fdh2βγ.
Purification of Fdh2α was achieved using classical biochemical techniques based
solely on the native properties of the protein. Genetic tags were not introduced
due to their tendency to induce minor conformational changes to proteins as
well as the ability of some tags, (for example hexahistidine tags) to chelate and
interfere with binding of metal cofactors (Lichty et al. 2005), a major drawback
for such studies where minor changes may affect native metal binding.
ICP-MS analysis of the purified Fdh2α suggests an approximately a 1.3:1 ratio
of W to protein. This is close to the 1:1 expected ratio arising from a single PGD
cofactor per protein. The fact that W and not Mo is detected supports previous
work implicating W in catalysis of FDH oxidation in S.oneidensis. Purified
protein could not be obtained from the equivalent molybdate supplemented
preparation to determine if Fdh2α is able to coordinate Mo as well as W,
depending on the metal supplemented.

157
4.13.5 Aspects of FDH and CO2 reductase activities for further investigation
Shewanella amazonensis SB2B demonstrated high levels of CO2 reductase
activity, not only when grown with tungsten (0.39 ± 0.06 µmolmin-1mg-1), as was
true for most other Shewanella strains, but also when grown with molybdate
(0.61 ± 0.09 µmolmin-1mg-1), this makes it an exciting candidate for microbial
synthetic exploitation, especially as it also displayed very little formate
oxidation activity avoiding complications with equilibria being established,
which would reduce efficiency.
S.amazonensis SB2B grew in formate containing media supplemented +Mo
despite having no detectable FDH activity. This may suggest that this species is
able to grow in these media conditions without oxidising the available formate,
perhaps relying entirely on the provided amino acids for both carbon and
energy. Alternatively it may suggest the unsuitability of the assay to detect
formate oxidation in this species, either due to the very slow kinetics or
functional differences that prevent coupling to methyl viologen reduction.
Of the other strains investigated, S.oneidensis MR-1 displayed one of the
highest CO2 reduction rates, combined with its relatively well characterised
physiology compared to the other strains it was still considered appropriate for
studying electrosynthesis of formate in Chapter 6.
The investigation of FDH and CO2 reductase activity in LB growth conditions
shown in Figure 4-8 has some interesting implications. The fact that FDH
activity could be observed when W was supplemented suggests that it is possible
to have active FDH enzyme(s) produced under aerobic growth conditions. The
exact isoform responsible for this activity may prove less oxygen sensitive than
the purified Fdh2α described in this chapter. Another consideration would be
whether such aerobic enzyme(s) and their formate oxidation had any role in
aerobic respiration, or whether the enzyme(s) are simply expressed in response
to the presence of W.
Figure 4-8 also demonstrates higher enzymatic activities in anaerobic LB
supplemented with W. This is in agreement with the previous anaerobic
growths in minimal media, but is somewhat surprising to see in the commonly
used rich LB media, thought to contain all necessary metals. The fact that

158
enzymatic activity can be increased by supplementing W raises several
possibilities. Either W is present in LB at insufficiently low concentrations, or is
chelated/sequestered in some manner, preventing incorporation into the FDH
cofactors, or W is needed for upregulation of FDH expression.
When comparing specific activities seen in LB with those in minimal media,
FDH activity is higher in W supplemented LB conditions. In contrast CO2
reductase activities are higher in minimal media, since this is the reaction of
interest, minimal media were used for subsequent CO2 reductase studies.
The kinetic parameter determinations in Figure 4-7 were estimated in whole
cells, complicating analysis as these values may report on the combined action
of several enzyme populations.
Whole cell Km values of 39 ± 5 µM and 1.43 ± 0.26 mM were determined from
Figure 4-7 for formate oxidation and CO2 reduction respectively. Notably the Km
value for formate oxidation (KmCOO-) is over 36 times smaller than for CO2
reduction (KmHCO3-), implying a higher affinity for this substrate, unsurprising
considering the native role of these enzymes. Similar biases have been reported
for other FDH enzymes, with higher affinity for formate than carbonate.
Examples include enzymes from Pseudomonas oxalaticus with a KmCOO- of 100
µM and KmHCO3- of 40 mM (Ruschig et al. 1976), Desulfovibrio desulfuricans with
a KmCOO- of 57 µM and Km
HCO3- of 15.7 mM (Maia et al. 2016) and the HDCR
complex of Acetobacterium woodii with a KmCOO- of 1 ± 0.3 mM and Km
HCO3- of 37
± 4 mM (Schuchmann & Müller 2013). Other metal dependent FDH KmCOO-
literature values also exist when the reverse reaction was not studied, the
KmCOO- value determined in this work (39 ± 5 µM) is also comparable to these
values: 280 µM (R.capsulatus) (Hartmann & Leimkühler 2013), 8 µM
(D.vulgaris Hildenborough) (Silva et al. 2011), 40 µM (FDH1-S.fumaroxidans)
and 10 µM (FDH2-S.fumaroxidans) (de Bok et al. 2003).
In addition to Km values, comparisons can be made with the estimated kcat
values for purified Fdh2α determined in this chapter, specifically 12 ± 4.3 s-1 for
formate oxidation and 10.7 ± 3.8 s-1 for CO2 reduction. It should be noted
however that since Michaelis-Menten plots were not plotted for purified Fdh2α
due to insufficient yield, (instead only determining activity with 10 mM
substrate) these values are not true kcat values. The determined turnover

159
number for formate oxidation (kcatCOO-, 12 ± 4.3 s-1) in this work was slow in
comparison to many other literature reported values: 5600 s-1 (FDH1
S.fumaroxidans), 2800 s-1 (FDH-H E.coli), 1900 s-1 (FDH1 S.fumaroxidans), 543
s-1 (D.desulfuricans), 270 s-1 (R.eutropha), 262 s-1 (D.vulgaris Hildenborough), 90
s-1 (R.capsulatus), 90 s-1 (P.oxalaticus), 39 s-1 (HDCR A.woodii) and 6.2 s-1
(M.thermoacetica) (de Bok et al. 2003; Reda et al. 2008; Maia et al. 2015; Maia
et al. 2017; Maia et al. 2016).
In contrast the determined turnover number for CO2 reduction (kcatHCO3-, 10.7 ±
3.8 s-1) in this work was slower than several previously characterised enzymes
but considerably faster than many others. Arranged from faster to slowest: 2500
s-1 (FDH1 S.fumaroxidans), 200 s-1 (FDH2 S.fumaroxidans), 46 s-1
(D.desulfuricans), 28 s-1 (HDCR A.woodii), 11 s-1 (C.necator), 3.4 s-1 (D.vulgaris
Hildenborough), 3 s-1 (P.oxalaticus), 1.5 s-1 (R.capsulatus) and 0.08 s-1
(C.carboxidivorans) (Reda et al. 2008; Schuchmann & Müller 2013; Maia et al.
2015; Maia et al. 2017; Maia et al. 2016; Yu et al. 2017).
Both formate oxidation and CO2 reduction rates decreased at higher substrate
concentrations than those shown in Figure 4-7 with associated changes in pH,
becoming more acidic with excess formate and more basic with excess carbonate,
suggesting the buffering capacity of the assay was insufficient. Considering the
above work on pH dependence this would explain the decreasing enzymatic
activities in excess of substrate, with formate oxidation shown to decrease at
lower pH values and CO2 reduction to decrease at higher pH values (Figure 4-5).
The possibility of substrate inhibition should also be considered. Substrate
inhibition affects 20% of all enzymes according to some estimations (Reed et al.
2010) and results in inhibited activity at high substrate concentrations, though
a variety of mechanisms including allosteric effects. Substrate inhibition is
sometimes considered an experimental inconvenience resulting from
physiologically irrelevant levels of substrate, but there are many reported cases
of substrate inhibition playing an important role in native enzymatic function
(Reed et al. 2010). Examples of FDH substrate inhibition could not be found in
the literature, excluding substrate inhibition by NADH in the case of a
reversible NAD+ dependent FDH (Hartmann & Leimkühler 2013). Considering
this, and the explanation relating to changing pH given above, the data in
Figure 4-7 was considered appropriate to present without concerns of

160
inappropriate Km determinations that can arise from truncating data sets
suspected of being affected by substrate inhibition (Lin et al. 2001).
To conclude, this section of work established effective methods for the
quantitative measurement of both FDH and CO2 reductase activities in whole
S.oneidensis cells and then used them to conclusively demonstrate for the first
time CO2 reduction to formate using NMR. Further study concluded that
maximal activities for both reactions are dependent upon the presence of
tungstate in the growth media and confirmed that both reactions were inhibited
by azide and were pH dependent, with the reduction favoured at acidic pH
values and oxidation during more basic conditions. Localisation studies reveal
that both WT activities co-purified and were membrane associated. Work with a
deletion mutant strain demonstrated the native purification of Fdh2α and the
presence of W at its active site as determined by ICP-MS with an estimated
turnover rate for CO2 reduction of 10.7 ± 3.8 s-1. Remaining studies suggested
future avenues of research including the study of alternative Shewanella species
including S.amazonensis SB2B which showed CO2 reductase but no observable
FDH activity. Other avenues include the study of less defined media, attractive
from a biotechnological standpoint, which when supplemented with W were also
shown to produce cultures capable of CO2 reductase activity. Finally the kinetics
of these activities were explored and although it was found results could be
modelled with first order kinetics, with apparent Km values of 39 ± 5 µM and
1.43 ± 0.26 mM for formate oxidation and CO2 reduction respectively, following
work using deletion strains is deemed necessary to fully explore the involved
kinetics.
4.14 References
Ainsworth, E. V. et al., 2016. Photoreduction of Shewanella oneidensis Extracellular Cytochromes
by Organic Chromophores and Dye-Sensitized TiO2. ChemBioChem, pp.2324–2333.
Armstrong, F. a & Hirst, J., 2011. Reversibility and efficiency in electrocatalytic energy conversion
and lessons from enzymes. Proceedings of the National Academy of Sciences of the United
States of America, 108(34), pp.14049–54.
Axley, M., Grahame, D. & Stadtman, T., 1990. Escherichia coli formate-hydrogen lyase.
Purification and properties of the selenium-dependent formate dehydrogenase component.
Journal of Biological Chemistry, 265(30), pp.18213–18218.
161
Axley, M.J., Böck, A. & Stadtman, T.C., 1991. Catalytic properties of an Escherichia coli formate
dehydrogenase mutant in which sulfur replaces selenium. Proceedings of the National
Academy of Sciences of the United States of America, 88(19), pp.8450–4.
Bassegoda, A. et al., 2014. Reversible Interconversion of CO2 and Formate by a Molybdenum-
Containing Formate Dehydrogenase. Journal of the American Chemical Society, 136(44),
pp.15473–6.
de Bok, F. a. M. et al., 2003. Two W-containing formate dehydrogenases (CO2-reductases) involved
in syntrophic propionate oxidation by Syntrophobacter fumaroxidans. European Journal of
Biochemistry, 270(11), pp.2476–2485.
Brom, M. et al., 2012. Improved labelling of DTPA- and DOTA-conjugated peptides and antibodies
with 111In in HEPES and MES buffer. EJNMMI research, 2, p.4.
Choe, H. et al., 2014. Efficient CO2-Reducing Activity of NAD-Dependent Formate Dehydrogenase
from Thiobacillus sp. KNK65MA for Formate Production from CO2 Gas. PloS one, 9(7),
p.e103111.
Enoch, H. & Lester, R., 1975. The purification and properties of formate dehydrogenase and
nitrate reductase from Escherichia coli. Journal of Biological Chemistry.
Ferreira, C. et al., 2015. (Un)suitability of the use of pH buffers in biological, biochemical and
environmental studies and their interaction with metal ions – a review. RSC Adv., 5(39),
pp.30989–31003.
Field, S.J. et al., 2005. Reductive activation of nitrate reductases. Dalton Transactions, 2005(21),
pp.3580–3586.
Fox, B.G. et al., 1989. Methane Monooxygenase from Methylosinus trichosporium OB3B. Journal
of Bacteriology, 264(17), pp.10023–10033.
Good, N.E. et al., 1966. Hydrogen ion buffers for biological research. Biochemistry, 5(2), pp.467–
477.
Hartmann, T. & Leimkühler, S., 2013. The oxygen-tolerant and NAD+-dependent formate
dehydrogenase from Rhodobacter capsulatus is able to catalyze the reduction of CO2 to
formate. FEBS Journal, 280(23), pp.6083–6096.
Hayashi, H. & Ogo, S., 2003. Accelerating effect of a proton on the reduction of CO2 dissolved in
water under acidic conditions. Isolation, crystal structure, and reducing ability of a water-
soluble. Journal of the American …, pp.14266–14267.
Illichmanová, a et al., 2011. Nitrate reductase whole-cell assay: side effects associated with the
use of benzyl viologen. Folia microbiologica, 56(1), pp.72–6.
Jacques, J.G.J. et al., 2014. Reductive activation in periplasmic nitrate reductase involves
chemical modifications of the Mo-cofactor beyond the first coordination sphere of the metal

162
ion. Biochimica et biophysica acta, 1837(2), pp.277–86.
Jones, R.W., Gray, T. a & Garland, P.B., 1976. A study of the permeability of the cytoplasmic
membrane of Escherichia coli to reduced and oxidized benzyl viologen and methyl viologen
cations: complications in the use of viologens as redox mediators for membrane-bound
enzymes. Biochemical Society transactions, 4(4), pp.671–3.
Kane, A.L. et al., 2016. Formate metabolism in Shewanella oneidensis generates proton motive
force and prevents growth without an electron acceptor. Journal of Bacteriology, 198(8),
pp.1337–1346.
Lichty, J.J. et al., 2005. Comparison of affinity tags for protein purification. Protein Expression
and Purification, 41(1), pp.98–105.
Lin, Y.U.H. et al., 2001. Substrate Inhibition Kinetics for Cytochrome P450-Catalyzed Reactions
Abstract : Drug metabolism and disposition, 29(4), pp.368–374.
Maia, L.B. et al., 2016. Reduction of Carbon Dioxide by a Molybdenum-Containing Formate
Dehydrogenase: A Kinetic and Mechanistic Study. Journal of the American Chemical
Society, 138(28), pp.8834–8846.
Maia, L.B., Moura, I. & Moura, J.J.G., 2017. Molybdenum and tungsten-containing formate
dehydrogenases: aiming to inspire a catalyst for carbon dioxide utilization. Inorganica
Chimica Acta, 455(2), pp.350–363.
Maia, L.B., Moura, J.J.G. & Moura, I., 2015. Molybdenum and tungsten ‑ dependent formate
dehydrogenases. J Biol Inorg Chem, 20, pp.287–309.
Mayhew, S.G., 1978. The redox potential of dithionite and SO-2 from equilibrium reactions with
flavodoxins, methyl viologen and hydrogen plus hydrogenase. European journal of
biochemistry / FEBS, 85(2), pp.535–547.
McIlvaine, T., 1921. A buffer solution for colorimetric comparison. Journal of Biological
Chemistry, pp.183–186.
Meshulam-Simon, G. et al., 2007. Hydrogen metabolism in Shewanella oneidensis MR-1. Applied
and environmental microbiology, 73(4), pp.1153–65.
Michlmayr, H. et al., 2011. Characterization of two distinct glycosyl hydrolase family 78 α-L-
rhamnosidases from Pediococcus acidilactici. Applied and Environmental Microbiology,
77(18), pp.6524–6530.
Mordkovich, N.N. et al., 2013. Effect of NAD+-dependent formate dehydrogenase on anaerobic
respiration of Shewanella oneidensis MR-1. Microbiology, 82(4), pp.404–409.
Nikaido, H., 2003. Molecular basis of bacterial outer membrane permeability revisited.
Microbiology and molecular biology reviews : MMBR, 67(4), pp.593–656.

163
Oliver, R.C. et al., 2014. Tuning Micelle Dimensions and Properties with Binary Surfactant
Mixtures. Langmuir, 30(October), pp.13353–13361.
Palmer, D.A. & Vaneldik, R., 1983. the Chemistry of Metal Carbonato and Carbon-Dioxide
Complexes. Chemical Reviews, 83(6), pp.651–731.
Reda, T. et al., 2008. Reversible interconversion of carbon dioxide and formate by an electroactive
enzyme. Proceedings of the National Academy of Sciences of the United States of America,
105(31), pp.10654–8.
Reed, M.C., Lieb, A. & Nijhout, H.F., 2010. The biological significance of substrate inhibition: A
mechanism with diverse functions. BioEssays, 32(5), pp.422–429.
Ross, D.E. et al., 2011. Towards electrosynthesis in shewanella: energetics of reversing the mtr
pathway for reductive metabolism. PloS one, 6(2), p.e16649.
Ruddock, L.W., Hirst, T.R. & Freedman, R.B., 1996. pH-dependence of the dithiol-oxidizing
activity of DsbA (a periplasmic protein thiol:disulphide oxidoreductase) and protein
disulphide-isomerase: studies with a novel simple peptide substrate. The Biochemical
journal, 1005(Pt 3), pp.1001–5.
Ruschig, U. et al., 1976. CO2 reduction to formate by NADH catalysed by formate dehydrogenase
from Pseudomonas oxalaticus. European journal of biochemistry / FEBS, 70(2), pp.325–330.
Schuchmann, K. & Müller, V., 2013. Direct and Reversible Hydrogenation of CO2 to Formate by a
Bacterial Carbon Dioxide Reductase. Science, 342(December), pp.1382–1386.
Schüte, H. et al., 1976. Purification and properties of formaldehyde dehydrogenase and formate
dehydrogenase from Candida boidinii. European journal of biochemistry / FEBS, 62(1),
pp.151–60.
Sillero, A. & Ribeiro, J.M., 1989. Isoelectric points of proteins: Theoretical determination.
Analytical Biochemistry, 179(2), pp.319–325.
Silva, S.M. da et al., 2011. Tungsten and molybdenum regulation of formate dehydrogenase
expression in Desulfovibrio vulgaris Hildenborough. Journal of bacteriology, 193(12),
pp.2909–16.
Sokołowska, M. & Bal, W., 2005. Cu(II) complexation by “non-coordinating” N-2-
hydroxyethylpiperazine-N-2-ethanesulfonic acid (HEPES buffer). Journal of Inorganic
Biochemistry, 99(8), pp.1653–1660.
Staby, A., Jensen, I.H. & Mollerup, I., 2000. Comparison of chromatographic ion-exchange resins.
Journal of Chromatography A, 897(1–2), pp.99–111.
Sundararajan, a et al., 2011. Shewanella oneidensis MR-1 sensory box protein involved in aerobic
and anoxic growth. Applied and environmental microbiology, 77(13), pp.4647–56.

164
Yarzábal, A. et al., 2002. The High-Molecular-Weight Cytochrome c Cyc2 of Acidithiobacillus
ferrooxidans Is an Outer Membrane Protein The High-Molecular-Weight Cytochrome c Cyc2
of Acidithiobacillus ferrooxidans Is an Outer Membrane Protein. J. Bacteriol., 184(1),
pp.313–317.
Yu, X. et al., 2017. Efficient reduction of CO2 by the molybdenum-containing formate
dehydrogenase from Cupriavidus necator (Ralstonia eutropha). Journal of Biological
Chemistry, pp.1–20.

165
5 FDH characterisation in Shewanella
oneidensis MR-1 deletion mutants in
response to metal supplementation
WT S.oneidensis MR-1 contains three FDH gene clusters that respond
differently to the addition of W or Mo in growth media. Chapter 3 began to
investigate this area by studying gene expression of the three catalytic subunit
isoforms Fdh1α, Fdh2α and Fdnα, encoded by SO_4509, SO_4513 and SO_0101
respectively but was unable to determine the contributions of each to the
observed growth phenotypes in minimal media when supplemented with
tungstate or molybdate. Similarly, Chapter 4 was also unable to determine the
contributions of the three isoforms to the WT FDH and CO2 reductase activities,
or their contributions to the observed whole cell Km values for formate and
carbonate. The purification of SO_4513α went some way to confirming that this
enzyme demonstrates CO2 reductase activity when grown with tungstate, but
the contribution of the other heterotrimeric isoforms remains unknown.
To resolve these issues seven in-frame deletion mutants were studied in detail
in this section, their growth phenotypes in minimal media conditions,
corresponding enzymatic activities and Km values for formate and carbonate
were all studied to compliment the previous work in these areas. The
experimental approach for each element of study is briefly described below along
with the nomenclature used throughout this section to avoid ambiguity.
Seven deletion mutants were studied. The first three of these mutants are
referred to as single cluster mutants, and lack only a single FDH isoform, for
example ΔFdh1, a ΔSO_4509-4511 deletion mutant. The next three strains
investigated are referred to as double cluster mutants, for example Fdh1+,
which lacks both ΔSO_0101-0103 and ΔSO_4513-4515 and is named after the
cluster that remains, in this example Fdh1. The final triple cluster mutant
investigated is referred to as ΔFDH and lacks all three fdh gene clusters. The
importance of each mutant lacking not only the α catalytic subunit, but the
entirety of the heterotrimeric isoform, including the α, β and γ subunits is

166
discussed later. A summary table of the mutants studied are provided for ease of
reference in Table 5-1.
Table 5-1 Details of mutant strains used in Chapter 5 and corresponding genotypes.
Full details in Chapter 2.
Deletion in Shewanella
oneidensis MR-1 background Genotype Notation
ΔFdh1 ΔSO_4509-4511 ΔFdh1
ΔFdh2 ΔSO_4513-4515 ΔFdh2
ΔFdn ΔSO_0101-0103 ΔFdn
ΔFdn ΔFdh2 ΔSO_0101-0103
ΔSO_4513-4515 Fdh1+
ΔFdn ΔFdh1 ΔSO_0101-0103
ΔSO_4509-4511 Fdh2+
ΔFdh1 ΔFdh2 ΔSO_4509-4511
ΔSO_4513-4515 Fdn+
ΔFdn ΔFdh1 ΔFdh2
ΔSO_0101-0103
ΔSO_4509-4511
ΔSO_4513-4515
ΔFDH
To enable comparison with the wildtype data from Chapter 3, the same growth
conditions were investigated for growth of the seven deletion mutants,
specifically growth in the minimal media developed containing 50mM sodium
formate and 50mM sodium fumarate as terminal electron acceptor grown
anaerobically supplemented either with 3µM sodium tungstate (+W), 3µM
sodium molybdate (+Mo), both metals at 3µM (+W/+Mo) or supplemented with
neither (-W/-Mo).
In addition to the study of growth, the whole cell FDH and CO2 reductase
specific activities of these strains was also determined using the colourimetric
assays established in Chapter 4. All assays were conducted on whole cell
samples after 24 h growth in minimal media; as such the activity data
presented here represents cells from the final time points in the growth curves
in Figure 5-2, Figure 5-6 and Figure 5-9. Experiments were conducted on whole

167
cell samples as for wildtype. Since each assay is normalised to protein content
both the mutant and wildtype data are comparable.
Km and Vmax determinations were made for both formate oxidation and CO2
reduction for certain mutant strains. These determinations were performed
according to the procedure described in Chapter 4, varying the substrate
concentration and plotting the corresponding specific activities to generate
Michaelis-Menten plots from which the presented kinetic parameters were
derived.
Since this work generated large amounts of data it has been organised into two
sections, the first relating to study of formate oxidation in these mutant strains
and their relevant growth phenotypes and the second addressing the non-
physiologically relevant CO2 reductase activity and all associated experiments.
To ensure clarity these two sections are further split into sub-sections relating
to the study of each FDH isoform, Fdh1, Fdh2, and Fdn in turn.

168
5.1 Microbial physiology and formate oxidation.
5.1.1 Growth and formate oxidation of triple deletion strain (ΔFDH)
Before studying Fdh1, Fdh2 and Fdn in isolation it is first appropriate to
present the results obtained for the triple cluster deletion strain,
ΔFdnΔFdh1ΔFdh2 i.e. that without any of the above FDH isoforms.
This triple deletion strain was unable to grow in the studied minimal media
growth conditions regardless of whether tungstate or molybdate were
supplemented (Figure 5-1). This confirms that no other fdh gene(s) in the
genome are capable of supporting growth on formate under these conditions, in
agreement with genomic predictions.
Figure 5-1 Growth of triple deletion strain ΔFDH in minimal media.
Media supplemented with (A) 3µM sodium tungstate (+W), (B) 3µM sodium molybdate (+Mo) (C)
3µM sodium tungstate and molybdate (+W/+Mo) or (D) With neither metal (-W/-Mo). All panels
represent anaerobic growth in minimal media with 50mM fumarate as terminal electron acceptor.
Wildtype growth shown in grey for comparative purposes. Data represents average of a minimum of
three experimental data sets where error bars represent ± SEM.

169
5.1.2 Importance of Fdh1 for growth and formate oxidation
Fdh1 is the first of three isoforms to be studied in detail. To do this data from
two strains are presented, ΔFdh1, which allows assessment of the effect of
removing Fdh1, and Fdh1+, which allows the study of Fdh1 in isolation, i.e.
with the other two isoforms deleted.
The growth of these strains in minimal media supplemented with tungstate and
or molybdate is presented in Figure 5-2 with WT growth under the same
conditions shown for comparison. As seen in all four panels the ΔFdh1 strain
reached lower OD600 readings after 24 h growth than WT or Fdh1+ suggesting
that deletion of Fdh1 limits final cell density. Fdh1+ reaches final OD600
readings comparable to WT suggesting that Fdh1 in isolation is capable of
supporting growth. When combined, analysis of ΔFdh1 and Fdh1+ strains both
corroborate an importance for Fdh1 for WT growth under all four growth
conditions.
Figure 5-2 Growth of deletion strains ΔFdh1 and Fdh1+ in minimal media.
Media supplemented with (A) 3µM sodium tungstate (+W), (B) 3µM sodium molybdate (+Mo) (C)
3µM sodium tungstate and molybdate (+W/+Mo) or (D) With neither metal (-W/-Mo). All panels
represent anaerobic growth in minimal media with 50mM fumarate as terminal electron acceptor.
Wildtype growth shown in grey for comparative purposes. Data represents average of a minimum of
three experimental data sets where error bars represent ± SEM.

170
The specific FDH activities of these strains was next determined and presented
in Figure 5-3 as a relative proportion of that seen in WT. The ΔFdh1 strain
shows significantly decreased activity compared to WT in all growth conditions
except when grown +Mo alone, where the activity is within error of that seen for
WT. This suggests that Fdh1 is responsible for a proportion of WT activity when
grown +W, +W/+Mo and -W/-Mo yet may not contribute during +Mo growth.
Specific activities seen for Fdh1+ largely support these conclusions. Around 50%
of WT activity is retained when grown +W or +W/+Mo, suggesting Fdh1 is
responsible for around half of WT FDH activity when grown with W. In contrast
Fdh1 in isolation is responsible for less than 20% of WT activity when grown
+Mo or -W/-Mo.
Figure 5-3 Relative FDH activities of ΔFdh1 and Fdh1+ compared to WT.
Activity measured after growth in minimal media for 24 h when growth supplemented with 3µM
sodium tungstate (+W), 3µM sodium molybdate (+Mo), 3µM sodium tungstate and molybdate
(+W/+Mo) or neither metal (-W/-Mo). Activities obtained using colorimetric methyl viologen assay
and normalised to protein content in sample. Presented as % of WT specific activity seen for the
same growth condition. Data represents average of a minimum of three experimental data sets
where error bars represent ± SEM.

171
Following this demonstration that Fdh1 is likely to contribute to WT formate
oxidation activity, in particular those seen when grown +W or +W/+Mo, Km and
Vmax values for formate when grown +W were established for the Fdh1+ strain,
to allow comparison with those seen in whole cells under equivalent conditions.
Km and Vmax for formation oxidation +W were determined from Figure 5-4 as
0.07 ± 0.03 mM and 0.32 ± 0.02 µmol min-1mg-1 respectively.
Since the role of Fdh1 was unclear during +Mo growth conditions Km and Vmax
values were also established under this condition for Fdh1+. This was to
determine whether Fdh1 had a particularly high affinity for formate, potentially
explaining why despite its relative unimportance for native formate oxidation
rates it was seen to be essential for maximal growth under this condition. This
study was also of interest as a different Km value to that determined when
grown +W may suggest a different enzyme population, indirect evidence for
distinct W and Mo containing forms of Fdh1. Km and Vmax for formation
oxidation +Mo were determined from Figure 5-5 as 0.22 ± 0.03 mM and 0.04 ±
0.002 µmol min-1mg-1 respectively.

172
Figure 5-4 Michaelis-Menten plot for formate oxidation in Fdh1+ cells grown +W.
Initial rates determined by measuring increasing absorbance in colorimetric methyl viologen
assay. Each data point represents average of a minimum of three experimental data sets where
error bars represent ± SEM. Data fitted to a hyperbolic function according to the Michaelis Menten
equation. Km and Vmax for formate oxidation determined as 0.07 ± 0.03 mM and 0.32 ± 0.02 µmol
min-1mg-1 respectively.
Figure 5-5 Michaelis-Menten plot for formate oxidation in Fdh1+ cells grown +Mo.
Initial rates determined by measuring increasing absorbance in colorimetric methyl viologen assay.
Each data point represents average of a minimum of three experimental data sets where error bars
represent ± SEM. Data fitted to a hyperbolic function according to the Michaelis Menten equation.
Km and Vmax for formate oxidation determined as 0.22 ± 0.03 mM and 0.04 ± 0.002 µmol min-1mg-1
respectively.

173
5.1.3 Importance of Fdh2 for growth and formate oxidation
Fdh2 was the second of the three isoforms to be studied. For this isoform data
for ΔFdh2, (which allows assessment of the effect of removing Fdh2), and
Fdh2+, (which allows the study of Fdh2 in isolation), are presented.
The growth of ΔFdh2 can be seen in Figure 5-6 with the strain reaching
stationary OD600 values within error seen for WT for all four growth conditions
except +Mo (0.22 ± 0.01 vs 0.30 ±0.05 for WT). This suggests that deletion of
Fdh2 alone does not limit final cell density except under this condition.
Also shown in Figure 5-6 is the growth of Fdh2+. Of those mutants that grew,
Fdh2+ reached the lowest final OD600 in all four studied conditions, only
reaching stationary phase when supplemented +W/+Mo. Fdh2+ remained in
exponential growth after 24 h for all three of the other conditions suggesting
that although Fdh2 is capable of supporting growth in isolation it cannot
maintain the population supported by WT or Fdh1 alone.
Figure 5-6 Growth of deletion strains ΔFdh2 and Fdh2+ in minimal media.
Media supplemented with (A) 3µM sodium tungstate (+W), (B) 3µM sodium molybdate (+Mo) (C)
3µM sodium tungstate and molybdate (+W/+Mo) or (D) With neither metal (-W/-Mo). All panels
represent anaerobic growth in minimal media with 50 mM fumarate as terminal electron acceptor.
Wildtype growth shown in grey for comparative purposes. Data represents average of a minimum of
three experimental data sets where error bars represent ± SEM.

174
Although Fdh2 was observed to contribute less to growth than Fdh1 under these
formate containing growth conditions the FDH activity of both ΔFdh2 and
Fdh2+ were determined and are presented in Figure 5-7 below as percentages of
WT activity under the same conditions.
Figure 5-7 Relative FDH activities of ΔFdh2 and Fdh2+ compared to WT.
Activity measured after growth in minimal media for 24 h when growth supplemented with 3µM
sodium tungstate (+W), 3µM sodium molybdate (+Mo), 3 µM sodium tungstate and molybdate
(+W/+Mo) or neither metal (-W/-Mo). Activities obtained using colorimetric methyl viologen assay
and normalised to protein content in sample. Presented as % of WT specific activity seen for the
same growth condition. Data represents average of a minimum of three experimental data sets
where error bars represent ± SEM.
Deletion of Fdh2 caused large decreases in formate oxidation activity compared
to WT in all four growth conditions, with activities around 60% of WT when
grown +W, +Mo or +W/+Mo and around 25% when grown -W/-Mo. These results
do not correlate with the previous described growth data which suggested a
growth defect in ΔFdh2 only when grown +Mo.
Analysis of Fdh2+ in Figure 5-7 suggest that Fdh2 alone is capable of
comparable formate oxidation specific activities to WT when grown +W or
+W/+Mo. In contrast activities seen for Fdh2+ grown +Mo or -W/-Mo are
effectively non-existent, at 1 or 3% of WT activities respectively. These results
for Fdh2+ are of considerable interest as they not only suggest that in isolation

175
Fdh2 requires tungstate containing conditions to show activity, but also that
these activities are comparable to those seen in WT.
Figure 5-8 Michaelis-Menten plot for formate oxidation in whole Fdh2+ cells grown +W.
Initial rates determined by measuring increasing absorbance in colorimetric methyl viologen
assay. Each data point represents average of a minimum of three experimental data sets where
error bars represent ± SEM. Data fitted to a hyperbolic function according to the Michaelis Menten
equation. Km and Vmax for formation oxidation determined as 0.14 ± 0.05 mM and 0.68 ± 0.03 µmol
min-1mg-1 respectively.
Considering the perceived importance of the Fdh2 isoform for maximal FDH
activities in tungsten supplemented growth conditions, Km and Vmax values were
determined using Fdh2+ whole cells grown +W. Figure 5-8 demonstrated Km
and Vmax values for formation oxidation determined as 0.14 ± 0.05mM and 0.68 ±
0.03 µmol min-1mg-1 respectively.
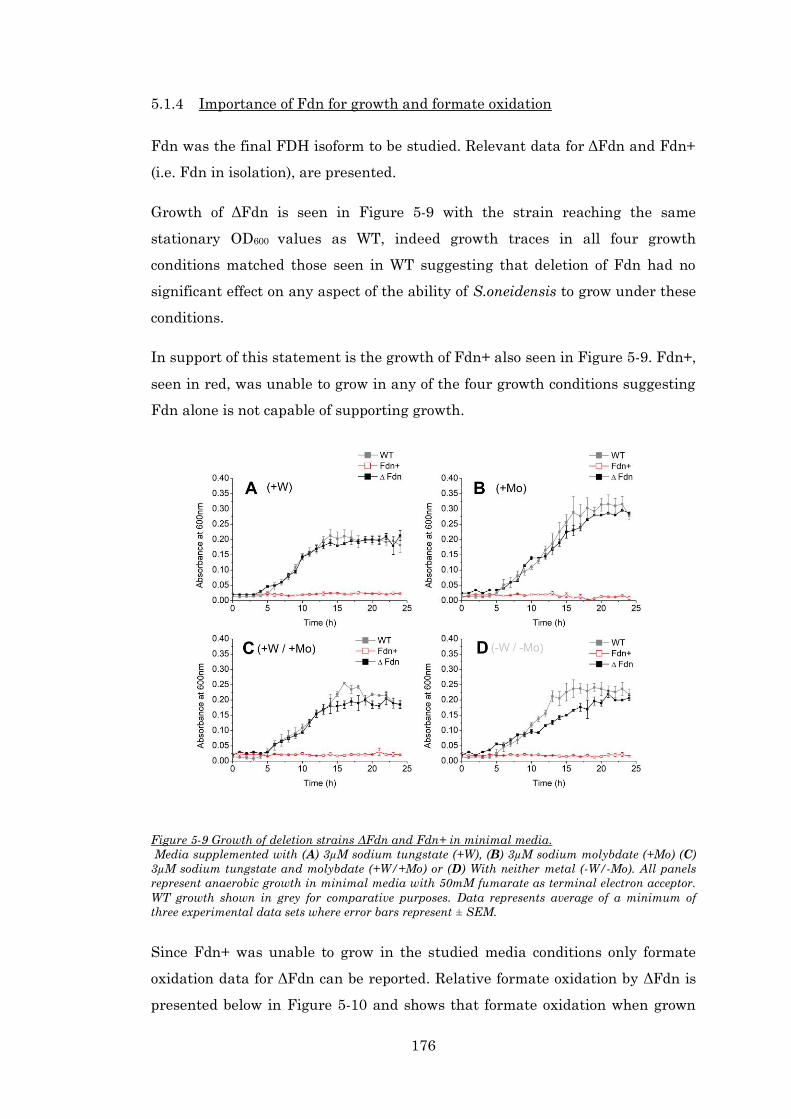
176
5.1.4 Importance of Fdn for growth and formate oxidation
Fdn was the final FDH isoform to be studied. Relevant data for ΔFdn and Fdn+
(i.e. Fdn in isolation), are presented.
Growth of ΔFdn is seen in Figure 5-9 with the strain reaching the same
stationary OD600 values as WT, indeed growth traces in all four growth
conditions matched those seen in WT suggesting that deletion of Fdn had no
significant effect on any aspect of the ability of S.oneidensis to grow under these
conditions.
In support of this statement is the growth of Fdn+ also seen in Figure 5-9. Fdn+,
seen in red, was unable to grow in any of the four growth conditions suggesting
Fdn alone is not capable of supporting growth.
Figure 5-9 Growth of deletion strains ΔFdn and Fdn+ in minimal media.
Media supplemented with (A) 3µM sodium tungstate (+W), (B) 3µM sodium molybdate (+Mo) (C)
3µM sodium tungstate and molybdate (+W/+Mo) or (D) With neither metal (-W/-Mo). All panels
represent anaerobic growth in minimal media with 50mM fumarate as terminal electron acceptor.
WT growth shown in grey for comparative purposes. Data represents average of a minimum of
three experimental data sets where error bars represent ± SEM.
Since Fdn+ was unable to grow in the studied media conditions only formate
oxidation data for ΔFdn can be reported. Relative formate oxidation by ΔFdn is
presented below in Figure 5-10 and shows that formate oxidation when grown

177
+W or +W/+Mo is unchanged in the absence of Fdn, but significantly lower when
grown +Mo or -W/-Mo.
Figure 5-10 Relative FDH activities of ΔFdn compared to WT.
Activity measured after growth in minimal media for 24 h when growth supplemented with 3µM
sodium tungstate (+W), 3µM sodium molybdate (+Mo), 3µM sodium tungstate and molybdate
(+W/+Mo) or neither metal (-W/-Mo). Activities obtained using colorimetric methyl viologen assay
and normalised to protein content in sample. Presented as % of WT specific activity seen for the
same growth condition. Data represents average of a minimum of three experimental data sets
where error bars represent ± SEM.

178
5.1.5 Relative isoform contributions to WT growth and FDH activity
A full compilation of the data presented above, including lag phase durations,
specific growth rates, final OD values after 24 h growth and non-comparative
formate oxidation specific activities for all seven deletion strains in all four
media conditions are presented in the appendix.
When comparing isoforms, deletion of both Fdh1 and Fdh2 result in impaired
growth phenotypes in at least one growth condition whilst deletion of Fdn
causes no changes compared to WT. It is tempting therefore to dismiss Fdn as
not playing any physiological role in the studied conditions. However the FDH
activity of ΔFdh1, ΔFdh2 and ΔFdn disputes this, showing that individual
deletion of each of the three isoforms affects the ability of S.oneidensis to oxidise
formate in at least one growth condition. Indeed analysis of the growth of the
double cluster mutants Fdh1+ and Δ Fdh2+ support that Fdn has a role, albeit
minor, in normal growth. This support comes in the form of two points,
presented in turn below for clarity.
The first point relates to the duration of lag phase seen in different deletion
strains. All three of the single cluster mutants grew with lag phase durations
indistinguishable from the error determined for WT values, with slightly longer
values determined for ΔFdh1 -W/-Mo (5.6 h) and for ΔFdn +Mo (5.3 h). In
contrast the double mutants Fdh1+ and Fdh2+ showed extended lag phases in
almost every growth condition with the exception of Fdh1+ -W/-Mo. Of these
extended lag phases, the most extended were seen when supplemented with
molybdate (10 ± 1 h for Fdh1+ and 16.3 ± 1.2 h for Fdh2+). Together this
information suggests that any two of the three isoforms together, including Fdn,
are able to recreate lag phase durations seen in WT, but in isolation neither
Fdh1, (evidenced by Fdh1+) or Fdh2, (evidenced by Fdh2+) or Fdn, evidenced by
the absence of growth of Fdn+, are able.
The second point relates to the observed specific growth rates. All of the single
cluster mutant strains showed specific growth rates between 40-61% of the WT
rates (except ΔFdnΔFdh2 +W), suggesting a requirement for all three isoforms
for WT growth rates. This effect would be expected to be cumulative, with
double cluster mutants showing even lower rates than mutants with only one
isoform removed, interestingly however the double cluster mutants that grew

179
either demonstrated comparable growth rates to single mutants, when grown
+Mo or -W/-Mo, or higher growth rates than the single cluster mutants when
grown with +W or +W/+Mo. It would be expected that if all three isoforms
contributed to maximal growth rates these double cluster mutants would show
lower growth rates than their single counterparts. This discrepancy is
exemplified by Fdh1+ +W showing comparable growth rates to WT. Since Fdh1+
showed growth rates comparable to WT, but the ΔFdh2 mutant, which retains
Fdh1 and Fdn, showed reduced growth rates, it could be suggested that Fdn
inhibits Fdh1 linked growth rates when grown with tungstate. The same trend,
although less pronounced, is seen when grown +W/+Mo, not only for Fdh1, but
also Fdh2.
To summarise the above results it is seen that a combination of any two of the
three isoforms are required to maintain WT lag phase duration, and deletion of
any one of the three isoforms causes decreases in the specific growth rate.
Regarding final OD600, deletion of the Fdn isoform causes no significant changes;
deletion of Fdh1 causes minor growth attenuation and deletion of Fdh2 the most
pronounced phenotype. These last results do not correlate with the observed
FDH activities where Fdh2 and Fdh1 are thought to contribute to FDH
activities when grown +W or +W/+Mo, whilst all three isoforms are thought to
be involved when grown +Mo or -W/-Mo, although under these conditions Fdh2
and Fdn could not be shown to catalyse formate oxidation alone.
Although to study the nuances of formate oxidation in this section activities are
presented in relation to those seen for WT, it should be highlighted that for all
mutant strains, consistently lower specific activities were observed when grown
+Mo or -W/-Mo compared to +W or +W/+Mo, as was previously seen for WT in
Chapter 3. None of the mutants demonstrated higher activities when grown
+Mo or -W/-Mo.
To allow easy comparison of the determined kinetic parameters in the following
text the Km and Vmax values obtained from Figure 5-4 Figure 5-5 and Figure 5-8
are presented in Table 5-2.
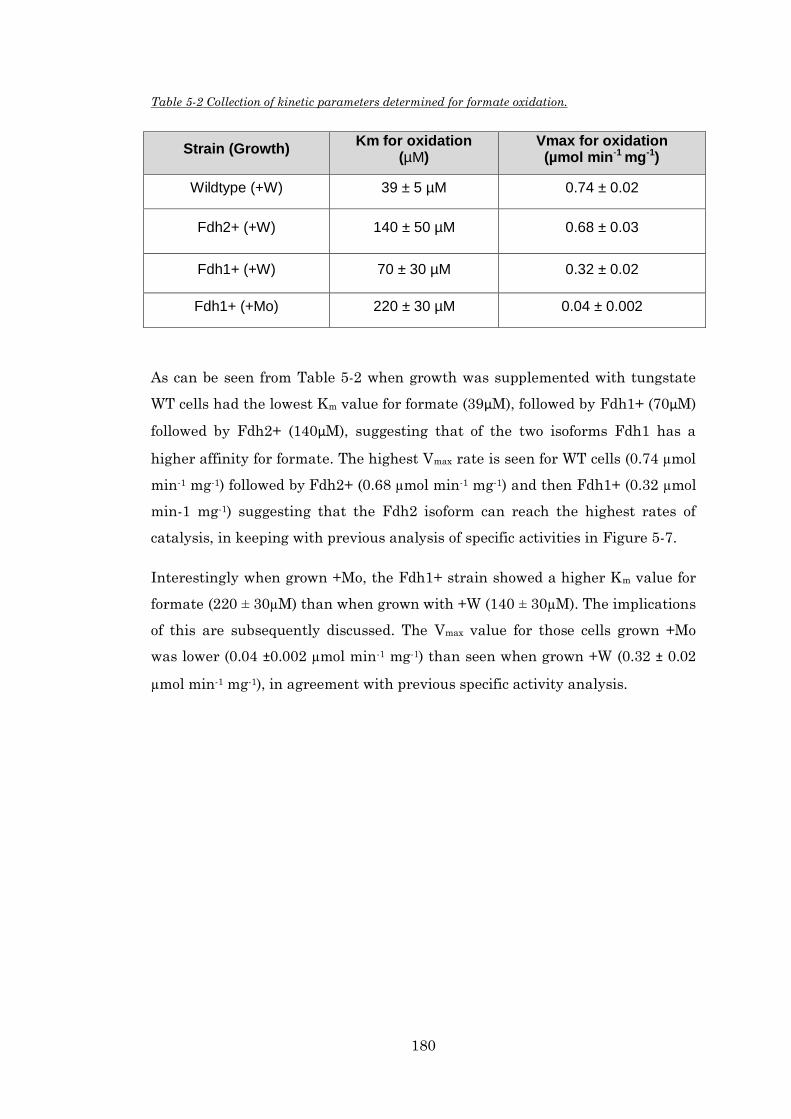
180
Table 5-2 Collection of kinetic parameters determined for formate oxidation.
Strain (Growth) Km for oxidation
(µM) Vmax for oxidation (µmol min-1 mg-1)
Wildtype (+W) 39 ± 5 µM 0.74 ± 0.02
Fdh2+ (+W) 140 ± 50 µM 0.68 ± 0.03
Fdh1+ (+W) 70 ± 30 µM 0.32 ± 0.02
Fdh1+ (+Mo) 220 ± 30 µM 0.04 ± 0.002
As can be seen from Table 5-2 when growth was supplemented with tungstate
WT cells had the lowest Km value for formate (39µM), followed by Fdh1+ (70µM)
followed by Fdh2+ (140µM), suggesting that of the two isoforms Fdh1 has a
higher affinity for formate. The highest Vmax rate is seen for WT cells (0.74 µmol
min-1 mg-1) followed by Fdh2+ (0.68 µmol min-1 mg-1) and then Fdh1+ (0.32 µmol
min-1 mg-1) suggesting that the Fdh2 isoform can reach the highest rates of
catalysis, in keeping with previous analysis of specific activities in Figure 5-7.
Interestingly when grown +Mo, the Fdh1+ strain showed a higher Km value for
formate (220 ± 30µM) than when grown with +W (140 ± 30µM). The implications
of this are subsequently discussed. The Vmax value for those cells grown +Mo
was lower (0.04 ±0.002 µmol min-1 mg-1) than seen when grown +W (0.32 ± 0.02
µmol min-1 mg-1), in agreement with previous specific activity analysis.

181
5.2 Contribution of FDH isoforms to WT CO2 reductase activity
Although sharing a number of the techniques used to study formate oxidation
above, the ability of S.oneidensis deletion strains to reduce CO2 is presented
here separately to avoid ambiguity and highlight the different approach to data
analysis. In this context the principal focus is in identification of the isoforms
responsible for native CO2 reductase activity to inform on targets for future
optimisation. This work does not concern the native physiology of S.oneidensis
as CO2 reduction is not thought to be a physiologically relevant conversion, seen
only under artificial conditions such as those presented here.
5.2.1 Importance of Fdh1 for CO2 reduction
The first isoform to be studied in the context of CO2 reduction is Fdh1. To do
this the relevant data for ΔFdh1 and Fdh1+ are presented. The growth data for
these strains has already been presented in the previous section, but it is worth
noting that the cells for these CO2 reduction assays, like those for formate
oxidation, were harvested after 24 h growth in minimal media supplemented
either with 3µM sodium tungstate (+W), 3µM sodium molybdate (+Mo), both
metals at 3µM (+W/+Mo) or supplemented with neither (-W/-Mo).
Using the colourimetric methyl viologen assay established in Chapter 4, CO2
reductase rates were determined for ΔFdh1 and Fdh1+ and are presented in
Figure 5-11. It should be noted that the values presented are not presented as
proportions of WT activity as for formate oxidation, instead the absolute specific
activities are presented, with the corresponding WT activities in red. This is
because in this context the fastest rates, rather than the fastest relative rates
are of most interest.
ΔFdh1 shows comparable CO2 reductase activity to WT when grown +W or
+W/+Mo suggesting Fdh1 does not contribute to the WT rates in these
conditions. Analysis of growth +Mo or -W/-Mo is more complicated, under these
conditions ΔFdh1 actually shows higher CO2 reductase rates than WT
suggesting Fdh1 may actually limit CO2 reduction under these conditions
although the observed rates are still significantly slower than those seen +W or
+W/+Mo.
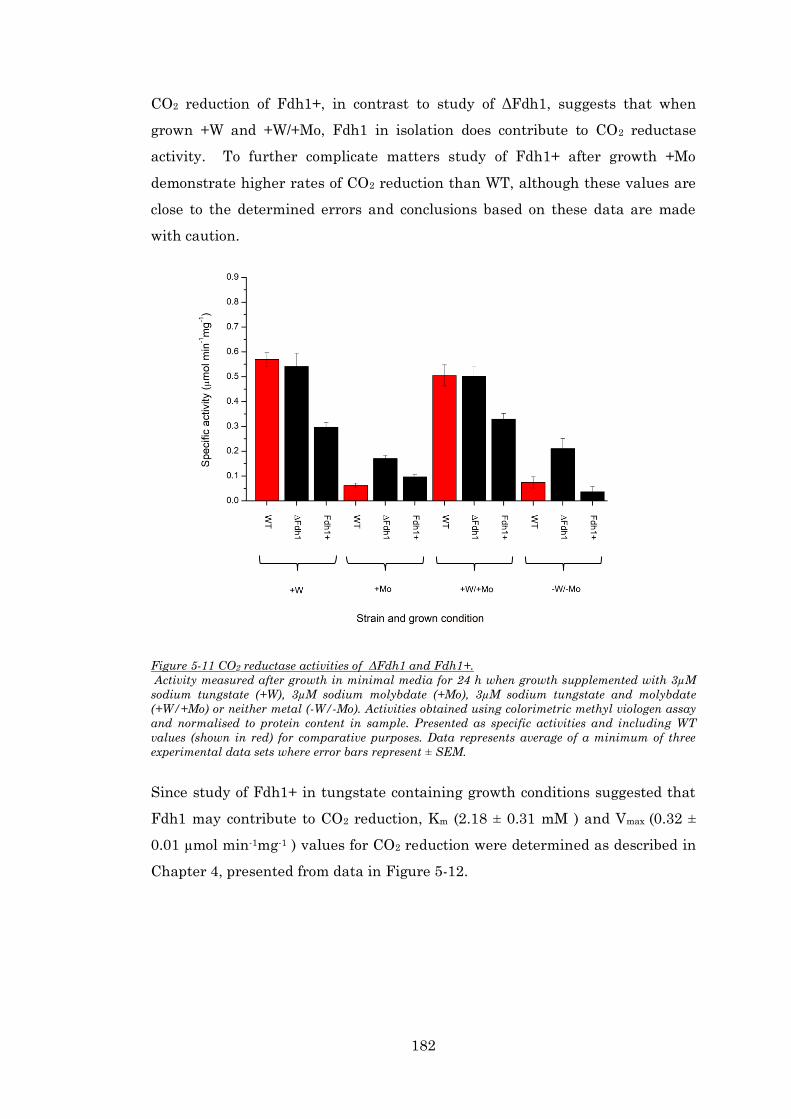
182
CO2 reduction of Fdh1+, in contrast to study of ΔFdh1, suggests that when
grown +W and +W/+Mo, Fdh1 in isolation does contribute to CO2 reductase
activity. To further complicate matters study of Fdh1+ after growth +Mo
demonstrate higher rates of CO2 reduction than WT, although these values are
close to the determined errors and conclusions based on these data are made
with caution.
Figure 5-11 CO2 reductase activities of ΔFdh1 and Fdh1+.
Activity measured after growth in minimal media for 24 h when growth supplemented with 3µM
sodium tungstate (+W), 3µM sodium molybdate (+Mo), 3µM sodium tungstate and molybdate
(+W/+Mo) or neither metal (-W/-Mo). Activities obtained using colorimetric methyl viologen assay
and normalised to protein content in sample. Presented as specific activities and including WT
values (shown in red) for comparative purposes. Data represents average of a minimum of three
experimental data sets where error bars represent ± SEM.
Since study of Fdh1+ in tungstate containing growth conditions suggested that
Fdh1 may contribute to CO2 reduction, Km (2.18 ± 0.31 mM ) and Vmax (0.32 ±
0.01 µmol min-1mg-1 ) values for CO2 reduction were determined as described in
Chapter 4, presented from data in Figure 5-12.

183
Figure 5-12 Michaelis-Menten plots for CO2 reduction in whole Fdh1+ cells grown +W.
Initial rates determined by measuring increasing absorbance in colorimetric methyl viologen assay.
Each data point represents average of a minimum of three experimental data sets where error bars
represent ± SEM. Data fitted to a hyperbolic function according to the Michaelis Menten equation.
Km and Vmax for CO2 reduction determined as 2.18 ± 0.31 mM and 0.32 ± 0.01 µmol min-1mg-1
respectively.
5.2.2 Importance of Fdh2 for CO2 reduction
CO2 reductase activity was next studied in the deletion strains relating to Fdh2,
ΔFdh2 and Fdh2+. CO2 reductase activities for these strains are found below
(Figure 5-13) in the same format seen for Figure 5-11.
Analysis of the CO2 reductase activity for ΔFdh2 is surprisingly complicated.
When grown +W or +W/+Mo, deletion of Fdh2 results in a significant drop in
CO2 reductase activity, suggesting Fdh2 contributes to these activities. In
contrast when grown +Mo or -W/-Mo, activities are significantly higher than
those seen for WT suggesting that, as seen for Fdh1, deletion of these isoforms
in isolation causes increase in CO2 reductase activities. Also similarly to Fdh1
however, the rates of these activities when grown +Mo or -W/-Mo are not as high
as those seen in tungstate supplemented conditions.
Fdh2+ represents potentially the most interesting of the mutant strains when
considering CO2 reductase activity. When grown +W or +W/+Mo, Fdh2+ shows

184
CO2 reduction rates comparable or even higher (although not statistically
significant) than WT, suggesting that Fdh2 in isolation is capable of producing
comparable rates of CO2 reduction. In contrast when grown +Mo or -W/-Mo
negligible amounts of CO2 reductase activity are observed suggesting that Fdh2
associated CO2 reductase activity is strictly dependent on the availability of
tungstate.
Figure 5-13 CO2 reductase activities of ΔFdh2 and Fdh2+.
Activity measured after growth in minimal media for 24 h when growth supplemented with 3µM
sodium tungstate (+W), 3µM sodium molybdate (+Mo), 3µM sodium tungstate and molybdate
(+W/+Mo) or neither metal (-W/-Mo). Activities obtained using colorimetric methyl viologen assay
and normalised to protein content in sample. Presented as specific activities and including WT
values (shown in red) for comparative purposes. Data represents average of a minimum of three
experimental data sets where error bars represent ± SEM.
Due to the high levels of CO2 reductase activity seen for Fdh2+ when grown +W,
Km (1.05 ± 0.13 mM ) and Vmax (0.86 ± 0.03 µmol min-1mg-1 ) values were
determined from Figure 5-14.

185
Figure 5-14 Michaelis-Menten plot for CO2 reduction in whole Fdh2+ cells grown +W.
Initial rates determined by measuring increasing absorbance in colorimetric methyl viologen
assay. Each data point represents average of a minimum of three experimental data sets where
error bars represent ± SEM. Data fitted to a hyperbolic function according to the Michaelis Menten
equation. Km and Vmax determined as 1.05 ± 0.13 mM and 0.86 ± 0.03 µmol min-1mg-1 respectively.
5.2.3 Importance of Fdn for CO2 reduction
Fdn was the final isoform to be studied for CO2 reduction, using the mutant
strain ΔFdn alone. As already noted for formate oxidation, the inability of
ΔFdh1ΔFdh2 to grow in the described minimal media made its subsequent
study by colourimetric assay impossible.
CO2 reductase activities of ΔFdn after growth in the four described growth
conditions are seen in Figure 5-15. The values for CO2 reductase activity after
growth +W or +W/+Mo are comparable to WT, suggesting Fdn does not
contribute to CO2 reductase activity in these conditions. In contrast, and as seen
for ΔFdh1 and ΔFdh2 previously, when grown with +Mo or -W/-Mo, activities
were higher than WT, but significantly lower than comparative activities from
tungstate supplemented conditions.

186
Figure 5-15 CO2 reductase activities of ΔFdn.
Activity measured after growth in minimal media for 24 h when growth supplemented with 3µM
sodium tungstate (+W), 3µM sodium molybdate (+Mo), 3µM sodium tungstate and molybdate
(+W/+Mo) or neither metal (-W/-Mo). Activities obtained using colorimetric methyl viologen assay
and normalised to protein content in sample. Presented as specific activities and including WT
values (shown in red) for comparative purposes. Data represents average of a minimum of three
experimental data sets where error bars represent ± SEM.
5.2.4 Relative isoform contributions to WT CO2 reductase activity
To better compare between the CO2 reduction kinetic parameters determined for
+W grown Fdh2+ and Fdh1+ cells, the relevant values are combined in Table
5-3 below.
Table 5-3 Collection of kinetic parameters determined for CO2 reduction.
Strain (growth) Km for reduction
(mM) Vmax for reduction (µmol min-1 mg-1)
Wildtype (+W) 1.43 ± 0.26 mM 0.58 ± 0.03
Fdh2+ (+W) 1.05 ± 0.13 mM 0.86 ± 0.03
Fdh1+ (+W) 2.18 ± 0.31 mM 0.32 ± 0.01

187
The lowest Km for CO2 reduction in Table 5-3 is not seen for WT, but Fdh2+
(1.05 ± 0.13 mM). WT shows the second lowest Km (1.43 ± 0.26mM) followed by
Fdh1+ (2.18 ± 0.31 mM). In contrast to formate oxidation this suggests that the
Fdh2 isoform not only has a higher affinity for CO2 than Fdh1, but also WT
when grown +W, an interesting observation discussed further below. It is
notable that these Km values are all several orders of magnitude larger than
those determined for formate suggesting a much higher affinity for formate over
CO2.
The highest Vmax determined for CO2 reduction was for Fdh2+ (0.86 ± 0.03 µmol
min-1 mg-1) followed by WT (0.58 ± 0.03 µmol min-1 mg-1) and Fdh1+ (0.32 ± 0.01
µmol min-1 mg-1). It should be highlighted that such high specific activities were
not reported in Figure 5-13 for Fdh2+ +W but the large error on this previous
value (0.72 ± 0.12 µmol min-1 mg-1) does not necessarily make the data
contradictory.
5.3 Kinetics of FDH deletion mutants in lysogeny broth
Since the previous studies investigated growth and subsequent enzymatic
activity on minimal media it was impossible to determine the enzymatic activity
of both the double cluster mutant Fdn+ and triple mutant ΔFDH as neither of
these strains were able to grow in the defined minimal media.
As such equivalent rich lysogeny broth experiments were performed, capable of
supporting the growth of these strains allowing for their subsequent analysis for
formate oxidation and CO2 reduction assays, the other double cluster mutants,
Fdh1+ and Fdh2+, were also studied under these conditions. After anaerobic
growth for 24 h with 50mM sodium fumarate as terminal electron acceptor and
supplemented with 3µM sodium tungstate, cells were washed and assayed for
activity as described previously. The resultant data is seen in Figure 5-16.

188
Figure 5-16 FDH and CO2 reductase activities in FDH mutant strains after growth in LB.
Cultured for 24 h in LB supplemented with 3µM sodium tungstate (+W). Activities obtained using
colorimetric methyl viologen assay and normalised to protein content in sample. Data represents
average of a minimum of three experimental data sets where error bars represent ± SEM.
No formate oxidation or CO2 reduction was seen in Fdn+ or the triple mutant
ΔFDH grown in LB media +W in Figure 5-16. The double mutants that did show
activity, Fdh1+ and Fdh2+, showed similar trends to tungstate supplemented
minimal media conditions, with Fdh1+ showing attenuated activity for both
formate oxidation and CO2 reduction, suggesting Fdh1 has a minor contribution
to WT activity. In contrast the Fdh2+ mutant not only showed higher CO2
reduction rates than WT, (0.81 ± 0.04 compared to 0.41 ± 0.14 µmol min-1 mg-
1)as seen after growth in tungstate supplemented minimal media, but higher
formate oxidation activities as well (1.46 ± 0.07 compared to 1.24 ± 0.09 µmol
min-1 mg-1).

189
5.4 Discussion
This chapter of work aimed to elucidate which of the three identified FDH
isoforms in S.oneidensis MR-1 contributed to wildtype growth and formate
oxidation/CO2 reduction. It is evident after studying the preceding data that the
relationship between these three isoforms and their growth and activity
phenotypes are complex, subtle and interlinked.
5.4.1 Comparing FDH specific activity and cell growth
A strain with a high FDH specific activity might be expected to correlate with
an ability to grow in minimal media containing formate as sole electron donor.
However this is not the case. The best example of this is the study of the ΔFdn
strain in minimal media supplemented with molybdate. Under these conditions
exceptionally low rates of formate oxidation were observed, 0.009 ± 0.01 µmol
min-1 mg-1 compared to 0.282 ± 0.027 µmol min-1 mg-1 for WT (+Mo). It might
then be assumed that such a defect would inhibit the ability of this strain to
grow on formate, but as seen in Figure 5-9 ΔFdn grew to comparable OD600
values as wildtype during stationary phase, 0.29 ± 0.01 vs 0.30 ± 0.05, albeit
with a slower growth rate. Since this OD600 during stationary phase is the
highest observed of any strain, in any condition, it is considered that the rate of
formate oxidation does not limit population size in any of the four of the growth
conditions studied.
Although no correlation could be made between stationary population size and
formate oxidation specific activity it seems more plausible to look for a
correlation between formate oxidation specific activity and specific growth rate.
When examined however no convincing correlations can be made. Again the best
illustration of this point is using the strain Fdh1+ (+W) as a counter example.
This strain showed the second highest specific growth rate of 0.35 ± 0.05 h-1,
behind only WT (+W) at 0.37 ± 0.06 h-1. However this strain showed the lowest
formate oxidation specific activity of all strains under this growth condition with
a rate of 0.329 ± 0.095 µmol min-1 mg-1.
Considering the physiology underlying a bacterial lag phase, i.e. insufficient
supply of a particular metabolite or inactivity of a required enzyme (Monod
1949), most frequently resolved by changes in gene expression (Rolfe et al.

190
2012), it is perhaps unsurprising that no correlation is observed between
formate oxidation activity during stationary phase and duration of lag phase.
As concluded above no correlations can be made between the formate oxidation
specific activity data shown in Figure 5-3, Figure 5-7 and Figure 5-10 and any
aspect of growth in minimal media, not the specific growth rate, the lag phase
duration nor stationary phase OD600. It should be realised however that
comparisons between bacterial growth, even in a defined growth media, will not
be directly comparable with the artificial conditions established for measuring
enzymatic activity using non-endogenous redox partners, in this case methyl
viologen. The caveats associated with these comparisons are detailed below.
Under normal physiological conditions, i.e. those seen during growth, oxidation
of formate to CO2 (standard reduction potential -420mV vs SHE (Ruschig et al.
1976) is coupled to the reduction of menaquinone to menaquinol, with a
reduction potential of -50 to -100 mV vs SHE (Richardson et al. 2012). In
contrast the reduction potential of methyl viologen at -446mV vs SHE
(Illichmanová et al. 2011) is considerably more negative, more negative even
than the formate/CO2 couple, highlighting the distinctly different
thermodynamics between growth and activity assay experiments. In addition,
during the normal physiological reaction, the oxidation of formate generates
electrons that are proposed to pass via the β and γ subunits of the FDH
complexes (Jormakka et al. 2002), although this may also be the case when
coupled to methyl viologen as an electron acceptor, it is also possible the redox
dye interacts directly with the catalytic α subunit and electrons bypass the
remainder of the FDH complex, again highlighting the incomparability of the
two experiments. Finally it should also be highlighted that during growth,
catalysis would likely be influenced by the redox state of the menaquinone pool,
and the number of other metabolic processes that contribute to this state.
During the colourimetric assays however these constraints would not limit the
reaction, the only limitation being the availability of the redox dye. Finally all
assay experiments were conducted on cells after 24 h growth, i.e. during
stationary phase, both protein expression and redox state of the cells are likely
to be subtly different between lag phase and exponential growth, complicating
comparisons.

191
5.4.2 Comparing kinetic parameters for deletion strains
Although comparisons are made cautiously in light of the above discussion, the
determination of kinetic parameters for the Fdh1 and Fdh2 isoforms
summarised in Table 5-2 and Table 5-3 might be suggested to explain the
observed growth phenotypes of the deletion strains.
When analysing the Km and Vmax values for formate oxidation it is first worth
considering that the WT determinations represent contributions from all
isoforms capable of oxidising formate. Under tungstate supplemented
conditions, the activity of mutant strains in Figure 5-3 and Figure 5-7 suggest
that Fdh1 and Fdh2 are the two isoforms responsible for catalysis of formate
and therefore responsible for contributing to the WT Km and Vmax values.
In such examples where the kinetics of enzyme mixtures have been studied it
has been hard to identify individual enzyme populations from kinetics data
alone, with estimations not possible with similar Km values (Brown et al. 2014).
Even in those examples where the contributions of different isoforms were able
to be separated, the importance of very accurate data sets is stressed, (Brown et
al. 2014), accuracy that proved unfeasible with the WT whole cell methodology
in Chapter 4. As such the isoforms were examined in isolation, i.e using the
double cluster mutants Fdh1+ and Fdh2+.
Of the two double cluster mutants studied a Km value of 70 µM was determined
for Fdh1+ and 140 µM for Fdh2+ suggesting that of the two isoforms Fdh1 has a
higher affinity for formate. It is possible that this higher affinity for formate is
linked to the importance of Fdh1 for growth in minimal media over Fdh2 seen in
Figure 5-2 and Figure 5-6. However the concentration of formate in these
experiments, supplemented at 50 mM, is considerably higher than both of these
Km values suggesting that formate concentration shouldn’t limit the kinetics of
either isoform or their ability to support bacterial growth. The importance of
Fdh1 relative to Fdh2 under these growth conditions may also be linked to their
intracellular redox partners. Although both Fdh1 and Fdh2 are predicted to
couple to the menaquinone pool, they may do so with altered thermodynamics,
the structural variation between them causing changes in reduction potential.
Although there is no current evidence, it is not impossible that they may even

192
interact with other intracellular redox partners, resulting in one or other being
of considerable more importance for effective metabolism.
It should be noted that although the Fdh1 isoform is predicted to be of most
significance for S.oneidensis growth, and has the lowest determined Km value of
the mutants, it is in fact Fdh2, evidenced by analysis of Fdh2+, which shows
the higher Vmax value at 0.68 µmol min-1 mg-1 suggesting that this higher rate of
formate oxidation attained by Fdh2 does not provide a growth advantage, in
keeping with previous discussion either suggesting functionally distinct roles for
the two isoforms or other metabolic processes, other than formate oxidation,
limiting bacterial growth.
Again, such discussion must be cautious making such comparisons between
those experiments conducted using methyl viologen and their physiological
counterparts involved in respiration where Km and Vmax values may be
significantly different (Bassegoda et al. 2014).
5.4.3 FDH isoform contributions to WT CO2 reductase activity
CO2 reduction will now be discussed with a focus on biotechnological
significance as this reaction has not been convincingly demonstrated to be of
importance for the normal metabolism of S.oneidensis MR-1.
Although Fdh1 is considered the most important isoform for growth and has the
lowest Km for formate oxidation, Fdh2 is the isoform of most interest for CO2
reduction. The strain containing only the Fdh2 isoform (Fdh2+) has the lowest
Km value for CO2 seen in Table 5-3 and the highest Vmax value for CO2 reduction
(0.86 µmol min-1 mg-1), making this strain an attractive target for future
biotechnological exploitation for CO2 reduction. The importance of this
particular strain is emphasised as when grown with tungstate it shows higher
rates of CO2 reduction than WT, (Vmax: 0.86 µmol min-1 mg-1 vs 0.58 µmol min-1
mg-1), whilst growing to comparable OD600 values (0.18 ± 0.03 vs 0.20 ± 0.03).
The reasons behind the lower Km and higher Vmax for this strain compared to
WT are currently unclear but are possibly linked to the absence of Fdn as the
strain containing Fdh2 and Fdn (ΔFdh1) did not show specific activities higher
than wildtype, this was only observed when Fdn was also not present in the
double deletion mutant Fdh2+.

193
5.4.4 Regulatory role of Fdn under tungstate containing growth
For Fdn in isolation (Fdn+), no formate oxidation was observed when grown in
lysogeny broth +W, and no growth was seen in the formate containing minimal
media conditions (+W) suggesting the lack of any formate oxidation capable of
supporting growth. In addition in the ΔFdn mutant strain formate oxidation
rates are comparable to WT in tungstate supplemented conditions, further
suggesting Fdn does not contribute to formate oxidation when grown with
tungstate.
Despite these facts, although Fdn does not appear to contribute to formate
oxidation directly, its deletion does seem to affect the ability of the other
isoforms to oxidise formate effectively when grown with tungstate. Deletion of
Fdn appears to have contrasting effects on formate oxidation by Fdh1 and Fdh2.
Fdh1 appears less able to oxidise formate when Fdn is absent, as seen by
comparing the activities for Fdh1+ (0.291 µmol min-1 mg-1), and ΔFdh2 (0.35
µmol min-1 mg-1) which retains Fdh1 in addition to Fdn. In contrast, Fdh2
appears better able to oxidise formate when Fdn is absent as seen by comparing
the activities for Fdh2+ (0.55 µmol min-1 mg-1), and ΔFdh1 (0.291 µmol min-1 mg-
1) which retains Fdn in addition to Fdh2.
Further complicating this relationship is the observation that when both of the
other isoforms Fdh1 and Fdh2 are present, deletion of Fdn does not appear to
affect formate oxidation (0.54 ± 0.01 µmol min-1 mg-1), showing values equivalent
to WT (0.545 ± 0.03 µmol min-1 mg-1).
Together these results suggest that under tungstate supplemented conditions
Fdn appears redundant when both of the other isoforms are present, but when
in isolation Fdn apparently acts to either increase the FDH activity in strains
containing Fdh2 or decrease the activity in strains containing only Fdh1. These
changes however are not thought to be due to a role oxidising formate directly
and may be caused by Fdn acting in a regulatory role. Future gene expression
and protein interaction studies would help to clarify the complicated
relationship between these isoforms.

194
5.4.5 Role of Fdn in the absence of tungstate
The Fdn isoform has a more important role for formate oxidation during
molybdate containing growth conditions, with ΔFdn (+Mo) impaired in ability to
oxidise formate, (0.009 ± 0.01 µmol min-1 mg-1). Although this would suggest
that Fdn is capable of oxidising formate the strain Fdn+ containing only Fdn
was not able to grow under these molybdate supplemented conditions
suggesting a distinction between ability to oxidise formate and the ability to
oxidise formate capable of supporting growth, drawing parallels with earlier
discussion regarding the exact interactions of these isoforms with other
metabolic elements.
5.4.6 Fdh1 significance under both tungstate and molybdate supplementation
The Fdh1 isoform appears to play a role under both tungstate and molybdate
supplemented growth conditions, not only regarding the assay determined
activities, but also growth phenotype. The Km determinations in Table 5-2
suggest that the Fdh1+ strain shows different Km values for formate when
grown with tungstate (70 ± 30μM) and molybdate (220 ± 30 μM). This may
suggest a structurally distinct form of Fdh1 containing either W or Mo at the
active site depending on growth condition. This could be confirmed by
purification of SO_4509, the catalytic subunit of Fdh1 although the difficulty of
such native purifications when using molybdate grown cells and their low
associated activity is already highlighted in the inability to purify SO_4513
when grown +Mo in Chapter 4.
Considering that the Km values for Fdh1+ were determined to be different when
grown +W and +Mo an equivalent methodology may also be helpful for
investigating whether SO_4513, the catalytic subunit of Fdh2, is capable of co-
ordinating either W or Mo depending on growth conditions by determining Km
values for Fdh2+, grown +Mo.
5.4.7 Extended lag phase duration
Of all studied strains the longest lag phases are observed for Fdh1+ and Fdh2+
when grown +Mo (10 ± 1h and 16.3 ± 1.2 h respectively). Since both Fdh1 and
Fdh2 have been concluded to require tungstate for maximal activity and both
these strains lack Fdn, considered important for molybdate associated formate
195
oxidation, this is perhaps not surprising. These particularly extended lag phases
reflect the time needed by these strains to begin effectively oxidising formate. As
already suggested in Chapter 3, if an excess of molybdenum competitively
inhibits the activity of tungstate dependent enzymes, such as Fdh1 and Fdh2,
this lag time may represent the time needed to upregulate elements needed to
produce active versions of Fdh1 or Fdh2, either by removal of inhibitory
molybdate or upregulation of tungstate uptake, for example by the specific
transporter TupA (SO_4719) (Kolker et al. 2005). In agreement with this theory
is the slightly extended lag phase observed by ΔFdn +Mo (5.3 ± 0.3 h) suggesting
that in the absence of Fdn an extended lag phase is always seen when
supplemented with molybdate, but this lag is less severe when both Fdh1 and
Fdh2 are present suggesting that together they are better able to adapt to such
conditions and produce the conditions required for effective catalysis.
5.4.8 Areas for future research
This chapter of work aimed to bring greater clarity and detail to the study of
FDH activity in S.oneidensis. The previous two chapters studied wildtype
S.oneidensis activity and growth and as such were unable to identify relevant
proteins. This more systematic study of each isoform in turn has revealed only
part of a complicated relationship, yet nonetheless has provided a significant
advance in understanding the biochemistry behind formate oxidation in
S.oneidensis MR-1.
To act as a basis for future research the following questions still remain to be
answered.
Does the suggested importance of Fdn for activity when grown with molybdate
correspond to a Mo containing enzyme? What is the mechanism behind the
apparent regulation of Fdh1 and Fdh2 by Fdn?
Is the ability of Fdh1 to influence catalysis under tungstate or molybdate
supplemented conditions with distinct Km values a reflection of an enzyme
capable of coordinating either a Mo-MGD or a W-MGD cofactor? Importantly
previous QPCR work (Chapter 3) suggested SO_4509, the catalytic subunit of
Fdh1, is expressed when growth is supplemented with either tungstate or
molybdate. This is in agreement with the proposed flexibility to utilise W or Mo

196
suggested here and the requirement of Fdh1 for maximal growth in all
conditions regardless of supplementation.
Finally future work should identify why the Fdh1 isoform is more important for
WT growth than Fdh2, whether the distinction is structural or related to how
they couple to subsequent metabolism.
The study of the deletion strains has provided answers to questions posed in
Chapter 3. When considering the previous observation that SO_0101 expression
was upregulated in growth conditions without tungstate or molybdate
supplementation it was questioned whether SO_0101 (Fdn), could catalyse
formate oxidation without W or Mo as a cofactor, or is better able to scavenge
these metals to make an active FDH population to support growth even when
these metals are scarce. Neither of these hypotheses are supported by the
current work, evidenced by the inability of the Fdn+ strain to grow under these
conditions.
Other possibilities raised in Chapter 3, like the newer questions posed above,
require a detailed genome wide expression study to determine whether these
deletion strains correctly represent the wildtype regulatory elements involved in
the expression of these three isoforms.
Since the investigation of CO2 reductase activity is not trying to inform on
native metabolic importance, the conclusions made can be far more definitive.
For the purposes of CO2 reduction by S.oneidensis MR-1, Fdh2 is the isoform of
most interest for future study. When coupled to methyl viologen, strains
containing this isoform are capable of the highest rates of CO2 reduction with
the lowest Km values, in particular the strain Fdh2+ will be of considerable
interest as it not only supports higher rates of CO2 reduction than WT, but does
not compromise by showing the attenuated growth seen by some other strains.

197
5.5 References
Bassegoda, A. et al., 2014. Reversible Interconversion of CO2 and Formate by a Molybdenum-
Containing Formate Dehydrogenase. Journal of the American Chemical Society, 136(44),
pp.15473–6.
Brown, S. et al., 2014. The Kinetics of Enzyme Mixtures. Molecular Biology Research
Communications, 3(1), pp.21–32.
Illichmanová, a et al., 2011. Nitrate reductase whole-cell assay: side effects associated with the
use of benzyl viologen. Folia microbiologica, 56(1), pp.72–6.
Jormakka, M. et al., 2002. Molecular basis of proton motive force generation: structure of formate
dehydrogenase-N. Science, 295(March), pp.1863–1868.
Kolker, E. et al., 2005. Global profiling of Shewanella oneidensis MR-1: expression of hypothetical
genes and improved functional annotations. Proceedings of the National Academy of Sciences
of the United States of America, 102(6), pp.2099–104.
Monod, J., 1949. The growth of bacterial cultures. Annual Reviews in M, 3(Xl), pp.371–394.
Richardson, D.J. et al., 2012. Exploring the biochemistry at the extracellular redox frontier of
bacterial mineral Fe(III) respiration. Biochemical Society transactions, 40(3), pp.493–500.
Rolfe, M.D. et al., 2012. Lag phase is a distinct growth phase that prepares bacteria for
exponential growth and involves transient metal accumulation. Journal of Bacteriology,
194(3), pp.686–701.
Ruschig, U. et al., 1976. CO2 reduction to formate by NADH catalysed by formate dehydrogenase
from Pseudomonas oxalaticus. European journal of biochemistry / FEBS, 70(2), pp.325–330.

198
6 Electrode driven reversible
S.oneidensis FDH activity
Previous chapters have focussed on characterising the CO2 reductase and FDH
activity of S.oneidensis MR-1, concluding that the highest rates of catalysis are
observed when sodium tungstate is supplemented to growth and under such
conditions catalysis is due to the combined action of the Fdh1αβγ and Fdh2αβγ
isoforms. This chapter builds on the established findings to investigate the
feasibility of driving these intracellular reactions with an electrode. Study of
CO2 reductase activity was the principal focus due to its potential as an energy
storage mechanism with simultaneous CO2 fixation.
To introduce the experiments discussed in this chapter a brief overview of the
relevant electrochemical techniques and the underlying principles are described.
Electrochemistry is the study of electron exchange at the surface of an electrode,
such exchange can be bidirectional with electron transfer to an electrode
(positive, oxidative current) or from an electrode (negative, reductive current),
illustrated below in Figure 6-1.
Figure 6-1 Fundamental concept underlying following electrochemical techniques.
When discussing a protein or bacterial culture interacting with an electrode,
electron transfer can occur either spontaneously or as a result of exogenously
added mediators, which shuttle between the electrode and sample, ensuring
effective electron exchange. Methyl Viologen (MV) is commonly used as an
electrochemical mediator when an electrode in isolation is unable to exchange
electrons with a material or molecule of interest. In such contexts MV

199
transitions between a dicationic form and a monocationic radical. At low
potentials a second reduction to a neutral species can also take place (-0.88 V vs
SHE) but since such low potentials are not studied in this work all future
references refer exclusively to cycling between the radical and oxidised form, a
reaction found to be fully reversible without side reactions between pH 5-13
(Bird & Kuhn 1981). When acting as a mediator the MV radical can either be
observed in a freely diffusing form or absorbed to an electrode in a film. The
proportion of the two regimes is influenced by the properties of the working
electrode and in turn can influence the redox potential, with a reduction
potential of -0.432 vs SHE observed in a previous study using graphite
(Barroso-Fernandez et al. 1998). Several examples of electrodes deliberately
coated with or modified by MV to increase electrochemical interactions exist in
the literature with many stable over the course of many days (Bird & Kuhn
1981).
In all experiments described in this work current flow is measured to inform on
catalysis by S.oneidensis MR-1 cultures in a simple electrochemical cell using a
three electrode configuration. The working electrode (WE) is the site of electron
exchange with the sample, the counter electrode (CE) enables electron transfer
at the WE by maintaining charge balance and the reference electrode (RE)
regulates the potential (E) of the working electrode, allowing a chosen voltage
to be applied during an experiment.
Chronoamperometry (CA) represents the simplest type of electrochemical
experiment, in which the WE is poised at a desired potential and current
measured over time. In the following results the potential is maintained
(typically at -0.56 vs SHE) and changes in current are observed with the
introduction of reactants to the electrochemical cell.
Cyclic voltammetry is a more complex but powerful electrochemical technique
capable of providing large amounts of information about an analyte of interest
including formal reduction potentials, diffusion coefficients, the presence of
reaction intermediates and reaction stoichiometry. It is a versatile technique
used in a wide range of fields but in a biochemical context is most commonly
used for protein film voltammetry experiments (PFV) which inform on the redox
properties of a purified enzyme immobilised on an electrode (Legér et al. 2003).
Despite being far more complicated systems than immobilised proteins the

200
electrochemical interactions of whole microbial cells have also been explored
extensively using cyclic voltammetry (Harnisch & Freguia 2012).
Figure 6-2 Cyclic voltammetry (CV) conceptualisation.
(A) During a CV experiment potential is swept from an initial potential (E1) to a final potential
(E2) and back. (B) Throughout current is measured and is plotted against the applied potential in a
cyclic voltammogram. Featureless baseline trace demonstrating small capacitive current ‘envelope’
in the absence of redox signals.
The principles underlying a cyclic voltammetry experiment are outlined in
Figure 6-2. During a cyclic voltammetry experiment a changing potential is
imposed on the working electrode, measured against the reference electrode.
This changing potential will sweep linearly from an initial potential (E1) to a
final potential (E2) before returning to the initial potential Figure 6-2 (A).
Throughout the experiment the corresponding current flowing between working
and counter electrodes is plotted as a function of the applied potential (Kissinger
& Heineman 1996) (Figure 6-2 (B)). During these experiments scan rate (v) is
the change of potential as a function of time, i.e. v = dE/dt.
It is necessary to carefully consider the potential window studied for cyclic
voltammetry experiments (E2-E1) as only a limited range of potentials hold
biological relevance. Since all biology occurs in water the anodic and cathodic
water decomposition points, i.e. at -0.414 V vs SHE at pH 7 for the reduction of
H+ to H2 and +0.815 vs SHE at pH 7 for the oxidation of H2O to O2, constrain
physiologically relevant electrochemistry experiments (Becking et al. 1960).
Indeed studies significantly above or below these limits have been shown to
interfere with biological study, the production of hydrogen at low potentials
causing poor sample interaction at the electrode or at higher potentials the
unfolding or oxidative damage of protein samples (Marsili, Rollefson, et al.
2008).

201
When making such cyclic voltammetric measurements it is important to
appreciate the two types of current that can result from changing a potential at
an electrode. Faradaic currents result from oxidation or reduction reactions of
the analyte; these are normally the signals of interest. In addition however
changes in applied potential at the electrode cause changes in charge density at
the electrode/electrolyte interface resulting in a balancing current unrelated to
redox reactions in the analyte referred to as capacitive currents (Harnisch &
Freguia 2012) (represented by the CV trace in Figure 6-2 (B)). Since these
capacitive currents increase with scan rate Faradaic signals can be completely
masked at higher scan rates. Partially for this reason slow scan rates were used
for all cyclic voltammetry experiments in this study. The other consideration
was that at higher scan rates slower enzymatic reactions may not have time to
establish and the kinetics of interfacial electron transfer to the working
electrode will dominate Faradaic signals (Marsili, Rollefson, et al. 2008). As
such, slow scan rates of 1 mV/s were used where the current limitations are
likely to be due to enzyme kinetics, referred to as an enzyme controlled regimes
(Srikanth et al. 2008), or mass transfer (Harnisch & Freguia 2012).
Cyclic voltammetry experiments using whole cells, or indeed using enzymes, can
be studied under two distinct conditions. Under non-turnover conditions,
substrates for catalysis are not added and all redox transformations rely on the
working electrode alone to regenerate and transition between oxidised and
reduced forms of compounds as illustrated in Figure 6-3 (A). During such
conditions the current returns to zero after the complete oxidation (or reduction)
of all present redox active species resulting in peaks in cyclic voltammetry
traces as seen in Figure 6-3 (B). The position of these peaks indicates the
potential at which a species is oxidised or reduced. In the case of a single
reversible redox reaction (as illustrated in Figure 6-3) the peak positions can be
used to determine a formal potential for the reaction of interest.

202
Figure 6-3 Non-catalytic electrochemistry and CV traces.
(A) Reduction or oxidation of a species capable of exchanging electrons with an electrode (Ox or
Red). (B) Corresponding CV trace for a simple reversible redox couple showing oxidation as
potential becomes more positive (left to right) and reduction on the reverse sweep as potentials
become more negative (right to left) Formal potential (Ef) for a simple redox process defined as
average of positive (oxidative) and negative (reductive) peak potentials.
In contrast cyclic voltammetry can also be performed on cells under turnover
conditions, i.e. in the presence of a substrate for a redox enzyme, illustrated in
Figure 6-4 (A). For such catalytic cyclic voltammograms only capacitive currents
are observed until a suitably negative potential (in the case of a reduction
reaction) or a suitably positive potential (in the case of an oxidation reaction) is
approached whereby the reaction begins to proceed, resulting in catalytic
Faradaic currents that continue at all sufficiently positive/negative potentials as
long as substrate remains at the electrode Figure 6-4 (B). At these potentials
the observed current represents the continuous electron transfer to or from the
substrate in solution via continuous redox cycling of the enzyme active site.

203
Figure 6-4 Catalytic (turnover) electrochemistry and CV traces.
(A) Reduction or oxidation of a substrate by a catalyst capable of exchanging electrons with an
electrode for catalysis. (B) Example CV trace for reductive catalysis where negative currents are
recorded at suitably low (reducing) potentials (green) and example CV trace for oxidative catalysis
where positive currents are recorded at suitably high (oxidising) potentials (blue). In both cases
clear sigmoid (S) shaped catalytic CV traces are observed on both forward and reverse scans. The
inflection point of such traces (Ecat) can be best visualised by plotting di/E.
Due to the sustained electron transfer to (or from) the electrode during turnover
conditions a characteristic sigmoidal shaped voltammetric trace is observed. The
inflection point(s) of such traces where the gradient changes most is often used
to characterise such traces and such features are often visualised by plotting the
first derivative of the catalytic current with respect to applied potential
(Harnisch & Freguia 2012). The peak potentials in such derivative graphs are
defined in this work simply as simply inflection points (Zhang et al. 2013)
(Marsili, Rollefson, et al. 2008) or catalytic potentials (Ecat) being terminology
adopted from the related field of protein film voltammetry (Srikanth et al.
2008)(Field et al. 2005). Confusingly a number of alternative/interchangeable
terms are used within the literature for these values including formal potentials
(Millo 2012), (Harnisch & Freguia 2012), onset potentials (Marsili, Baron, et al.
2008) redox centre potentials (Jain et al. 2011), half wave potentials (Carmona-
Martinez et al. 2011), and midpoint potentials (Baron et al. 2009). Regardless of

204
terminology, when applied to whole cell electrochemistry these potentials can
either reflect the potential of the catalytic process or the potential of another
intermediate electron transfer site that limits the rate of electron transfer to the
electrode (Marsili, Rollefson, et al. 2008).
6.1 Results
6.1.1 Electrode driven reversible FDH activity with S.oneidensis and MV.
To establish whether an electrode can serve as a redox partner for FDH
catalysis a custom made three electrode bioreactor was used. This consisted of a
single chamber containing a platinum counter electrode and Ag/AgCl reference
electrode, both isolated from the experiment by conductive glass frits.
Experiments were conducted using 30ml of electrolyte (100 mM HEPES, 8.7
mM NH4Cl, 1.3 mM K2HPO4, 1.7 mM KH2PO4 and 1 mM MgSO4) in the
presence of a graphite working electrode to which cultures of S.oneidensis MR-1,
the mediator MV (10 µM) or substrates (50 mM sodium formate or carbonate)
could be added. Before experimentation abiotic baseline measurements were
run confirming comparative capacitive currents for all bioreactors with only
those displaying smooth featureless cyclic voltammetry traces used for
subsequent experimentation.
Experiments were performed for both S.oneidensis MR-1 cultures grown in the
presence of 3 µM sodium tungstate (+W) or 3 µM sodium molybdate (+Mo) to
better corroborate previous findings that this distinction results in significantly
different FDH activities. Growth duration and wash preparation steps were
identical to those used for colourimetric assays. To ensure normalisation
cultures were diluted so cell suspensions of the same OD were introduced into
the electrochemical cells, subsequent analysis showed comparable protein
content (20 mg/ml) as determined by BCA assay. When adding such cultures to
bioreactors 2 ml of previous electrolyte was removed and replaced by 2 ml of
S.oneidensis culture, maintaining a reaction volume of 30 ml. Regardless of
growth condition cyclic voltammograms of cultures without addition of MV or
substrate were featureless (Figure 6-5, dashed traces) acting as effective
baseline comparisons for turnover conditions.

205
Figure 6-5 Reversible electrochemical FDH activity of S.oneidensis MR-1 with MV.
For all panels, dashed traces indicate absence of substrate or MV and solid traces indicate the
presence of substrate (50 mM) and 10 µM MV (i.e. turnover conditions). Red traces indicate
experiments using S.oneidensis cells grown with 3 µM sodium tungstate (+W) and black traces with
3 µM sodium molybdate (+Mo). (A) Formate oxidation by S.oneidensis cells and corresponding
di/E plot for +W conditions, showing a single feature at -0.438 V vs SHE under turnover
conditions. (C) CO2 reduction by S.oneidensis cells and corresponding di/E plot for +W conditions,
showing a single feature at -0.436 V vs SHE under turnover conditions. (B) S.oneidensis cells (+W)
in presence of 10 µM MV without sodium formate or carbonate, shown in blue, highlighting
comparable Ecat values during turnover conditions to Ef of MV. All traces show second of two cyclic
voltammetry scans, measured and controlled by μStat 8000P potentiostat, scan rate 1 mV/s,
pH7.2.

206
Although S.oneidensis MR-1 has been previously reported to exchange electrons
directly with an electrode the mediator MV was included due to its proven
ability to drive reversible FDH activity in assay based experiments in addition
to its known ability to interact well with graphite electrodes for electron
exchange. Addition of 10µM MV to cultures resulted in the appearance of a
small reversible cyclic voltammogram feature as seen for +W grown cells in
Figure 6-5 panel B (identical traces were recorded for cells +Mo). This feature is
indicative of a single reversible redox reaction as expected for redox cycling of
MV at the surface of the electrode.
To confirm reversible FDH activity, both sodium formate (Figure 6-5, (A)) and
sodium carbonate (Figure 6-5, (C)) were added to S.oneidensis MR-1 cultures in
addition to 10 µM of the mediator MV, with each experiment described in turn.
Addition of sodium formate resulted in increased positive currents at all
potential values above approximately -0.5 V vs SHE for both +W and +Mo
grown cells as seen in Figure 6-5 (A) red and black solid traces respectively. This
increase in current corresponds to the electron flow to the graphite electrode
from the catalytic oxidation of formate. When grown +W these currents were
considerably higher, > 7 times higher at +0.4 V vs SHE (72 µA) than
corresponding currents for cells grown +Mo (9 µA). In addition +W grown cells
show a clear sigmoidal shaped CV, indicative of catalysis (Armstrong & Hirst
2011).
Addition of sodium carbonate resulted in increased negative currents at all
potential values below approximately -0.3 V vs SHE for both +W and +Mo
grown cells as seen in Figure 6-5 (C) red and black solid traces respectively. This
negative current corresponds to the electron flow from the graphite electrode for
the catalytic reduction of CO2. Comparatively these cathodic currents were
larger for +W cells, with currents 4.5 times higher at -0.53 V vs SHE compared
to those for +Mo cells. Both +W and +Mo experiments demonstrated a clear
sigmoidal shaped CV. As in previous work the phrase CO2 reduction is used
here to describe the reduction observed when sodium carbonate, and its
solvation products are used as substrate.
To quantify the position of the catalytic waves during both formate oxidation
and CO2 reduction, the Ecat of turnover +W traces was determined by plotting

207
the first derivative di/E as seen in Figure 6-5 (A) and (C). The signal/noise ratio
proved too low to perform equivalent analysis of +Mo derivative traces. The
derived Ecat values, -0.438 V vs SHE for formate oxidation and -0.436 V vs SHE
for CO2 reduction are in good agreement with the observed position of non
catalytic MV signals in Figure 6-5 (B) (emphasised by extrapolated blue
window) and literature reported reduction potentials for MV on graphite at -
0.432 V vs SHE (Barroso-Fernandez et al. 1998) collectively suggesting MV
mediated electron exchange.
To complement the above cyclic voltammetry data demonstrating CO2 reduction,
chronoamperometry measurements were also taken on cells grown in +W
containing media. This was done following the experimental description above
but rather than taking cyclic voltammograms, the current was continuously
measured whilst the working electrode remained poised at -0.56 V vs SHE, i.e. a
suitably reducing potential for CO2 reduction determined by the previous CV
analysis. During these experiments 10 µM MV was added first followed by
50mM sodium carbonate and finally increasing concentrations of the known CO2
reductase inhibitor, sodium azide, see Chapter 4. As can be seen from Figure 6-6
when bacterial culture was present 10 µM MV addition caused a small increase
in reductive current, augmented significantly by addition of carbonate and
partially attenuated by increasing concentrations of azide. To confirm that the
observed reduction of CO2 was due to the bacterial cells and not a spontaneous
effect of reductively poising the electrode, the experiment was repeated
abiotically as seen in the grey trace in Figure 6-6, MV, sodium carbonate and
sodium azide did not cause any significant changes to current production.
It is important to highlight that compared to the previous cyclic voltammetry
experiments only a quarter of the cell culture was used for the experiment
presented in Figure 6-6, i.e. 250 ml of culture was prepared rather than 1 L. The
cells were otherwise prepared identically, resulting in an inoculum containing
5mg/ml protein being added to the bioreactor. As a result of this the maximum
currents reached upon addition of carbonate are smaller, 22 µA rather than the
115 µA seen in Figure 6-5 (C) when using 1 L of culture.

208
Figure 6-6 Chronoamperometry of S.oneidensis in response to sodium carbonate, MV and azide.
S.oneidensis culture (+W) (red) and abiotic control (grey) exposed to poised graphite electrode at -
0.56 V vs SHE monitoring effect on current after addition of 10 µM MV, 50mM sodium carbonate
and increasing additions of sodium azide. Each addition followed by mixing for 5 s.
6.1.2 Electrochemically driven non-mediated CO2 reduction by S.oneidensis
The inclusion of the costly and toxic MV to mediate catalysis was undesirable
and so subsequent experimentation investigated catalytic responses without
exogenously added mediator. Only the biotechnologically relevant CO2 reductase
activity (and not formate oxidation) was studied in this context. Experiments
were otherwise performed under the same experimental conditions as seen in
Figure 6-5 (C) using 50 mM sodium carbonate as substrate for a range of
S.oneidensis cultures collectively shown in Figure 6-7.

209
Figure 6-7 CO2 reductase activity of WT S.oneidensis MR-1, LS527 and lysed WT MR-1 cultures
without exogenously added mediator.
For all panels dashed grey traces indicate absence of substrate and solid traces indicate the
presence of 50 mM sodium carbonate (i.e. turnover conditions). (A) Cyclic voltammetry traces
(using μStat 8000P potentiostat) for WT S.oneidensis MR-1 cultures grown +W (red) +W/+Mo
(green) +Mo (black) and -W/-Mo (blue), Derivative plot of +W turnover trace (also in red) showing
features at -0.454, -0.393 and -0.356 V and a single broader peak on the cathodic sweep centred at -
0.434 V vs SHE. (B) Wildtype MR-1 (+W) (red) and LS527 (+W) (black), each trace representing
mean of three biological replicates, for each using the second of two CV scan recordings. Derivative
plot of turnover traces for both strains (left). Both MR-1 in red and (LS527 in black) derivative
show three features at -0.458 (-0.439), -0.401 (-0.388) and -0.363 (-0.362) V vs SHE and a single
broader peak on the cathodic sweep centred at -0.426 (-0.411) V vs SHE. (C) Lysed WT MR-1 (+W)
with corresponding derivative, anodic sweep of the turnover trace contains small (at -0.445 V) and
large (at -0.35 V) reductive peaks followed by an oxidative feature at -0.243 V. On the reverse
cathodic sweep a single reductive peak is seen centred at -0.414 V vs SHE. All traces show second of
two CV scan recordings measured and controlled by AUT73338 potentiostat unless specified, scan
rate 1mV/s, pH7.2.

210
Figure 6-7 Panel A displays cyclic voltammetry responses of WT S.oneidensis
MR-1 cultures in response to 50 mM sodium carbonate addition when cultured
in the presence 3 µM sodium tungstate (+W, red), 3 µM sodium molybdate (+Mo,
black), 3 µM sodium tungstate and sodium molybdate (+W/+Mo, green) or in the
presence of neither metal (-W/-Mo, blue). Panel B shows equivalent experiments
performed for both WT MR-1 (+W, red) and a genomic knockout strain, LS527
(black), lacking components of the Mtr pathway (mtrCAB (SO_1776-SO_1778)
mtrDEF (SO_1780-SO_1782) and omcA (SO_1779)) which have been previously
implicated in electron exchange with an electrode (Ross et al. 2011). Finally
Panel C shows the response of intentionally lysed (via sonication) WT
S.oneidensis MR-1 (+W) cells. This was done according to section 2.16 (Cell
lysis- sonication) except the protease inhibitor cocktail was omitted due to its
possible interference with CV measurements. This cell lysate was then used in
lieu of whole cells, containing comparable protein content (20 mg/ml) to previous
experiments (determined by BCA assay).
In all three panels clear catalytic features are seen in response to the addition of
50 mM sodium carbonate, showing negative currents below approximately -
0.35V vs SHE corresponding to the electron flow from the graphite electrode for
the catalytic reduction of CO2. The magnitude of these currents varies,
especially in panel A, where the tungstate containing conditions show more
negative currents than those without, for example at -0.56 V SHE -55 µA (+W), -
33 µA (+W/+Mo), vs -16 µA (-W/-Mo) and -12 µA (+Mo). As a result +W growth
conditions were used for subsequent study in panel B and C. These panels show
comparative currents to those seen for WT cells (+W) with currents of -44 µA for
LS527 and -25 µA for lysed WT (+W) cells at -0.56 V vs SHE respectively.
In addition to the negative (reductive) catalytic feature of these CV traces a
small positive (oxidative) peak can also be seen centered at -0.25 V vs SHE,
most distinctly seen for lysed MR-1 in panel C, likely due to the reverse
direction of catalysis and the re-oxidation of formate generated by CO2
reduction, supported by the fact that the feature forms a peak rather than a
catalytic wave suggesting depletion of substrate.
First derivative plots (di/E) are also seen for all panels in Figure 6-7 (right) to
quantify the position of the catalytic waves and reveal the finer details of

211
catalytic responses seen for WT cells. Unlike previous mediated derivative plots
these contain multiple features. For WT +W cultures the forward sweep (from
negative to more positive potentials) contains three features, centred at -0.454, -
0.393 and -0.356 V vs SHE respectively. In contrast only a single broad feature
is seen on the reverse cathodic sweep, centred at -0.434 V vs SHE.
Since multiple peaks can be seen in the derivative of WT cells a comparative
approach with a strain lacking the Mtr pathway (a principal candidate for the
signals seen in WT cells) was used. It was hypothesised that the native Mtr
pathway of S.oneidensis MR-1 that under normal physiological conditions
couples intracellular respiration with reduction of external minerals (Coursolle
et al. 2010) may be working in reverse to provide electrons to the intracellular
CO2 reductases. The derivative plot of LS527 however is similar to that seen for
WT cells (Figure 6-7: derivative of A vs B), suggesting (in combination with the
comparable catalytic currents) that the Mtr pathway is not likely to mediate
electron exchange during catalysis.
It was also proposed that all of the signals seen for WT cells may result from cell
lysis and direct interaction of FDH with the electrode, if this was the case the
derivative of the intentionally lysed MR-1 cells would be expected to look
identical, with overlapping peaks in the first derivative plot. However this is not
the case (Figure 6-7: derivative of A vs C), suggesting at least a proportion of
the activity in whole cells proceeds via a mechanism other than cell lysis. The
distinctions between the two plots are subtle, with a more pronounced formate
re-oxidation peak for lysed cells and only a single clear reductive peak (at -0.35
V vs SHE) whilst the peak for formate oxidation in unlysed cells is not seen on
the derivative and features multiple broader reductive features centred at -
0.458, -0.401 and -0.363 V vs SHE.
To confirm that formate is formed during such non-mediated experiments using
+W cultured S.oneidensis MR-1, chronoamperometry experiments were
performed, with the working electrode potential set to -0.56 V vs SHE whilst
recording current. Catalysis was initiated by addition of 50 mM sodium
carbonate, added after 180 s when current was equivalent to that seen in the
abiotic control as seen in Figure 6-8. Quantification of formate production at the
end of the experiment was performed using 1H NMR.

212
Figure 6-8 Extended CO2 reductase activity of S.oneidensis MR-1 (+W) after addition of 50 mM
sodium carbonate.
Working electrode poised at -0.56 V vs SHE controlled by AUT73338 potentiostat throughout the
4.8 day experiment. Chronoamperometry of abiotic (red dashed trace) and MR-1 culture grown +W
(black trace) in response to addition of 50 mM carbonate, bioreactors were mixed thoroughly after
addition of carbonate but were not agitated subsequently. Integration of Faradaic current after
addition of carbonate to MR-1 cells show by shaded blue region with a calculated area of 4.499
coulombs., y= 4 µA used as baseline for integration.
The lack of current after addition of carbonate to the abiotic control in Figure
6-8 indicates a requirement for the cells to catalyse the non-mediated CO2
reduction and disproves that a reductively poised electrode alone is capable of
comparable catalysis. In contrast the experiment containing WT culture shows a
significant reductive current (-16 µA within 400 s) in response to carbonate
addition, with current being maintained over the course of several days (4.8
(388,800 s) without agitation.
During the course of this experiment it was assumed that the charge
transferred from the working electrode was being used to generate formate.
Making this assumption that observed charge drives exclusively the 2e-
reduction of CO2 to formate, and considering the reaction volume of 30 ml, the
theoretical formate concentration at the end of the experiment can be given by
eq (6.1) where F is Faraday’s constant (96485.33).

213
[𝐹𝑜𝑟𝑚𝑎𝑡𝑒] (𝑀) =
𝐶ℎ𝑎𝑟𝑔𝑒 (𝐶)
𝑅𝑒𝑎𝑐𝑡𝑜𝑟 𝑣𝑜𝑙𝑢𝑚𝑒 (𝐿) × 𝐹 × 2 (6.1)
As such the 4.5 coulombs of charge integrated from Figure 6-8 would result in a
theoretical concentration of 0.771 mM formate assuming 100% Faradaic
efficiency.
1H NMR spectra quantified 0.728 ± 0.019 mM formate in samples taken from
the bioreactor containing the bacterial culture at the end of the experiment In
contrast no formate was detected in samples taken before addition of sodium
carbonate. The abiotic control showed no detectable formate before addition of
carbonate or after its addition.
Interestingly very small concentrations of succinate (10.5 ± 0.6 µM) were also
detected in the experiment containing the bacterial culture after 4.8 days. No
succinate was detected at the start of this experiment or at the end of the
equivalent abiotic experiment suggesting that a small proportion of the supplied
electrons may be diverted to alternative metabolic pathways, but considering
the calculated efficiencies (below) this diversion is considered to be negligibly
small (0.061 coulombs).
By comparing the value of 0.777 mM formate assuming 100% faradaic efficiency
and the experimentally determined value of 0.728 mM formate generated in the
reaction containing S.oneidensis an actual Faradaic efficiency of 107 % is
calculated. This good agreement suggests a highly promising system for
effectively catalysing the reduction of CO2 to formate with low over-potentials
and further developments are explored in the following discussion.
214
6.2 Discussion
Considering the wide range of electrochemical techniques and analyses
available to probe systems on an electrode (Léger 2013) those used here are
relatively simple. Fundamentally this is due to the extremely complicated
nature of whole bacterial cell interactions with electrodes and the propensity for
inappropriate over-analysis (Marsili, Rollefson, et al. 2008). Both cyclic
voltammetry and chronoamperometry hold numerous precedents in the
literature for the study of electrode-bacterial interactions (Babauta et al. 2012)
and were considered the most informative and appropriate techniques for the
current study. Commonly cyclic voltammetry is used to determine the potentials
of those redox couples involved in electron transfer but even with this simple
technique care must be taken with analysis as factors such as mass-transfer
limitations, resolved in the field of PFV by use of rotating electrodes (Angove et
al. 2002), have not been similarly resolved for whole cell experiments (Babauta
et al. 2012). The assignment of potentials for such CV analyses have been most
convincingly shown in combination with other studies including comparisons
with gene deletion strains (Coursolle et al. 2010) or the replacement of analytes
thought to contain soluble mediators contributing to voltammetry signals
(Marsili, Baron, et al. 2008). Even in such elegant demonstrations however the
relevance of such redox signals to those currents seen in after extended
interactions can be debated and so such techniques are typically complimented
by chronoamperometric studies (Babauta et al. 2012).
As demonstrated in Figure 6-5, both anodic currents resulting from formate
oxidation and cathodic currents resulting from CO2 reduction mediated by MV
could be observed when using grown cultures of S.oneidensis as biocatalysts.
These currents were greatest when cultures grown with 3 µM sodium tungstate
were used rather than those grown with equivalent concentrations of sodium
molybdate. This is in agreement with the previously studied colourimetric
assays (Chapter 4) and suggests that reducing equivalents derived from both
chemical compounds such as dithionite or a cathode can drive formate
production Figure 6-9(A).
Surprisingly this is not always the case as observed for the molybdate
containing formate dehydrogenase FDH-H isolated from E.coli for which CO2

215
reductase activity could readily be observed when reducing equivalents were
provided by an electrode, but not in equivalent MV mediated assays (Bassegoda
et al. 2014). It has been suggested that this lack of CO2-MV oxidase activity was
due to the single Fe-S cluster in this protein limiting catalysis, other examples
including FDH1 from Syntrophobacter fumaroxidans have ten (Reda et al.
2008), and the relevant FDH of Shewanella here contain at least four, the larger
number of clusters being thought to better suit buffering of electron supply and
demand (Bassegoda et al. 2014). An alternative explanation involves the
requirement of a reductive reactivation event not seen during the time course of
the solution assay, as previously reported for the related nitrate reductase
enzymes (Field et al. 2005). This discussion is interesting as many studied FDH
enzymes have been claimed to be incapable of CO2 reduction on the basis of
colourimetric redox assays alone, re-evaluation by electrochemical methods may
demonstrate otherwise.
It is notable that no redox features were seen for S.oneidensis cultures under
any non-turnover conditions regardless of growth method. This is thought to be
partially due to the previous wash steps which aimed to remove metabolites
that would interfere with analysis. Despite this the reversible redox transitions
of outer membrane cytochromes and signals from molecules such as flavins
normally observed in similar studies of S.oneidensis (Marsili, Baron, et al. 2008)
(Coursolle et al. 2010) (Harnisch & Freguia 2012) would still be expected. The
likely difference is that these studies deliberately encouraged the generation of
S.oneidensis biofilms and direct cell adhesion to an anode before electrochemical
study (Babauta et al. 2012), whilst this study used planktonic cells with no prior
electrode acclimatisation/biofilm promotion. As such the CV signals resulting
from such associations were likely indistinguishably small within the
background capacitive current.
The formation of biofilms were deliberately not encouraged here primarily
because the generation of biofilms is typically performed using anodes poised at
suitably high potentials, (for example +0.4 V vs SHE (Carmona-Martínez et al.
2012)) over several hours if not days, making the process time intensive and
potentially costly when considering future biotechnological uses, in addition
since the principal application of this work was the reduction of CO2 using a

216
cathode poised at -0.56 V vs SHE (Figure 6-8), the acclimatisation to a positively
poised electrode may prove counterproductive.
6.2.1 Mechanistic discussion of non-mediated CO2 reductase activity.
Analysis of the features seen in the first derivative plots of non-mediated CO2
turnover traces of S.oneidensis cultures in Figure 6-7 is incredibly difficult and
requires further study to resolve satisfactorily. The peaks in such first
derivative plots inform on redox active elements that limit the rate of electron
transfer to the electrode during the catalytic process (Marsili, Rollefson, et al.
2008). Typically such derivative traces are symmetrical with respect to the X
axis for common reversible processes (Rapson et al. 2008). The features in the
described figures are not symmetrical suggesting from a classical
electrochemical perspective the existence of quasi – reversible or irreversible
redox processes (Kim et al. 1993), unfortunately with the available information
no definitive conclusions about the identity of these sites can be made. Possible
mechanisms are illustrated in Figure 6-9 Panels B through F and the merits of
each are discussed in turn.
Figure 6-9 Possible mechanisms for CO2 reductase activity at the working electrode (WE).
(A) Mediation by exogenous MV capable of shuttling between electrode and active site. (B)
Mediation by abiotically produced hydrogen evolved at cathode. (C) Direct electron transfer via the
Mtr pathway (D) Direct electron transfer via currently unidentified native metabolic elements (E)
Cell lysis resulting in catalytic machinery (FDH) accepting electrons directly from cathode. (F) A
combination of the above mechanisms.

217
It can be speculated that since similar features are observed in the derivative of
the turnover trace of the LS527 mutant compared to WT (Figure 6-8) the absent
elements of the Mtr pathway in LS527 are unlikely to solely contribute to any of
the observed first derivative features in the WT trace. This is in agreement with
the observation that comparable levels of reductive catalysis are observed in
this strain compared to WT. This result is in contrast to the only other
electrosynthetic study of Shewanella which demonstrated an absolute
requirement for the components of the Mtr pathway for acceptance of electrons
from a cathode to drive intracellular reduction of fumarate to succinate (Ross et
al. 2011). However this study supplied the driving force for the reduction of
fumarate with a cathode poised at -0.36 V vs SHE (Ross et al. 2011) whilst the
reduction of CO2 in this study requires significantly lower potentials down to -
0.56 V vs SHE, considerably below many of the reported heme potentials in the
pathway which range from -500 mV to +100 mV (Hartshorne et al. 2007).
Since electron transfer does not appear to proceed via the Mtr pathway
alternative mechanisms must be proposed, these include the possibility that in
response to the experimental environment cell lysis occurs allowing direct
electron transfer to those elements required for catalysis (Figure 6-9 Panel E).
Although not conclusive, indirect evidence from the analysis of the features of
the CV obtained using lysed cells in Figure 6-7 (C), and the comparative
differences to whole cells suggest the contributions of other mechanisms.
Other mechanisms other than cell lysis include the possibility of hydrogen
generation at the cathode acting as a freely diffusible mediator able to drive CO2
reduction (Figure 6-9 Panel B), as seen for nitrite or acetate production in
previous systems (Sakakibara & Kuroda 2004). Although reductive features in
baseline CV readings that might indicate abiotic hydrogen production were not
seen, despite suitably low potentials, it is difficult to disprove the generation of
small quantities of hydrogen due to the inability to perform appropriate controls
in aqueous analytes. Regardless this particular mechanism is considered
unlikely from a thermodynamic perspective considering the similarity of the
reduction potentials of the CO2/formate couple at -0.42 V vs SHE (Ruschig et al.
1976) and the H+/H2 couple at -0.41 V vs SHE (Becking et al. 1960) , although
similar it has been shown that due to the low solubility of hydrogen such low

218
potentials can only be maintained under high H2 partial pressures (Rabaey &
Rozendal 2010).
Alternatively the observed catalysis may proceed via other metabolic elements
including other conductive outer membrane proteins other than the well-studied
Mtr pathway (Figure 6-9 Panel C and D). Candidates for such proteins include
other cytochromes of as yet undetermined function or even the known outer
membrane DMSO reductase (Gralnick et al. 2006). Extraceullular polymeric
substances (EPS) may even play a role (Babauta et al. 2012), with excreted
protein found in the EPS of Shewanella sp. HRCR-1. Of this excreted protein
homologs of mtrC and omcA represented only a tenth of that found, the
remainder consisting of many more redox active proteins of currently unknown
function (Cao et al. 2011).
6.2.2 Biotechnological development
Importantly this is the first work to report the ability of S.oneidensis to reduce
CO2 to formate not only using colourimetric redox assays as shown in Chapter 4,
but also electrochemically with the work presented here. The fact that such
reduction could be seen with or without MV mediation presents a number of
options for future biotechnological exploitation. The Faradaic reductive currents
(determined by the subtraction of capacitive current from total) produced by
mediated +W grown S.oneidensis cultures was observed to be 112 µA at -0.56 V
vs SHE Figure 6-5 (C) whilst in equivalent non-mediated experiments only 42
µA (Figure 6-7 (A)) of reductive current was transferred. The lower rate of
electron transfer for formate generation in the non-mediated system is not
unexpected, with the addition of MV allowing a larger number of the planktonic
cells to interact with the electrode. Regardless the non-mediated system still
represents the regime of most interest for future study, despite the catalytic
current consumption being only 37% of the mediated rate, due to the exclusion
of the costly and toxic mediators (Suntres 2002).
Regardless of the mechanisms behind the observed non-mediated catalysis the
described system represents a simple method for the generation of an effective
CO2 reductase biocatalyst. Previously isolated FDH enzymes with the capacity
for CO2 reduction to formate at an electrode have been proposed for
biotechnological exploitation (Rabaey & Rozendal 2010), their main constraint

219
being the considerable cost required to isolate and immobilise the purified
enzyme on an electrode (Bassegoda et al. 2014) or the slow culture time of those
organisms they are purified from (Reda et al. 2008). This system circumvents
this requirement, requiring only the materials needed to culture the fast
growing S.oneidensis (Yang et al. 2008) with no purification steps required and
using only cheap graphite electrodes.
In order to become an attractive technology the described system would have to
demonstrate benefits over other developing technologies for the reduction of
CO2. These include a range of chemical catalysts that function at ambient
temperature and pressure including those derived from iridium (Hull et al.
2012) or cobalt (Jeletic et al. 2013), but both currently demonstrate either slow
rates of catalysis and/or the use of expensive chemicals or solvents.
It has already been addressed that this system remains attractive in
comparison to those systems where enzymes require expensive purification
steps, but a number of other recent studies have also proposed whole cell
systems to drive the reduction of CO2 to formate (Schuchmann & Müller 2013)
and (Pinske & Sargent 2016).
The first demonstrates the use of whole cultures of Acetobacterium woodii to
produce formate from gas mixtures containing hydrogen and CO2. This system
exploits the native hydrogen dependent carbon dioxide reductase (HDCR)
enzyme complex which contains an iron-iron hydrogenase, two electron transfer
subunits and a Mo containing FDH component (Schuchmann & Müller 2013).
This system is doubly attractive due to the native carbon monoxide
dehydrogenase (CODH) of A.woodii, which allows such cultures to convert not
just CO2 and hydrogen gas mixes into formate, but also those containing carbon
monoxide as well, allowing it to generate formate from syngas (Schuchmann &
Müller 2013). The main drawback of this system is that it requires the addition
of expensive sodium ionophores to prevent generation of biomass, acetate and
other side products (Schuchmann & Müller 2013).
The second proposed whole cell strategy uses E.coli cultures grown in the
presence of formate to stimulate production of the FHL complex, consisting of
electron transfer subunits, a Ni-Fe hydrogenase and the previously described
Mo containing FDH, FDH-H (Bassegoda et al. 2014). By exposing such cells to

220
an environment with high pressure of both CO2 and H2 at pH7.4, the
intracellular FHL is able to couple hydrogen oxidation to CO2 reduction. i.e. the
reverse of the reaction catalysed by the complex under physiological conditions
(Pinske & Sargent 2016). This system was capable of operating for 10.5 h before
formate production plateaued, with a quoted initial rate of 4 nmole of formate
produced per min per mg of protein (Pinske & Sargent 2016) although even
higher rates have been since demonstrated with higher pressures of hydrogen
and CO2 (Sargent, F, personal communication). To provide a comparison with
the current work 23 µmol of formate was produced in Figure 6-8 from culture
containing 40 mg of protein over 7013 min, giving an equivalent value of 0.083
nmolmin-1mg-1. Although this value is considerably lower it does not take into
consideration the relative longevity of the two systems or the fact that the in
vivo FHL system requires a pressurised CO2/H2 environment to function
optimally, a potential setback for economic viability.
Of course comparisons with either of these systems are somewhat misleading
because both the HDCR A.woodii and FHL E.coli systems require hydrogen as
the electron donor for the reduction of CO2 to formate. Neither has been studied
with the use of a cathode acting as electron donor, (although HDCR can also use
ferredoxin as an electron donor (Schuchmann & Müller 2013). These whole cell
systems instead rely on the permeability of hydrogen into cells, making them
similar but not necessarily competing technologies with the cathode driven
system described here.
The continual catalysis and high Faradaic efficiency of this system seen over
several days (Figure 6-8) supports its future investigation. It is envisaged that
significant improvements to various aspects of the design could be tested,
including the use of agitation, as the present system does not address the
possibility of diffusion limitations, both those of the substrate to the active sites
but also of protons/hydroxyl ions that balance charge. This would need to be
assessed carefully however as the power required for agitation and its scaling is
a common issue for the viability of several BES systems (Recio-garrido et al.
2016).
The present electrochemical set up was designed to be simple and cost effective,
lacking any costly components. It also does not feature a coupled anode because

221
to effectively study such bacterial systems it is essential to determine which
electrode limits current (Babauta et al. 2012) and this system removes this
extra complication. Future developments would need to consider how the
described system could be integrated into a BES device. From an engineering
perspective the described cathodic system could be coupled to a biotic anode as
described previously in other MEC or MES devices (Pant et al. 2012) to limit the
costs of driving CO2 reduction or alternatively more traditional chemical anodes
could also be used. Other options include driving the cathode with energy from
renewable solar sources to chemically store the produced energy (Lovley 2011).
From a biological perspective it could be envisioned that syntrophic
relationships could be established with other organisms, converting the
produced formate into molecules of higher economic worth, using the produced
formate as a feedstock molecule, as described previously (Rabaey & Rozendal
2010). Alternatively, and considering the known genome, extensive metabolic
study and genetic tractability of Shewanella, the required metabolic functions
for subsequent reductive transformations could be introduced using synthetic
biology approaches.
6.3 References
Angove, H.C. et al., 2002. Protein Film Voltammetry Reveals Distinctive Fingerprints of Nitrite
and Hydroxylamine Reduction by a Cytochrome c Nitrite Reductase. The Journal of
Bological Chemistry, 277(26), pp.23374–23381.
Armstrong, F. a & Hirst, J., 2011. Reversibility and efficiency in electrocatalytic energy conversion
and lessons from enzymes. Proceedings of the National Academy of Sciences of the United
States of America, 108(34), pp.14049–54.
Babauta, J. et al., 2012. Electrochemically active biofilms: facts and fiction. A review. Biofouling,
28(8), pp.789–812.
Baron, D. et al., 2009. Electrochemical measurement of electron transfer kinetics by Shewanella
oneidensis MR-1. The Journal of biological chemistry, 284(42), pp.28865–73.
Barroso-Fernandez, Ä. et al., 1998. Electrochemical behavior of methyl viologen at graphite
electrodes modified with Nafion sol-gel composite. Analytica Chimica Acta, 370, pp.221–230.
Bassegoda, A. et al., 2014. Reversible Interconversion of CO2 and Formate by a Molybdenum-
Containing Formate Dehydrogenase. Journal of the American Chemical Society, 136(44),
pp.15473–6.

222
Becking, L., Kaplan, I. & Moore, D., 1960. Limits of the Natural Environment in Terms of pH and
Oxidation-Reduction Potentials. The Journal of Geology, 68(3), pp.243–284.
Bird, C.L. & Kuhn, a. T., 1981. Electrochemistry of the viologens. Chemical Society Reviews,
10(1), p.49.
Cao, B. et al., 2011. Extracellular polymeric substances from Shewanella sp . HRCR-1 biofilms :
characterization by infrared spectroscopy and proteomics. Environmental microbiology, 13,
pp.1018–1031.
Carmona-Martinez, A. a et al., 2011. Cyclic voltammetric analysis of the electron transfer of
Shewanella oneidensis MR-1 and nanofilament and cytochrome knock-out mutants.
Bioelectrochemistry (Amsterdam, Netherlands), 81(2), pp.74–80.
Carmona-Martínez, A. a et al., 2012. Electron transfer and biofilm formation of Shewanella
putrefaciens as function of anode potential. Bioelectrochemistry, 93, pp.23–9.
Coursolle, D. et al., 2010. The Mtr respiratory pathway is essential for reducing flavins and
electrodes in Shewanella oneidensis. Journal of bacteriology, 192(2), pp.467–74.
Field, S.J. et al., 2005. Reductive activation of nitrate reductases. Dalton Transactions, 2005(21),
pp.3580–3586.
Gralnick, J. a et al., 2006. Extracellular respiration of dimethyl sulfoxide by Shewanella
oneidensis strain MR-1. Proceedings of the National Academy of Sciences of the United States
of America, 103(12), pp.4669–74.
Harnisch, F. & Freguia, S., 2012. A basic tutorial on cyclic voltammetry for the investigation of
electroactive microbial biofilms. Chemistry, an Asian journal, 7(3), pp.466–75.
Hartshorne, R. et al., 2007. Characterization of Shewanella oneidensis MtrC : A cell-surface
decaheme cytochrome involved in respiratory ... decaheme cytochrome involved in
respiratory electron transport to extracellular electron acceptors. J Biol Inorg Chem,
12(October), pp.1083–1094.
Hull, J.F. et al., 2012. Reversible hydrogen storage using CO2 and a proton-switchable iridium
catalyst in aqueous media under mild temperatures and pressures. Nature Chemistry, 4(5),
pp.383–388.
Jain, A. et al., 2011. Visible spectroelectrochemical characterization of Geobacter sulfurreducens
biofilms on optically transparent indium tin oxide electrode. Electrochimica Acta, 56(28),
pp.10776–10785.
Jeletic, M.S. et al., 2013. A Cobalt-Based Catalyst for the Hydrogenation of CO2 under Ambient
Conditions. J. Am. Chem. Soc, 135, p.11533−11536.
Kim, M., Smith, V.P. & Hong, T., 1993. First- and Second-Order Derivative Polarography /
Voltammetry for Reversible , Quasi-Reversible , and Irreversible Electrode Processes. J.

223
Electrochem. Sac., 140(3).
Kissinger, P. & Heineman, W.R., 1996. Laboratory Techniques in Electroanalytical Chemistry,
Second Edition, Revised and Expanded 2nd ed. P. Kissinger & W. R. Heineman, eds., CRC
Press.
Legér, C. et al., 2003. Enzyme Electrokinetics : Using Protein Film Voltammetry To Investigate
Redox Enzymes and Their Mechanisms. Biochemistry, 42(29), pp.8654–8662.
Léger, C., 2013. An Introduction to Electrochemical Methods for the Functional Analysis of
Metalloproteins. Practical Approaches to Biological Inorganic Chemistry, pp.179–216.
Lovley, D.R., 2011. Powering microbes with electricity: direct electron transfer from electrodes to
microbes. Environmental microbiology reports, 3(1), pp.27–35.
Marsili, E., Rollefson, J.B., et al., 2008. Microbial biofilm voltammetry: direct electrochemical
characterization of catalytic electrode-attached biofilms. Applied and environmental
microbiology, 74(23), pp.7329–37.
Marsili, E., Baron, D.B., et al., 2008. Shewanella secretes flavins that mediate extracellular
electron transfer. Proceedings of the National Academy of Sciences of the United States of
America, 105(10), pp.3968–73.
Millo, D., 2012. Spectroelectrochemical analyses of electroactive microbial biofilms. Biochemical
Society transactions, 40(6), pp.1284–90.
Pant, D. et al., 2012. Bioelectrochemical systems (BES) for sustainable energy production and
product recovery from organic wastes and industrial wastewaters. RSC Advances, 2,
pp.1248–1263.
Pinske, C. & Sargent, F., 2016. Exploring the directionality of Escherichia coli formate
hydrogenlyase : a membrane- bound enzyme capable of fixing carbon dioxide to organic
acid. MicrobiologyOpen, 5(5), pp.721–737.
Rabaey, K. & Rozendal, R. a, 2010. Microbial electrosynthesis - revisiting the electrical route for
microbial production. Nature reviews. Microbiology, 8(10), pp.706–16.
Rapson, T.D., Kappler, U. & Bernhardt, P. V, 2008. Direct catalytic electrochemistry of sulfite
dehydrogenase : Mechanistic insights and contrasts with related Mo enzymes. Biochimica et
Biophysica Acta, 1777, pp.1319–1325.
Recio-garrido, D., Perrier, M. & Tartakovsky, B., 2016. Modeling , optimization and control of
bioelectrochemical systems. Chemical Engineering Journal, 289, pp.180–190.
Reda, T. et al., 2008. Reversible interconversion of carbon dioxide and formate by an electroactive
enzyme. Proceedings of the National Academy of Sciences of the United States of America,
105(31), pp.10654–8.

224
Ross, D.E. et al., 2011. Towards electrosynthesis in Shewanella: energetics of reversing the mtr
pathway for reductive metabolism. PloS one, 6(2), p.e16649.
Ruschig, U. et al., 1976. CO2 reduction to formate by NADH catalysed by formate dehydrogenase
from Pseudomonas oxalaticus. European journal of biochemistry / FEBS, 70(2), pp.325–330.
Sakakibara, Y. & Kuroda, M., 2004. Electric Prompting and Control of Denitrification.
Biotechnology and Bioengineering, 42(4), pp.535–537.
Schuchmann, K. & Müller, V., 2013. Direct and Reversible Hydrogenation of CO2 to Formate by a
Bacterial Carbon Dioxide Reductase. Science, 342(December), pp.1382–1386.
Srikanth, S. et al., 2008. Electrochemical characterization of Geobacter sulfurreducens cells
immobilized on graphite paper electrodes. Biotechnology and bioengineering, 99(5), pp.1065–
73.
Suntres, Z.E., 2002. Role of antioxidants in paraquat toxicity. Toxicology, 180, pp.65–77.
Yang, Y. et al., 2008. Characterization of the Shewanella oneidensis Fur gene : roles in iron and
acid tolerance response. BMC Genomics, 12, pp.1–12.
Zhang, X., Epifanio, M. & Marsili, E., 2013. Electrochemical characteristics of Shewanella loihica
on carbon nanotubes-modified graphite surfaces. Electrochimica Acta, 102, pp.252–258.

225
7 Discussion
Metalloenzymes are a varied and complex aspect of biochemistry, the
requirement for metal uptake and incorporation into apoproteins representing a
considerable challenge for organisms, one that can be metabolically expensive
due to the requirement for a host of accessory/assembly/metal uptake proteins
and/or the energy required for active uptake of the metals from the
environment. The metal containing FDH enzymes of S.oneidensis MR-1
represent a fascinating example, with multiple isoforms encoded by the genome
highlighting the importance of the reaction they collectively catalyse. Formate
oxidation in S.oneidensis MR-1 has been shown to be a key part of anaerobic
respiration, contributing to PMF generation and removal of cytoplasmic formate
from precursor molecules like pyruvate and lactate (Kane et al. 2016). Despite
metal dependent FDH enzymes from other organisms containing either W or
Mo, it was initially expected that due to the higher abundance of Mo in
environments where S.oneidensis is usually found (Chapter 3 discussion) and
the annotation of these enzymes as molybdoenzymes in online databases such
as KEGG (Kanehisa et al. 2017), Mo would be required for FDH activity in
S.oneidensis. However W (in the form of sodium tungstate) was found to be
essential for maximal catalysis and not Mo (Chapter 3). Such a result was
unexpected but since the hallmark of Shewanella species is their ability to
couple to a wide range of electron acceptors, many of which also require Mo
containing enzymes (TMAO reductase, DMSO reductase, nitrate reductase etc.
(Gralnick et al. 2006)) the use of W in place of Mo in FDH enzymes would help
alleviate the competition for these metals, presenting a selective advantage to
those organisms capable of making use of a full complement of terminal
reductases even when environmental Mo concentrations are low.
Although the overall requirement for W for maximal FDH activity in
S.oneidensis MR-1 is interesting it does not adequately resolve the individual
contributions of the three isoforms. It is interesting to note that gene expression
of these three isoforms seems differentially regulated by the presence of 3µM
tungstate or molybdate in the growth medium, with the Fdh1αβγ and Fdh2αβγ
isoforms expressed under both conditions, whilst Fdnαβγ expression is not seen
when supplemented with tungstate (Chapter 3). The study of a range of FDH

226
deletion strains suggests that the Fdh1αβγ and Fdh2αβγ isoforms are
responsible for the formate oxidation activity observed in colourimetric assays in
WT cells when grown with tungstate, but that when grown with molybdate the
Fdnαβγ isoform plays a more important role (Chapter 5). This is supported by
the observation that Fdh2αβγ (when grown with tungstate) can be natively
purified and has been shown to be active with W at the active site (Chapter 4).
These collective observations could be taken to suggest a simple system with
two of the isoforms (Fdh1αβγ and Fdh2αβγ) oxidising formate during tungstate
supplemented growth and the third (Fdnαβγ) during molybdate supplemented
growth. However this appears not to be the case, with the Fdh1αβγ and Fdh2αβγ
isoforms partially contributing to colourimetrically assessed FDH activity and
growth when supplemented with molybdate and the presence of Fdnαβγ
regulating the assayed FDH activity seen by Fdh1αβγ and Fdh2αβγ when grown
with tungstate. Further study will be required to tease apart the complicated
relationship between these three isoforms, but it appears that as a
generalisation the Fdh1αβγ and Fdh2αβγ isoforms are collectively responsible
for growth and FDH activity in formate and tungstate containing growth
conditions, i.e. those conditions of most interest for the majority of this work.
The requirement for W supplementation for maximal FDH activity in
S.oneidensis MR-1 has not been previously reported. It is worth noting that
since the oxidation of formate is considered an important part of the catabolism
of S.oneidensis when grown on an anode in MFC devices (Luo et al. 2016), this
result may hold applicational significance. The addition of W to growth media
when culturing S.oneidensis, or indeed other Shewanella species studied in
Chapter 4, may enhance current production in MFC experiments by intensifying
formate oxidation in the periplasm and therefore increasing the flow of electrons
from the terminal reductases in the Mtr pathway to an electrode. This may even
be the case for ‘rich’ growth media such as LB which are normally considered to
contain an excess of all required metals, despite this, experiments in LB
(Chapter 4) suggest that the addition of 3 µM tungstate significantly increases
FDH activity even in this growth medium.
The development of a CO2 reductase activity for S.oneidensis demonstrated for
the first time that the FDH enzymes of S.oneidensis MR-1 are reversible. This
was not necessarily expected as many metal containing FDHs have been shown

227
to be irreversible (Oh & Bowien 1998), and in light of the native role of many of
these enzymes catalysing formate oxidation the ability to drive CO2 reduction
would offer no immediately evident advantage. It should be stressed that the
reported CO2 reductase activity described throughout this work is not suggested
to be physiologically relevant in S.oneidensis MR-1 and is only observed in the
presence of a strong exogenous reductant, either dithionite (Chapter 4-5) or a
cathode (Chapter 6). Despite not being relevant for native metabolism the
observed CO2 reductase activity is an exciting observation for biotechnological
exploitation.
CO2 reductase activity in S.oneidensis MR-1 is highest when cultures are grown
in the presence of W, and the isoform Fdh2αβγ (with a lesser role for Fdh1αβγ)
catalyse this CO2 reduction (Chapter 3 and 5). Accordingly CO2 reductase
activity is entirely found in membrane fractions of cells and is associated with
natively purified Fdh2αβγ containing W with an estimated turnover value of
10.7 ± 3.8 s-1 (Chapter 4).
This activity can be seen to be maximal at acidic pH values, in line with the
proposed mechanism where a protonated active site (Mo4+-SH) is thought to be
required to drive CO2 reduction. Catalysis is also inhibited in a concentration-
dependent manner by the known FDH inhibitor azide and the measured
reduction of CO2 to formate can be confirmed using 1H NMR (Chapter 4), which
when driven by an electrode is seen with a high (107 %) coulombic efficiency
(Chapter 6).
Together these observations allow an informed development of CO2 reductase
activity in a microbial electrosynthetic system. The work in Chapter 6 confirms
this possibility with CO2 reductase activity being seen in both mediated (by MV)
and non-mediated electrochemical experiments, requiring W supplementation
during growth to reach maximal catalysis. The mechanism behind electron
transfer from the cathode for reductive catalysis in the non-mediated system
remains unclear, with the Mtr pathway usually implicated in electron exchange
with an electrode in S.oneidensis not thought to play a role. Other possibilities,
including a role of hydrogen mediation or alternative outer membrane pathways
would provide an interesting avenue for further characterisation.

228
Despite the mechanisms behind the observed CO2 reductase activity on an
electrode not being completely understood the system presented here still
represents an important paradigm. Regardless of whether a proportion of the
cells are lysing and enzymes are interacting directly with an electrode the
system here presents an efficient cost effective way of producing a selective
biocatalyst for the reduction of CO2 to formate. As mentioned in Chapter 1, the
major constraint of using biologically derived enzymes for such transformations
is the time and costs associated with their purification and immobilisation on an
electrode, this system requires no previous purification steps, functioning with a
planktonic culture interacting with an unmodified graphite electrode without
the need for exogenous mediators and capable of sustained catalysis for an
extended (5 day) timeframe.
Excitingly the field of whole cell biocatalysts (Reshamwala et al. 2014) or
‘’microbial factories’’ (Pandit & Mahadevan 2011) has been gaining momentum
in the last few years, with multiple groups focusing more and more on microbial
electrosynthesis (Khosravanipour et al. 2017)(Sadhukhan et al. 2016). Indeed
the idea of using Mo and W containing FDH enzymes for biotechnological CO2
reduction too has been gathering momentum (Bassegoda et al. 2014)(Maia et al.
2017). The work here combines these two areas with the currently proposed
system using S.oneidensis considered an ideal point for further study.
The current electrochemical design could be further developed with the
introduction of stirring during experiments to assess whether diffusion limits
the observed rates of catalysis. Equally the information derived from previous
biochemical studies (Chapters 4-5) could be used to further refine the design,
running the experiments at lower pH to increase CO2 reductase rates or by
using the ΔFdnΔFdh1 strain instead of WT, which showed higher CO2 reduction
rates. Although the work in Chapter 6 suggested that S.oneidensis is capable of
catalysis over 5 days a true lifespan for such a system could also be investigated,
running the device until either substrate was depleted or reductive currents
were no longer observed.
Careful evaluation of use of sodium carbonate as a substrate for CO2 reduction
assays would be another aspect for future study. Although comparable rates
were seen in MV coupled assays using sodium carbonate or gaseous CO2
(Chapter 4) the effect of adding exogenous carbonic anhydrase to increase the

229
available substrate concentration could be studied as another possible method
for intensifying catalysis. It is interesting to note that the genome of
S.oneidensis MR-1 contains a gene annotated as a carbonic anhydrase
(SO_2474) but whether it is functionally expressed under the described
conditions has not been studied. The aceogenic A.woodii that naturally catalyses
CO2 reduction to formate has been shown to possess an equivalent carbonic
anhydrase (Schuchmann & Müller 2013).
Considering electrochemical CO2 reductase activity in S.oneidensis MR-1 does
not seem to require the Mtr pathway the possibility of driving comparable
catalysis in other organisms could also be explored. Since the FDH-H of E.coli
has already been demonstrated to be reversible on an electrode when purified
this gram negative bacterium would make an interesting comparison.
Equivalent experiments to those performed here using planktonic E.coli
cultures may indicate whether the mechanisms for non-mediated catalysis seen
in Chapter 5 are present in other comparable gram negatives.
In addition to E.coli other bacterial species or strains could be studied in
comparative experiments. The use of Shewanella cultures other than
S.oneidensis MR-1 would prove an interesting route, especially study of those
strains that demonstrated high rates of CO2 reduction compared to formate
oxidation in Chapter 4. A good example is S.amazonensis SB2B, which showed
high rates of MV coupled CO2 reduction when grown with Mo or W, but almost
no formate oxidation, making it an interesting target for electrochemical study.
The use of bacterial strains that physiologically use iron or a cathode as an
electron donor (e.g. Mariprofundus ferrooxydans PV-1 (Summers et al. 2013))
would be another area of particular interest as these would theoretically be
predisposed to accept electrons from a cathode. Although the limitations of these
species is their typically slow growth rate, if the relevant iron oxidising
machinery proved suitable it could be transferred to a faster growing organism
such as S.oneidensis.
Although other bacterial species are discussed here one of the key advantages of
using S.oneidensis MR-1 for such experiments is its plasticity. The genome of
S.oneidensis MR-1 is well characterised and is genetically tractable allowing
easy introduction of other metabolic elements. These could include the
230
machinery required for subsequent transformation of formate to molecules of
higher worth or complexity whilst using the same single organism system. It
also would allow incorporation of non-native FDH enzymes to assess if CO2
reduction can be intensified should more suitable non-native FDH isoforms be
identified. Importantly however S.oneidensis is one of a limited number of
organisms with the required metabolic machinery for correct assembly of
complex multi cytochrome proteins, which the majority of extracellular electron
transfer proteins tend to be (Liang et al. 2009). As such this work establishes an
important premise, showing the native ability of S.oneidensis MR-1 to catalyse
CO2 reduction allowing informed future studies in this biotechnologically
attractive organism.
7.1 References
Bassegoda, A. et al., 2014. Reversible Interconversion of CO2 and Formate by a Molybdenum-
Containing Formate Dehydrogenase. Journal of the American Chemical Society, 136(44),
pp.15473–6.
Gralnick, J. a et al., 2006. Extracellular respiration of dimethyl sulfoxide by Shewanella
oneidensis strain MR-1. Proceedings of the National Academy of Sciences of the United States
of America, 103(12), pp.4669–74.
Kane, A.L. et al., 2016. Formate metabolism in Shewanella oneidensis generates proton motive
force and prevents growth without an electron acceptor. Journal of Bacteriology, 198(8),
pp.1337–1346.
Kanehisa, M. et al., 2017. KEGG as a reference resource for gene and protein annotation. Nucleic
acids research, 44(September), pp.457–462.
Khosravanipour, A. et al., 2017. Microbial electrosynthesis of solvents and alcoholic biofuels from
nutrient waste: A review. Journal of Environmental Chemical Engineering, 5(1), pp.940–
954.
Liang, S. et al., 2009. The roles of outer membrane cytochromes of Shewanella and Geobacter in
extracellular electron transfer. Environmental microbiology reports, 1(4), pp.220–7.
Luo, S. et al., 2016. (13)C Pathway Analysis for the Role of Formate in Electricity Generation by
Shewanella Oneidensis MR-1 Using Lactate in Microbial Fuel Cells. Scientific reports,
6(February), p.20941.
Maia, L.B., Moura, I. & Moura, J.J.G., 2017. Molybdenum and tungsten-containing formate
dehydrogenases: aiming to inspire a catalyst for carbon dioxide utilization. Inorganica
Chimica Acta, 455(2), pp.350–363.
231
Oh, J.-I. & Bowien, B., 1998. Structural Analysis of the fds Operon Encoding the NAD+-linked
Formate Dehydrogenase of Ralstonia eutropha. The Journal of biological chemistry, 273(41),
pp.26349–26360.
Pandit, A. V & Mahadevan, R., 2011. In silico characterization of microbial electrosynthesis for
metabolic engineering of biochemicals. Microbial cell factories, 10(1), p.76.
Reshamwala, S.M.S. et al., 2014. Construction of an efficient Escherichia coli whole-cell
biocatalyst for D -mannitol production. Journal of Bioscience and Bioengineering, 118(6),
pp.628–631.
Sadhukhan, J. et al., 2016. A critical review of integration analysis of microbial electrosynthesis (
MES ) systems with waste biorefineries for the production of biofuel and chemical from
reuse of CO2. Renewable and Sustainable Energy Reviews, 56, pp.116–132.
Schuchmann, K. & Müller, V., 2013. Direct and Reversible Hydrogenation of CO2 to Formate by a
Bacterial Carbon Dioxide Reductase. Science, 342(December), pp.1382–1386.
Summers, Z.M., Gralnick, J. a & Bond, D.R., 2013. Cultivation of an obligate Fe(II)-oxidizing
lithoautotrophic bacterium using electrodes. mBio, 4(1), pp.e00420-12.

232
Appendix
Table A1 Collection of growth and kinetic data for deletion mutants in different conditions.
Growth condition refers anaerobic growth for 24 h when supplemented either with 3 µM Na
tungstate (+W), 3 µM Na molybdate (+Mo), 3 µM Na tungstate and molybdate (+W/+Mo) or not
supplemented with either (-W/ -Mo). Lag phase: Duration of lag phase in hours, green indicating a
lag phase between 4 to 5 h, light green between 5 and 6 h, yellow between 6 and 8 h, light orange
between 8 and 10 h and dark orange denoting 16+ h. Exponential phase: Specific growth rate (µ)
during exponential growth, green indicating a specific growth rate between 0.3 and 0.35 h-1, light
green between 0.25 and 0.3 h-1, yellow between 0.2 and 0.25 h-1, light orange between 0.15 and 0.2
h-1 and dark orange between 0.1 and 0.15 h-1 .Stationary phase: Average OD600 during stationary
phase where green indicates an OD600 reading between 0.25 and 0.3, light green between 0.2 and
0.25, yellow between 0.15 and 0.2, and orange between 0.1 and 0.15, where those marked with (*)
did not reach stationary phase within 24 hours and instead describe OD600 values after 24 hours
growth. Formate oxidation: Specific activity, determined by methyl viologen assay and normalised
to total cell protein content where green indicates an formate dehydrogenase specific activity
between 0.7 and 0.56 µmolmin-1mg-1, light green between 0.56 and 0.42, yellow between 0.42 and
0.28, light orange between 0.28 and 0.14 and dark orange between 0.14 and 0 µmolmin-1mg-1. (-)
indicates strains where growth was not detected.
Growth
condition Strain
Lag
phase
Exponential
phase
Stationary
phase
Formate
oxidation
+W
Wild Type 4.9 ± 0.7 0.37 ± 0.06 0.20 ± 0.03 0.701 ± 0.015
ΔFdh1 4 ± 0.7 0.18 ± 0.02 0.11 ± 0.01 0.481 ± 0.002
ΔFdh2 4 ± 0.4 0.17 ± 0.01 0.18 ± 0.04 0.431 ± 0.224
ΔFdn 4.6 ± 0.3 0.18 ± 0.02 0.2 ± 0.04 0.708 ± 0.028
Fdh1+ 6 ± 0 0.35 ± 0.05 0.22 ± 0.06 0.328 ± 0.095
Fdh2+ 8.8 ± 1.2 0.17 ± 0.01 0.18* ± 0.03 0.630 ± 0.138
Fdn+ - - - -
ΔFDH - - - -
+Mo
Wild Type 5 ± 0.4 0.29 ± 0.08 0.30 ± 0.05 0.282 ± 0.027
ΔFdh1 4 ± 0.57 0.13 ± 0.03 0.16 ± 0.01 0.242 ± 0.029
ΔFdh2 4.7 ± 0.3 0.15 ± 0.01 0.22 ± 0.01 0.189 ± 0.013
ΔFdn 5.3 ± 0.3 0.12 ± 0.04 0.29 ± 0.01 0.009 ± 0.009
Fdh1+ 10 ± 1 0.16 ± 0.03 0.25* ± 0.01 0.044 ± 0.002
Fdh2+ 16.3 ± 1.2 0.18 ± 0.04 0.12* ± 0.01 0.003 ± 0.001
Fdn+ - - - -
ΔFDH - - - -

233
Table A1 (cont.)
Growth
condition Strain
Lag
phase
Exponential
phase
Stationary
phase Formate oxidation
+W/+Mo
Wild Type 4.6 ± 0.4 0.34 ± 0.04 0.21 ± 0.02 0.545 ± 0.033
ΔFdh1 5 ± 0 0.21 ± 0.02 0.1 ± 0.01 0.262 ± 0.072
ΔFdh2 4 ± 0.57 0.16 ± 0.02 0.16 ± 0.03 0.35 ± 0.009
ΔFdn 4.7 ± 0.3 0.15 ± 0.02 0.19 ± 0.03 0.54 ± 0.013
Fdh1+ 5.6 ± 0.3 0.25 ± 0.04 0.2 ± 0.04 0.291 ± 0.027
Fdh2+ 7.7 ± 0.3 0.23 ± 0.01 0.12 ± 0.01 0.547 ± 0.055
Fdn+ - - - -
ΔFDH - - - -
-W/-Mo
Wild Type 5 ± 0.4 0.25 ± 0.03 0.23 ± 0.04 0.214 ± 0.0.02
ΔFdh1 5.6 ± 0.3 0.13 ± 0.02 0.15 ± 0.03 0.089 ± 0.01
ΔFdh2 4.6 ± 0.3 0.14 ± 0.02 0.2 ± 0.03 0.059 ± 0.001
ΔFdn 4 ± 0.57 0.13 ± 0.02 0.2 ± 0.02 0.01 ± 0.005
Fdh1+ 4.7 ± 0.3 0.14 ± 0.02 0.23 ± 0.02 0.004 ± 0.001
Fdh2+ 8.3 ± 0.3 0.15 ± 0.01 0.2* ± 0.01 0.008 ± 0.001
Fdn+ - - - -
ΔFDH - - - -

234
Figure A-1 Example NMR traces for analysis of CO2 reductase assays
Methyl viologen CO2 reductase assays were conducted using cells grown in minimal growth media
where +W indicates sodium tungstate supplementation at 3 µM and +Mo indicates sodium
molybdate supplementation at 3 µM. Following these assays and whole cell removal, supernatant
was analysed for formate content by 1H NMR. Shown are example NMR traces highlighting the
formate feature at 8.46, this peak was integrated and compared with standards to quantify formate
concentration presented in Figure 4-4. Other signals represent contributions from assay reagents
including HEPES, dithionite and methyl viologen, all spectra normalised to TSP methyl peak (0).


![The PrpF protein of Shewanella oneidensis MR-1 catalyzes ... · activity and that PrpF has aconitate isomerase activity. Here we report in vitro evidence that ... (AcnB]. Given that](https://img.pdfslide.net/doc/110x75/5acb35917f8b9a7d548e8339/the-prpf-protein-of-shewanella-oneidensis-mr-1-catalyzes-and-that-prpf-has-aconitate.jpg)
![Synthesis of nanoparticles by green chemistry …...(Rhodococcus sp.) [59]Bacterium Actinobacter spp[60] was reported. γ-proteobacterium Shewanella oneidensis can reduce tetrachloroaurate](https://img.pdfslide.net/doc/110x75/5fa40df8360e89563d43f2bd/synthesis-of-nanoparticles-by-green-chemistry-rhodococcus-sp-59bacterium.jpg)