Embed Size (px)
Citation preview

35
3CHARACTERISTICS OF
CHILDBEARING WOMEN

3. CHARACTERISTICS OF CHILDBEARING WOMEN
COREMultiple birth rate by number of fetuses (C7)
Distribution of maternal age (C8) Distribution of parity (C9)
RECOMMENDED Percentage of women who smoke during pregnancy (R8)
Distribution of maternal prepregnancy body mass index (R12)
RECOMMENDED INDICATORS NOT INCLUDED IN THIS REPORTDistribution of mothers’ educational level (R9)
Distribution of parents’ occupational classification (R10) Distribution of mothers’ country of birth (R11)
The demographic and social characteristics of childbearing women are related to a wide range of pregnancy outcomes, including mode of delivery and maternal and neonatal mortality and morbidity. Interpreting variations in indicators of obstetric and neonatal care and outcomes between countries requires information about the characteristics of the population of pregnant women.
Euro-Peristat selected three core indicators, considered essential for describing the childbearing population – women with multiple pregnancies, maternal age, and parity – as well as five recommended indicators. Although this report focuses on the core indicators, we also present data on two of the recommended indicators – smoking and maternal prepregnancy BMI. The other three recommended indicators – mother’s educational level, parental occupational status, and mother’s country of birth – will be published later.
In the following section we introduce each indicator and describe the rationale for the choice and its impact on perinatal outcomes. The three recommended indicators that are not presented provide important information on the social context, which affects perinatal outcomes within countries and therefore provides a measure of social inequalities in health. Euro-Peristat has shown with data from 2010 that stillbirth rates throughout Europe are higher among women with lower educational or occupational levels (see section on stillbirth, C1).
EUROPEAN PERINATAL HEALTH REPORT
36

C7 MULTIPLE BIRTHS BY NUMBER OF FETUSES
JUSTIFICATION Compared with singletons, babies from multiple pregnancies have much higher rates of stillbirth, neonatal mortality, infant mortality, preterm birth, low birth weight, congenital anomalies, and long-term health and developmental problems associated with complications of the perinatal period. Rates of multiple birth vary between countries and over time. They are influenced by differences in the proportions of older women giving birth (see C8), because the probability of a multiple pregnancy increases with age. Older women also experience more subfertility and are more likely to use ART. The extent of use of ovarian stimulation and assisted conception and the policies for preventing multiple pregnancies with ART are therefore also major determinants of rates of multiple pregnancy in the population. Use of subfertility procedures is rising across Europeandpoliciesrelatedtotheirusedifferfromcountrytocountry;4 for instance, elective single embryo transfer (eSET) has been extensively promoted in several countries, including Belgium, the Czech Republic, Sweden, Finland, and Austria, and recent studies comparing the use of eSET between countries show its impact on the incidence of multiple pregnancies.5
DEFINITION AND PRESENTATION OF INDICATOR Figure 7.1 shows the rates of twin and triplet and higher-order births, expressed as numbers of women with twin and with triplet or higher-order births per 1000 women giving birth to one or more fetuses.
DATA SOURCES AND AVAILABILITY OF INDICATOR IN EUROPEAN COUNTRIES All countries provided data for this indicator. Greece, Hungary, and Romania provided data by births and not by pregnant women, so we estimated the rates of multiple maternities from birth data (by dividing by 2 for twins and 3 for triplets). Data came primarily from medical birth registers and perinatal databases as well as from civil registration systems. Most countries had no missing data or a very minimal number of women with missing data.
METHODOLOGICAL ISSUES IN THE CALCULATION, REPORTING, AND INTERPRETATION OF THE INDICATOR The pregnancies included in civil registration systems depend on the laws governing the births requiring registration. These affect the extent to which multiple births in which one or more babies die before birth or registration are included. In addition, multiple births are rare events. In small populations such as those of Cyprus, Iceland, Luxembourg, and Malta, year-to-year random variations will be greater and confidence intervals around the rates wide. In comparing these data with other data sources, it is important to note that the multiple birth rate is sometimes presented with births as the denominator (rather than pregnant women, as in the Euro-Peristat definition).
RESULTS Multiple birth rates varied from below 15 per 1000 women with live births or stillbirths in Romania, Slovakia, Poland, Greece, Finland, Lithuania, Scotland, Northern Ireland, and the Czech Republic to more than 20 per 1000 in Cyprus (27/1000) and Spain (22/1000) in 2015, as shown in Figure C7.1, which also provides the number of women in each country with information on this indicator. For triplets and more, Cyprus had the highest rate (0.9/1000) in 2015, and Greece, Estonia, Slovakia, the Czech Republic, Latvia, and Finland the lowest rates (around 0.1/1000). The median twin rate was 16.4/1000 with an interquartile range (IQR) between 14.5 and 17.4, and the
37

triplet rate was 0.2 per 1000 with an IQR of 0.2 to 0.3. Median rates were similar for 2010, 16.4 per 1000 and 0.3 per 1000, respectively, but changes over time differed. Figure C7.3 presents risk ratiosbetweenthetwoyearswith95%confidenceintervalsfortwinpregnancyrates;significantdecreases of 10% or more in twinning rates were observed in Austria, Slovakia, Finland, Denmark, and the Czech Republic. Increases of 10% or more were observed in Ireland, Romania, Portugal, and Latvia. The heterogeneity between countries in rates between the two periods was statistically significant.
KEY POINTS • Perinatalcomplicationsassociatedwithmultiplebirthsimposeconsiderablecostsonhealth
services, families, and societies. Accordingly, the high rates due to either delayed childbearing or subfertility management raise questions about the need for policies to encourage earlier childbearing and to prevent multiple pregnancies in assisted conception.
• Thedecreaseintwinningratesinsomecountriesmaybetheresultofpoliciestoreducetherisksofmultiplebirthsforwomenundergoingsubfertilityprocedures;moreknowledgeabouthow these policies are contributing to the changes in the multiple birth rate would be useful for health professionals and policy makers.
• Intheabsenceofdataaboutovarianstimulationandassistedconception,age-specificmultiple birth rates can provide an indication of the extent of their use.
REFERENCES1. Heino A, Gissler M, Hindori-Mohangoo AD, et al. Variations in Multiple Birth Rates and Impact
on Perinatal Outcomes in Europe. PLoS One.2016;11(3):e0149252.
2. Bonellie SR, Currie D, Chalmers J. Comparison of risk factors for cerebral palsy in twins and singletons. Dev Med Child Neurol.2005;47(9):587-591.
3. Boyle B, McConkey R, Garne E, et al. Trends in the prevalence, risk and pregnancy outcome of multiple births with congenital anomaly: a registry-based study in 14 European countries 1984-2007. BJOG.2013;120(6):707-716.
4. De Geyter C, Calhaz-Jorge C, Kupka MS, et al. ART in Europe, 2014: results generated from European registries by ESHRE: The European IVF-monitoring Consortium (EIM) for the European Society of Human Reproduction and Embryology (ESHRE). Hum Reprod. 2018.
5. Scholten I, Chambers GM, van Loendersloot L, et al. Impact of assisted reproductive technology on the incidence of multiple-gestation infants: a population perspective. Fertil Steril.2015;103(1):179-183.
EUROPEAN PERINATAL HEALTH REPORT
38

Figure C7.1 Multiple birth rates per 1000 women with live births or stillbirths by number of fetuses in 2015
NOTE: Numbers in parentheses are number of women for whom there were data about multiple pregnancy (all stated). * Estimated from data on babies.
39
Twins
Triplets or more
0 5 10 15 20 25 30
per 1000 women delivering a live birth or stillbirth
Belgium (120-681)
Bulgaria, 2014 (64-427)
Czech Republic (107-618)
Denmark (56-895)
Germany (714-574)
Estonia (13-731)
Ireland (64-650)
Greece* (88-554)
Spain (412-266)
France (748-589)
Croatia (36-866)
Italy (478-003)
Cyprus (9171)
Latvia (21-496)
Lithuania (31-160)
Luxembourg (6762)
Hungary, 2012* (88-819)
Malta (4385)
Netherlands (166-700)
Austria (82-565)
Poland, 2014 (372-046)
Portugal (84-556)
Romania* (199-646)
Slovenia (20-003)
Slovakia (55-112)
Finland (55-080)
Sweden, 2014 (113-999)
UK: England and Wales (689-751)
UK: Scotland (53-689)
UK: Northern Ireland (23-937)
Iceland (4026)
Norway (58-927)
Switzerland, 2014 (83-696)
17.3
17.8
14.5
16.9
18.8
16.6
18.7
13.2
22.1
17.1
14.8
16.4
26.0
15.1
13.4
17.9
16.0
15.1
16.7
15.4
13.0
17.3
10.1
19.3
12.7
13.4
14.9
15.8
14.2
14.3
17.4
16.6
18.0
0.3
0.2
0.1
0.2
0.4
0.1
0.5
0.1
0.3
0.3
0.2
0.4
0.9
0.1
0.4
0.4
0.3
0.2
0.3
0.3
0.2
0.2
0.2
0.2
0.1
0.1
0.2
0.2
0.3
0.3
0.2
0.2
0.4

Figure C7.2 Twin birth rates per 1000 women in 2010 and 2015
NOTES: Countries sorted by rate difference between 2010 and 2015. First-period data not from 2010: Cyprus 2007. Second-period data not from 2015: Bulgaria 2014, Hungary 2012, Poland 2014, Sweden 2014, Switzerland 2014.
EUROPEAN PERINATAL HEALTH REPORT
40
2010
2015
0 5 10 15 20 25 30
per 1000 women delivering a live birth or stillbirth
Czech Republic
Denmark
Malta
Finland
Slovakia
Austria
UK: Scotland
Belgium
UK: Northern Ireland
Netherlands
Luxembourg
Switzerland
Poland
France
Norway
UK: England and Wales
Germany
Lithuania
Sweden
Cyprus
Slovenia
Romania
Italy
Spain
Estonia
Ireland
Portugal
Latvia
Iceland
21.0
20.9
18.7
15.3
14.5
17.2
15.8
18.5
15.3
17.7
18.3
18.4
13.4
17.4
16.4
15.4
18.5
12.5
14.0
25.1
18.5
9.0
15.0
20.2
14.7
16.8
15.1
12.6
14.3
14.5
16.9
15.1
13.4
12.7
15.4
14.2
17.3
14.3
16.7
17.9
18.0
13.0
17.1
16.6
15.8
18.8
13.4
14.9
26.0
19.3
10.1
16.4
22.1
16.6
18.7
17.3
15.1
17.4

Figure C7.3 Comparison of twin pregnancy rates, 2010 and 2015 (risk ratios and 95% confidence intervals)
NOTE: Overall random effects estimate: 0.99 (95% CI: 0.95, 1.03). I2=92.6% Chi squared tests of heterogeneity: 378.65 (d.f. = 28), p <.001. First-period data not from 2010: Cyprus 2007. Second-period data not from 2015: Bulgaria 2014, Hungary 2012, Poland 2014, Sweden 2014, and Switzerland 2014.
41
Czech Republic
Malta
Denmark
Finland
Slovakia
Austria
UK: Scotland
Belgium
UK: Northern Ireland
Netherlands
Poland
Luxembourg
Switzerland
France
Norway
Germany
UK: England and Wales
Cyprus
Slovenia
Sweden
Lithuania
Italy
Spain
Ireland
Estonia
Romania
Portugal
Latvia
Iceland
0.69 (0.65, 0.74)
0.80 (0.58, 1.12)
0.81 (0.74, 0.88)
0.87 (0.79, 0.96)
0.87 (0.79, 0.97)
0.90 (0.83, 0.97)
0.90 (0.82, 0.99)
0.94 (0.88, 0.99)
0.94 (0.81, 1.08)
0.95 (0.90, 1.00)
0.97 (0.94, 1.01)
0.98 (0.76, 1.26)
0.98 (0.91, 1.05)
0.99 (0.96, 1.01)
1.02 (0.93, 1.11)
1.02 (1.00, 1.05)
1.02 (1.00, 1.05)
1.03 (0.86, 1.24)
1.05 (0.91, 1.20)
1.06 (0.99, 1.13)
1.07 (0.93, 1.22)
1.09 (1.06, 1.12)
1.09 (1.06, 1.12)
1.11 (1.03, 1.20)
1.13 (0.94, 1.35)
1.13 (1.06, 1.20)
1.14 (1.06, 1.23)
1.20 (1.02, 1.41)
1.22 (0.88, 1.69)
1.5 .75 1 1.25 1.5Risk ratios with 95% confidence intervals

C8 MATERNAL AGE AT DELIVERY
JUSTIFICATIONBoth early and late childbearing are associated with higher than average rates of preterm birth, growth restriction, and perinatal mortality.1-4 Younger mothers are more likely to have low social status, unwanted or hidden pregnancies, inadequate antenatal care, and poor nutrition. Older mothers have a higher risk of multiple births, as described in indicator C7, of some congenital anomalies, and of pregnancy complications, including hypertension and diabetes. Maternal morbidity and mortality are highest among the youngest and oldest women. Older mothers have caesarean deliveries more often. The risks of younger age are mainly observed among very young mothers.4 For older mothers, risks rise more acutely after age 40.5
Because of the association between maternal age and perinatal health outcomes and because the age at which women in European countries bear children differs widely, the maternal age distribution should be taken into account in comparisons between countries. Furthermore, mothers are increasingly having children later in life throughout Europe, and this could affect trends in perinatal health indicators.
Policy issues include integrating into prenatal care services that address the specific needs of older pregnant women and providing information about the risks associated with early and delayed childbearing. Younger mothers may be exposed to less favourable social conditions, which have long-term consequences for themselves and their children. The prevention of teenage pregnancy is a policy concern in some countries of Europe, but many others have already attained very low rates.6 The challenges of managing later childbearing are widely shared across European countries.
DEFINITION AND PRESENTATION OF INDICATORThis indicator is defined as the distribution of age in years at delivery for women delivering a live born or stillborn baby. The recommended presentation is: 10-14, 15-19, 20-24, 25-29, 30-34, 35-39, 40-44, and 45 and older. This summary presentation focuses on the extremes of the childbearing distribution, defined as younger than 20 years and 35 years and older.
METHODOLOGICAL ISSUES IN THE CALCULATION, REPORTING, AND INTERPRETATION OF THIS INDICATORSome civil registration systems record the age the mother reaches during the year of birth and not her age at delivery. In some situations, age may be recorded during antenatal visits but not updated at delivery. These data are presented in relation to total births in the Czech Republic and Greece and to live births in Hungary and Romania, rather than to women, as recommended by Euro-Peristat. The differences between these two numbers are due to multiple births, which are a relatively small proportion of total births even among women aged 35 or more, so this is not a major problem.
Data in France come from hospital statistics in 2015 and also from a representative survey in 2016, to enable a comparison with data provided in 2010, which came from the 2010 version of the same survey.
DATA SOURCES AND AVAILABILITY OF INDICATOR IN EUROPEAN COUNTRIESAll countries were able to provide this indicator. Data correspond to births in 2014 in Bulgaria, Poland, Sweden, and Switzerland and in 2016 in France for the comparison with 2010.
EUROPEAN PERINATAL HEALTH REPORT
42

43
RESULTSThe percentage of mothers aged younger than 20 varied from 0.8% in Switzerland to 10.2% in Bulgaria. This percentage was 9.7 in Romania, 6.3 in Hungary and Slovakia, and under 4 in the other countries (Figure C8.1). The median percentage was 2.1% with an IQR of 1.4% to 3.5%. The percentage of older mothers, defined as women giving birth at 35 years or older, ranged from about 14% in Bulgaria, Poland, and Romania to 36.3% in Italy and 37.3% in Spain. The median for all countries was 20.8, with an IQR of 18.9 to 23.3. The group of women aged between 25 and 34 years, at the lowest perinatal risk, is proportionally small (53% to 55%) in Bulgaria and Hungary because of the high proportion of women under 25, and in Ireland, Spain, and Italy because of the high proportion of births to women aged 35 or more.
Figures C8.2 and C8.3 provide a geographical representation of the distribution of maternal age at childbirth in participating countries based on the percentages of younger and older mothers. These figures show clustering of countries in eastern Europe, where women are having children at earlier ages, as well as higher proportions of older mothers in southern Europe.
Having children later in life is a general trend in Europe (Figure C8.4). Only four countries (Estonia, Germany, the Netherlands, and Sweden) experienced a decrease between 2010 and 2015 in the percentage of women aged 35 years or more, and the absolute decrease was less than 1%. The increase was large with an absolute increase of about 8% in Portugal and Spain. This change is more pronounced when seen as a relative change, as in Figure C8.5, which presents risk ratios between the two years with 95% confidence intervals. The pooled measure of change for all the countries participating in Euro-Peristat is 1.16 (1.11-1.20), with highly significant heterogeneity.
KEY POINTS• Inmorethan60%ofthecountriesinEuro-Peristat,birthstoteenagemothersaccountforless
than 3% of all deliveries.
• Theproportionofwomenbearingchildrenlaterinlifevariessubstantiallybutinover60%of countries, at least one in every five births was to a women aged 35 years or older, and the percentage of births to women in this age group increased substantially in almost every country.
• Policiesshouldbedevelopedtoinformyoungwomenoftheconsequencesofhavingchildrenlater in life so that they can make informed choices about when to have their children.
• Encouragingearlierchildbearingmayalsorequirepoliciestosupportyoungparentsandworking mothers. Health services in countries with a higher percentage of women having babies at older ages need to make sure their health needs are met during pregnancy.

EUROPEAN PERINATAL HEALTH REPORT
44
REFERENCES
1. Lean SC, Derricott H, Jones RL, Heazell AEP. Advanced maternal age and adverse pregnancy outcomes: A systematic review and meta-analysis. PLoS One.2017;12(10):e0186287.
2. Cleary-Goldman J, Malone FD, Vidaver J, et al. Impact of maternal age on obstetric outcome. Obstet Gynecol.2005;105(5Pt1):983-990.
3. Huang L, Sauve R, Birkett N, Fergusson D, van Walraven C. Maternal age and risk of stillbirth: a systematic review. CMAJ.2008;178(2):165-172.
4. Gibbs CM, Wendt A, Peters S, Hogue CJ. The impact of early age at first childbirth on maternal and infant health. Paediatr Perinat Epidemiol.2012;26Suppl1:259-284.
5. Carolan MC, Davey MA, Biro M, Kealy M. Very advanced maternal age and morbidity in Victoria, Australia: a population based study. BMC Pregnancy Childbirth.2013;13:80.
6. Zeitlin J, Blondel B, Khoshnood B. Fertility, pregnancy and childbirth. In: Mackenbach J MM, ed. Successes and failures of health policy in Europe over four decades: Diverging trends, converging challenges: EuropeanObservatoryonHealthSystemsandPolicies.McGraw-Hill;2103.

45
Figure C8.1 Age distributions of women delivering live births or stillbirths in 2015
NOTE: In parentheses: the number of women with data for age at delivery.
<20
20-24
Percentage of women delivering live births or stillbirths
25-34
35+
0 10 20 30 40 50 60 70 80 90 100
Belgium (120-681)
Bulgaria, 2014 (64-427)
Czech Republic (107-618)
Denmark (58-895)
Germany (714-574)
Estonia (13-731)
Ireland (64-650)
Greece (92-159)
Spain (412-266)
France (748-589)
Croatia (36-866)
Italy (478-406)
Cyprus (9171)
Latvia (21-496)
Lithuania (31-160)
Luxembourg (6762)
Hungary (91-690)
Malta (4385)
Netherlands (166-700)
Austria (82-565)
Poland, 2014 (372-046)
Portugal (84-556)
Romania (201-023)
Slovenia (20-003)
Slovakia (55-112)
Finland (55-080)
Sweden, 2014 (113-999)
UK: Eng & Wales (689-751)
UK: Scotland (53-751)
UK: Northern Ireland (24-544)
Iceland (4026)
Norway (58-927)
Switzerland, 2014 (83-696)
1.7
10.2
2.4
1.0
2.1
2.7
1.8
2.5
2.0
2.0
3.1
1.3
1.4
3.5
3.8
1.4
6.3
3.0
1.0
2.1
3.6
2.7
9.7
1.0
6.3
1.7
1.2
3.5
3.9
3.2
2.1
1.3
0.8
11.9
21.7
12.3
11.0
10.9
14.6
8.8
8.0
7.2
12.5
14.2
8.2
9.2
17.1
16.5
8.5
14.6
11.6
9.3
13.2
16.1
10.3
19.1
10.5
15.9
14.0
12.8
15.6
15.9
14.0
16.0
12.2
8.2
67.9
54.5
64.3
66.8
63.8
62.9
55.1
59.8
53.4
65.0
63.9
54.2
68.0
61.1
64.0
62.6
55.1
66.3
69.0
64.0
65.6
57.6
56.7
69.8
60.9
63.5
64.5
59.6
59.4
60.5
61.8
66.3
63.8
18.5
13.6
20.9
21.1
23.3
19.8
34.3
29.7
37.3
20.6
18.9
36.3
21.4
18.3
15.7
27.4
23.9
19.1
20.8
20.7
14.8
29.5
14.5
18.7
16.9
20.8
21.6
21.3
20.7
22.3
20.1
20.2
27.2

Figure C8.2 Mothers aged <20 years as a percentage of all pregnancies with known maternal age in 2015
EUROPEAN PERINATAL HEALTH REPORT
46
n.s sig. %3.7–10.2
2.8–3.6
2.2–2.7
1.8–2.1
1.1–1.7
0.8–1.0
<20 years %
Iceland
Malta
Cyprus

47
Figure C8.3 Mothers aged ≥ 35 years as a percentage of all pregnancies with known maternal age in 2015
n.s sig. %29.6–37.3
21.5–29.5
20.8–21.4
19.2–20.7
17.0–19.1
13.6–16.9
≥ 35 years %
Iceland
Malta
Cyprus

EUROPEAN PERINATAL HEALTH REPORT
48
Figure C8.4 Percentage of mothers aged ≥ 35 years in 2010 and differences between 2010 and 2015
NOTES: First-period data not from 2010: Greece 2009, Cyprus 2007. Second-period data not from 2015: Bulgaria 2014, Poland 2014, Sweden 2014, Switzerland 2014.
2010
Difference between 2015 and 2010
0.0 5.0-5.0 10.0 15.0 20.0 25.0 30.0 35.0 40.0
Romania
Poland
Slovakia
Latvia
Lithuania
Slovenia
Czech Republic
Malta
Cyprus
Belgium
Hungary
Finland
Iceland
France, Survey
Norway
Austria
UK: England and Wales
UK: Scotland
UK: Northern Ireland
Estonia
Denmark
Netherlands
Portugal
Sweden
Luxembourg
Greece
Germany
Switzerland
Ireland
Spain
Italy
10.9
11.8
12.6
14.7
14.9
15.4
15.4
15.5
15.5
16.2
17.5
18.0
19.1
19.2
19.5
19.7
19.7
19.9
19.9
20.7
20.9
21.6
21.7
22.5
23.3
23.4
23.6
25.8
27.9
29.5
34.7
3.5
3.0
4.3
3.6
0.8
3.2
5.5
3.5
5.8
2.3
6.4
2.8
1.0
2.0
0.7
1.0
1.6
0.9
2.4
-0.9
0.2
-0.8
7.7
-0.9
4.2
6.4
-0.4
1.4
6.4
7.8
1.6

49
Figure C8.5 Comparison of the percentages of mothers aged ≥ 35 years, 2010 and 2015 (risk ratios and 95% confidence intervals)
NOTE: Pooled random effects estimate: 1.16 (95% CI: 1.11-1.20). I2=99.6% Chi squared tests of heterogeneity: 7611.48 (d.f. = 30), p < 0.001. First-period data not from 2010: Greece 2009, Cyprus 2007. Second-period data not from 2015: Bulgaria 2014, Poland 2014, Sweden 2014, Switzerland 2014.
1.5 .75 1 1.25 1.5Risk ratios with 95% confidence intervals
Estonia
Sweden
Netherlands
Germany
Denmark
Norway
Italy
Austria
Iceland
UK: Scotland
Lithuania
Switzerland
UK: England and Wales
France Survey
UK: Northern Ireland
Belgium
Finland
Luxembourg
Slovenia
Malta
Ireland
Latvia
Poland
Spain
Greece
Romania
Slovakia
Portugal
Czech Republic
Hungary
Cyprus
0.96 (0.91, 1.00)
0.96 (0.95, 0.98)
0.96 (0.95, 0.98)
0.99 (0.98, 0.99)
1.01 (0.99, 1.03)
1.04 (1.01, 1.06)
1.05 (1.04, 1.05)
1.05 (1.03, 1.07)
1.05 (0.97, 1.15)
1.05 (1.03, 1.08)
1.05 (1.02, 1.10)
1.06 (1.04, 1.07)
1.08 (1.08, 1.09)
1.11 (1.06, 1.16)
1.11 (1.07, 1.15)
1.14 (1.12, 1.16)
1.15 (1.13, 1.18)
1.18 (1.11, 1.25)
1.21 (1.16, 1.26)
1.23 (1.12, 1.35)
1.23 (1.21, 1.25)
1.25 (1.19, 1.30)
1.25 (1.24, 1.26)
1.27 (1.26, 1.27)
1.27 (1.25, 1.29)
1.32 (1.30, 1.34)
1.34 (1.30, 1.38)
1.35 (1.33, 1.38)
1.36 (1.33, 1.38)
1.37 (1.34, 1.39)
1.38 (1.29, 1.47)
EUROPEAN PERINATAL HEALTH REPORT
50
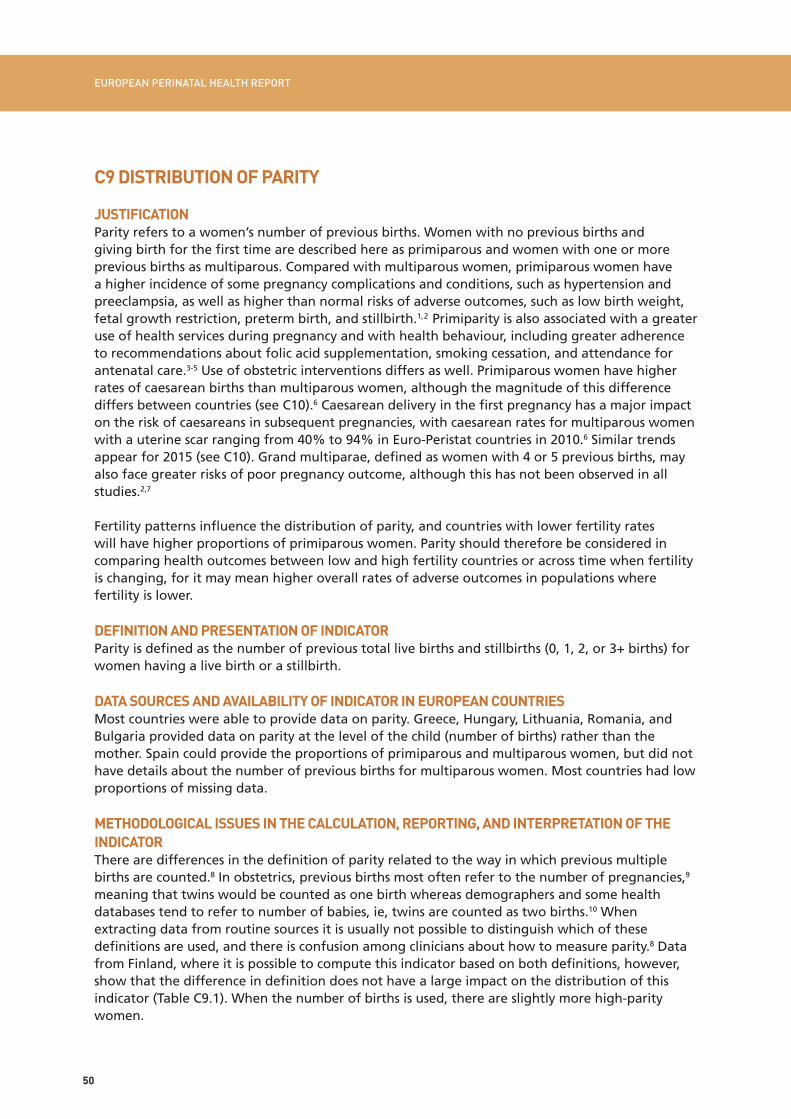
C9 DISTRIBUTION OF PARITY
JUSTIFICATIONParity refers to a women’s number of previous births. Women with no previous births and giving birth for the first time are described here as primiparous and women with one or more previous births as multiparous. Compared with multiparous women, primiparous women have a higher incidence of some pregnancy complications and conditions, such as hypertension and preeclampsia, as well as higher than normal risks of adverse outcomes, such as low birth weight, fetal growth restriction, preterm birth, and stillbirth.1,2 Primiparity is also associated with a greater use of health services during pregnancy and with health behaviour, including greater adherence to recommendations about folic acid supplementation, smoking cessation, and attendance for antenatal care.3-5 Use of obstetric interventions differs as well. Primiparous women have higher rates of caesarean births than multiparous women, although the magnitude of this difference differs between countries (see C10).6 Caesarean delivery in the first pregnancy has a major impact on the risk of caesareans in subsequent pregnancies, with caesarean rates for multiparous women with a uterine scar ranging from 40% to 94% in Euro-Peristat countries in 2010.6 Similar trends appear for 2015 (see C10). Grand multiparae, defined as women with 4 or 5 previous births, may also face greater risks of poor pregnancy outcome, although this has not been observed in all studies.2,7
Fertility patterns influence the distribution of parity, and countries with lower fertility rates will have higher proportions of primiparous women. Parity should therefore be considered in comparing health outcomes between low and high fertility countries or across time when fertility is changing, for it may mean higher overall rates of adverse outcomes in populations where fertility is lower.
DEFINITION AND PRESENTATION OF INDICATORParity is defined as the number of previous total live births and stillbirths (0, 1, 2, or 3+ births) for women having a live birth or a stillbirth.
DATA SOURCES AND AVAILABILITY OF INDICATOR IN EUROPEAN COUNTRIESMost countries were able to provide data on parity. Greece, Hungary, Lithuania, Romania, and Bulgaria provided data on parity at the level of the child (number of births) rather than the mother. Spain could provide the proportions of primiparous and multiparous women, but did not have details about the number of previous births for multiparous women. Most countries had low proportions of missing data.
METHODOLOGICAL ISSUES IN THE CALCULATION, REPORTING, AND INTERPRETATION OF THE INDICATORThere are differences in the definition of parity related to the way in which previous multiple births are counted.8 In obstetrics, previous births most often refer to the number of pregnancies,9 meaning that twins would be counted as one birth whereas demographers and some health databases tend to refer to number of babies, ie, twins are counted as two births.10 When extracting data from routine sources it is usually not possible to distinguish which of these definitions are used, and there is confusion among clinicians about how to measure parity.8 Data from Finland, where it is possible to compute this indicator based on both definitions, however, show that the difference in definition does not have a large impact on the distribution of this indicator (Table C9.1). When the number of births is used, there are slightly more high-parity women.
51
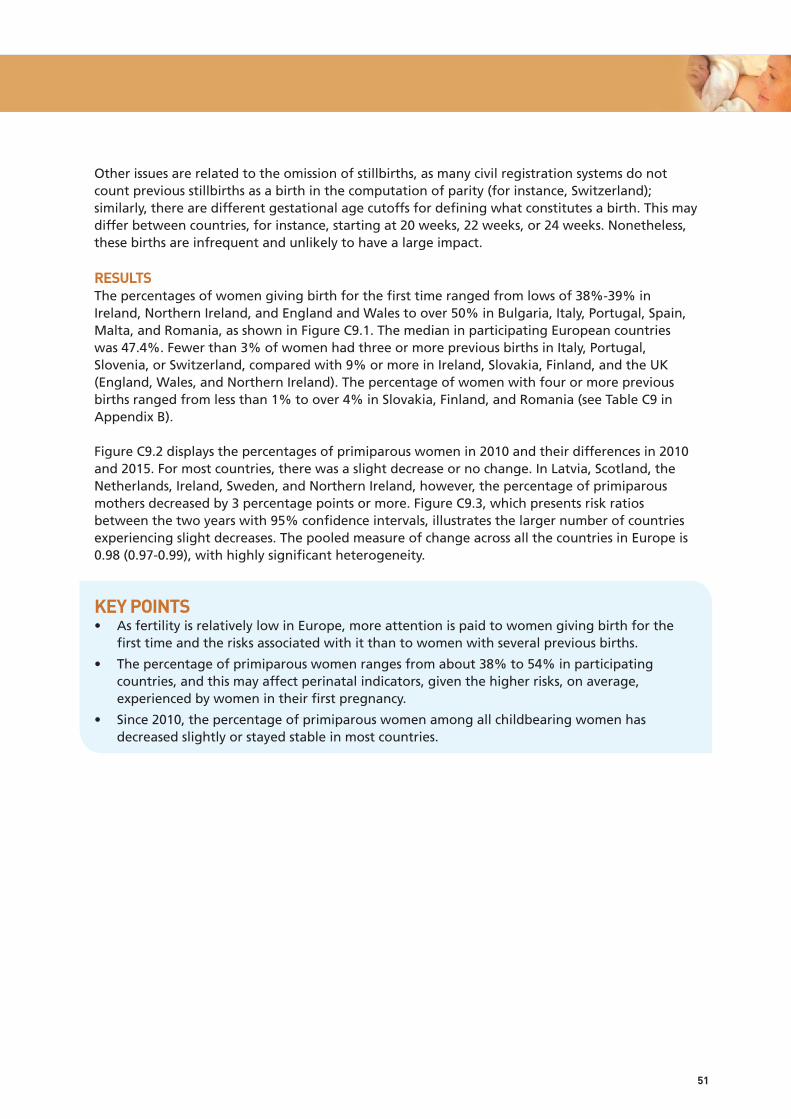
Other issues are related to the omission of stillbirths, as many civil registration systems do not countpreviousstillbirthsasabirthinthecomputationofparity(forinstance,Switzerland);similarly, there are different gestational age cutoffs for defining what constitutes a birth. This may differ between countries, for instance, starting at 20 weeks, 22 weeks, or 24 weeks. Nonetheless, these births are infrequent and unlikely to have a large impact.
RESULTSThe percentages of women giving birth for the first time ranged from lows of 38%-39% in Ireland, Northern Ireland, and England and Wales to over 50% in Bulgaria, Italy, Portugal, Spain, Malta, and Romania, as shown in Figure C9.1. The median in participating European countries was 47.4%. Fewer than 3% of women had three or more previous births in Italy, Portugal, Slovenia, or Switzerland, compared with 9% or more in Ireland, Slovakia, Finland, and the UK (England, Wales, and Northern Ireland). The percentage of women with four or more previous births ranged from less than 1% to over 4% in Slovakia, Finland, and Romania (see Table C9 in Appendix B).
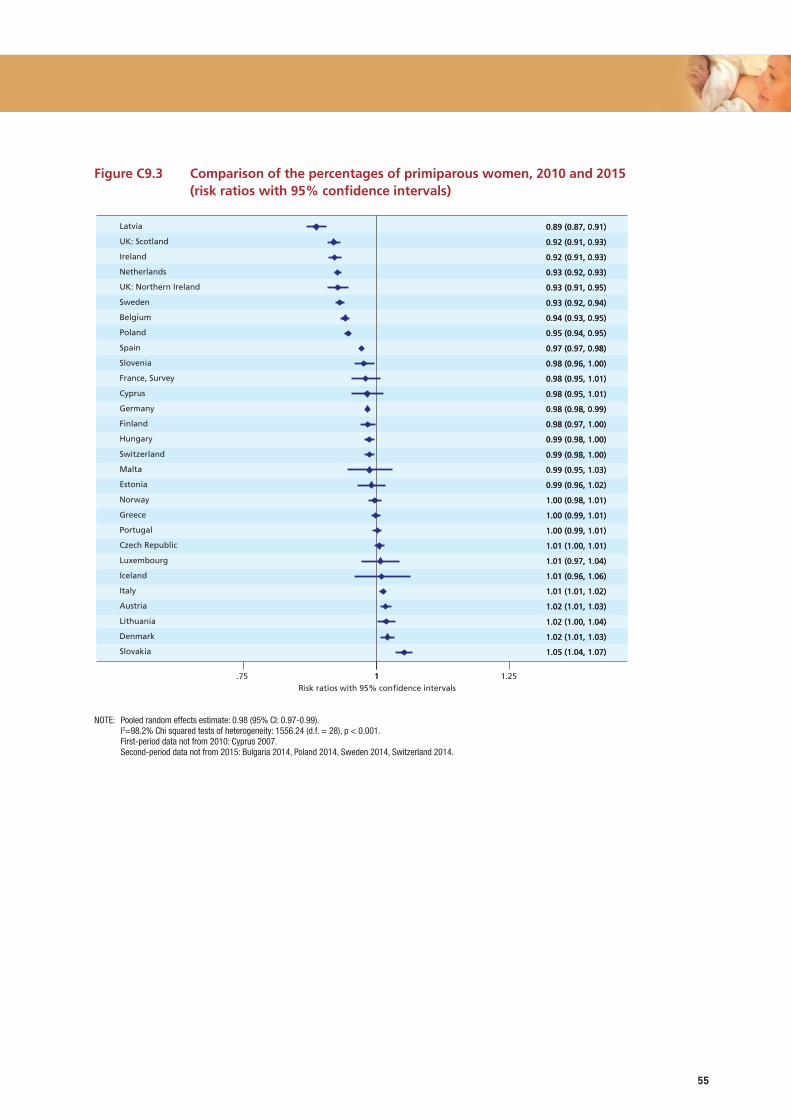
Figure C9.2 displays the percentages of primiparous women in 2010 and their differences in 2010 and 2015. For most countries, there was a slight decrease or no change. In Latvia, Scotland, the Netherlands, Ireland, Sweden, and Northern Ireland, however, the percentage of primiparous mothers decreased by 3 percentage points or more. Figure C9.3, which presents risk ratios between the two years with 95% confidence intervals, illustrates the larger number of countries experiencing slight decreases. The pooled measure of change across all the countries in Europe is 0.98 (0.97-0.99), with highly significant heterogeneity.
KEY POINTS• AsfertilityisrelativelylowinEurope,moreattentionispaidtowomengivingbirthforthe
first time and the risks associated with it than to women with several previous births.
• Thepercentageofprimiparouswomenrangesfromabout38%to54%inparticipatingcountries, and this may affect perinatal indicators, given the higher risks, on average, experienced by women in their first pregnancy.
• Since2010,thepercentageofprimiparouswomenamongallchildbearingwomenhasdecreased slightly or stayed stable in most countries.

EUROPEAN PERINATAL HEALTH REPORT
52
REFERENCES1. Bai J, Wong FW, Bauman A, et al. Parity and pregnancy outcomes. Am J Obstet Gynecol.
2002;186(2):274-8.
2. Shah PS, Knowledge Synthesis Group on Determinants of LBW/PT Births. Parity and low birth weight and preterm birth: a systematic review and meta-analyses. Acta Obstet Gynecol Scand. 2010;89(7):862-75.doi:10.3109/00016349.2010.486827.
3. Tort J, Lelong N, Prunet C, et al. Maternal and health care determinants of preconceptional use of folic acid supplementation in France: results from the 2010 National Perinatal Survey. BJOG.2013;120(13):1661-7.doi:10.1111/1471-0528.12414.
4. Feijen-de Jong EI, Jansen DE, Baarveld F, et al. Determinants of late and/or inadequate use of prenatal healthcare in high-income countries: a systematic review. Eur J Public Health. 2012;22(6):904-13.doi:10.1093/eurpub/ckr164.
5. Riaz M, Lewis S, Naughton F, et al. Predictors of smoking cessation during pregnancy: a systematic review and meta-analysis. Addiction.2018;113(4):610-22.doi:10.1111/add.14135.
6. Macfarlane AJ, Blondel B, Mohangoo AD, et al. Wide differences in mode of delivery within Europe: risk-stratified analyses of aggregated routine data from the Euro-Peristat study. BJOG. 2016;123(4):559-68.doi:10.1111/1471-0528.13284.
7. Roman H, Robillard PY, Verspyck E, et al. Obstetric and neonatal outcomes in grand multiparity. Obstet Gynecol.2004;103(6):1294-9.doi:10.1097/01.AOG.0000127426.95464.85.
8. Opara EI, Zaidi J. The interpretation and clinical application of the word ‘parity’: a survey. BJOG.2007;114(10):1295-7.doi:10.1111/j.1471-0528.2007.01435.x.
9. https://www.acog.org/-/media/Departments/Patient-Safety-and-Quality-Improvement/2014reVITALizeObstetricDataDefinitionsV10.pdf. (accessed 09/07/2018).
10. https://stats.oecd.org/glossary/detail.asp?ID=220 (accessed 09/07/2018).
Table C9.1 Differences in distribution of parity when calculated based on previous deliveries or previous births in Finland in 2015
Previous deliveries (pregnancies) Previous births (babies)
N % N %
0 22 856 41.6 22 856 41.6
1 18 885 34.3 18 746 34.1
2 7921 14.4 7839 14.3
3 2684 4.9 2627 4.8
4 or more 2661 4.8 2939 5.3
Source: National Institute for Health and Welfare, Medical Birth Register 2015. Data on previous deliveries are based on mothers’ self-report, verified from the Medical Birth Register. Data on previous births come from the Medical Birth Register 1987-2015, which takes live births and stillbirths in multiple pregnancies into account.

53
Figure C9.1 Distribution of parity in 2015
Notes: * Based on babies not mothers. ** Based on live births only. *** Can only identify primiparous vs. multiparous (numbers in parentheses: women with live births and stillbirths)
0
1-2
Percentage of women with a stillbirth or live birth
3+
0 10 20 30 40 50 60 70 80 90 100
Belgium (120-681)
Bulgaria*, 2014 (65-602)
Czech Republic (107-618)
Denmark (56-895)
Germany (714-574)
Estonia (13-731)
Ireland (64-650)
Greece* (92-159)
Spain*** (412-266)
France, Survey 2016 (13-077)
Croatia (36-866)
Italy (478-406)
Cyprus (9171)
Latvia (21-496)
Lithuania* (31-601)
Luxembourg (6762)
Hungary* (91-690)
Malta (4385)
Netherlands (166-700)
Austria (82-565)
Poland, 2014 (372-046)
Portugal (84-556)
Romania* (201-760)
Slovenia (20-003)
Slovakia (55-112)
Finland (55-080)
Sweden, 2014 (113-999)
United Kingdom
UK: England and Wales (689-751)
UK: Scotland (53-751)
UK: Northern Ireland (24-544)
Iceland (4026)
Norway (58-927)
Switzerland, 2014 (83-696)
42.5
51.2
48.3
45.5
49.0
42.3
38.2
47.8
51.5
42.5
49.0
52.7
48.4
43.1
47.4
47.6
46.7
50.7
44.6
48.8
48.1
53.5
54.5
49.0
41.7
41.6
43.1
38.8
43.2
38.4
39.8
42.7
49.5
49.3
43.6
47.0
50.2
45.6
51.6
52.6
48.8
49.7
45.3
44.4
47.5
51.2
48.2
47.3
45.8
44.3
49.5
46.4
47.5
43.7
37.8
48.0
49.1
48.7
50.9
51.6
49.3
52.5
53.9
51.6
47.5
8.2
5.2
4.6
4.3
5.4
6.1
9.2
3.4
7.9
5.7
2.9
4.1
5.7
4.3
5.1
7.5
5.0
5.8
4.8
4.4
2.8
7.8
3.0
9.3
9.7
6.0
9.6
7.5
9.1
6.4
5.7
2.9

EUROPEAN PERINATAL HEALTH REPORT
54
Figure C9.2 Differences between the percentages of primiparous mothers in 2010 and 2015
NOTE: Countries sorted by rate difference between 2010 and 2015.First-period data not from 2010: Cyprus 2007.Second-period data not from 2015: Bulgaria 2014, Poland 2014, Sweden 2014, Switzerland 2014.
48.6
47.0
48.1
41.5
46.3
41.4
50.8
44.2
53.0
50.2
43.3
49.3
49.8
42.2
50.2
51.4
47.4
42.7
42.9
47.9
53.4
48.1
47.3
39.4
52.0
48.0
46.6
44.5
39.6
-5.5
-3.8
-3.5
-3.3
-3.2
-3.0
-2.7
-1.6
-1.5
-1.2
-0.9
-0.9
-0.9
-0.7
-0.7
-0.7
-0.7
-0.4
-0.1
-0.1
0.1
0.2
0.3
0.4
0.6
0.8
0.8
0.9
2.0
2010
Difference between 2015 and 2010
Percentage of primiparous women
-10 0 10 20 30 40 50 60
Latvia
UK: Scotland
Netherlands
Ireland
Sweden
UK: Northern Ireland
Poland
Belgium
Spain
Slovenia
France, Survey
Cyprus
Germany
Finland
Switzerland
Malta
Hungary
Estonia
Norway
Greece
Portugal
Czech Republic
Luxembourg
Iceland
Italy
Austria
Lithuania
Denmark
Slovakia
55
Figure C9.3 Comparison of the percentages of primiparous women, 2010 and 2015 (risk ratios with 95% confidence intervals)
NOTE: Pooled random effects estimate: 0.98 (95% CI: 0.97-0.99). I2=98.2% Chi squared tests of heterogeneity: 1556.24 (d.f. = 28), p < 0.001. First-period data not from 2010: Cyprus 2007. Second-period data not from 2015: Bulgaria 2014, Poland 2014, Sweden 2014, Switzerland 2014.
1.75 1 1.25Risk ratios with 95% confidence intervals
Latvia
UK: Scotland
Ireland
Netherlands
UK: Northern Ireland
Sweden
Belgium
Poland
Spain
Slovenia
France, Survey
Cyprus
Germany
Finland
Hungary
Switzerland
Malta
Estonia
Norway
Greece
Portugal
Czech Republic
Luxembourg
Iceland
Italy
Austria
Lithuania
Denmark
Slovakia
0.89 (0.87, 0.91)
0.92 (0.91, 0.93)
0.92 (0.91, 0.93)
0.93 (0.92, 0.93)
0.93 (0.91, 0.95)
0.93 (0.92, 0.94)
0.94 (0.93, 0.95)
0.95 (0.94, 0.95)
0.97 (0.97, 0.98)
0.98 (0.96, 1.00)
0.98 (0.95, 1.01)
0.98 (0.95, 1.01)
0.98 (0.98, 0.99)
0.98 (0.97, 1.00)
0.99 (0.98, 1.00)
0.99 (0.98, 1.00)
0.99 (0.95, 1.03)
0.99 (0.96, 1.02)
1.00 (0.98, 1.01)
1.00 (0.99, 1.01)
1.00 (0.99, 1.01)
1.01 (1.00, 1.01)
1.01 (0.97, 1.04)
1.01 (0.96, 1.06)
1.01 (1.01, 1.02)
1.02 (1.01, 1.03)
1.02 (1.00, 1.04)
1.02 (1.01, 1.03)
1.05 (1.04, 1.07)

EUROPEAN PERINATAL HEALTH REPORT
56
R8 SMOKING DURING PREGNANCY
JUSTIFICATIONMaternal smoking is one of the most important preventable factors associated with adverse pregnancy outcome. Maternal smoking during pregnancy impairs normal fetal growth and development and is associated with low birth weight, fetal growth restriction, stillbirth, preterm birth, and some congenital anomalies.1-3 Moreover, its influence on outcomes is not limited only totheperinatalperiod;increasingevidencesuggestsitalsohaslifelongconsequencesforthechild, with elevated risks of childhood obesity, neurobehavioural and cognitive deficits, and impaired lung function, including wheezing and asthma.4-7
Smoking among pregnant women has declined in high-income countries, but it nonetheless continues to account for a substantial proportion of fetal and infant morbidity and mortality. Smoking before pregnancy and the likelihood of stopping smoking are associated with lower maternal educational level and poverty. Smoking thus contributes to the creation of social inequalities in perinatal health.8,9
Public health interventions exist to reduce smoking and to tackle social inequalities in tobacco use.10 A preventive population approach is important to reduce the prevalence of smoking before pregnancy in the childbearing population. Furthermore, smoking cessation interventions have been shown to be effective in improving pregnancy outcomes11 and can serve as an indicator of the quality of antenatal preventive healthcare services.
DEFINITION AND PRESENTATION OF INDICATORSmoking during pregnancy is defined as the proportion of women who smoked during pregnancy among those with live born or stillborn babies. When possible, data were collected for two time periods: an earlier (ideally, first trimester) and a later (ideally, third trimester) phase.
DATA SOURCES AND AVAILABILITY OF INDICATOR IN EUROPEAN COUNTRIESThe data were provided by 20 of 31 countries. Some countries, including France and the Netherlands, provided data based on routine surveys. It is striking, however, that this important indicator of perinatal health as well as of the effectiveness of preventive public health policies is not available in many countries.
METHODOLOGICAL ISSUES IN THE CALCULATION, REPORTING, AND INTERPRETATION OF THE INDICATORTo be able to compare countries or regions or to evaluate time trends, a common time frame is essential. This is important because many women stop smoking during pregnancy. If a single measure is the most practical option, it should relate to the last trimester of pregnancy so that the length and timing of exposure can be taken into account. Many data sources include information on smoking in pregnancy, but without further clarification.
Differences in the type of data (antenatal care records, medical records in maternity units, and birth surveys including interviews with mothers before and after birth), as well as the questions asked are additional sources of potential bias. Accordingly, the quality of the information is variable. Some data sources may record a woman as a non-smoker if smoking is not recorded in medical records. The rate of missing data ranges from 0% (the Czech Republic, Latvia, Lithuania, Malta, and Slovenia) to 17% in Croatia, 19% in England, 25% in Austria, and 29% in Germany.
57
Finally, there is evidence that some women may under-report smoking, as they know that they should not be smoking during pregnancy. Misclassification and inaccurate estimates of smoking may thus result. Many of the data providers expressed reservations about the quality of these data because they were based on self-report, and missing data were not well recorded. Euro-Peristat does not collect information on amount smoked, so these data cover both women who smoked daily and those who smoked occasionally.
RESULTSTable R8.1 presents information on the time periods covered by the data and the proportions of smokers during both periods. Eight countries provided information during pregnancy without clearly specifying the time period, 11 countries provided data for two periods (either before and during pregnancy or during the first and the second or third trimesters), 2 countries provided information on smoking prevalence early in pregnancy only. The prevalence of smoking in the second period (during pregnancy or in the last trimester) was between 5 and 8% in most countries providing data, but Norway, Sweden, and Lithuania reported prevalence rates below 5%, while more than 10% of pregnant women smoked in Valencia (18.3%), France (16.3%), Catalonia (13.0%), Austria (12.5%), the UK (between 12 and 17%), and Luxembourg (10.7%). When prevalence was available for two periods, the percentage of smokers was always lower closer to delivery.
Overall, in countries that provided data for 2010 and 2015, there were lower proportions of smokers during pregnancy in 2015, but in a few countries, prevalence was stable or rose slightly. Reductions of more than two percentage points were observed in Denmark, Estonia, Germany, Cyprus, Latvia, Luxembourg, Finland, and Norway. In Scotland, the data in 2015 relate to smoking at booking, whereas in 2010, the period was an unspecified moment during pregnancy. The pooled measure of change between 2010 and 2015 for all countries reflects the predominance of countries reporting decreases in smoking: 0.87 (95% confidence intervals: 0.79-0.95), but heterogeneity was highly significant.
KEY POINTS• Notallcountriescouldprovidedataonmaternalsmokingduringpregnancy,andstandardised
collection procedures are necessary to improve comparability for those countries that did.
• InsomeEuropeancountries,morethan10%ofwomensmokeduringtheirpregnancy.
• Declinesinmaternalsmokingduringpregnancywereobservedwhenrecentdatawerecomparedwith2010,althoughthereweredifferencesinthemagnitudeofthedecrease;policies should be reviewed in countries where smoking prevalence is high with only slight decreases.
• Giventheadverseeffectsofsmokingonfetalandinfanthealthandsincepregnancycareis considered an ideal setting for intervention, obtaining high quality and comparable information on smoking before and during pregnancy should be a priority.

EUROPEAN PERINATAL HEALTH REPORT
58
REFERENCES1. Marufu TC, Ahankari A, Coleman T, et al. Maternal smoking and the risk of still birth:
systematic review and meta-analysis. BMC Public Health.2015;15:239.doi:10.1186/s12889-015-1552-5.
2. Hackshaw A, Rodeck C, Boniface S. Maternal smoking in pregnancy and birth defects: a systematic review based on 173 687 malformed cases and 11.7 million controls. Hum Reprod Update.2011;17(5):589-604.doi:10.1093/humupd/dmr022.
3. Savitz DA, Murnane P. Behavioral influences on preterm birth: a review. Epidemiology. 2010;21(3):291-9.doi:10.1097/EDE.0b013e3181d3ca6300001648-201005000-00004[pii][publishedOnlineFirst:2010/04/14].
4. Albers L, von Kries R, Sobotzki C, et al. Differences in maternal smoking across successive pregnancies - dose-dependent relation to BMI z-score in the offspring: an individual patient data (IPD) meta-analysis. Obes Rev. 2018 doi: 10.1111/obr.12698.
5. Clifford A, Lang L, Chen R. Effects of maternal cigarette smoking during pregnancy on cognitive parameters of children and young adults: a literature review. Neurotoxicol Teratol. 2012;34(6):560-70.doi:10.1016/j.ntt.2012.09.004.
6. McEvoy CT, Spindel ER. Pulmonary Effects of Maternal Smoking on the Fetus and Child: Effects on Lung Development, Respiratory Morbidities, and Life Long Lung Health. Paediatr Respir Rev. 2017;21:27-33.doi:10.1016/j.prrv.2016.08.005.
7. Huang L, Wang Y, Zhang L, et al. Maternal Smoking and Attention-Deficit/Hyperactivity Disorder in Offspring: A Meta-analysis. Pediatrics.2018;141(1)doi:10.1542/peds.2017-2465.
8. Schneider S, Schutz J. Who smokes during pregnancy? A systematic literature review of population-based surveys conducted in developed countries between 1997 and 2006. Eur J Contracept Reprod Health Care.2008;13(2):138-47.doi:10.1080/13625180802027993.
9. Riaz M, Lewis S, Naughton F, et al. Predictors of smoking cessation during pregnancy: a systematic review and meta-analysis. Addiction.2018;113(4):610-22.doi:10.1111/add.14135.
10. Hu Y, van Lenthe FJ, Platt S, et al. The Impact of Tobacco Control Policies on Smoking Among Socioeconomic Groups in Nine European Countries, 1990-2007. Nicotine Tob Res. 2017;19(12):1441-49.doi:10.1093/ntr/ntw210.
11. Chamberlain C, O’Mara-Eves A, Oliver S, et al. Psychosocial interventions for supporting women to stop smoking in pregnancy. Cochrane Database Syst Rev. 2013(10):CD001055. doi: 10.1002/14651858.CD001055.pub4.

59
Table R8.1 Percentages of women who smoked during pregnancy in 2010 and comparisons with 2015
NOTE: *N/A available in 2010, but no longer available in 2015. ** Data for England, Wales and Northern Ireland in 2010 came from the Infant Feeding Survey. This was not done in 2015, so the data source in all three countries has
changed. Second-period data not from 2015: Spain Valencia 2016, France Survey 2016, Croatia 2016, Italy 2013, UK England 2015-2016, UK Wales 2016, Sweden 2014.
Time period Smokers in 2015 Smokers in 2010 Time period
Country/coverage
Period 1 Period 2 Period 1%
Period 2%
Latest period%
Latest period
Belgium
Bulgaria
Czech Republic During pregnancy 7.2 6.2 during
Denmark 1st trimester 2nd trimester 11.0 7.5 12.8 during
Germany During pregnancy 9.0 10.7 during
Estonia 1st trimester During pregnancy 7.6 6.1 7.8 during
Ireland
Greece
Spain: Catalonia Before pregnancy 3rd trimester 22.8 13.0 14.4 3rd trimester
Spain: Valencia End of pregnancy 18.3 15.8 1st trimester
France Before pregnancy 3rd trimester 29.8 16.3 17.1 3rd trimester
Croatia During pregnancy 8.1
Italy Before pregnancy During pregnancy 20.5 5.3
Cyprus During pregnancy 6.3 11.5 1st trimester
Latvia During pregnancy 7.9 10.4 during
Lithuania Before pregnancy During pregnancy 8.0 4.4 4.5 during
Luxembourg 1st trimester 3rd trimester 13.3 10.7 12.5 3rd trimester
Hungary
Malta At booking 7.7 8.2 1st trimester
Netherlands During pregnancy 8.6 8.1 after 1st trimester
Austria 3rd trimester 12.5
Poland N/A* 12.3 3rd trimester
Portugal
Romania
Slovenia During pregnancy 9.5 11.0 during
Slovakia
Finland 1st trimester After 1st trimester 14.7 7.5 10.0 after 1st trimester
Sweden 1st trimester 3rd trimester 5.1 3.8 4.9 3rd trimester
United Kingdom N/A 12.0 during
UK: England * At booking Delivery 14.2 12.3 12.0 during
UK: Wales* 3rd trimester 17.3 16.0 during
UK: Scotland At booking 16.4 19.0 during
UK: Northern Ireland*
During pregnancy 14.3 15.0 during
Iceland
Norway First visit End of pregnancy 5.5 3.6 7.4 3rd trimester
Switzerland

2010
2015
Percentage of women delivering a live birth or a stillbirth
Czech Republic
Denmark
Germany
Estonia
Spain: Catalonia
Spain: Valencia
France
Latvia
Lithuania
Luxembourg
Malta*
Netherlands
Slovenia
Finland
Sweden
UK: England
UK: Wales
UK: Northern Ireland
Norway
0.0 2.0 4.0 6.0 8.0 10.0 12.0 14.0 16.0 18.0 20.0
6.2
12.8
10.7
7.8
14.4
15.8
17.1
10.4
4.5
12.5
8.2
8.1
11.0
10.0
4.9
12.0
16.0
15.0
7.4
7.2
7.5
9.0
6.1
13
18.3
16.3
7.9
4.4
10.7
7.7
8.6
9.5
7.5
3.8
12.3
17.3
14.3
3.6
Figure R8.1 Smoking during pregnancy in 2010 and and 2015
NOTE: * First trimester or at booking in 2010 and during pregnancy in 2015. ** At booking in 2015, during pregnancy in 2010. Second-period data not from 2015: Spain Valencia 2016, France Survey 2016, UK England 2015-2016, UK Wales 2016, Sweden 2014.
EUROPEAN PERINATAL HEALTH REPORT
60

61
Figure R8.2 Comparison of smoking during pregnancy, 2010 and 2015 (risk ratios and 95% confidence intervals)
NOTE: Cyprus and Scotland not included because smoking was not recorded at the same period in both years. Pooled random effects estimate: 0.87 (95% CI: 0.80-0.95). I²=99.0% Chi squared tests of heterogeneity: 1856.56 (d.f. = 18), p<0.001. Second-period data not from 2015: Spain Valencia 2016, France Survey 2016, UK: England 2015-2016, UK Wales 2016, Sweden 2014.
1.25 .5 1 1.5Risk ratios with 95% confidence intervals
Norway
Denmark
Germany
Finland
Latvia
Sweden
Estonia
Luxembourg
Slovenia
ES: Catalonia
Malta
UK: Northern Ireland
France, Survey
Netherlands
Lithuania
UK: England
UK: Wales
ES: Valencia
Czech Republic
0.48 (0.45, 0.51)
0.58 (0.56, 0.60)
0.69 (0.68, 0.69)
0.75 (0.72, 0.78)
0.76 (0.71, 0.81)
0.76 (0.73, 0.79)
0.79 (0.72, 0.86)
0.86 (0.78, 0.94)
0.86 (0.82, 0.91)
0.90 (0.88, 0.93)
0.93 (0.80, 1.08)
0.95 (0.87, 1.05)
0.96 (0.91, 1.01)
0.97 (0.90, 1.05)
1.02 (0.96, 1.09)
1.05 (0.84, 1.33)
1.08 (0.99, 1.19)
1.16 (1.08, 1.25)
1.16 (1.13, 1.20)

EUROPEAN PERINATAL HEALTH REPORT
62
R12 DISTRIBUTION OF MATERNAL PREPREGNANCY BODY MASS INDEX
JUSTIFICATIONPromoting a healthy weight before pregnancy is one way to improve maternal and newborn health. Compared to women with normal weight before pregnancy, those who are overweight or obese, as well as those who are underweight, are at higher risk of adverse pregnancy outcomes.
The rising prevalence of overweight and obesity worldwide has important implications for pregnancy and childbirth. Prepregnancy overweight and obesity both increase the risks of pregnancy complications, such as gestational diabetes and preeclampsia. Perinatal and infant outcomes are less favourable, including higher rates of congenital anomalies, in particular, neural tube and congenital heart anomalies, stillbirth, fetal growth restriction, early preterm birth before 32 weeks of gestation, and macrosomia.1-4 These risks explain in part why overweight and obese women are more likely to deliver by caesarean, but less effective uterine contractions also play a role.5,6 Overweight and obesity affect maternal outcomes, and these women have higher rates of severe maternal morbidity and maternal death.2 All these risks increase with the level of obesity. Research also suggests that obesity may affect the longer-term health of the child through fetal programming in utero, changes in the newborn’s body composition, epigenetic processes, and changes in the gut microbiome.7 Potential longer term health and developmental consequences include childhood and adult obesity, the metabolic illnesses associated with obesity, asthma, and neurodevelopmental delay.4,7
While much of the current focus of public health policy and practice is on overweight and obesity, being underweight also increases the risks of having a preterm or a low birthweight baby.8 Both underweight and overweight are associated with lower socioeconomic status and thus create inequalities in health starting at birth.9
DEFINITION AND PRESENTATION OF INDICATORThis indicator is defined as the percentage of women delivering live births or stillbirths by their prepregnancy body mass index (BMI) defined in accordance with WHO guidelines as follows: <18.5 (underweight), 18.5-24.9 (normal), ≥25.0 (overweight and obese).10 Obese women can be subdivided as obese class I (BMI 30.0-34.9), obese class II (BMI 35.0-39.9), and obese class III (BMI ≥40.0).
DATA SOURCES AND AVAILABILITY OF INDICATOR IN EUROPEAN COUNTRIESThis indicator has limited availability in routine sources in Europe. It was provided by 12 of 31 countries. Poland was able to provide this indicator in 2010, but not in 2015.
METHODOLOGICAL ISSUES IN THE CALCULATION, REPORTING, AND INTERPRETATION OF THE INDICATORIn most countries for which data are available, prepregnancy BMI is recorded at the first antenatal visit, which may slightly overestimate the mother’s BMI before pregnancy. Weights recalled by women themselves, as for instance in France, tend to be slightly under-reported.11 Some countries had high proportions of missing data for this indicator, with ranges from 0 to 20% or more (Malta, England, and Norway). In general, BMI was missing for around 10% of women.

63
RESULTS Figure R12.1 shows that women with a low prepregnancy BMI accounted for 2.4 to 7.4% of mothers giving birth in countries for which data were available, with highs in France (7.4%) and Austria (6.4%) and lows in the UK, Malta, and Sweden (<3.0%). The proportion of overweight or obese women ranged from around 30% to 50% of all women, with prevalence less than 30% in Croatia, Austria and Slovenia and around 50% in the UK. Between 8 and 26% of all women were obese.
In comparison with the 2010 data in the last Euro-Peristat report, the proportions of obese women in 2015 increased slightly in most countries that provided data at both time points, as shown in Figure R12.2. The exceptions are Denmark, where the prevalence was stable, and Norway, where it decreased slightly. In interpreting data from Norway, it should be noted that BMI was recently added and proportions of missing data were high in both 2010 and 2015. Figure R12.3 shows risk ratios with 95% confidence intervals for the change in the prevalence of obesity among pregnant women between 2010 and 2015. The pooled risk ratio was positive and significant – 1.15 (95% confidence intervals: 1.08-1.22) with significant heterogeneity across countries.
KEY POINTS• Maternalweightbeforeandduringpregnancyaffectsthecourseofpregnancy,itsoutcome,
and the offspring’s lifelong health.
• Despiteitsimportancefordescribingtherisksfacingchildbearingwomen,thisindicatorisnotavailable in most European countries.
• ThereisahighvariationinthedistributionofprepregnancyBMI,butinmostcountriesreporting data, more than 10% of women were obese at the onset of pregnancy
• Addinginformationaboutwomen’sprepregnancyBMItoroutinesurveillancesystemsformaternal and newborn health should be a priority in countries where these data are not available.

EUROPEAN PERINATAL HEALTH REPORT
64
REFERENCES1. Stothard KJ, Tennant PW, Bell R, et al. Maternal overweight and obesity and the risk of
congenital anomalies: a systematic review and meta-analysis. JAMA.2009;301(6):636-50.doi:10.1001/jama.2009.113.
2. Lim CC, Mahmood T. Obesity in pregnancy. Best Pract Res Clin Obstet Gynaecol. 2015;29(3):309-19.doi:10.1016/j.bpobgyn.2014.10.008.
3. Santangeli L, Sattar N, Huda SS. Impact of maternal obesity on perinatal and childhood outcomes. Best Pract Res Clin Obstet Gynaecol.2015;29(3):438-48.doi:10.1016/j.bpobgyn.2014.10.009.
4. Hemond J, Robbins RB, Young PC. The Effects of Maternal Obesity on Neonates, Infants, Children, Adolescents, and Adults. Clin Obstet Gynecol.2016;59(1):216-27.doi:10.1097/GRF.0000000000000179.
5. Chu SY, Kim SY, Schmid CH, et al. Maternal obesity and risk of cesarean delivery: a meta-analysis. Obes Rev.2007;8(5):385-94.doi:10.1111/j.1467-789X.2007.00397.x.
6. Poobalan AS, Aucott LS, Gurung T, et al. Obesity as an independent risk factor for elective and emergency caesarean delivery in nulliparous women--systematic review and meta-analysis of cohort studies. Obes Rev. 2009;10(1):28-35.doi:10.1111/j.1467-789X.2008.00537.x.
7. Godfrey KM, Reynolds RM, Prescott SL, et al. Influence of maternal obesity on the long-term health of offspring. Lancet Diabetes Endocrinol. 2017;5(1):53-64.doi:10.1016/S2213-8587(16)30107-3.
8. Han Z, Mulla S, Beyene J, et al. Maternal underweight and the risk of preterm birth and low birth weight: a systematic review and meta-analyses. Int J Epidemiol.2011;40(1):65-101.doi:10.1093/ije/dyq195.
9. Boudet-Berquier J, Salanave B, Desenclos JC, et al. Sociodemographic factors and pregnancy outcomes associated with prepregnancy obesity: effect modification of parity in the nationwide Epifane birth-cohort. BMC Pregnancy Childbirth.2017;17(1):273.doi:10.1186/s12884-017-1456-8.
10. World Health Organization. Obesity: preventing and managing the global epidemic. Geneva: World Health Organization, 2000.
11. Headen I, Cohen AK, Mujahid M, et al. The accuracy of self-reported pregnancy-related weight: a systematic review. Obes Rev. 2017;18(3):350-69.doi:10.1111/obr.12486.

<18.5
18.5-24.9
Percentage of women delivering live births or stillbirths
25.0-29.9
0 10 20 30 40 50 60 70 80 90 100
Belgium (112-745)
Bulgaria
Czech Republic
Denmark (56-308)
Germany (669-397)
Estonia
Ireland
Greece
Spain
France, Survey 2016 (11-588)
Croatia (35-102)
Italy
Cyprus
Latvia
Lithuania
Luxembourg
Hungary
Malta (3,475)
Netherlands
Austria (79-100)
Poland
Portugal
Romania
Slovenia (19-983)
Slovakia
Finland (54-577)
Sweden, 2014 (108-218)
United Kingdom
UK: England, 2015-16 (461-266)
UK: Wales, 2016 (24-040)
UK: Scotland (52-387)
UK: Northern Ireland (23-871)
Iceland
Norway (43-683)
Switzerland
30.0
5.4
4.6
3.9
7.4
5.5
2.8
6.4
4.7
3.5
2.6
2.9
2.4
2.9
1.9
4.2
59.1
62.0
58.1
60.8
67.6
59.7
64.5
66.1
61.2
57.8
47.5
43.6
46.5
47.9
62.4
22.8
20.8
23.1
20.0
19.0
23.8
19.0
19.6
22.1
25.9
28.4
28.4
27.9
29.8
21.6 11.6
12.7
12.6
14.9
11.8
7.8
13.7
10.0
9.6
13.2
13.7
21.2
25.6
22.7
20.4
11.6
65
Figure R12.1 Distribution of maternal prepregnancy body mass index
65

EUROPEAN PERINATAL HEALTH REPORT
66
Figure R12.2 Percentages of women with a prepregnancy body mass index ≥ 30 in 2010 and 2015
NOTE: Second-period data not from 2015: France Survey 2016.
Figure R12.3 Comparison of the percentages of women with a prepregnancy body mass index ≥ 30, 2010 and 2015 (risk ratios and 95% confidence intervals)
NOTE: Pooled random effects estimate: 1.15 (95% CI: 1.08-1.22). I2=97.7% Chi squared tests of heterogeneity: 352.50 (d.f. = 8), p <0.001. Second-period data not from 2015: France Survey 2016.
2010
2015
Percentage of women delivering a live birth or a stillbirth
Denmark
Germany
France
Malta
Slovenia
Finland
Sweden
UK: Scotland
Norway
0 5 10 15 20 25
12.6
13.5
9.9
12.7
9.0
12.1
12.6
20.7
12.3
12.6
14.9
11.8
13.7
9.6
13.2
13.7
22.7
11.6
1.5 1 1.5 2Risk ratios with 95% confidence intervals
Norway
Denmark
Slovenia
Germany
Finland
Sweden
France, Survey
UK: Scotland
Malta
0.95 (0.91, 0.99)
1.08 (1.01, 1.14)
1.08 (1.07, 1.09)
1.12 (1.08, 1.15)
1.16 (1.14, 1.19)
1.29 (1.20, 1.38)
1.32 (1.29, 1.35)
1.55 (1.36, 1.76)
1.00 (0.97, 1.03)