Embed Size (px)
Citation preview
--ED 111 682
ApTHORTITLE
'INSTITUTION
REPORT NOPUB DATENOTE
-DOCUMEiT'RESUME'
4 'SE 019 689
. Scopino, John A.; And Others -.
Characteristics of DOctoral Scientists and Engineesin the UnitedStates, 1973. -
.
National Science Foundation, Washington, D.C. Div. of-Science Resources Studies.. NSF -'75 -312
Hay 75 -
64g; Small type used in appendices.' For a relate.
AVAILABLE FROM'
.
EDRS 'PRICEDESCRIPTORS
IDENtIUERS-
-ABSTRA.CT
document,- see SE 01.9 708Superintendent of Documents, U.S. Government Printing'Office, Washington, 0402 (Stock Ng.038-000-00229-5, $1.15)
MF-$0.76 ..HC-$3.32 Plus Postage*Doctoral Degrees; Employment Statistics; *Engineers;National Surveys( *Occupational Survey; Professional'Occupations; Science Education; *Scientists;*SurveyiNational Science Foundation; NSF
.This .publication presents data on the supply,utilizat ion, and characteristics of U.S.' doctoral scientists and ,
engineers. The population surveyed consisted,of individuals in theUnited Statei who held science or engineering doctorates, or who had-received doctorates in nonscience and monengineering areas but wereemployed in science or engineering positions. Included in thepopulation were individuals vho received their, doctorates between
'January 1, 1980 and June 30, 1972, inclusive. Subsequent surveyS inthis biennial beries will take account of new entrants into this
- segment of the nation's scientific and engineering manpowerresources. The data on doctoral. scientists and engineers in this'report are .presented in three patts: charts providing a broadperspective; tables- presenting more specific, although selective,information:- and appendices containing the questionnaire andspecialties list used in the survey, plus notes on the surveymethodology, coverage, concepts, and definitions used in the survey.(Author/MLH)
4
k7
.4************************************************************************ ' Document acquired by ERIC include many informal unpublished* materials not available frbm other sources. ERIC makes every effort ** to obtain the best copy available. nevertheless, items of marginal ** reproducibiliiy are often encountered and this affects the quality ** of the microfiche and hardcopy reproductions ERIC makes available ** via'the ERIC Document Reproduc-fton Service (EDRS). EDRS is not* responsible for theyquality of the original document. Reproductions ** supplied by EDRS are the be'st that can be made from the`original., ************************************************************************
ti
SCOPE OF INTEREST NOTICE' The ERIC Pao Rey has ats.gned
ttite document for processingto.
In out judgement, th.tdocumentnen of tutored to MR dsonng-houses noted-to the Nett. Index-ing shouid reflect Mow specialpeottt of view.
---
EDUCATION INVELCAIIE- NATIONAL INSTITUTE OF
EDUCATIONTHIS DOCUMENT HAS SEEN REPRODUCE° EXACTLY AS RECEIVED PROMTHE PERSON OR ORGANaiAT.Ote OR;q4N*TING IT POINTS OF VIEW OR OPINIONSST.TED DO NOT NECESSARILY REPRESENT OFFICIAL NATIONAL INSTITUTE OPEDUCATION POS1T1ON OR POLICY
1 ik.
AIL
4 S
. .. .S .0
%
%5
S
14
t
S
k
-;\
a
,
J
Related Publications
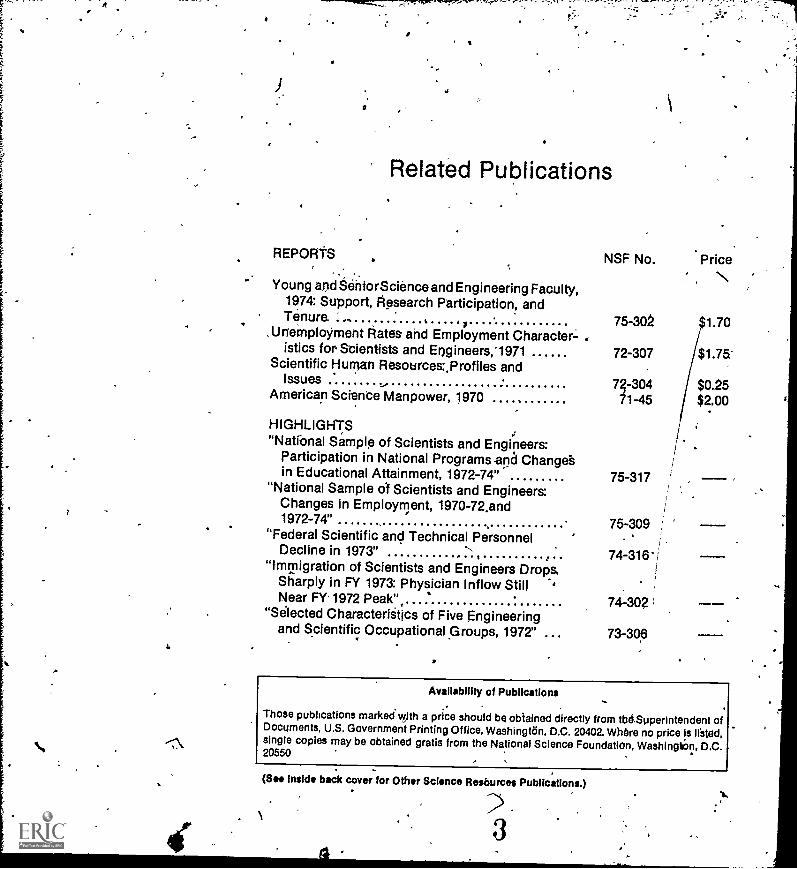
REPORTS NSF No. Price
Young and aeniorScience and Engineering Faculty,1974: Support, Research Participation, andTenure. ., ti 75-302 1.70
U nem p I oymeht Rates and Employment Character- .istics for Scientists and Engineers,'1971 72-307 $1.75
Scientific Human Resources:,Profiles andIssues - 74 -304 $0.25
American Science Manpower, 1970 71-45 $2,00
HIGHLIGHTS"National Sample of Scientists and Engineers:
Participation in National Programs aria Change'sin Educational Attainment, 1972-74" 75-317
"National Sample of Scientists and Engineers:Changes in Employment, 1970- 72.and1972-74" 75-309
"Federal Scientific and Technical PersonnelDecline in 1973" , ~ , 74-316'
"Immigration of Scientists and Engineers Drops,Sharply in FY 1973: Physician Inflow Still "'Near FY.1972 Peak", 74302
"Selected CharacteriStics of Five Engineeringand Scientific Occupational Groups, 1977' 73-306
Availability of Publications
Those publications marked with a price should be obtained directly from tbdSuperintendent ofDocuments, U.S. Government Printing Office, Washington, D.C. 20402. Where no price is Irsted,single copies may be obtained gratis from the National Science Foundation, WashingliOn, D.C.20550
(See inside back cover for Other Science Resources Publications.)
For sale by the Superintendent of Documents, U.S. Government Printing OfficeWashington, D.C. 20402 - Pries $1.15
.
Stock \Number 038-000-6229-5
ii
i.5
iii
FQREWORR
This report is a reference ocument providing data on the characteristicsof°245,000 doctoral scientists nd engineers in the United States. The reportwas produced from data gener ted by the National Science Foundation's Man-power Chatiacteristics System hich was established to provide manpoWerdata essential to those engage in science and engineering policy matters. Acharacteristic feature of the Sy tem is that information is collected froiri in-dividual scientists' and engineers rather than from other sources; e.g.,employers, professional societies, etc. Consequently, many characteristicsunknown to'emplOyets can be identified.
The basis of this report is the 1973 sun/ay, the first in a biennial series, ofthe Doctoral Roster of Scientists and Engineers, conducted for the NatignalScience Foundation and the National Institutes of Health, ,Dy the National,Acadernyof Sciences' Commission on Human Resources. Surxieya of the Doc-toral Roster provide the data collection mechanism for one element of theMan-power Characteristics System which also inclu t ational Sample of .Scientists and Engineers and surveys of Ne nts to Science andEngineering. '
This report was prepared in the Founeltion's `BiTiiion of ScienceResources Studies. General supervision was provided by RObert W, Cain,Head, Sponsored Surveys and Studies Section. .
May 1975
Charles 8.'FalkDirectorDivision of Science Resources
Studies
iv
:4
acknowledgments
'
'....
J. James Brown, Study Director, Manpower Characteristics System,provided' the planning and direction for; System activities. The..report wasprepared by JohnA. Scopino with the assistance of Gayle F. Barker; and Nancy
, M. Conlon. ' .. . ..
With support fro he National SciAce Foundationand the ,Natibnal In-stitutesof Health, members of the Commission on Human Resources staff con- _ducted the 1973 survey and maintained the roster of Podtoral Scientists andEngineers, under the direction of William C. Kelly. The Commision staff in-clucled .r.ewis C. Solmon, Porter E. Coggeshall, Lrndsey. Harmon; Doris E.
. .flagowski, and Herbert Soldz.. . . ,
The doctorate-holding scientists and engineers who to the sur-vey_ deserve our warmestthanks since it was their effort which made thiS report .
possible. . . ,
,
ti
V
1J
,CONTENTS
INTRODUCTION
PART I. GRAPHIC HIGHLIGHTS- General Characteristics'
Employment CharacteristicsSalaries
PART II. MAJOR'CHARACTERISTICS ,
Page
vi
1
1
31 3
6Total Doctoral Scientists and,Engineers . ^ 7Total Employment and Salaries
*4 9Employed in business and industry 11Employed in educational institutions ' 12Teabhing in universities 4
or colleges 13Employed iri nonprofit organizations 14Employed in the Federal Government 15Receiving Federal support ' 16
Women . 17
APPENDIXES:A. Technical Notes 19B. Detailed Statistical Tables' 27C. Reproduction of the 1973 Questionnaire and Specialties List 30
' See note on p. 18.
,
0
11.
INTRODUCTION
This pu blication presents .data on the supply, utilization, andcharacteristics of the Nation's doctoral scientists and engineers. The popula-tion surveyed consisted of individuals in the United States who held science orengineering doctorates or who had received doctorates in nonscience andnonengineering areas but were employed in'science or engineering positions.InclUded In the population were individuals who received their doctoratesbetween January 1, 19.30 and June 30, 1972, inclusive. Subsequent surveys inthis biennial series will take account of new entrants into this important seg-ment of the Nation's scientific and engineering manpower resources,
The data on doctoral scientists and engineers in this report are presentedin three parts: The charts in part I .provide a broad perspective; more specific,although selective, information is presented in the tables in part II; and detailedtabulations appear in a separate volume.' The technical notes in appendix Acontain information on the survey, methodology, coverage, concepts, anddefinitions. The questionnaire and specialties list used in the survey arereproduced in appendix C.
VI .
' National Science Foundation, Detailed Statistical Tables, Characterlitics of Doctoral Scien-tists and Engineers in the United States, 1973 (NSF 75-312-A) (Washington, D.C. 20550), 1974.These may be obtained gratis on request to NSF.
9
4
N
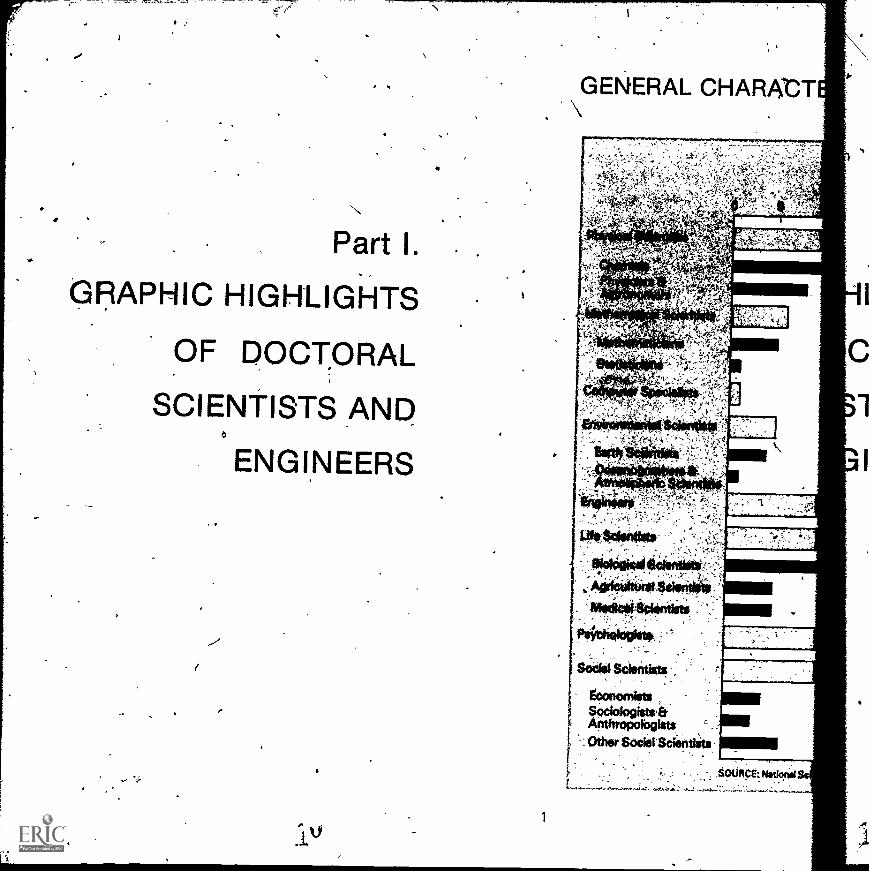
Part I.
GRAPHIC HIGHLIGHTS
OF DOCTORAL
SCIENTISTS AND
ENGINEERS
1
GENERAL CHARAtT
scoseiscientisti
tame:WetsSecieiogists:Et'Athrepelegiets,
:Other SecietSciehtlets.
.
.sputtc,EfNocinpol
"!.
Part I.
LIGHTSN
CTORAL
TS AND
INEERS
r
..,
o
1
(
GENERAL CHARACTERLSTICS
SOURCE: *dor* Wm* remrs,bn....._......t....
. 11
..
,
.
.
0 % 2
.....,aim
!,
EMPLOYMENT CHARACTERISTICSy,
....,..-4...0`
I...,3
::.
1..Median Annual SalaneFull-time Employed Civilians
..0 g
a
a
4
111111111111111111111i1 1 1
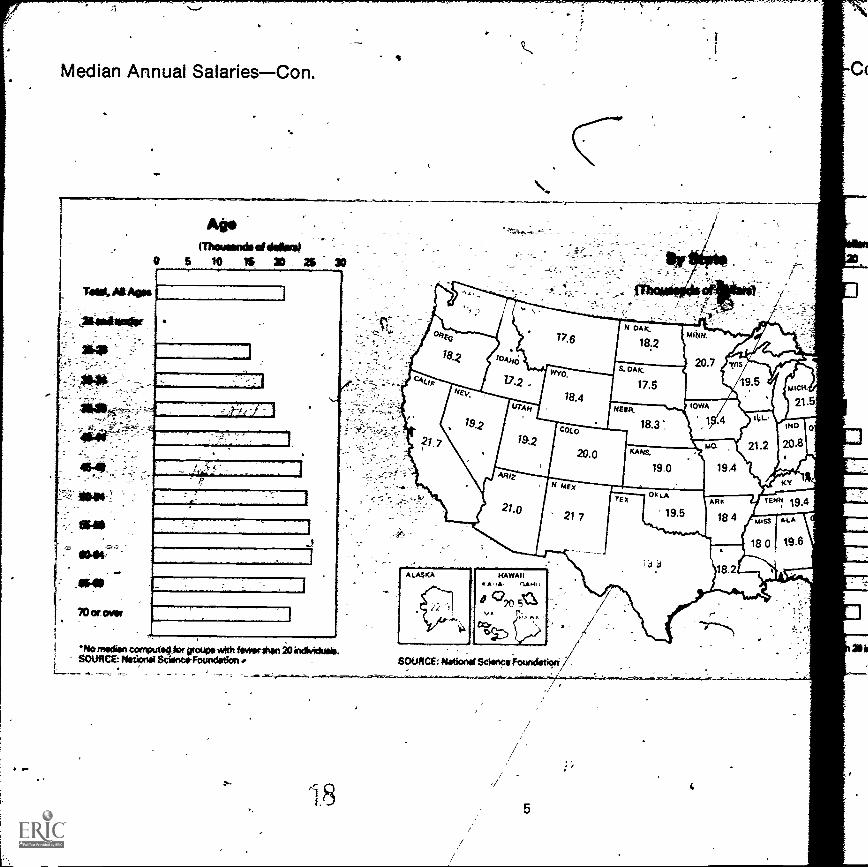
Median An`nual Salaries'- -Con.
Primary Work Activity(Thousands of dollen,
10 15 \4
Total
Research & Development
Basid Research
AppUedfeseerch
Development
14inagemeMorAckninistration
OfR&D-
pther than R&D
-Oftoth'
-Consulting
Sales1PrOfesilonatServices'
ittiptOrt,
-J
SOURCE: Nation:4S iegic,fbuntiatipr.
164
Physical
Chemists
Physicistsft Astrono_
Mathematical Scientis
MethertriCians
Statisticians
Computer Specialists
Enviroriinental Scientists
Earth Scientists
Oteargraphers
. Atmospheric Scientists
Engineers
Lite Scientists:''
merf-
tt
ALL. FIELDS
Raid
BiologicalScientists
'Agriculttual Scientiste:,
MedicalScientists.-,;
Riychologists
Sp-dal-Scientists
Economists
SoeiologistS,& AnthroPologists
OtherSocialScientist*
SOU
on.
(Thousands of dollars). 25 _ 30
I
I
ro4rodatiort ,
R&d
(Thousands pf dollars) --
10
'ALL ilEiDS
1-Rtirkal SdernittS"
Chemists . .
ists,a- Astronomers-.. -
-
Seientists
i Ittatf;iirnaiidaris ...-
--Statisticians
Cornntiter.Specialists .
-Environmental Sqientists
4
, Earth Scientists :1-
Oteano-graptiers =
Atrnospherie Sdients
"`Edgineers
Life-Scientists '
iliologioat Scientists-
:Agricultural Scientist*
; Medical-Scientists
Paydholooists
Social-Scientists" --
Entst
--SocioracjistsEtAnthropologists
OtherSncialScientistit j11111.1.====.1spunc,g; *,or,*
MINIMINE111=IN
17J. .
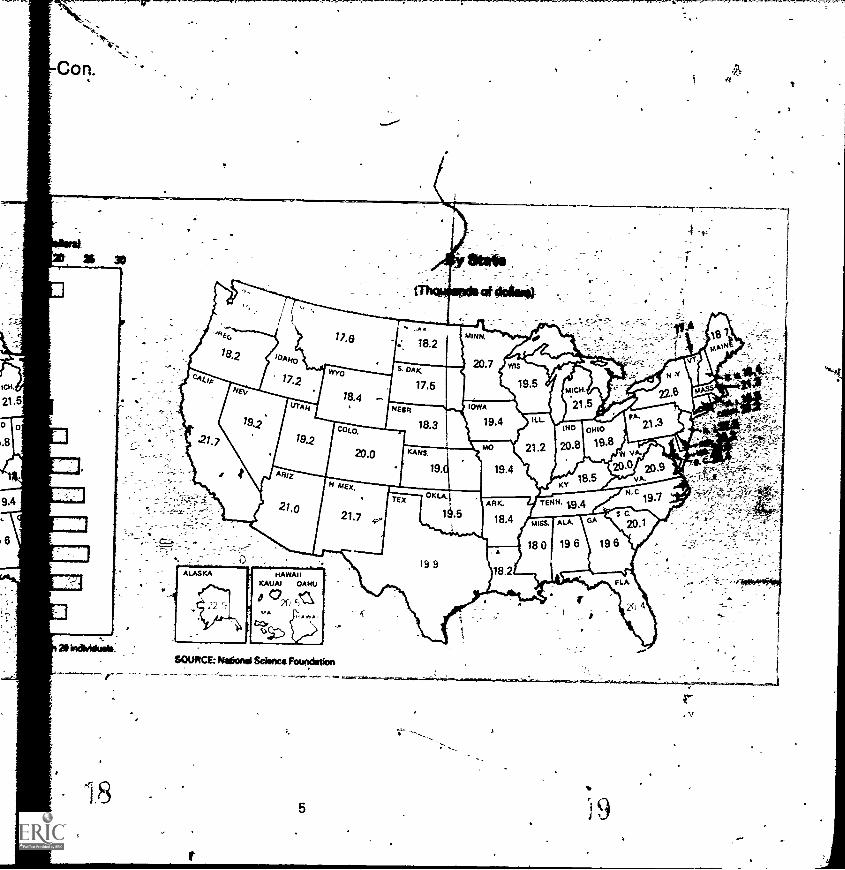
Median Annual SalariesCon.s
?i)aaMtI
1
`No main comoutotio pt oups with fomositton io WNW*.SOURCE: *Most Sdonotr-Foundotion SOURCE: Notional Scrimps-Foto/NW.*
5
.
Con..11
ICH
21.5
.8
9.4
a indhidusis
18
SOURCE: Moo' nal Seines Foundation
5
..
4
, «-id
4
./
0
Part
MAJOR ClARACTERISTICS.
notes
Percents may not add to totals because of rounding.
Median salaries were computed only for groups of ft411-timeemployed civilians of 20 or more individuals.
;For additional definitions see technical notes.
6 r
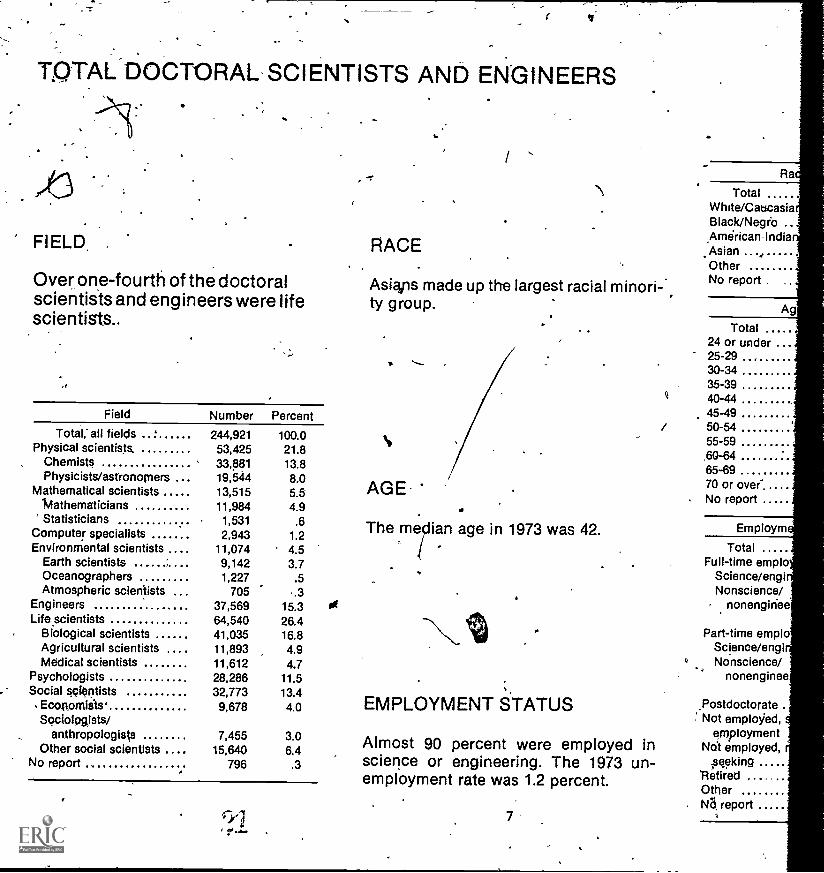
TOTAL DOCTORAL SCIENTISTS AND ENGINEERS
FIELD
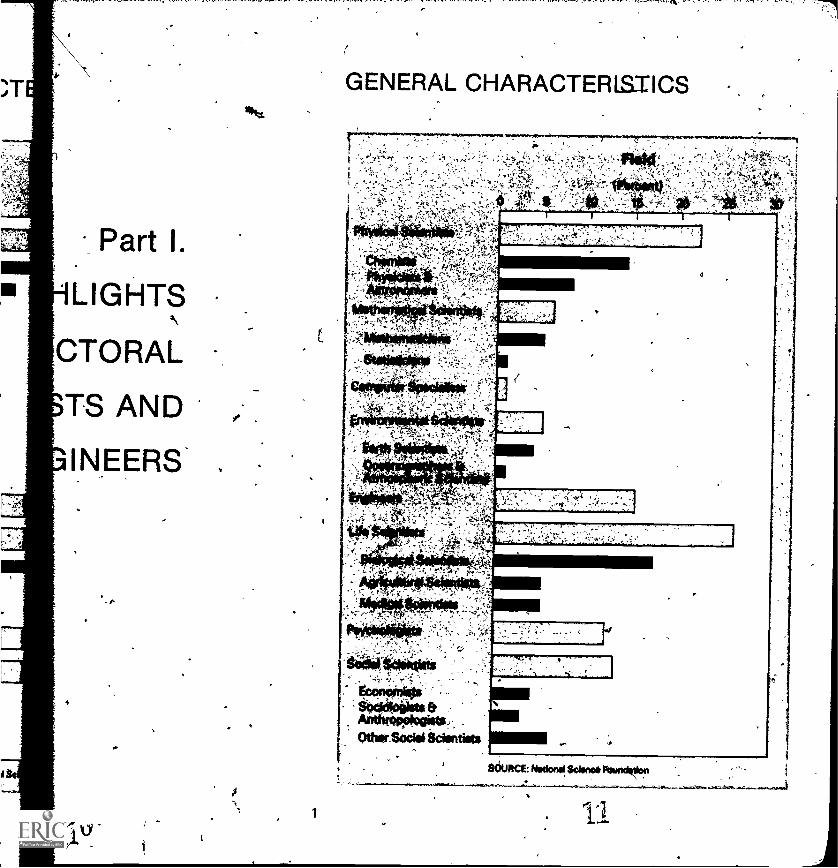
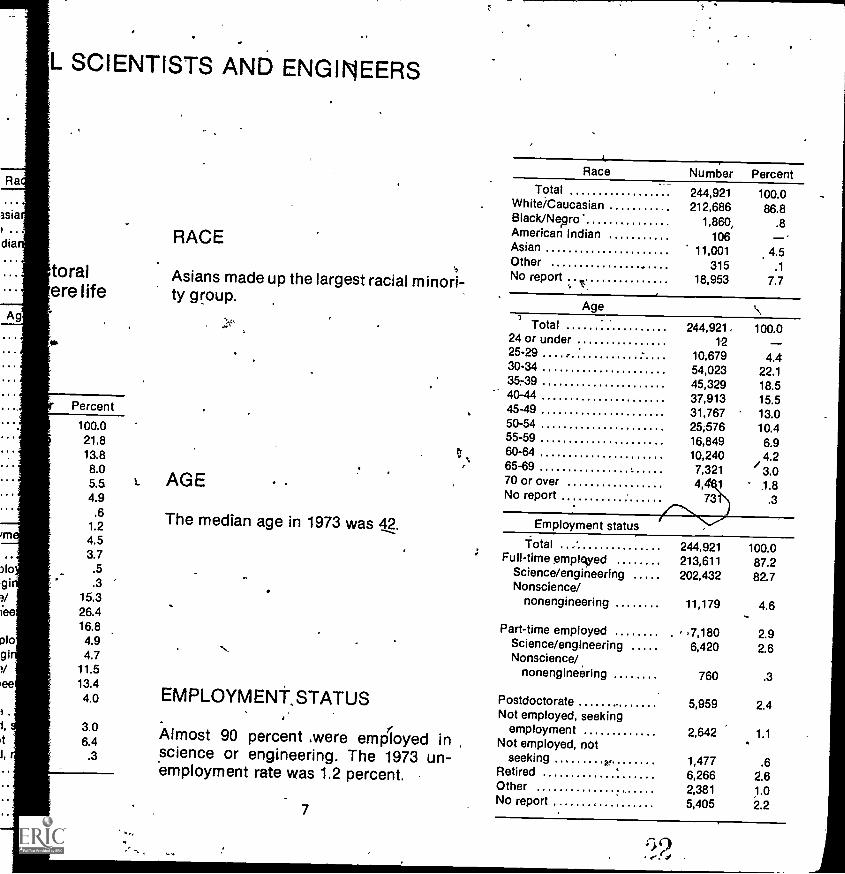
Over one-fourth of the doctoralscientists and engineers were lifescientists..
Field Number PercentTotal; all fields 244,921 100.0
Physical scientists. 53,425 21.8Chemists 33,851 13.8Physicists/astronomers 19,544 8.0
Mathematical scientists 13,515 5.6Vathematicians 11,984 4.9Statisticians 1,531 .6
Computer specialists 2,943 1.2Environmental scientists 11,074 4.5
Earth scientists 9,142 3.7Oceanographers 1,227 .5Atmospheric scientists 705 ,.3
Engineers 37,569 15.3 OfLife scientists 64,540 26.4
Biological scientists 41,035 16.8Agricultural scientists 11,893 4.9Medical scientists 11,612 4.7
Psychologists 28,286 11.5Social scientists 32,773 13.4
Economists' 9,678 4.0Socioiogists/
anthropologists 7,455 3.0Other social scientists 15,640 6.4
No report 796 .3
ryl
RACE
Asiaons made up the largest racial minori;ty group.
AGE
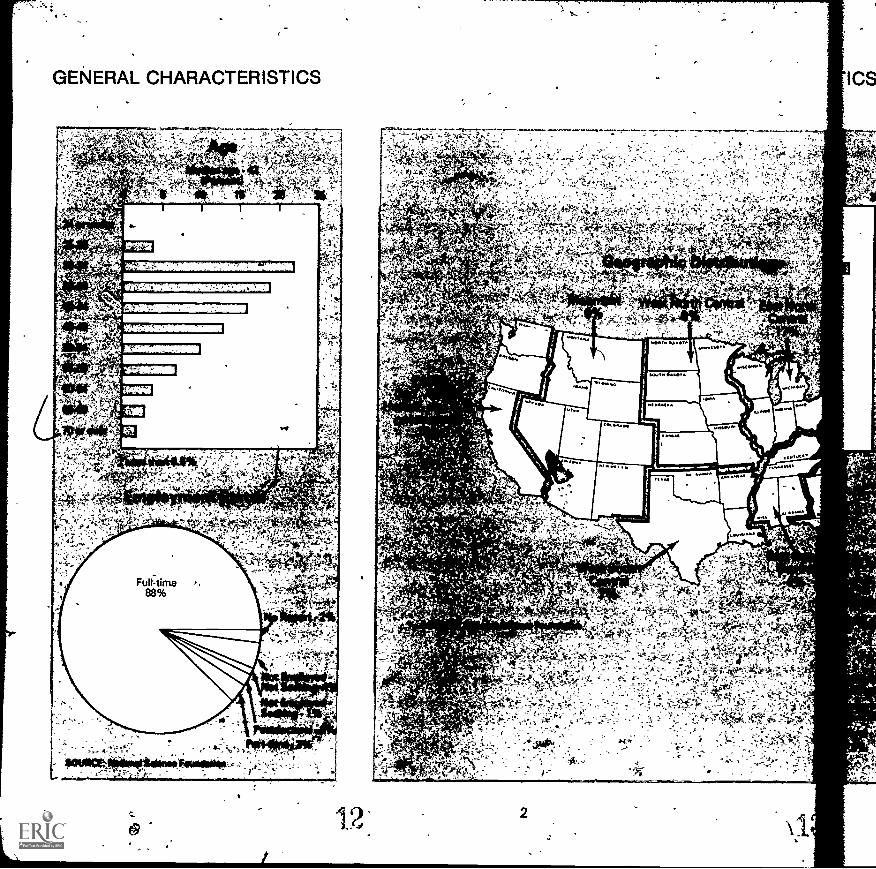
The median age in 1973 was 42.
EMPLOYMENT STATUS
Almost 90 percent were employed inscience or engineering. The 1973 un-employment rate was 1.2 percent.
7.
Ra
TotalWhite/CaticasiaBlack/NegfoAmerican IndiaAsianOtherNo report
Ag
Total24 or under25-2930-3435-3940-4445-4950-5455-59.60-6465-6970 or over.No report
Employm
TotalFull-time emplo
Science/engiNonscience/
nonenginee
Part-time emploScience /engiNonscience/
nonenginee
yostdoctorateNot employed,
employmentNot employed,
Isseking'RetiredOther ,
Nti, report
L SCIENTISTS AND ENGINEERS
asia)
RACEdia
Ag
toral Asians made up the largest racial minori-ere life ty group.
Percent
100.021.813.88.05.54.9
.61.24.53.7
)Io .51gi .3a/ 15.3iee 26.4
16.8plo 4.9gi 4.7
11.5lee 13.4
4.0
1, 3.0it 6.4
.3
L AGE
The median age in 1973 was 42.
'
EMPLOYMENT STATUS
Almost 90 percent were employed inscience or engineering. The 1973 un-employment rate was 1.2 percent.
7
Race Number PercentTotal 244,921 100.0
White/Caucasian 212,686 86.8Black/Ne.gro' 1,860, .8American Indian 106 --Asian 11,001 4.5Other 315 .1No report 18,953 7.7
Age
Total 244,921, 100.024 or under 1225-29 10,679 4.430-34 54,023 22.135739 45,329 18.540-44 37,913 15.545-49 31,767 13.050-54 25,576 10.455-59 16,849 6.960-64 10,240 4.265-69 7,321 3.070 or over 4, 1 1.8No report 73 .3
Employment status
Total 244,921 100.0Full-time employed 213,611 87.2
Science/engineering 202,432 82.7Nonscience/
nonengineering 11,179 4.6
Part-time employed , 7,180 2.9Science/engineering 6,420 2.6Nonscience/
nonengineering 760 .3
Postdoctorate 5,959 2.4Not employed, seeking
employment 2,642 1.1Not employed, not .
seeking e 1,477 .6Retired 6,266 2.6Other 2,381 1.0No report 5,405 2.2
TOTAL DOCTORAL SCIENTISTS AND ENGINEERS -CON.
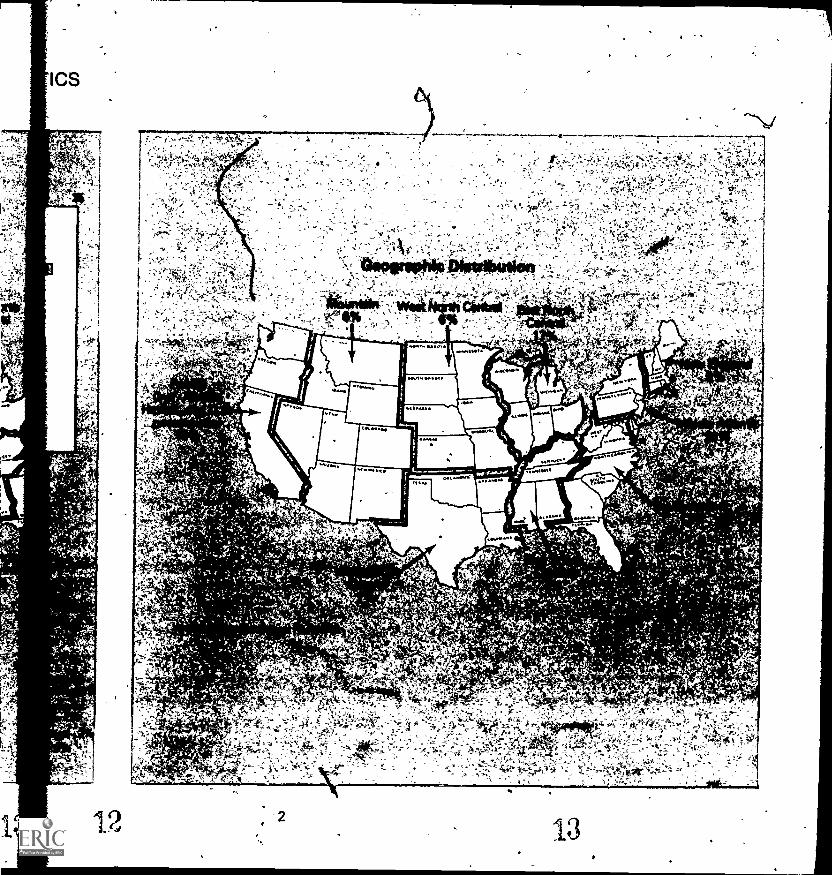
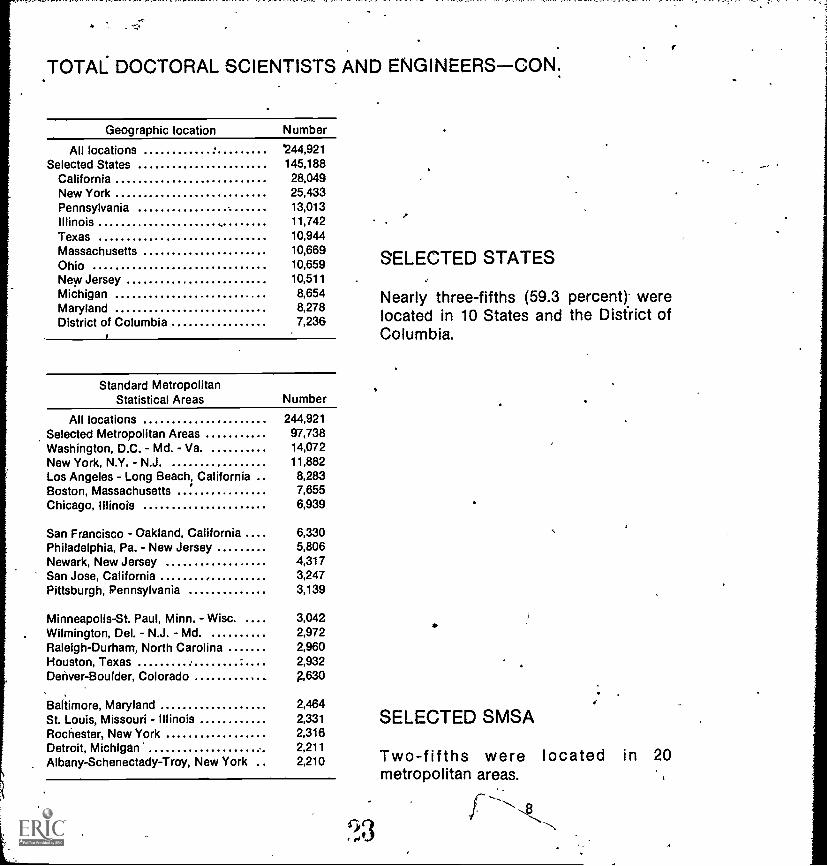
Geographic location Number
All locations N4,921Selected States 145,188
California 28,049New York 25,433Pennsylvania 13,013Illinois 11,742Texas 10,944Massachusetts 10,669Ohio 10,659New Jersey 10,511
Michigan 8,654Maryland 8,278District of Columbia 7,236
Standard MetropolitanStatistical Areas Number
All locations 244,921Selected Metropolitan Areas 97,738Washington, D.C. - Md. - Va. 14,072New York, N.Y. - N.J. 11,882Los Angeles - Long Beach, California 8,283Boston, Massachusetts 7,655Chicago, Illinois 6,939
San Francisco - Oakland, California 6,330Philadelphia, Pa. - New Jersey 5,806Newark, New Jersey 4,317San Jose, California 3,247Pittsburgh, Pennsylvania 3,139
Minneapolis-St. Paul, Minn. - Wisc. 3,042Wilmington, Del. - N.J. - Md. 2,972Raleigh-Durham, North Carolina 2,960Houston, Texas 2,932Denver-Boulder, Colorado 2,630
Baltimore, Maryland 2,464St. Louis, Missouri - Illinois 2,331Rochester, New York 2,316Detroit, Michigan 2,211Albany-Schenectady-Troy, New York .. 2,210
5,
SELECTED STATES
Nearly three-fifths (59.3 percent) werelocated in 10 States and the District ofColumbia.
SELECTED SMSA
Two-fifths were located in 20metropolitan areas.
1
TOTAL EMPLOYMENT AND SALARIES
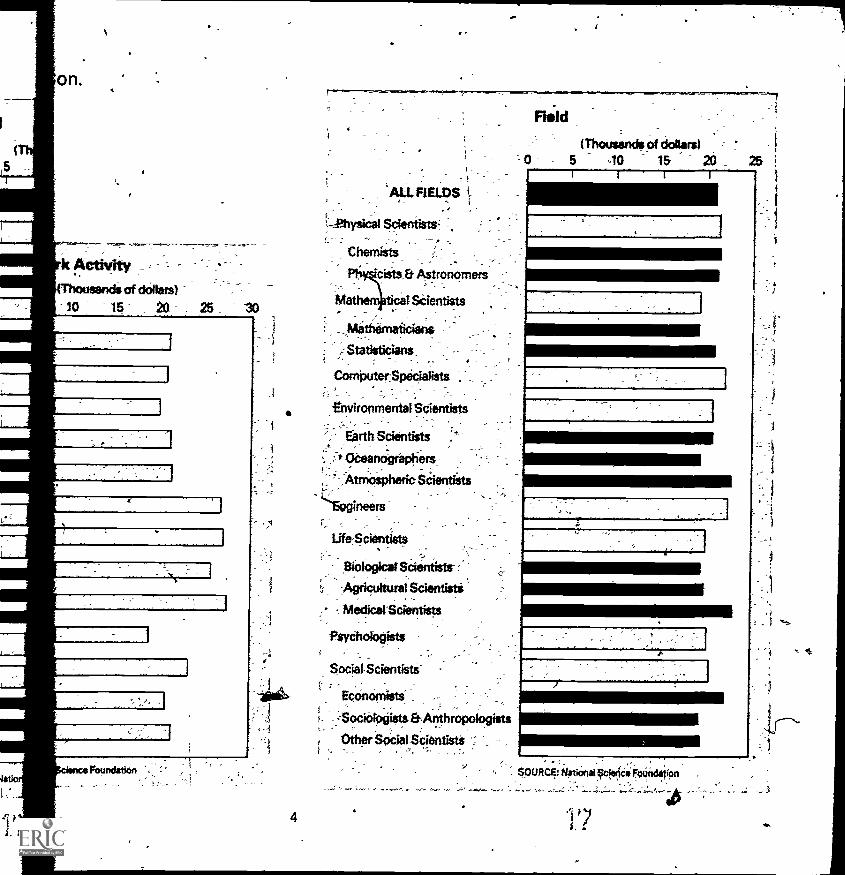
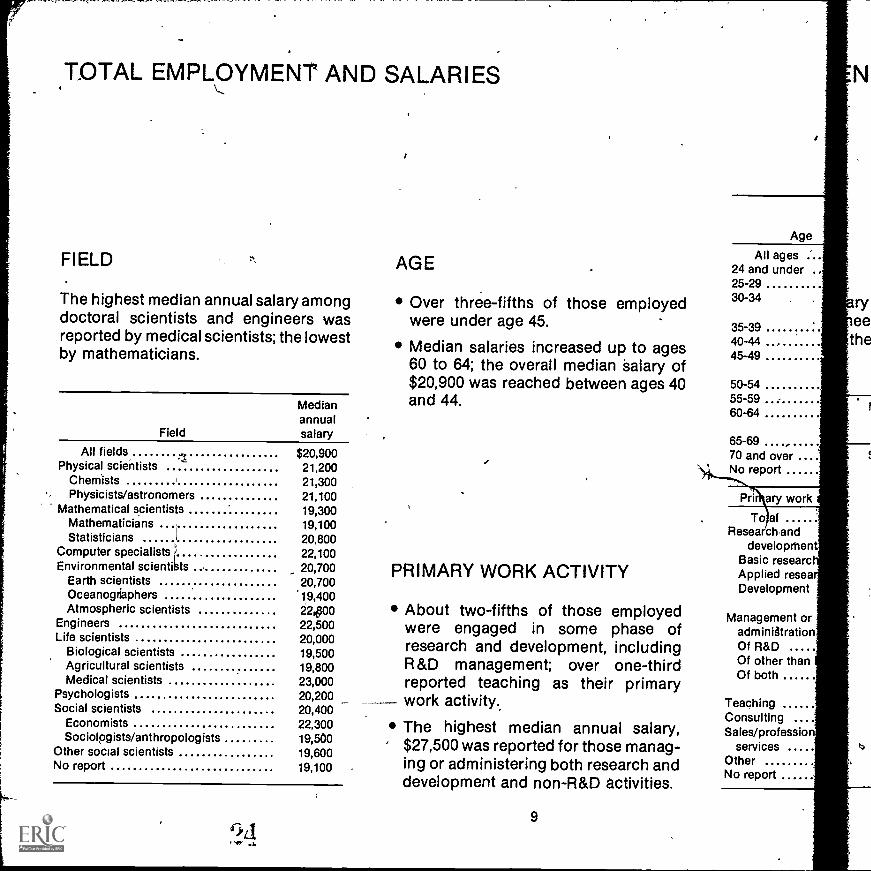
FIELD
The highest median annual salary amongdoctoral scientists and engineers wasreported by medical scientists; the lowestby mathematicians.
Field
Medianannualsalary
All fieldsPhysical scientists
ChemistsPhysicists/astronomers
Mathematical scientistsMathematiciansStatisticians
Computer specialists i+Environmental scientiSts
Earth scientistsOceanogriaphersAtmospheric scientists
EngineersLife scientists
Biological scientistsAgricultural scientistsMedical scientists
PsychologistsSocial scientists
EconomistsSociologists/anthropologists
Other social scientistsNo report
$20,90021,20021,30021,10019,30019,10020,80022,10020,70020,70019,4002490022,50020,00019,50019,80023,00020,20020,40022,30019,50019,60019,100
AGE
Over three-fifths of those employedwere under age 45.
Median salaries increased up to ages60 to 64; the overall median Salary of$20,900 was reached between ages 40and 44.
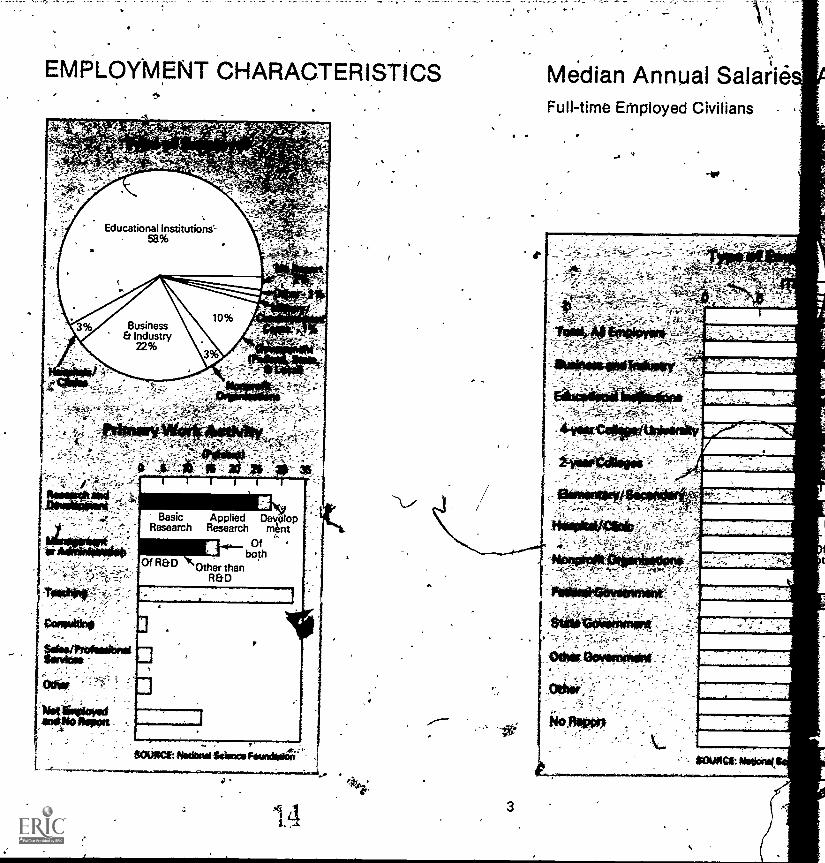
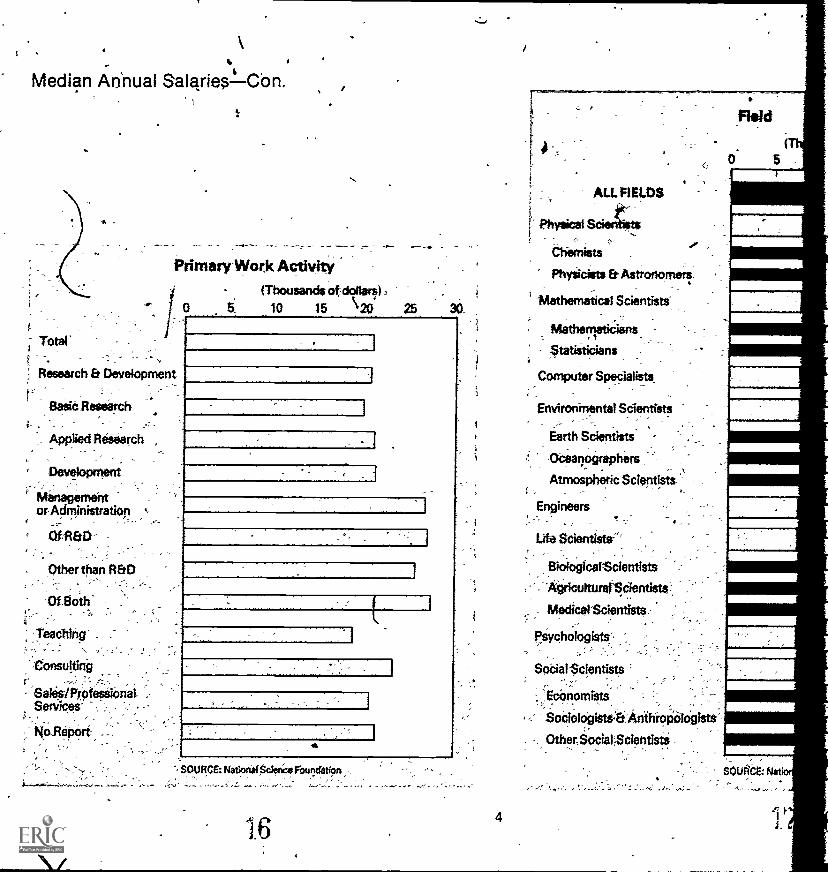
PRIMARY WORK ACTIVITY
About two-fifths of those employedwere engaged in some phase ofresearch and development, includingR &D management; over one-thirdreported teaching as their primarywork activity.
The highest median annual salary,$27,500 was reported for those manag-ing or administering both research anddevelopment and non-R&D activities.
Age
All ages24 and under25-2930-34
35-3940-4445-49
50-5455-5960-64
65-6970 and overNo report
Pri ary work
To alResea chand
developMenBasic researcApplied reseaDevelopment
Management oradministrationOf R&DOf other thanOf both
TeachingConsultingSales/profession
servicesOtherNo report
NT AND SALARIES
r
ry amongeers wasthe lowest
rk
entrc.earnt
Orion
an
on
Medianannualsalary
$20,90021,20021,30021,100.19,30019,10020,80022,10020,70020,700
'19,40022,8002'2,50020,00019,50019,80023,00020,20020,40022,30019,50019,60019,100
AGE
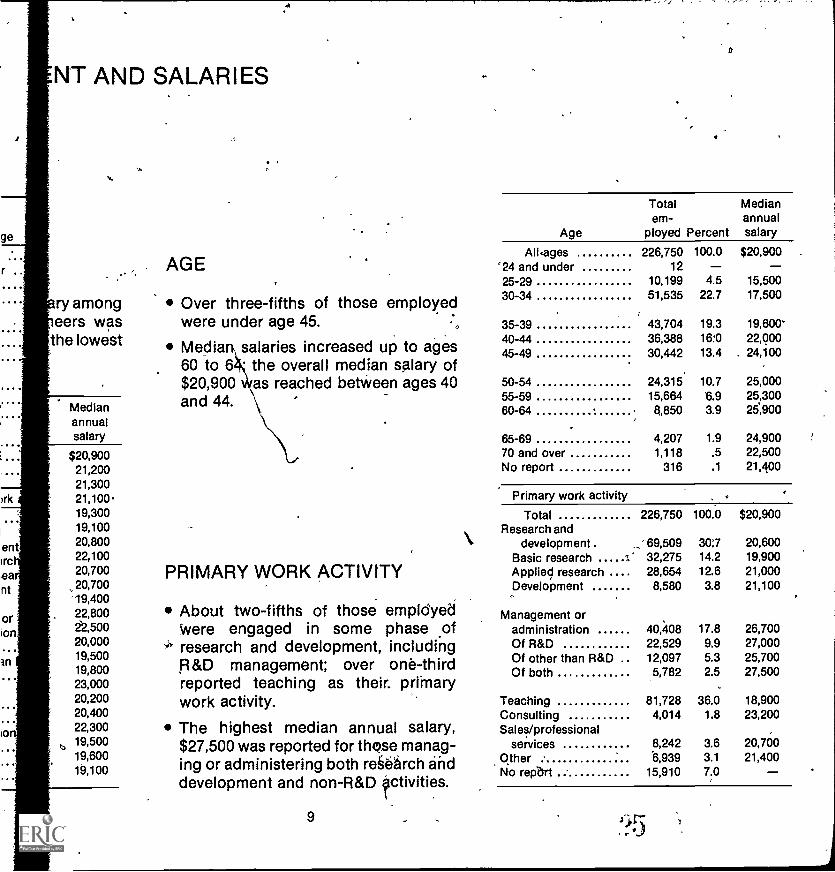
Over three-fifths of those employedwere under age 45.
Media salaries increased up to ages60 to 6 the overall median salary of$20,900 as reached betWeen ages 40and 44.
PRIMARY WORK ACTIVITY
About two-fifths of those employedWere engaged in some phase .of
,^ research and development, includingR&D management; over one-thirdreported teaching as their. primarywork activity.
The highest median annual salary,$27,500 was reported for those manag-ing or administering both research anddevelopment and non-R&D activities.
9
Age
Totalem-
ployed Percent
Medianannualsalary
Alkages 226,750 100.0 $20,900`24 and under 12 -25-29 10,199 4.5 15,50030-34 51,535 22.7 17,500
35-39 43,704 19.3 19,600-40-44 36,388 16:0 22,00045-49 30,442 13.4 . 24,100
50-54 24,315 10.7 25,00055-59 15,664 6.9 25,30060-64 8,850 3.9 25,900
65-69 4,207 1.9 24,90070 and over 1,118 .5 22,500No report 316 .1 21,400
Primary work activity
Total 226,750 100.0 $20,900Research and
development . ;69,509 30:7 20,600Basic research -* 32,275 14.2 19,900Applied research .... 28,654 12.6 21,000Development 8,580 3.8 21,100
Management oradministration 40,408 17.8 26,700Of R&D 22,529 99 27,000Of other than R&D .. 12,097 5.3 25,700Of both 5,782 2.5 27,500
Teaching 81,728 36.0 18,900Consulting 4,014 1.8 23,200Sales/professional
services 8,242 3.6 20,700Other 6,939 3.1 21,400No repbrt 15,910 7.0
TOTAL EMPLOYMENT AND SALARIES -CON.
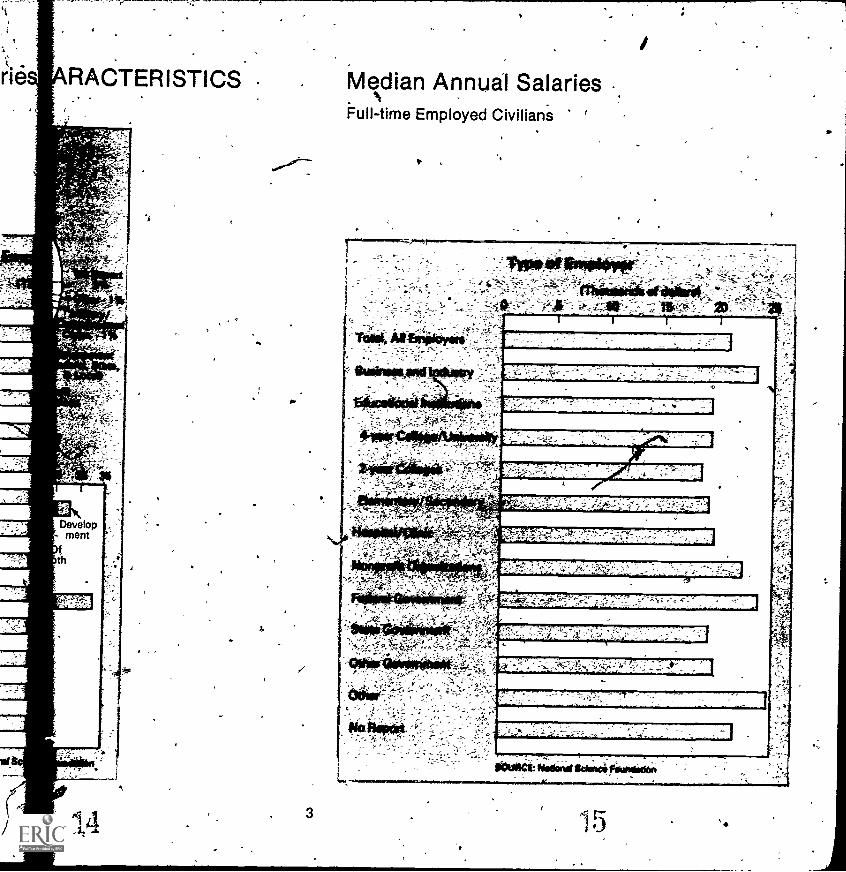
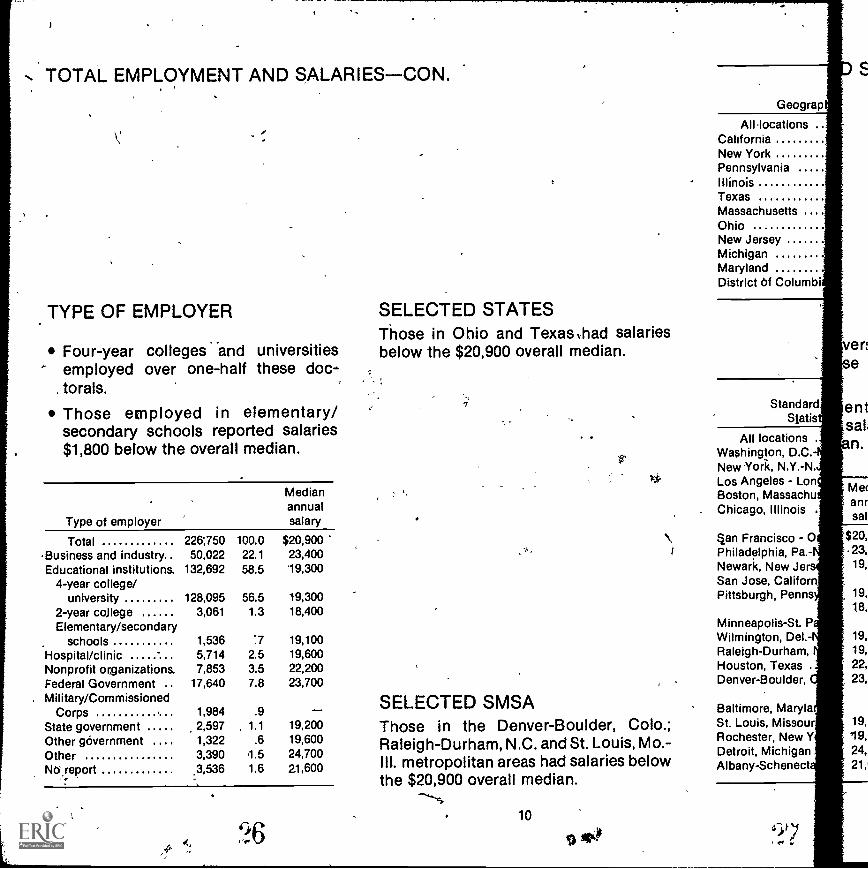
TYPE OF EMPLOYER
Four-year colleges and universitiesemployed over one-half these doc-
. torals.
Those employed in elementary/secondary schools reported salaries$1,800 below the overall median.
Type of employer
Medianannualsalary
Total 226;750 100.0 $20,900Business and industry 50,022 22.1 23,400Educational institutions. 132,692 58.5 19,300
4-year college/university 128,095 56.5 19,300
2-year cc:liege 3,061 1.3 18,400Elementary/secondary
schools 1,536 :7 19,100Hospital/clinic 5,714 2.5 19,600Nonprofit organizations. 7,853 3.5 22,200Federal Government 17,640 7.8 23,700Military/Commissioned
Corps 1,984 .9
State government 2,597 , 1.1 19,200
Other government 1,322 .6 19,600
Other 3,390 1.5 24,700
NU report 3,536 1.6 2.1,600
c)6
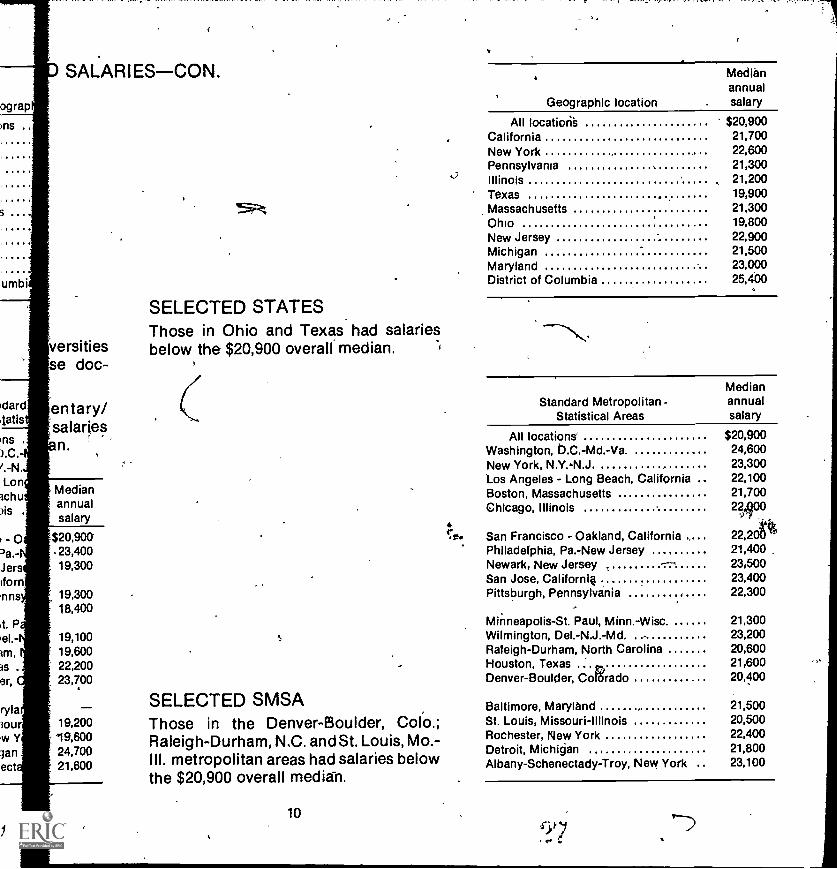
SELECTED STATESThose in Ohio and Texas *had salariesbelow the $20,900 overall median.
SELECTED SMSAThose in the Denver-Boulder, Colo.;Raleigh-Durham, N.C. and St. Louis, Mo.-Ill. metropolitan areas had salaries belowthe $20,900 overall median.
10
Geograp
All locationsCaliforniaNew YorkPennsylvaniaIllinoisTexasMassachusettsOhioNew JerseyMichiganMarylandDistrict of Columbi
StandardStatis
All locations .
Washington, D.C.-New -York, N.Y.-N.Los Angeles - LonBoston, MassachuChicago, Illinois .
qan Francisco - 0Philadelphia, Pa.-Newark, New JerSan Jose, CalifornPittsburgh, Penns
Minneapolis-St. PWilmington, Del. -Raleigh- Durham,Houston, Texas .Denver-Boulder,
Baltimore, MarylaSt. Louis, MissourRochester, New YDetroit, MichiganAlbany-Schenect
ograp
ms
umbi
SALARIES-CON. Medianannual
Geographic location salary
All Iocatiori's $20,900California 21,700New York 22,600Pennsylvania 21,300Illinois 21,200Texas 19,900Massachusetts 21,300Ohio 19,800New Jersey 22,900Michigan 21,500Maryland 23,000District of Columbia 25,400
versitiese doc-
entary/,salaries
n.
SELECTED STATESThose in Ohio and Texas had salariesbelow the $20,900 overall median.
SELECTED SMSAThose in the Denver-Boulder, Colo.;Raleigh-Durham, NC. and St. Louis, Mo.-III. metropolitan areas had salaries belowthe $20,900 overall medigh.
r
dardlatis
ns .
Lonichuais .
-O'a.-Jersifornnns
t. Pel.-im,is .
er,
ryla30Ur
w Yan
ect
Standard Metropolitan -Statistical Areas
Medianannualsalary
All locations'Washington, D.C.-Md.-Va.New York, N.Y.,-N.J.Los Angeles - Long Beach, CaliforniaBoston, MassachusettsChicago, Illinois
San Francisco - Oakland, CaliforniaPhiladelphia, Pa.-New JerseyNewark, New Jersey tSan Jose, CaliforniQPittsburgh, Pennsylvania .........
Minneapolis-St. Paul, Minn.-Wisc.Wilmington, Del.-N.J.-Md.Rateigh-Durham, North CarolinaHouston, TexasDenver-Boulder, Corrado
Baltimore, MarylandSt. Louis, Missouri-IllinoisRochester, New YorkDetroit, MichiganAlbany-Schenectady-Troy, New York
$20,90024,60023,30022,10021,70022,900
22,20'2t40023,50023,40022,300
21,30023,20020,60021,60020,400
20,50022,40021,80023,100
Medianannualsalary
$20,90023,40019,300
19,30018,400
19,10019,60022,20023,700
19,20019,60024,70021,600
104;7
EMPLOYED .IN BUSINESS AND INDUSTRY If
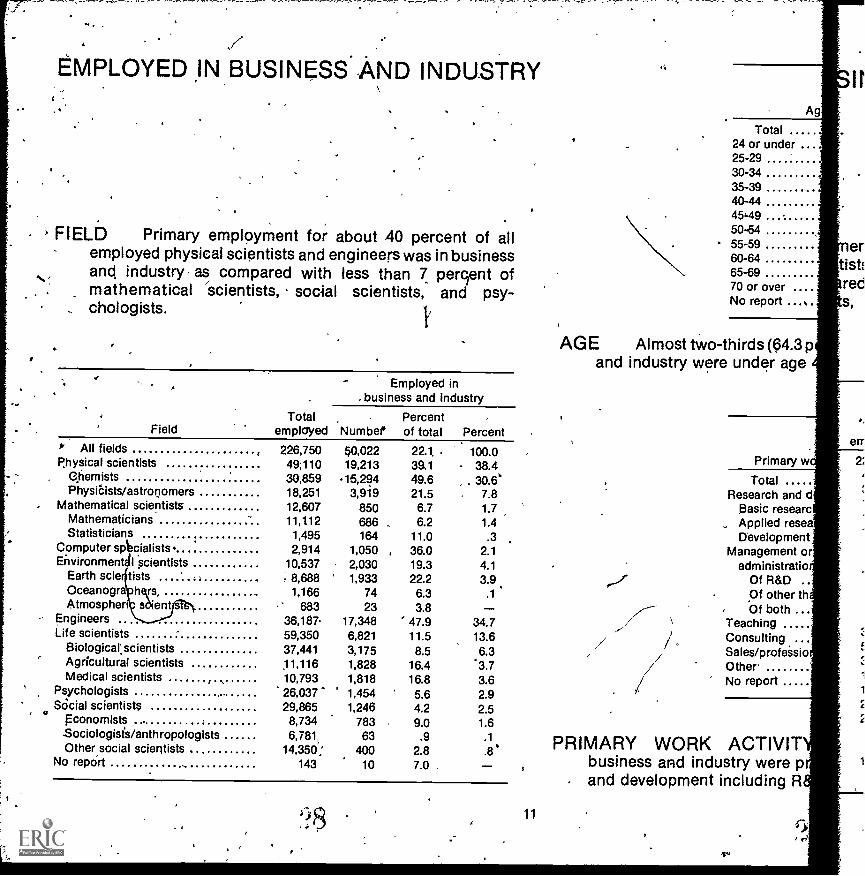
FIELD Primary employment for about 40 percent of allemployed physical scientists and engineers was in businessand industry as compared with less than 7 percient ofmathematical /scientists, social scientists, and psy-chologists.
FieldTotal
employed
Employed inbusiness and industry
NumberPercentof total Percent
* All fields 226,750 80,022 22.1, . 100.0Physical scientists 49;110 19,213 39.1 38.4
Chemists 30,859 -15,294 49.6 . 30.6*Physicists/astronomers 18,251 3,919 21.5 , 7.8
Mathematical scientists 12,607 850 6.7 1.7Mathematicians 11,112 686 6.2 1.4Statisticians 1,495 164 11.0 .3
Computer sp =cialists 2,914 1,050 4 36.0 2.1Environment I 'scientists 10,537 2,030 19.3 4.1
Earth scie tists , 8,688 ' 1,933 22.2 3.9Oceanogr hqs, 1,166 74 6.3 .1Atmosphen sdient 683 23 3.8 -
Engineers 36,187 17,348 47.9 34.7Life scientists 59,350 6,821 11.5 13.6
Biological; scientists 37,441 3,175 8.5 6.3Agricultural scientists 11,116 1,828 16.4 3.7Medical scientists 10,793 1,818 16.8 3.6
Psychologists 26,037* 1,454 5.6 2.9Social scientists 29,865 1,246 4.2 2.5
Economists 8,734 783 9.0 1.6.SociologistS/anthropologists 6,781 63 .9 .1Other social scientists 14,350; 400 2.8 .8*
No repOrt 143 10 7.0 -
11
Ag
Total24 or under25-2930-3435-3940-44454950-5455-5960-6465-6970 or overNo report ...
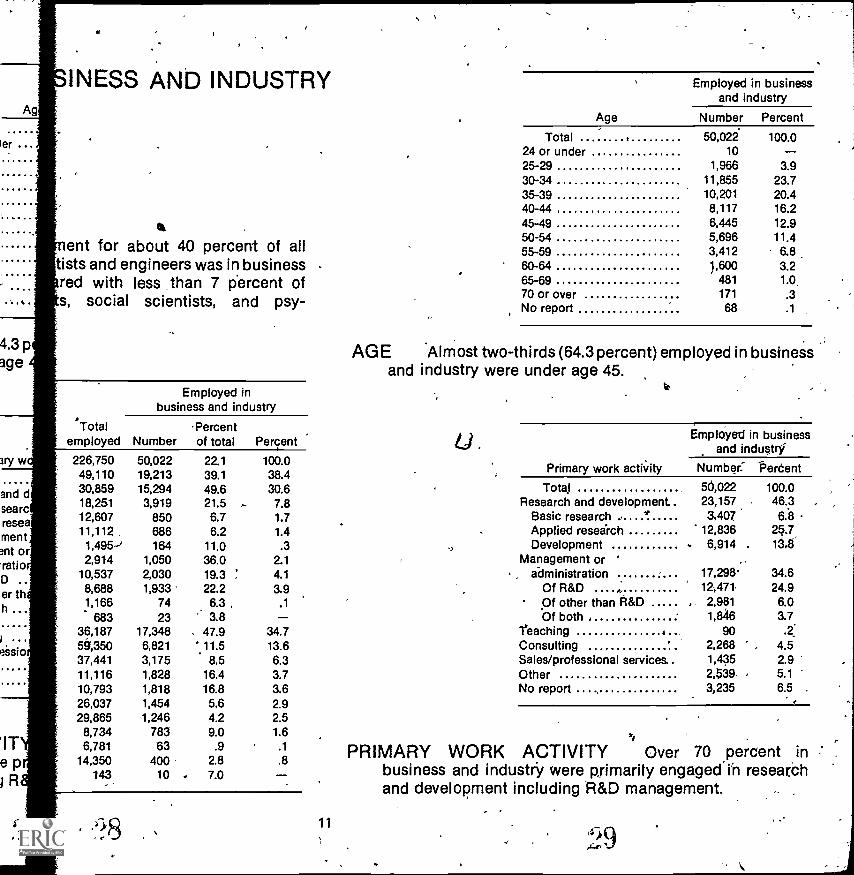
AGE Almost two- thirds (Q4.3 pand industry were under age
Primary w
erfist:reds,
err
TotalResearch and d
Basic researcApplied reseDevelopment
Management oradministratio
Of R&D .
Of other thOf both
TeachingConsultingSales/professioOtherNo report
PRIMARY WORK ACTIVITbusiness and industry were pand development including R
2
'NESS AND INDUSTRY
aent for about 40 percent of all
fists and engineers was in businessred with less than 7 Percent ofs, social scientists, and psy-
Age
Employed in businessand industry
Number Percent
Total24 or under
50,02210
100.0
25-29 1,966 3.930-34 11,855 23.735-39 10,201 20.440-44 8,117 16.245-49 6,445 12.950-54 5,696 11.455-59 3,412 6.860-64 1,600 3.265-69 481 1.070 or over 171 .3No report 68 .1
AGE Almost two-thirds (64.3 percent) employed in businessand industry were under age 45.
Employed inbusiness and industry
Totalemployed Number
Percentof total Percent
PRIMARY WORKbusiness and industryand development
Employed in businessand industrY.
226,75049,11030,85918,25112,60711,112
1,495 -i2,914
10,5378,6881,166
68336,1875435037,44111,11610,79326,03729,865
8,7346,781
14,350143
50,02219,21315,2943,919
850686164
1,0502,0301,933
7423
17,3486,8213,1751,8281,8181,4541,246
78363
40010
22.139.149.621.5 .6.76.2
11.036.019.3 :
22.26.3
°' 3.847.911.58.5
16.416.85.64.29.0
.92.87.0
100.038.430.67.81.71.4.3
2.1
4.1
3.9.1
34.713.66.33.73.62.92.51.6
.1
.8
Primary work activity Number: itieroent
Tots)Research and development .
Basic researchApplied researchDevelopment
Management oradministration
Of R&DOf other than R&DOf both ,
teaching 4..,ConsultingSales/professional servicesOtherNo report
56,02223,1573,407
12,8366,914 .
17,2911'
12,4712,9811,846
902,2681,4352,539.3,235
100.046.36.8
25.7118'
34.624.9
6.03.7
.2:4.52.95.16.5 .
ACTIVITY Over 70 percent inwere primarily engaged'in research
including 'R&D management.
11

S
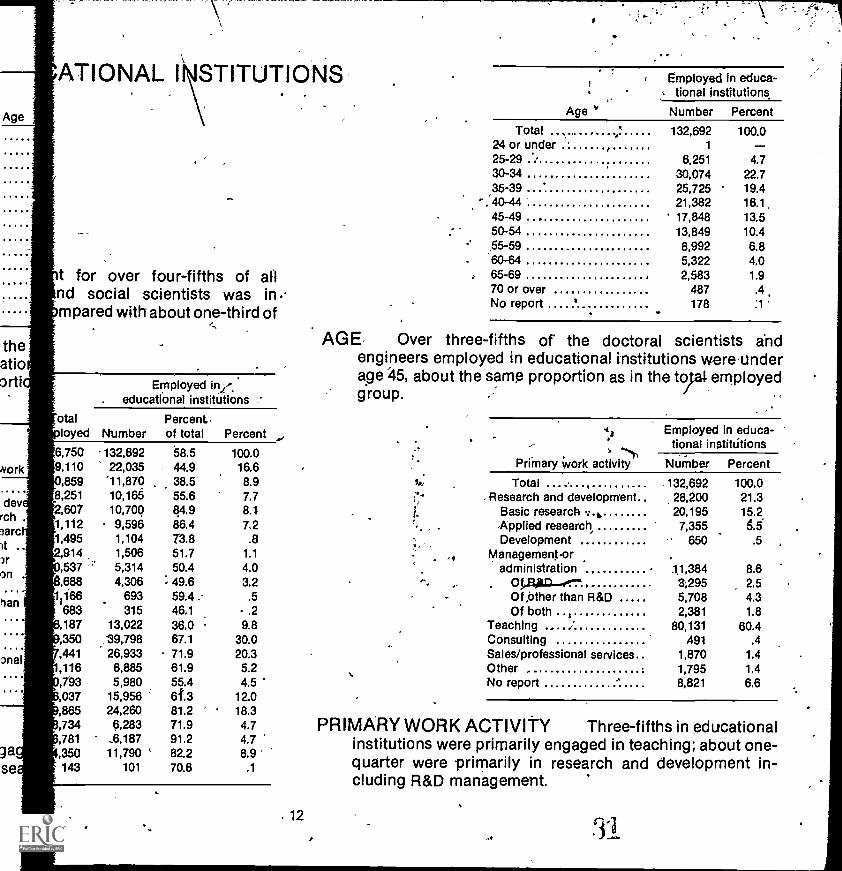
EMPLOYED IN EDUCATIONAL INSTITUTIONS
FIELD Primary employment for over four-fifths of all. employed mathematical and social scientists was in
educational institutions as compared with about one-third ofthe engineers.
FieldTotal
employed
Employed ineducational institutions
PercentNumber , of total Percent
All.fields . 226,750 132,692 58.5 100.0Physical scientists 3 49,110 22,035 44.9 16.6
Chemists 30,859 11,870 38.5 8.9 ,Physicists/astronomers 18,251 10,165 55.6 7.7
Mathematical scientist's r 12,607 10,700 -84.9 8.1Mathematicians 11,112 9,596 86.4 7.2Statisticians 1,495 1,104 '73.8 .8
Computer,specialists ., 1914 . 1,506 , 51.7 1.1Environmental scientists f0,537 5,314 50.4 4.0
Earth scientists . 1.e.. . '8,688- 4,306 49.6 3.2Odeanographers 1,166 693 59.4 .5Atmospheric scientists 683 315 46.1 .2
Engineers 36,187 13,022 36.0 9.8Life scientists . . 59,350 39,798 67.1 30.0
Biological scJentists 37,441 26,933, . 71.9 20.3Agricultural, scientists 11,116 6,885 61.9 5.2Medical scientists 10,793 5,980' 65.4 4.5
Psychologists 26,037 15,956 61.3 12.0SociasCientists :t 29,866 24,260 81.2 18.3
Economists 8,734 6,283 , 71.9 4.7Sociologists /anthropologists 6,781 6,187 91.2 4./Other social scientists 14, 11,790 82.2 8.9
No report .143 101 70.6 :1
12
Age
Total24 or under , .
25-2930-3435-3940-4445-4950-5455-5960-6465-6970 or overNo report
AGE Over three-fifths of theengineers employed in educatioage 45; about the same proportigroup.
Primary work
TotalResearch and dev
Basic research .
Applied researcDevelopment
Management oradministration
Of R&D. Of other than
Of bothTeachingCdhsultingSales/professionalOtherNo report
PRIMARY WORK ACTIVITYinstitutions were primarily engaquarter were.. primarily in resecluding R&D management.
Age
theatioDrti
NOrk
derch .
arc..
)ron .
han
onal
gase
ATIONAL I STITUTIONS
t for over four-fifths of allnd social scientists was in.'mpared with about one-third of
Employed in /,educational institutions
otalloyed Number
Percent,of total Percent
6,7509,110
,8598,251
132,69222,035'11,870 .
10,165
58.544.938.555.6
100.016.68.97.7
,607 10,700 84.9 8.11,1i2 9,596 86.4 7.21,495 1,104 73.8 .82,914 1,506 51.7 1.1
,537 -'' 5,314 50.4 4.0,688 4,306 49.6 3.2
1 166 693 59.4. .5683 315 46.1 .2
,187 13,022 36.0 9.8,350 39,798 67.1 30.0,441 26,933 71.9 20.3,116 6,885 61.9 5.2,793 5,980 55.4 4.5,037 15,956 12.0,865 24,260 81.2 18.3,734 6,283 71.9 4.7,781 .6,187 91,2 4.7,350 11,790 ' 82.2 8.9143 101 70.6 .1
12
.
Age v
Employed in educa-tional institutions
Number Percent
Total 132,692 100.024 or under 1
25-29 . 6,251 4.730-34 30,074 22.735-39 25,725 19.4
21,382 16.1,45-49 17,848 13.550-54 13,849 10.455-59 8,992 6.860-64 5,322 4.065-69 2,583 1.970 or over 487 .4No report 178 :1
AGE, Over three-fifths of the doctoral scientists andengineers employed in educational institutions were-underage '45, about the same proportion as in the togroup.
.1
-...t,
Primary Work activity
Employed in educa-tional institutions
Number Percent
tI; Total , 132,692 100.0Research and development 28,200 21.3
1. Basic research -.,, 20,195 15.2-Applied research, 7,355 5.5Development ' 650 .5 ,
Managementor .
administration 1,1,384 8.6OW r'l .00- 3,295 2.5Of ,Other than R&D 5,708 4.3Of both , 2,381 1.8
Teaching I 80,131 80.4Consulting 491 .4Sales/professional services 1,870 1.4Other 1,795 1.4No report 8,821 6.6
PRIMARY WORK ACTIVITY Three-fifths in educationalinstitutions were primarily engaged in teaching; about one-quarter were primarily in research and development in-cluding R&D management.
31
TEACHING IN UNIVERSITIES OR COLLEGES
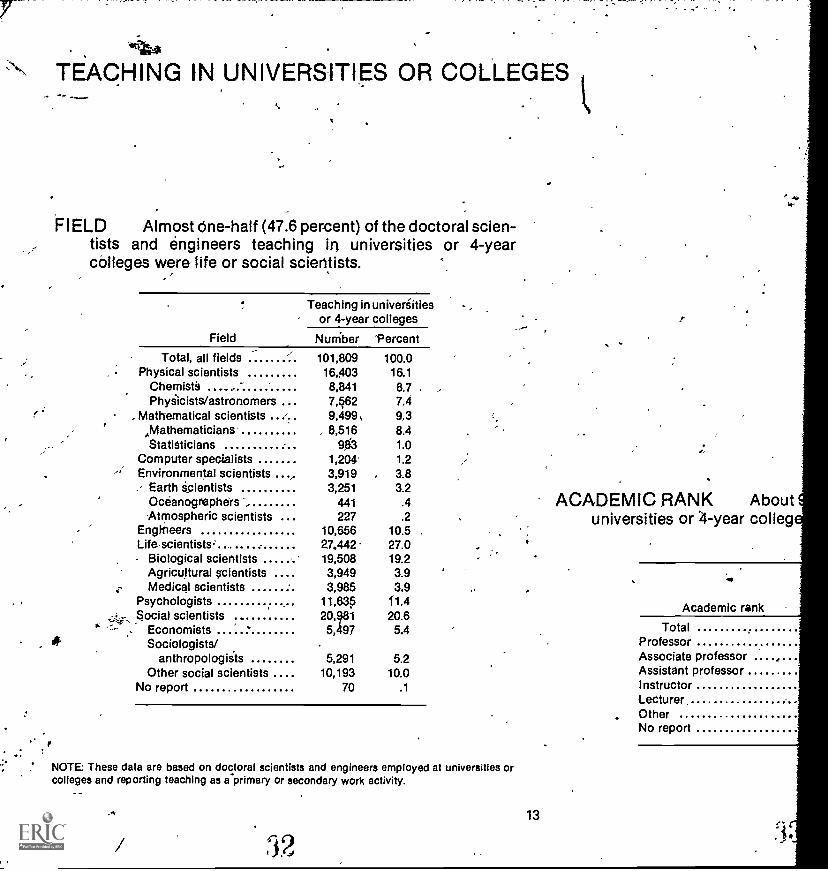
FIELD Almost line-half (47.6 percent) of the doctoral scien-tists and engineers teaching in universities or 4-yearcolleges were life or social scientists.
Field
Teaching in universitiesor 4-year colleges
Number 'percent
Total, all fieldsPhysical scientists
Chemist's_
r 101,80916,403
8,841
100.016.1
8,7Phyiicists/astronomers ... 7,562 7.4
, Mathematical scientists,,Mathematicians
- 9,499,8,516
9,38,4
Statisticians 933 1.0Computer specialists 1,204 1.2
- Environmental scientists ..., 3,919 3.8.- Earth scientists 3,251 3.2
Ocesnographdrs 441 .4 ACADEMIC RANK About'Atmospheric scientists ... 227 .2 universities or 4-year colleg
Engtheers 10,656 10.5Life-scientists: 27,442 27.0- Biological scientists 19,508 19.2
Agricultural scientists .... 3,949 3.9Medical scientists 3,985 3.9
Psychologists 11,635 11.4 Academic rank- Social scientists .. 20,981 20.6
TotalEconomists . 5,497 5.4Sociologists/
anthropologists 5291 5.2
ProfessorAssociate professor
Other social scientists .... 10,193 10.0 Assistant professorNo report 70 .1 Instructor
Lecturer.OtherNo report
.:NOTE: These data are based on doctoral scientists and engineers employed at universities orcolleges and reporting teaching as a-primary or secondary work activity.
13

IVERSITIES OR COLLEGES
.1
. t(47.6 percent) of the doctoral scien- (
0aching in universities or 4-y4ear )ial scientists.
Teaching in universitiesor 4-year colleges
Number kiercent
101,809 100.016,403 16.1 .
8,841 8.7r s . . . 7,562 , 7.4
9,499 9.38,516 8.4
983 1.01,204 1.23,919 3.8
)Ut 3,251 3.2441 .4eg 227 .2
10,656 10.527,442 27.019,508 19.23,949 3.93,985 3.9
11,635 11.420,981 20.65,497 5.4
5,291 5.210,193 10.0
70 .1
entists and engineers employed at universities orr secondary work activity.
ACADEMIC RANK About 95 percent of those teaching inuniversities or 4-year colleges held professorial rank.
Academic rank
Teaching in universitiesor 4-year colleges
Number PercentTotal 101,809 100.0$
Professor , 39,352 38.7Associate professor 30,201 29.7Assistant professor 26,682 26.2Instruct 711 .7Lectur r 811 .8Other, : 1,869 1.8No report 2,183 2.1
13
53
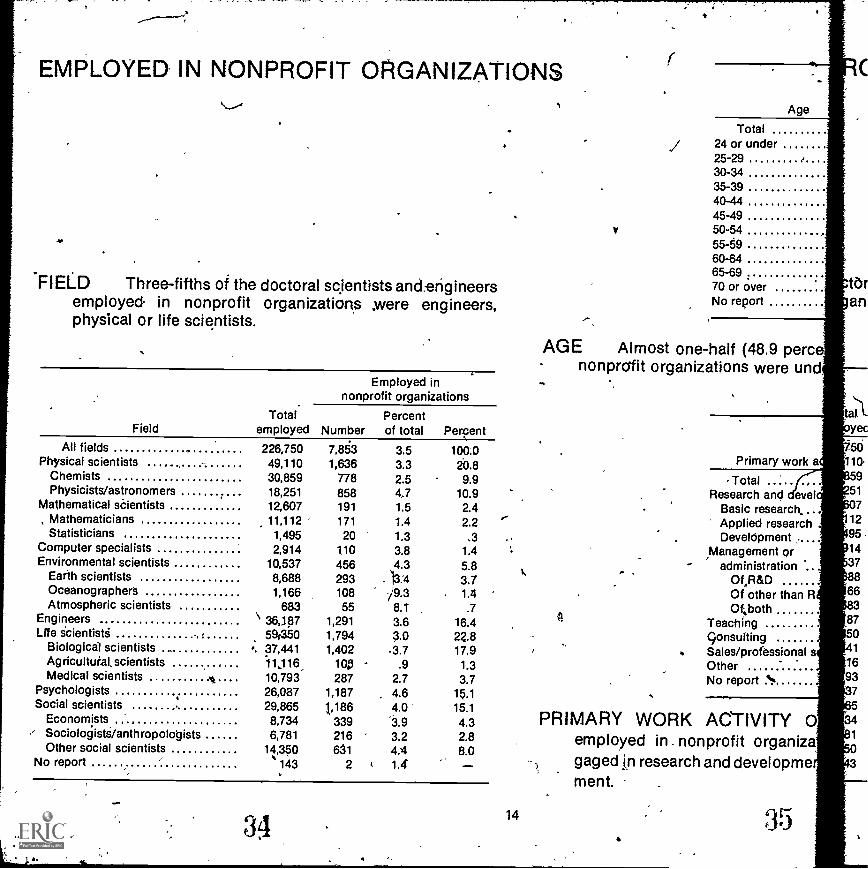
EMPLOYED IN NONPROFIT OF
r
FIELD Three-fifths of the doctoral scientists and:engineersemployed in nonprofit organizations were engineers,physical or life scientists.
FieldTotal
employed
Employed innonprofit organizations
NumberPercentof total Percent
All fields 226,750 7,853 3.5 100:0Physical scientists 49,110 1,636 3.3 20.8
Chemists 30,859 778 2.5 9.9Physicists/astronomers 18,251 858 4,7 10.9
Mathematical scientists 12,607 191 1.5 2.4Mathematicians 11,112 171 1.4 2.2
.e"
Statisticians 1,495 20 1.3 .3Computer specialists 2,914 110 3.8 1.4Environmental scientists 10,537 456 4.3 5.8
Earth scientists 8,688 293 3.4 3.7Oceanographers 1,166 108 j+9.3 1.4Atmospheric scientists 683 55 8.1 .7
Engineers \ 36,187 1,291 3.6 16.4Life scientists 1,794 8.0 22.8
Biological scientists 37,441 1,402 .3.7 17,9Agricultural. scientists 11,116_ 10g - .9 1.3Medical scientists s.... 10,793 287 2.7 3.7
Psychologists 26,087 1,187 4.6 15.1Social scientists 29,865 1,186 4.0 15.1
Economists 8,734 339 3.9 4.3Sociologists /anthropologists 6,781 216 3.2 2.8Other social scientists 14,350 681 4.4 8.0
No report 143 2 1.4
3414
V
Total24 or under25-2930-3435-3940-4445-4950-5455-5960-6465-6970 or over torNo report an
AGE Almost one-half (48.9 percnonprofit organizations were and
P.
Primary work a
tatYec
110-
951
71295147
866
TotalResearch and evel
Basic research...Applied researchDevelopment
Management oradministration
Of.R&DOf other than ROf,,both
TeachingConsultingSales/professionalOtherNo report
8701
16937
PRIMARY WORK ACTIVITY 0employed in . nonprofit organizagaged in research and developmement.
OFIT ORGANIZATIONS
toral cientists and engineersaniza t s were engineers,
O
Employed innonprofit organizations
yeti, NumberPercentof total Percent
7,853 3.5 100.010. 1,636 3.3 20.89 778 2:5 9.9
'51 858 4.7 10.97 19I-' 1.5 2.4
12 '171 1.4 2.295 , 20 1.3 ' .314 110 3.8 1.47 456 4-4.1 5.8
293 3.4 3.766 4- ,108 9.3 1.4
55 8.1 .787 1,291 3.6 16.40 1,794- 3.0 22.81 1,402 3.7 17.9
16 105 .9 1.393 287 2.7 3.737 1,187 4.6 15.1'5 1,186 4.0 15.1
34 : 339 3.9 4.3216 3.2 2.8631 4.4
2 1.48.0
14
, Employed in nonprofitY organizations
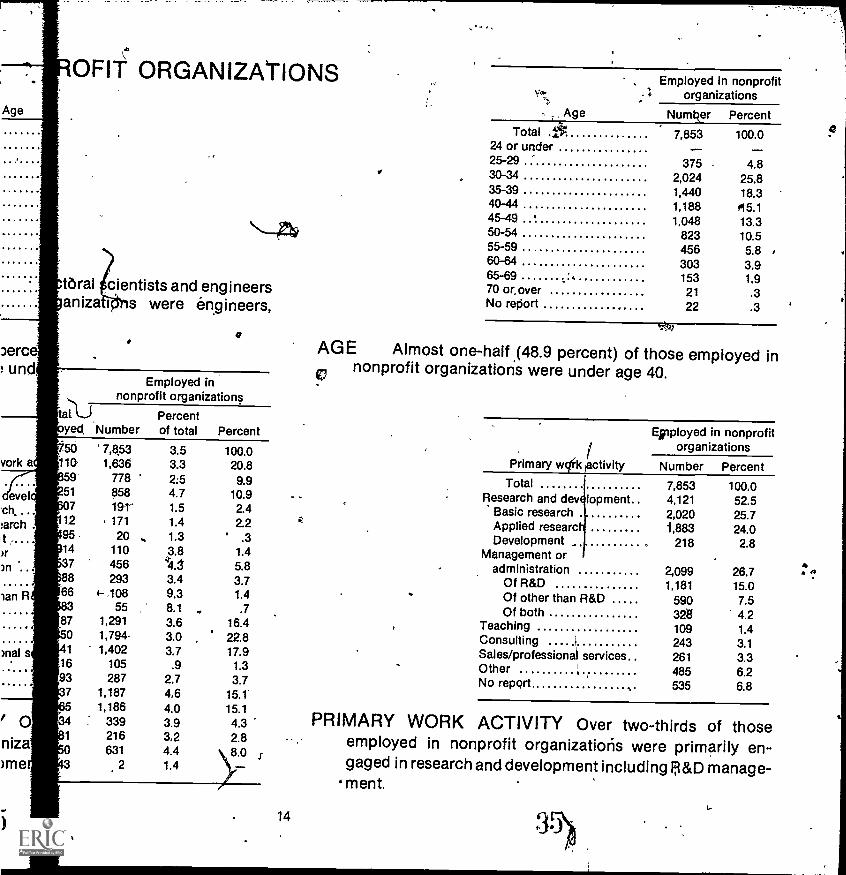
, Age Number PercentTotal .444g 7,853 100.0
24 or under25-29 375 4.830-34 2,024 25.835-39 1,440 18.340-44 1,188 015.145-49 1,048 13.350-54 823 10.555-59 456 5.860-64 303 3.965-69 153 1.970 or, over 21 .3No report 22 .3
AGE Almost one-half (48.9 percent) of those employed innonprofit organizations were under age 40.
Primary wk activity
Einployed in nonprofitorganizations
Number PercentTotal 7,853 100.0
Research and development.. 4,121 52.5Basic research 2,020 25.7Applied research i,883 24.0Development 218 2.8
Management oradministration 2,099 26.7
Aa
Of R&D 1,181 15.0Of other than R&D 590 7.5Of both 329 4.2
Teaching 109 1.4Consulting 243 3.1Sales/professiona services 261 3.3Other 485 6.2No repprt 535 6.8
PRIMARY WORK ACTIVITY Over two-thirds of thoseemployed in nonprofit organizations were primarily en-gaged in research and development including R &D manage-
. ment.
EMPLOYED IN TOE 'FEDERAL: GOVERNMENT
A
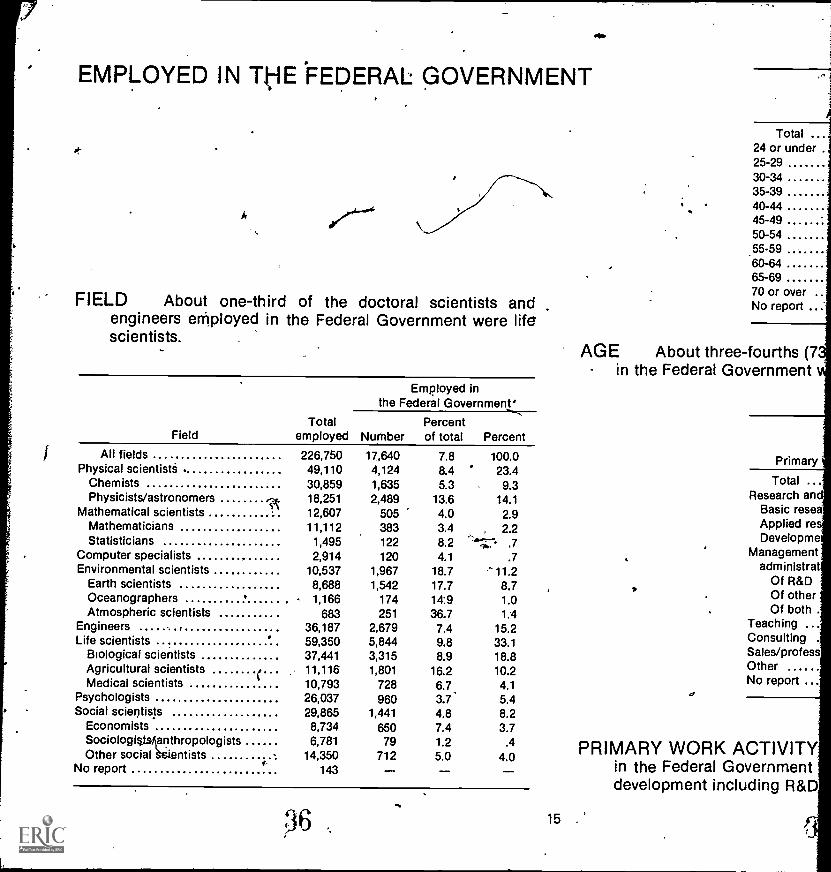
FIELD About one-third of the doctoral scientists andengineers employed in the Federal Government were lifescientists.
FieldTotal
employed
Employed inthe Federal Government'
NumberPercentof total Percent
All fields 226,750 17,640 7.8 100.0Physical scientists 49,110 4,124 8.4 23.4
Chemists 30,859 1,635 5.3 9.3Physicists/astronomers 18,251 2,489 13.6 14.1
Mathematical scientists 12,607 505 4.0 2.9Mathematicians 11,112 383 3.4 , 2.2Statisticians 1,495 122 8.2 -*"."'"" .7
Computer specialists 2,914 120 4.1 .7Environmental scientists 10,537 1,967 18.7 11.2
Earth scientists 8,688 1,542 17.7 8.7Oceanographers 1,166 174 14:9 1.0Atmospheric scientists 683 251 36.7 1.4
Engineers , 36,187 2,679 7.4 15.2Life scientists 59,350 5,844 9.8 33.1
Biological scientists 37,441 3,315 8.9 18.8Agricultural scientistsMedical scientists (
. 11,11610,793
1,801728
16.26.7
10.24.1
Psychologists 26,037 960 3.7' 5.4Social scientists 29,865 1,441 4.8 8.2
Economists 8,734 650 7.4 3.7SociologiO.Manthropologists 6,781 79 1.2 .4Other social .s,i.entists
#,14,350 712 5.0 4.0
No report 143 - - -
Total ...24 or under .
25-2930-3435-3940-4445-4950-54
_55-5960-6465-6970 or overNo report ...
AGE About three-fourths (7in the Federal Government
15 -
a
Primary
Total ...Research an
Basic reseaApplied resDevelopme
Managementadministrat
Of R&DOf otherOf both .
TeachingConsulting .
Sales/professOtherNo report
PRIMARY WORK ACTIVITYin the Federal Governmentdevelopment including R&D
E FEDERAL GOVERNMENT
ier .
....
of the doctoral scientists andthe Federal _Government were life
(7it
a
...an;seare
)meenttrat'SD
ierth
g'ess
TyitkD
Employed inthe Federal Government
Totalemployed Number
Percentof total Percent
226,750 17,640 7.8 100.049,110 4,124 8.4 23.430,859 1,635 . 5.3 9.318,251 2,489 13:6 14.112,607 505 4.0 2.911,112 383 3.4 2.2
1,495 122 8.2 .72,914 120 4.1 .7
10,537 1,967 18.7 11.28,688 1,542 17.7 8.71,166 174 14.9 1.0
683 251 36.7 1.436,187 2,679 7.4 15.259,350 5,844 9.8 33.137,441 ..,3,315 8.9 18.811,116 1,801 16.2 10.210,793 728 6.7 4.126,037 960 3.7 5.429,865 1,441 4.8 8.2
8,734 650 7.4 3.76,781 " 79 1.2 .4
14,350 712 5.0 4.0143 -
/15
I*
I* ,
,,
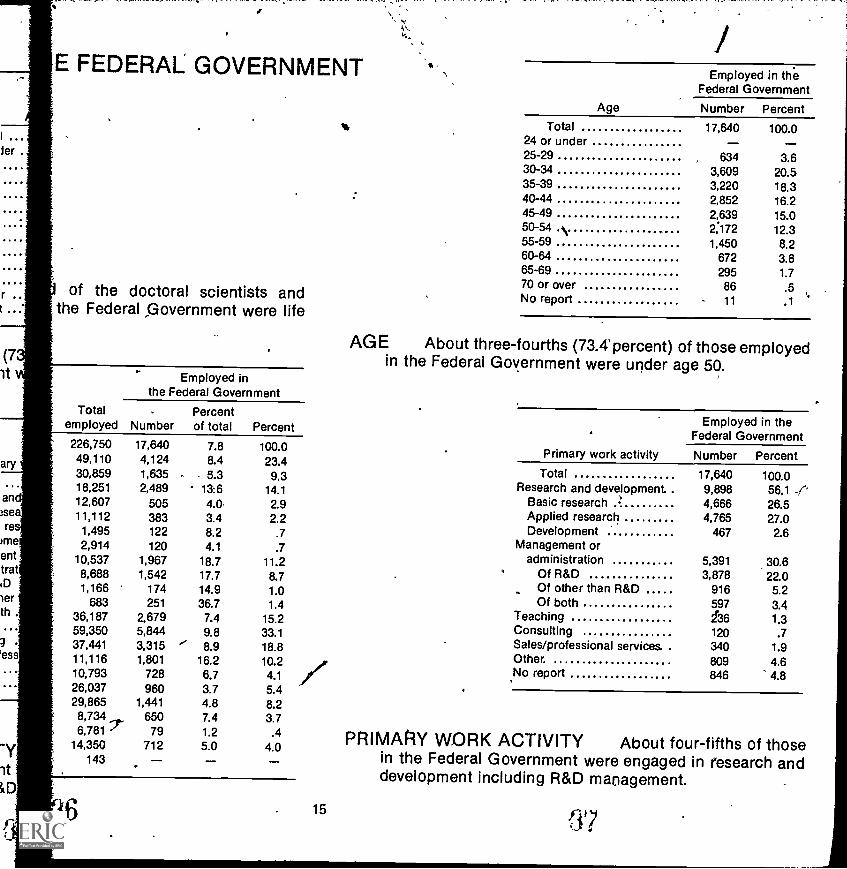
Age
Employed in theFederal Government
Number PercentTotal 17,640 100.0
24 or under25-29 634 3.630-34 3,609 20.535-39 3,220 18.340-44 2,852 16.245-49 2,639 15.050-54 2:172 12.355-59 1,450 8.260-64 672 3.865-69 295 1.770 or over 86 .5No report 11 .1
AGE About three-fourths (714'percent) of those employedin the Federal Government were under age 50.
Primary work activity
Employed in theFederal Government
Number PercentTotal 17,640 100.0
Research and development . 9,898 56.1 -I'Basic research 4,666 26.5Applied research 4,765 27.0Development 467 2.6
Management oradministration 5,391 30.6
Of R&D 3,878 22.0Of other than R&D 916 5.2Of both 597 3.4
Teaching 2'36 1.3Consulting 120 .7Sales/professional services. . 340 1.9Other. 809 4.6No report 846 4.8
PRIMARY WORK ACTIVITY About four-fifths of thosein the Federal Government were engaged in research anddevelopment including R&D management.
T
RECEIVING FEDERAL SUPPORT
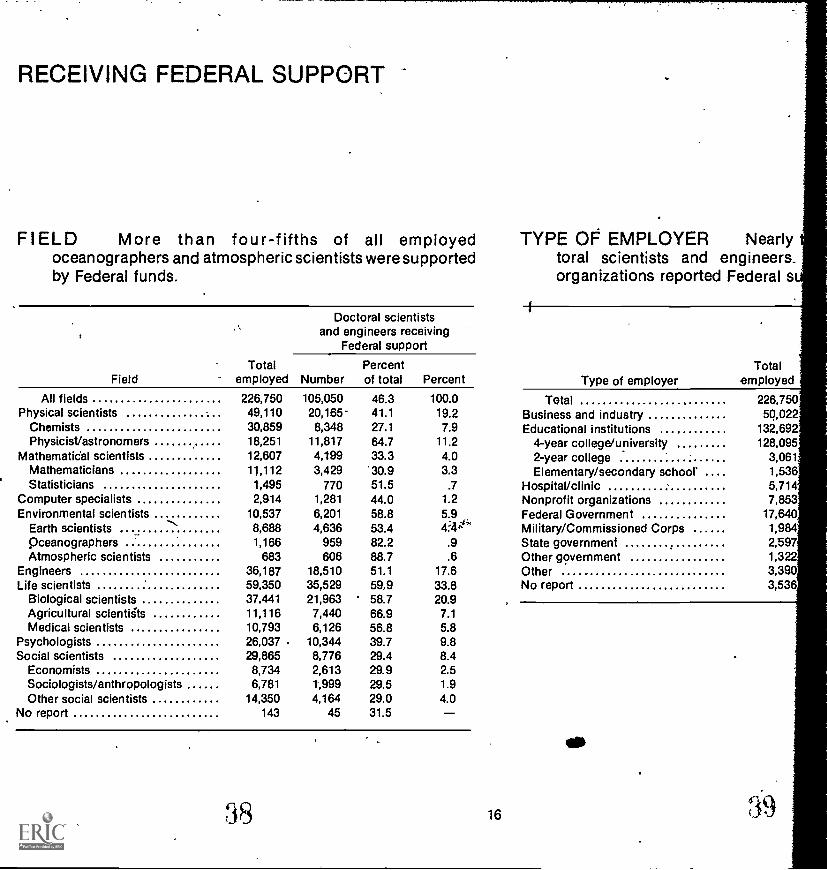
FIELD More than four-fifths of all employedoceanographers and atmospheric scientists were supportedby Federal funds.
Doctoral scientistsand engineers receiving
Federal support
TYPE OF EMPLOYER Nearlytoral scientists and engineers_organizations reported Federal s
FieldTotal
employed NumberPercentof total Percent Type of employer
Totalemployed
All fields 226,750 105,050 46.3 100.0 Total 226,750Physical scientists 49,110 20,165- 41.1 19.2 Business and industry 50,022
Chemists 30,859 8,348 27.1 7.9 Educational institutions 132,692Physicist/astronomers 18,251 11,817 64.7 11.2 4-year college/university 128,095
Mathematidal scientists 12,607 4,199 33.3 4.0 2-year college 3,061Mathematicians 11,112 3,429 '30.9 3.3 Elementary/secondary school' 1,536Statisticians 1,495 770 51.5 .7 Hospital/clinic 5,714
Computer specialists 2,914 1,281 44.0 1.2 Nonprofit organizations 7,853Environmental scientists 10,537 6,201 58.8 5.9 Federal Government 17,640
Earth scientists 8,688 4,636 53.4 4:44 Military/Commissioned Corps 1,9oceanographers 1,166 959 82.2 .9 State government 2,597Atmospheric scientists 683 606 88.7 .6 Other government 1,32
Engineers 36,187 18,510 51.1 17.6 Other 3,390Life scientists 59,350 35,529 59,9 33.8 No report 3,536
Biological scientists 37,441 21,963 58.7 20.9Agricultural scientists 11,116 7,440 66.9 7.1Medical scientists 10,793 6,126 56.8 5.8
Psychologists 26,037 10,344 39.7 9.8Social scientists 29,865 8,776 29.4 8.4
Economists 8,734 2,613 29.9 2.5Sociologists/anthropologists 6,781 ,999 29.5 1.9Other social scientists 14,350 4,164 29.0 4.0
No report 143 45 31.5
rly
I s
SUPPORT
,
-fifths of allwere
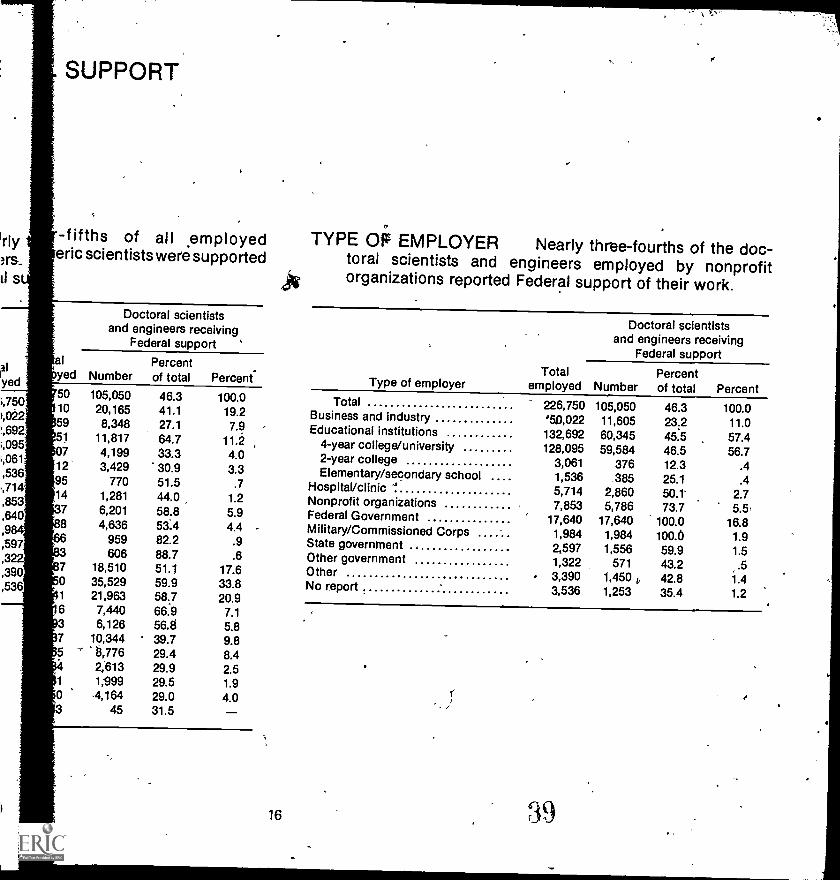
TYPE Oi EMPLOYER Nearly three-fourths of the doc-eric scientists were supported toral scientists and engineers employed by nonprofitA organizations reported Federal support of their work.
al
yed
Doctoral scientistsand engineers receiving
Federal support '
al Percentyed Number of total Percent
,750,022!,692,095,061,536.,714,853,640,9
,597,32,390,53
50105951
7129514
01
63
105,050 46.3 100.020,165 41.1 19.28,348 27.1 7.9
11,817 64.7 11.24,199 33.3 4.03,429 30.9 3.3
770 51.5 .71,281 44.0 1.26,201 58.8 5.94,636 53.4 4.4
959 82.2 .9606 88.7 .6
18,510 51.1 17.635,529 59.9 33.821,963 58.7 20.97,440 66.9 7.16,126 56.8 5.8
10,344 39.7 9.8`E4,776 29.4 8.4
2,813 29.9 2.51999 29.5 1.94,164 29.0 4.0
45 31.5
16
Type of employer
Doctoral scientistsand engineers receiving
Federal supportTotal
employed NumberPercentof total Percent
Total - 226,750 105,050 46.3 100.0Business and industry '50,022 11,605 23.2 11.0Educational institutions 132,692 60,345 45.5 57.4
4-year college/university 128,095 59,584 46.5 56.72-year college 3,061 376 12.3 .4Elementary/secondary school 1,536 385 25.1 .4
Hospital/clinic "" 5,714 2,860 50.1* 2.7Nonprofit organizations 7,853 5,786 73.7 5.5Federal Government 17,640 17,640 100.0 16.8Military/Commissioned Corps 1,984 1,984 100.6 1.9State government 2,597 1,556 59.9 1.5Other government 1,322 571 43.2 .5Other 3,390 1,450 , 42.8 1.4No report 3,536 1,253 35.4 1.2
39
wbmEN
FIELD
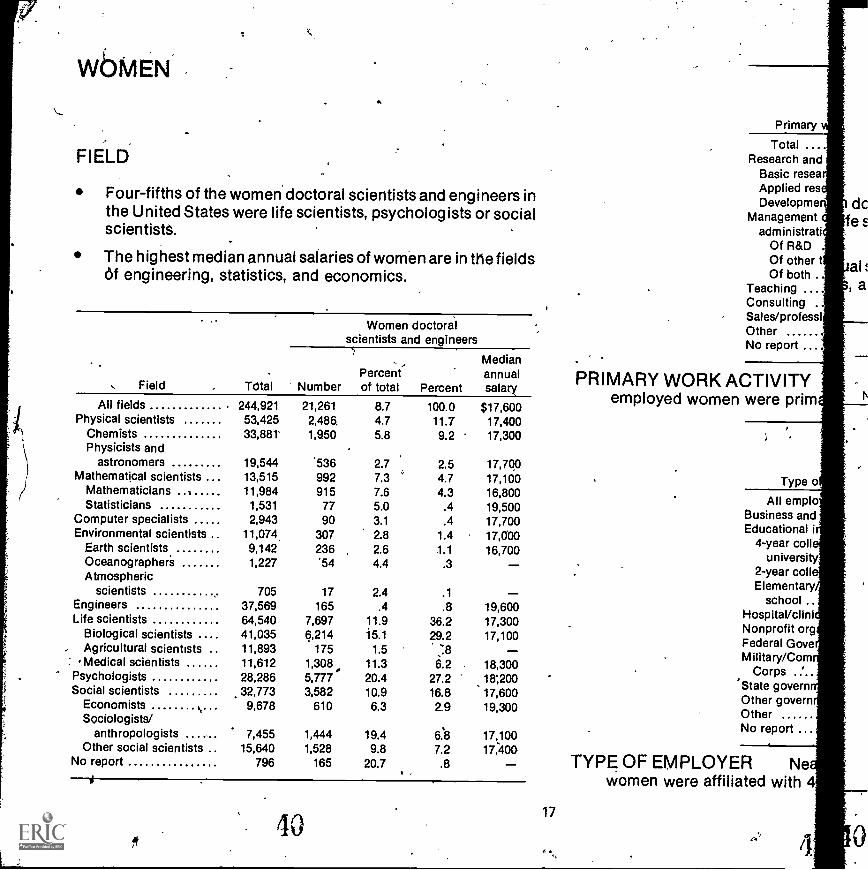
Four-fifths of the women doctoral scientists and engineers inthe United States were life scientists, psychologists or socialscientists.
The highest median annual salaries of women are in the fieldsOf engineering, statistics, and economics.
Women doctoralscientists and engineers
Median .
Percent' annual. Field TOW, Number of total Percent salary
All fields 244,921 21,261 8.7 100.0 $17,600Physical scientists 53,425 2,486. 4.7 11.7 17,400
Chemists 33,881- 1,950 5.8 9.2 17,300Physicists and
,
astronomers 19,544 '536 2.7 2.5 17,700Mathematical scientists 13,515 992 7.3 4.7 17,100
Mathematicians - 11,984 915 7.6 4.3 16,800Statisticians 1,531 77 5.0 .4 19,500
Computer specialists 2,943 90 3.1 .4 17,700Environmental scientists 11,074 307 2.8 1.4 17,0'00
Earth scientists. 9,142 236 2.6 1.1 16,700Oceanographers 1,227 '54 4.4 .3 -Atmospheric
scientists 705 17 2.4 .1 -Engineers 37,569 165 .4 .8 19,600Life scientists 64,540 7,697 11.9 36.2 17,300
Biological scientists 41,035 6,214 15.1 29.2 17,100, Agricultural scientists 11,893 175 1.5 :.8 -
,Medical scientists 11,612 1,308 11.3 6.2 18,300Psychologists 28,286 5,777 20.4 27.2 18;200Social scientists 32,773 3,582 10.9 16.8 17,600
Economists 1* 9,678 610 6.3 2.9 19,300Sociologists/
anthropologists 7,455 1,444 19.4 6.8 17,100Other social scientists 15,640 1,528 9.8 7.2 17,400
No report 796 165 20.7 .8 - TYPE OF EMPLOYER Newomen were affiliated with
Primary
Total ...Research and
Basic reseaApplied resDevelopme
Managementadministrati
Of R&DOf other tOf both ..
Teaching ...Consulting .
Sales/professiOtherNo report
PRIMARY WORK ACTIVITYemployed women were prim
Type o
All emploBusiness andEducational i
4-year coiluniversity
2-year coilElementary
school ..Hospital/cliniNonprofit orgFederal GoveM ilitary/Com
Corps .?..State governOther governOtherNo report
4017
''rnary
al ...ch and
reseaed reslopmeementnistratiR&Dother tboth .rig ...ting .
orofessi
doctoral scientists and engineers infe scientists, psychologists or social
art ..
rryprim
"ype o
at salaries of women are in the fields, and economics.
emplo;s andonal ir coltversityr collmtaryool ..1 /cliniit orgGove'Corn....
)vernDvern
rt ...
Neith
Women doctoral'scientists and engineers
Number*Percentof total Percent
Medianannualsalary
21,261 8.7 100.0 $17,6002,486 4.7 11.7 17,4001,950 5.8 9.2 17,300
536 2.7 2.5 17,700992 7.3 4.7 17,100915 7.6 4.3 16,800
77 5.0 .4 19,50090 3.1 ..4 17,700
307 2.8 1.4 17,000236 2.6 1.1 16,70054 4.4 .3
17 2.4, .1 . -165 .4 .8 19,600
7,697 11.9 36.2 17,3006,214 15.1 29.2 17,100
175 1.5 .81,308 11.3 6.2 18,3005,777 20.4 27.2 18,2003,582 10.9 16.8 17,600
610 6.3 2.9 19,300
1,444 19.4 6.8 17,1001,528 9.8 7.2 17,400
165 20.7 .8
17
Primary work activity ,
Employed womendoctoral scientists
and engineers.
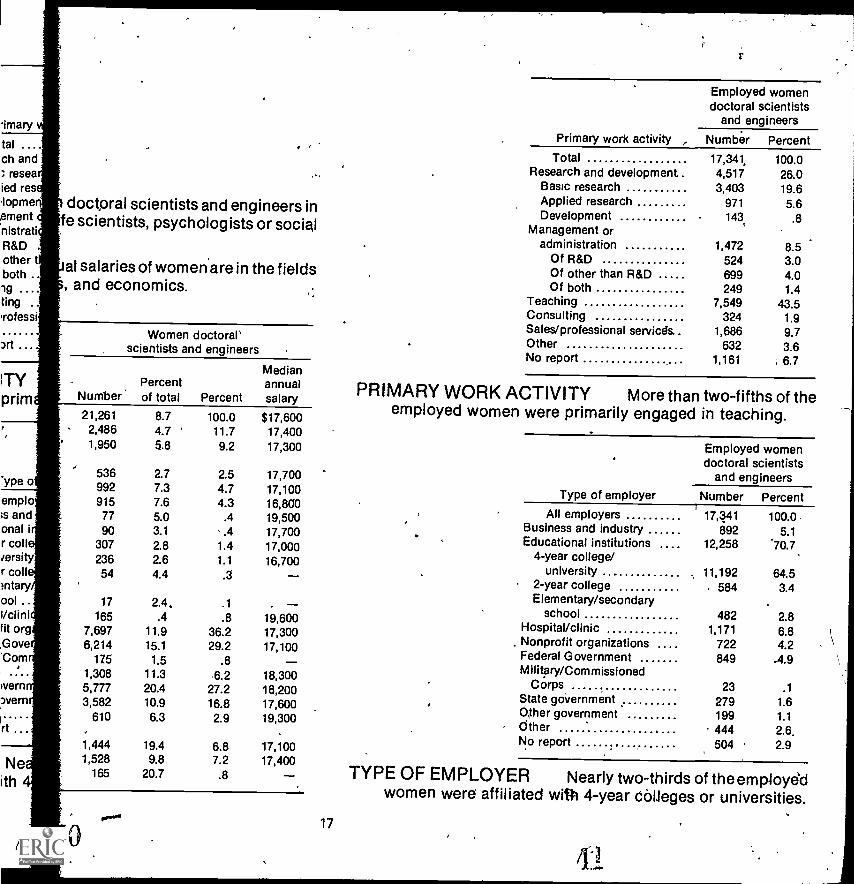
Number PercentTotal 17,341, 100.0
Research and development . 4,517 26.0Basic research 3,403 19.6Applied research 971 5.6Development 1435 .8
Management oradministration 1,472 8.5
Of R&D 524 3.0Of other than R&D 699 4.0Of both 249 1.4
Teaching 7,549 43.5Consulting 324 1.9Sales/professional servicils 1,686 9.7Other 632 3.6No report 1,161 i 6.7
PRIMARY WORK ACTIVITY More than two-fifths of theemployed women were primarily engaged in teaching.
Type of employer
Employed womendoctoral scientists
and engineers
Number PercentAll employers
t
17,341 100.0Business and industry 892 5.1Educational institutions 12,258 *70.7
4-year college/university 11,192 64.5
2-year college . 584 3.4Elementary/secondary
school 482 2.8Hospital/clinic 1,171 6.8Nonprofit organizations 722 4.2Federal Government 849 A.9Military/Commissioned
Corps 23 .1State government 279 1.6Other government 199 1.1Other 444 2.6.No report 504 2.9
TYPE OF EMPLOYER Nearly two-thirds of the employddwomen were affiliated with 4-year Colleges or universities.
41
'APPENDIXES /
A. Technical Notes
B. Detailed Statistical Tables
C.- Reproduction of the 1973Questionnaire and Specialities List
° NOTE
Appendix B, Detailed Statistical Tables, has been published separately and
may be- obtained gratis .from the NatiOnai ScienCe Foundation, Washington,D.C. 20550.
Page 27 carries a listing of these tables.
42
APPENDIX A
Techcal Notes
43
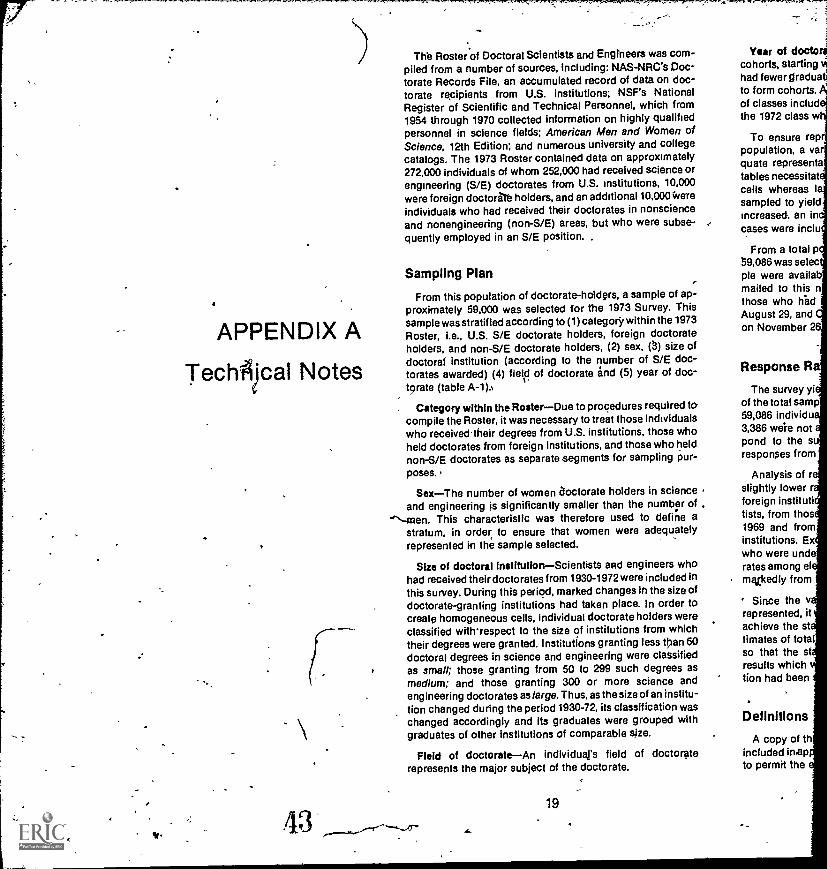
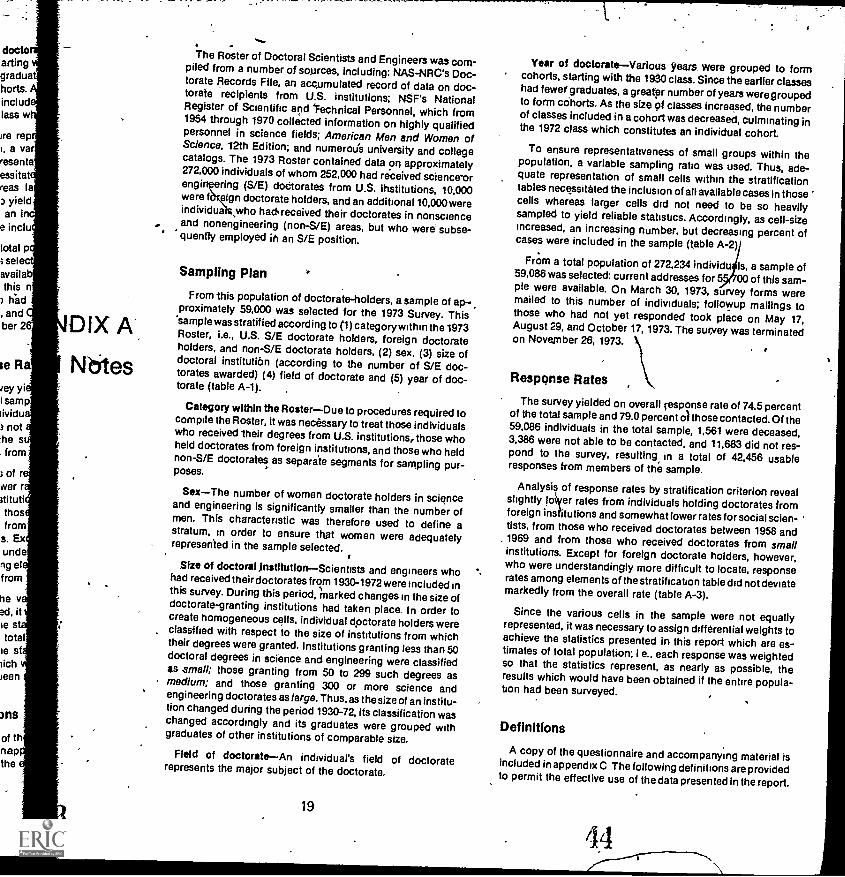
The Roster of Doctoral Scientists and Engineers was com-piled from a number of sources, including: NAS-NRC's Doc-torate Records File, an accumulated record of data on doc-torate recipients from U.S. institutions; NSF's NationalRegister of Scientific and Technical Personnel, which from1954 through 1970 collected information on highly qualifiedpersonnel in science fields; American Men and Women ofScience, 12th Edition; and numerous university and collegecatalogs. The 1973 Roster contained data on approximately272,000 individuals of whom 252,000 had received science orengineering (S/E) doctorates from U.S. institutions, 10,000were foreign doctorate holders, and an additional 10,000 Were
individuals who had received their doctorates in nonscienceand nonengineering (non-S/E) areas, but who were subse-quently employed in an S/E position. .
Year of doctoricohorts, starting IAhad fewer graduaelto form cohorts.of classes includthe 1972 class w
To ensure reppopulation, a vaquate representatables necessitatcells whereas Isampled to yieldincreased. an incases were inclu
From a total p59,086 was selec
Sampling Plan pie were avails
From this population of doctorate-holders, a sample of ap-mailed to this n
proximately 59,000 was selected for the 1973 Survey. Thisthose who ilk
sample was stratified according to (1) category within the 1973August 29, and
Roster, i.e., U.S. S/E doctorate holders, foreign doctorateon November
holders, and non-S/E doctorate holders, (2) sex, ( §) size ofdoctoral institution (according to the number of S/E doc-torates awarded) (4) field of doctorate and (5) year of doc- Response R
torate (table A-1)A The survey yi
Category within the RosterDue to procedures required to of the total samp
compile the Roster, it was necessary to treat those individuals 59,086 individu
who received-their degrees from U.S. institutions, those who 3,386 we're not
held doctorates from foreign institutions, and those who held pond to the s
non-S/E doctorates as separatesegments for sampling pur- responses from
poses. Analysis of r
SexThe number of women doctorate holders in science slightly lower r
and engineering is significantly smaller than the number of , foreign instituti
`'`then. This characteristic was therefore used to define a tists, from thos
stratum, in order to ensure that women were adequately 1969 and from
represented in the sample selected. institutions. Exwho were unde
Size of doctoral institution Scientists and engineers who rates among elhad received their doctorates from 1930-1972 were included in ma,kedly fromthis survey. During this period, marked changes in the size ofdoctorate-granting institutions had taken place. In order to ' Since the vcreate homogeneous cells, individual doctorate holders were represented, it
classified withrespect to the size of institutions from which achieve the st
their degrees were granted. Institutions granting less than 50 timates of total
doctoral degrees in science and engineering were classified so that the stas small; those granting from 50 to 299 such degrees as results which
medium; and those granting 300 or more science and tion had been
engineering doctorates as large. Thus, as the size of an institu-tion changed during the period 1930-72, its classification waschanged accordingly and its graduates were grouped with Definitionsgraduates of other institutions of comparable sjze. A copy of th
Field of doctorateAn individuals field of doctorate included inaprepresents the major subject of the doctorate. to permit the
19
doctoartingg r ad ua
harts.inctudlass w
ire rep1, a varresentaessitat'reas laI yieldan in
e incluw
total p3 selecavailathis ntied
, and,ber 2
ie Ra
,ey ysamp
lividunot
the sfrom
3 of rwer r3titutithosfroms. Exunderig elfrom
he ved, itie sttotal
ie sdch
)een
ms
of thnapthe
DIX A
Nbtes
.....
The Roster of Doctoral Scientists and Engineers was com-piled from a number of sources, including: NAS-NRC's Doc-torate Records File, an accumulated record of data on doc-torate recipients from U.S. institutions; NSF's NationalRegister of Scientific and 'Fechnical Personnel, Which from1954 through 1970 collected information on highly qualifiedpersonnel in science fields; American Men and Women ofScience, -12th Edition; and numerou's university and collegecatalogs. The 1973 Roster contained data or approximately272,000 individuals of whom 252,000 had received science-orengi ring (S/E) doctorates from U.S. institutions, 10,000were feign doctorate holders, and an additional 10,000 wereindividua who hadreceived their doctorates in nonscience, and nonengineering (non-S/E) areas, but who were subse-quently employed in an S/E position.
Sampling Plan
From this population of doctorate-holders, a sample of ap-,,proximately 59,000 was selected for the 1973 Survey. This
'sample was stratified according to (1) category within the 1973Roster, i.e., U.S. S/E doctorate holders, foreign doctorateholders, and non-S/E doctorate holders, (2) sex, (3) size ofdoctoral institution (according to the number of S/E doc-torates awarded) (4) field of doctorate and (5) year of doc-torate (table A-1).
Category within the RosterDue to procedures required tocompile the Roster, it was necessary to treat those individualswho received their degrees from US. institutions, those whoheld doctorates from foreign institutions, and those who heldnon-S/E doctorates as separate segments for sampling pur-poses.
SexThe number of women doctorate holders in scienceand engineering is significantly smaller than the number ofmen. This characteristic was therefore used to define astratum, in order to ensure that women were adequatelyrepresented in the sample selected.
She Of doctoral institutionScientists and engineers whohad received their doctorates from 1930-1972 were included inthis survey. During this period, marked changes in the size ofdoctorate-granting institutions had taken place. In order tocreate homogeneous cells, individual doctorate holders wereclassified with respect to the size of institutions from whichtheir degrees were granted. Institutions granting less than 50doctoral degrees in science and engineering were classifiedas small; those granting from 50 to 299 such degrees asmedium; and those granting 300 or more science andengineering doctorates as large. Thus, as the size of an institu-tion changed during the period 1930-72, its classification waschanged accordingly and its graduates were grouped withgraduates of other institutions of comparable size.
Field of doctorateAn individual's field of doctoraterepresents the major subject of the doctorate.
19
Year of doctorateVarious YeatS. Were grouped to formcohorts, starting with the 1930 class.Since the earlier classeshad fewer graduates, a greater number of years weregroupedto form cohorts. As the size 91 classes increased, the numberof classes included in a cohort was decreased, culminating inthe 1972 class which constitutes an individual cohort.
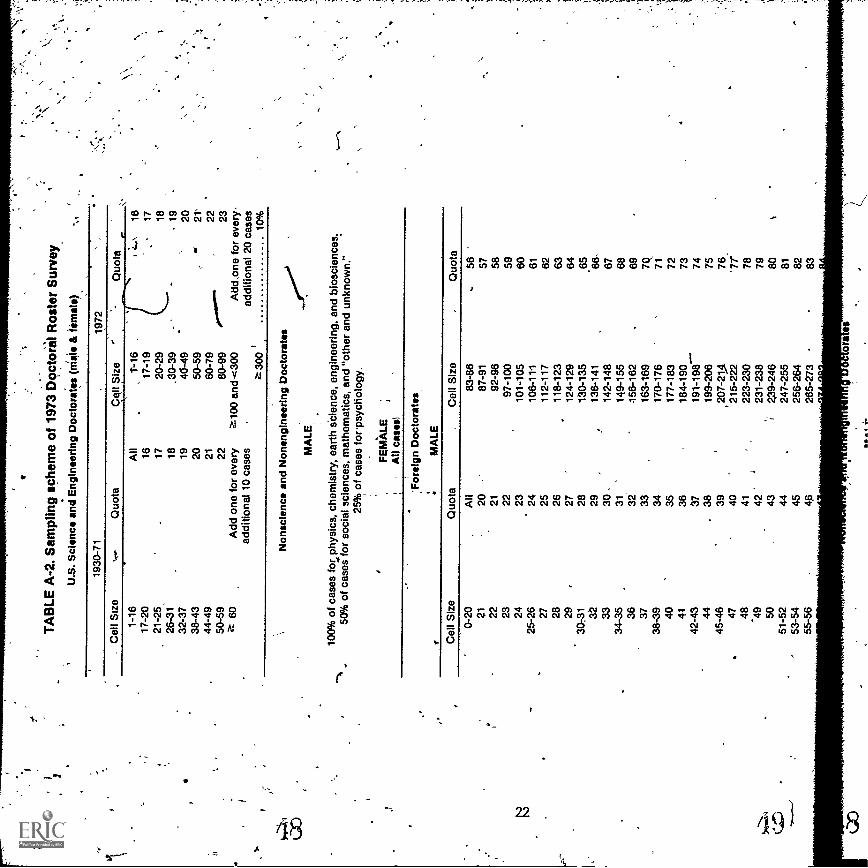
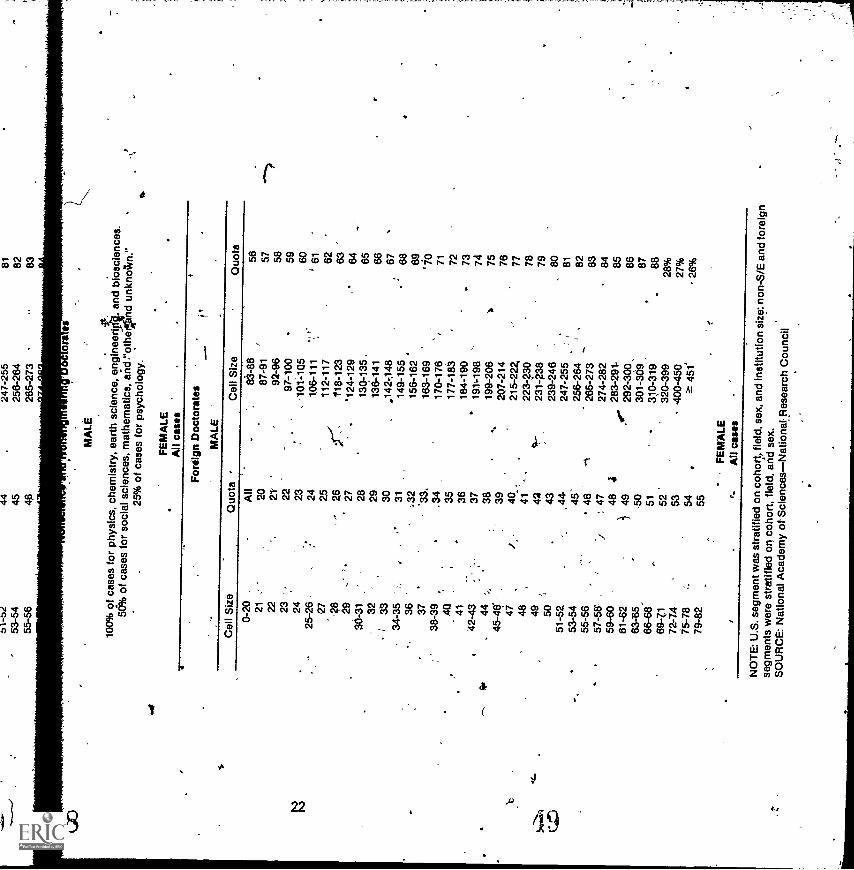
To ensure representativeness of small groups within thepopulation, a variable sampling ratio was used. Thus, ade-quate representation of small cells within the stratificationtables necessitated the inclusion of all available cases In thosecells whereas larger cells did not need to be so heavilysampled to yield reliable statistics. Accordingly, as cell-sizeincreased, an increasing number, but decreasing percent ofcases were included in the sample (table A-2)
From a total population of 272,234 individu Is, a sample of59,086 was selected: current addresses for 00 of this sam-ple were available. On March 30, 1973, survey forms weremailed to this number of individuals; followup mailings tothose who had not yet responded took place on May 17,August 29, and October 17, 1973. The survey was terminatedon November 26, 1973. 1,
Response Rates
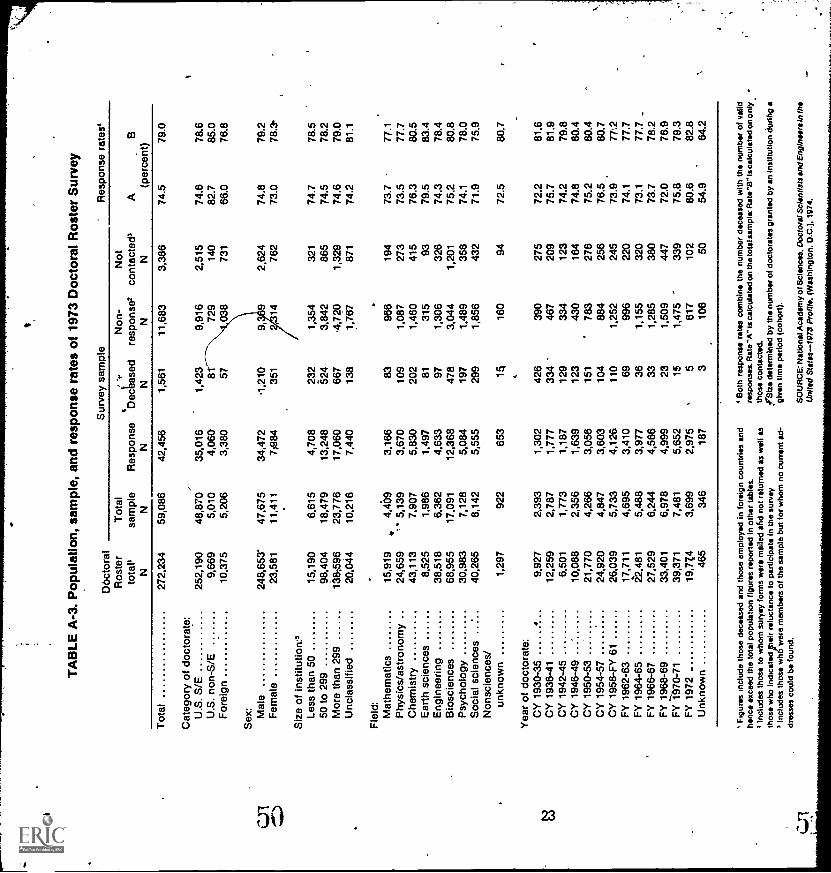
The survey yielded on overall response rate of 74.5 percentof the total sample and 79.0 percent oIthose contacted. Of the59,086 individuals in the total sample, 1,561 were deceased,3,386 were not able to be contacted, and 11,683 did not res-pond to the survey, resulting, in a total of 42,456 usableresponses from members of the sample.
Analysi of response rates by stratification criterion revealslightly lo er rates from individuals holding doctorates fromforeign ins and somewhat lower rates for socialscien-tists, from those who received doctorates between 1958 and1969 and from those who received doctorates from smallinstitutions. Except for foreign doctorate holders, however,who were understandingly more difficult to locate, responserates among elements of the stratification table did not deviatemarkedly from the overall rate (table A-3).
Since the various cells in the sample were not equallyrepresented, it was necessary to assign differential weights toachieve the statistics presented in this report which are es-timates of total population; i e., each response was weightedso that the statistics represent, as nearly as possible, theresults which would have been obtained if the entire popula-tion had been surveyed.
Definitions
A copy of the questionnaire and accompanying material isincluded in appendix C The following definitions are providedto permit the effective use of the data presented in the report.
Field of science or engineering-I-The date on field werederived from responses to question 17 which requested thename and code number of the specialtyselected from theSpecialties List included with the questionnairemost closelyrelated to the respondents principal employment. The group-ing of specialties to form fields was accomplished in confor-mance with the scheme presented in tableA-4. Individuals fail-ing to respond to question 17 were assigned the specialty oftheir doctorate degree listed in item 9.
This field definition, which is used in all of the statisticaltables presented in this report, differs from the field definitionsused by the Commission on Human Resources in their report'based on this sure Care should therefore be exercised incomparing data from ese sources.
Type of employerDerived from question 15. The term"Educational institutions" includes junior colleges, 2-yearcolleges, technical institutes, medical schools, 4-yearcolleges or universities, and elementary or secondary schools.
Geographic locatiOnState data were derived fromresponses to question 11 on the location of employment. In-dividuals not reporting place of employment or not employedwere classified by their mailing address.
University or 4-year college teachersDefined as those in-dividuals who reported :'4-year college or university, otherthan medical school" as their type of principal employer underquestion 15 and also reported "teaching" as-their primary orsecondary work activity under item 16,
Primary work activityDerived from responses to question16. The term "development" encompasses the development ofequipment, products, systems or data. "Sales/ProfessionalServices" includes sales, marketing, purchasing, estimating,and professional services to individuals but excludes con-sulting which is treated as a separate work activity. The workactivities listed under question 16 as "report or other technicalwriting, editing," "production," "quality control, inspection,and testing," have been aggregated with "other" to form asingle category.2
Race=Derived from respohses to question 7. Respondentsreporting "East Indian" as their race were tabulated separatelyand in number tables, they were aggregated with Asians to
National Academy of Sciences. Doctoral Scientists and Engineers in the UnitedSlates: A 1273 Profile. (Washington, D C C. 1974.)
This calegotyls omitted from an salary tables.
45
form a single category labelled "Miens," in salary tables,"Orientals" and "East Indians" are listed separately.
SalariesDerived from responses to question 12 which re-quested information regarding annual salary before deduc-tions for income tax, social security, retirement, etc.. but ex-cluding bonuses, overtime, summer teaching or other pay -merit for professional work. Salaries reported are median an-nual salaries, rounded to the nearest $100 and computed forfull-time employed civilian scientists and engineers only.Differences between calendar year (11 to 12 months) andacademic year (9 to 10 months) salaries for scientists andengineers employed in educational institutions have been ac-cortdated by multiplying academic year salaries by 11/ 9 toadjus o a calendar-year scale ,t,
SOurces of Error
No definitions or limitations, except for salary questions,were provided to the respondents since the terms _used in thequestionnaire were considered to be meaningful to doctoralscientists and engineers. A classifitation structure was includ-ed with the questionnaire to allow resporsisclor to identify thescience or engineering specialties a ted with their
urrentempioyment and academic degrees. Experience withprevious surveys of this population has revealed that nosignificant bias is introduced using this approach.
Part of the information collected was processed usingkeypunching operations. In order to eliminate as manykeypunching errors as possible, a process of 100-percentverification was utilized. The remainder of the informationcollected was reduced to magnetic tape by use of an opticalmark reader. Several visual examinations of completedquestionnaires were used as a basis for calibrating the opticalmark reader to accommodate penciled responses of variousdensities, thereby holding errors to a minimum.
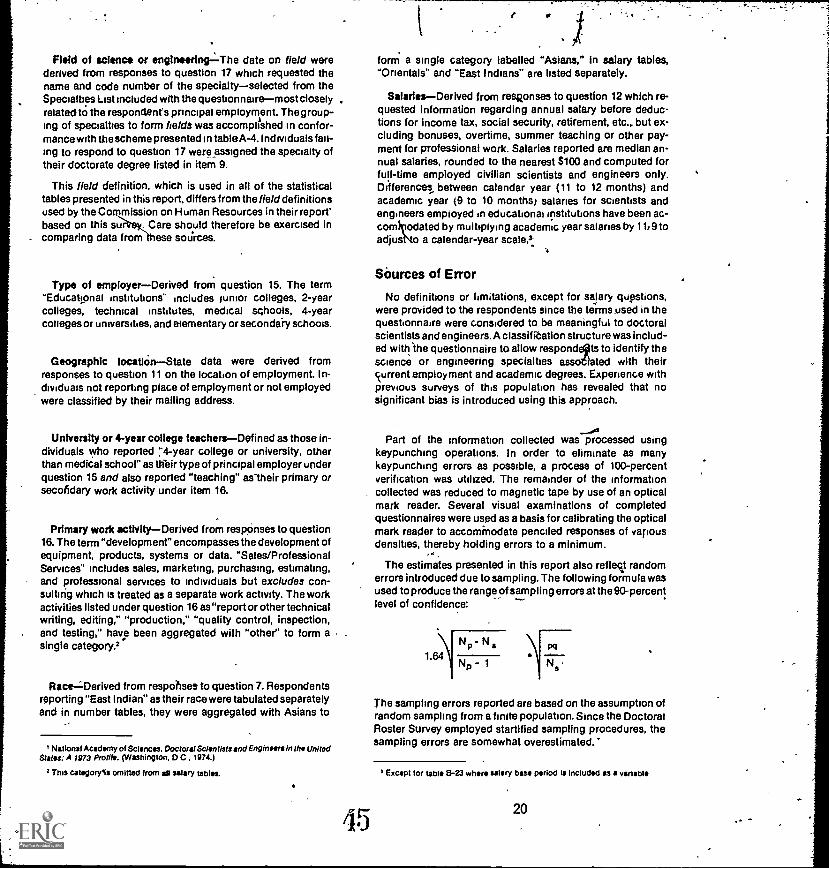
The estimates presented in this report also refleit randomerrors introduced due to sampling. The following formula wasused to produce the range of sampling errors at the 90-percentlevel of confidence:
N - Ns
Np 1
pQ
Ns
The sampling errors reported are based on the assumption ofrandom sampling from a finite population. Since the DoctoralRoster Survey employed startified sampling procedures, thesampling errors are somewhat overestimated.
Except for table B-23 whore salary base period is included as a variable
20
s e
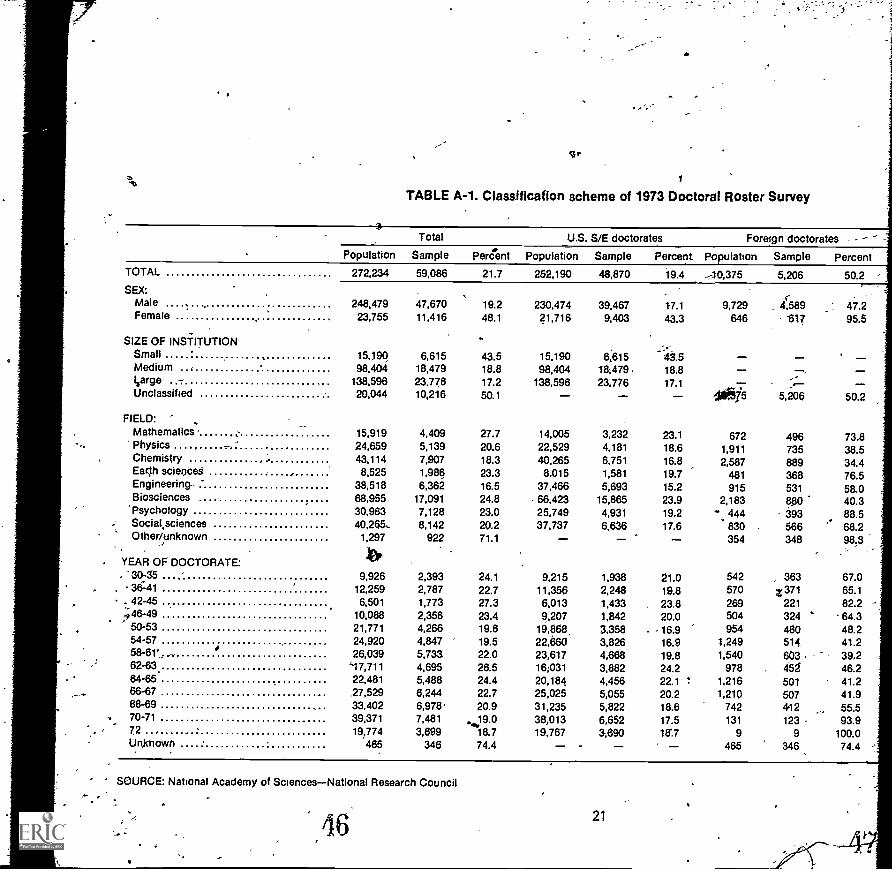
TABLE A-1. Classification scheme of 1973 Doctoral Roster Survey
Total U.S. StE doctorates Foreign doctorates -Population Sample Pera.ent Population Sample Percent Population Sample Percent
TOTAL 272,234 59,086 21.7 252,190 48,870 19.4 -40,375 5,206 50.2
SEX:Male . ,Female
SIZE OF INSTITUTIONSmall ' ,Medium ,
I,arge -Unclassified
FIELD:MathematicsPhysics --.
ChemistryEagh sciences , .
Engineering-Biosciences
'PsychologySocial sciencesOther/unknown
YEAR OF DOCTORATE:, 30-35
. 364142-45
446-4950-5354-5758-61'62-63.64-6566-6768-6970-7172Unknown
248,479 47,670 19.223,755 11,416 48.1
.15,190 6,615 43.598,404 18,479 18.8
138,596 23.776 17.220,044 10,216 so. 1
15,919 4,409 27.724,659 5,139 20.643,114 7,907 18.3
8,525 1,986 23.338,518 6,362 16.568,955 17,091 24.830,983 7,128 23.0
- 40,265, 8,142 20.21,297 922 71.1
4>.
9,926 2,393 24.112259 2,787 22.7
6,501 1,773 27.310,088 2,356 23.421,771 4,266 19.624,920 4,847 19.526,039 5,733 22.0
17,711 4,695 26.522,481 5,488 24.4,27,529 6,244 22.733,402 6,978. 20.939,371 7,481 ,,...19.019,774 3,699 18.7
465 346 74.4
' SOURCE: National Academy of Sciences-National Research Council
46
230,474 39.467 17.1 9,729 4,589 = 47.221,716 9,403 43.3 646 -617 95.5
15.190 6615_..
43.5 -98,404 18;479 . 18.8 - 7 -
138,596 23,776 17.1 ..- -- - - 75 5,206 50.2
14,005 3,232 23.1 672 496 73.822,529 4,181 18.6 1,911 735 38.540,265 6,751 16.8 2587 889 34.4
8.015 1,581 19.7 481 368 76.537,466 5,693 15.2 915 531 58.066,423 15,865 23.9 2,183
f.:1150 40.325,749 4,931 19.2 - 444 393 88.537,737 6,636 17.6 830 566 68.2- - - 354 348 98.3
9,215 1,938 21.0 542 363 67.011,356 2,248 19.8 570 t 371 65.16,013 1,433 , 23.8 269 221 82.29,207 1,842 20.0 504 324 64.3
19,868, 3,358 . -16.9 954 460 48.222,660 3,826 16.9 1,249 514 41.223,617 4,668 19.8 1,540 603 39.216;031 3,882 24.2 978 45g 46.220,184 4,456 22.1 ! 1,216 501 41.225,025 5,055 20.2 1,210 507 41.931,235 5,822 18.6 742 412 55.538,013 6,652 17.5 131 123 93.919,767 3,690 16.7 9 9 100.0- - - 465 346 74.4
21
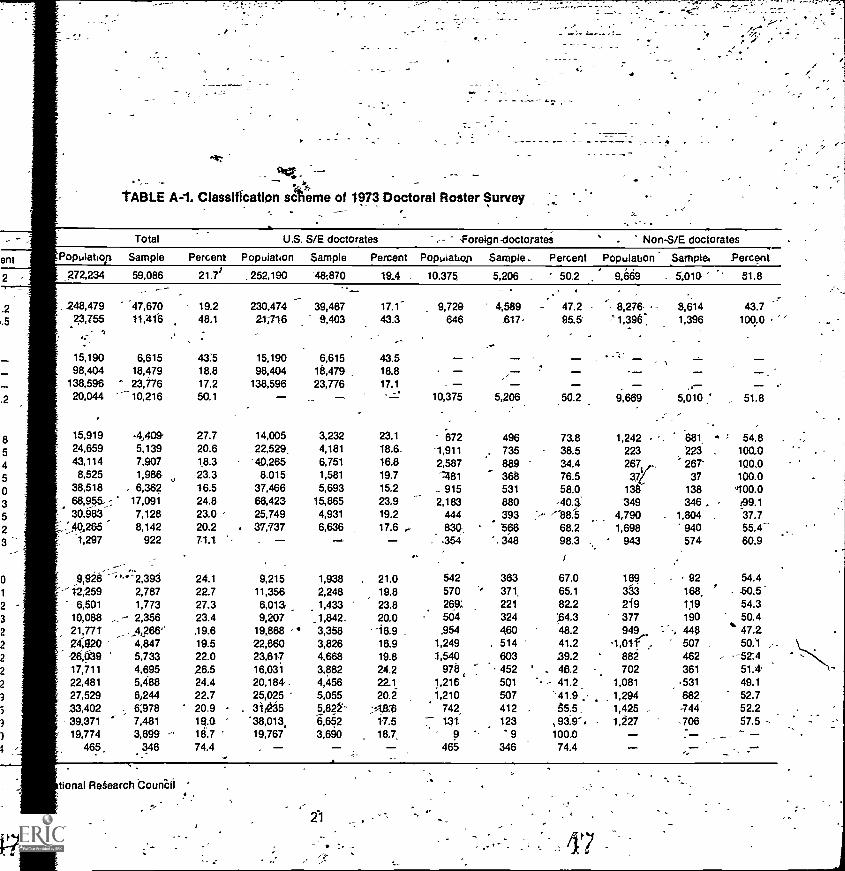
'ABLE A=1. Classification sc eme of 1973 Doctoral Roster Survey
.
ern
Total
Populatiop Sample Percent Population Sample Percent Populatiop Sample . Percent Population Sample. Percent
50.2 9.669 , 5,010 51.8II .
47.2 8,276- 3,514 43.795.5 '1,396 1,396 100.0
..
U.S. S/E doctorates foreign -doctorates ' . Non-S/E doctorates
2 272,234 59,086 21.71 252,190 481870 19A 10.375 5,206 .
..- - ____ _ .
.2 .248,479 "47,670 19.2 230,474 39,467 17.1- 9,729 4,589
.5 23 '755. .
11,4f6 48.1 21,716 9,403 43.3 646 1317,
15,190 6,615 43:5 15,190 6,615 43498,404 18,479 18.8 98,404 16,479 , 18.8 -
138,596 ' 23,776 17.2 138,596 23,776 17.1 -.2 20,044
--10,216 50.1 - - - 10,375 5,206
8 15,919 -4,409- 27.7 14,005 3,232 23.1 672 496
5 24,659 5,139 20.6 22,529 4,181 18.6_ 1,911 . 735
4 43,114 7,907 18.3 40,265 6,751 16.8 2,587 889
5 8,525 1,986 23.3 8.015 1,581 19.7 -:481 363
0 38,518 , 6,362 16.5 37,466 5,693 15.2 _ 915 531
3 68,954_ -, 17,091 24.8 66,423 15,865 23.9 2,183 880
5 30,983 7,128 23.0 25,749 4,931 19.2 444 393
2 10.265 8,142 20.2 . 37,737 6,636 17.6 . 834, 5661,297 922 7-1.1 - - - - . .354 ''. 348
0 9,926 ` 2,393 24.1 9,215 1,938 . 21.0 542 363
1 -- 12,259 2,787 22.7 11,356 2,248 19.8 570 " 371,
2 6,501 1,773 27.3 6,013, 1,433 23.8 269: 221
3 10,088 .. - 2,356 23.4 9,207 _1,842. 20.0 504 324
2 21,771 .4,266' .19.6 19,868 -- ' 3,358 -'16.9 .954 4602 24,920 4,847 19.5 22,660 3,826 16.9 1,249 . 514 '
2 26,439 5,733 22.0 23,617 4,668 19.8 1,540 603
2 17,711 4,695 26,5 16,031 3,882 24.2 976 ' 452 '
2 22,481 5,488 24.4 20,184- 4,456 22.1 1,216 501
3 27,529 6,244 22.7 25,025 5,055 20.2 1,210 507
3 33,402 6;978 20.9 31,235 5,822- ;15:6 742 412
3 39,371 7,481 19.G '38,013, 6,652 17.5 7 1.51 123
3 19,774 3,699 { 18.7 19,767 3,690 18.7 9, 465 346._. 74.4 , - - - 465 346
- - ...,_
7 - -- - .- -50.2 9,669 5,010 ' , 51.8
73.8 1,242 . 681 - ; 54.838.5 223 223 100.034.4 267 267' 100.076.5 37
t37 100.0
58.0 1 138 100.0-40.3: 349 346 09.1
., -88.5 4,790 1,804 37.768.2 1,698 940 55.*98.3 943 574 60.9
67.0 169 92 54.465.1 333 168, f - -50.582.2 219 119 54.3;64.3 377 190 50.448.2 949, -- ',. 440 ' 47.241.2 -1,01f __ 507 50.1 ,39.2 882 462 .- -52-.4462. 702 361 51.
- 41.2 1,081 531 49.1'41.9 . 1,294 682 52.7
65.5. 1,425. 744 52.2,93.9'. - 1,227 ,706 57.5100.0 - . - -74.4 - -
tional Research 'Courtail
21
17
.
TA
BLE
A-2
. Sam
plin
g sc
hem
e of
197
3 D
octo
ral R
oste
r Sur
vey
.U
.S. S
cien
ce a
nd E
ngin
eerin
g D
octo
rate
s (M
ale
& ti
msl
i)
.
'..\ \
.
\.
%..
1930
-71
1972
Cel
l Siz
e...
..Q
uota
Cel
l Siz
eQ
uota
.-,;,
,\
1-16
All
t-16
$4.
...\
1617
-20
1617
-19
-,
.17
21-2
5.17
20-2
918
26-3
118
.30-
3919
32-3
719
40-4
920
38-4
320
50-5
9"'
21'
44-4
921
60-7
922
50-5
922
80-9
9ow
"-...
..".
23?-
' 60
Add
one
for
ever
yX
100
and
-c30
0A
dd,o
ne fo
r ev
ery
addi
tiona
l 10
case
si
addi
tiona
l 20
case
s30
01
10%
Non
scle
nce
and
Non
engl
neer
ing
Doc
tora
tes
MA
LE
100%
of c
ases
foLp
hysi
cs, c
hem
istr
y, e
arth
sci
ence
, eng
inee
ring,
and
bio
scie
nces
.50
% o
f cas
es fo
r so
cial
sci
ence
s, m
athe
mat
ics,
and
"ot
her
and
unkn
own.
"25
% o
f cas
es fo
r ps
ycho
logy
.
FE
MA
LE,
All
case
d
.
'For
eign
Doc
tora
tes
MA
LE
Cel
l Siz
eQ
uota
Cel
l Siz
eQ
uota
0-20
All
83-8
6n.
56'
2120
87-9
157
i"22
2192
-96
5823
2297
-100
59
N24
25-2
623 24
101-
105
106-
111
60 6127
2511
2-11
762
2826
118-
123
6329
.27
124-
129
6430
731
2818
0-13
565
3229
136
-141
66,
3330
142-
148
6734
-35
3114
9-15
568
3632
'15
8-16
269
3733
163-
169
7Q38
-39
3417
0-17
671
4035
177-
183
7241
3618
4-19
073
42-4
337
191-
198
7444
3819
9-20
675
45-4
639
-21
7647
40}2
07 215-
222
'77'
4841
223-
230
78.
-....
4942
231-
238
79'o
w,.
5043
r23
9-24
680
N
51-5
244
247-
255
81,-
......
.53
-54
4525
6-26
482
55-5
648
265-
273
83
b1 -51
4424
7-25
581
'53
-54
4525
6-26
482
55-5
640
265-
273
83
MA
LE
ore
es
.10
0% o
f cas
es fo
r ph
ysic
s, c
hem
istr
y, e
arth
scie
nce,
9ng
inee
ri. a
nd b
iosc
ienc
es.
50%
of c
ases
for
soci
alsc
ienc
es, m
athe
mat
ics,
and
;'oth
eind
unk
nam
."25
% o
f cas
es fo
r ps
ycho
logy
.
FE
MA
LEA
ll ca
ses
For
eign
Doc
tora
tes
MA
LE'
Cel
l Siz
e
0-20 21
,22 23 24
25-2
627
30-3
1 32 3334
-35 36 37
'
38-3
9d4
0
4142
-43 44
45-4
8' 47 48 49 5051
-52
53-5
455
-56
57-5
8,59
-60
61-6
2
63-1
55,
66-6
869
-71
72,7
475
-78
79-8
2
Quo
ta
All 20 21'
22 23 24 25 26 27 28 29 30 31 :32 33,
.34 35 36 37 38 39 40_
41 42 43 ,44 45
'46 47 48
449 50 51 52
'
53 54 55
FE
MA
LEA
ll ca
ns
Cel
l Siz
e
83 -
8687
-91
92-9
697
-100
-101
.-10
51.
06-1
1111
2-11
711
8-12
3'1
24-1
2913
0-13
5 .
136-
141
042-
148
149-
155
156-
162
163-
169
170-
176
177-
183
184-
190
191-
198
199-
206
207-
214
215-
222,
223-
230
231-
238
239-
246
247-
255
,
256-
264
265-
273
274-
282
283
-291
-29
2 -3
0030
1-36
931
0-31
932
0-39
940
0-45
045
1'
Quo
ta
56 57 58 59 60' 6
1 62 63 64 65 66 67,
68 69 JO 71 72 73 74 75 76 77 78 79 80 81 82 83 84 85 86 87 8828
%27
%26
%
NO
TE
: U.S
. seg
men
t Was
str
atifi
ed o
nco
hort
, fie
ld, s
ex, a
nd in
stitu
tion
size
: non
-S/E
and
fore
ign
segm
ents
wer
e st
ratif
ied
on c
ohor
t, fie
ld, a
nd s
ex.
SO
UR
CE
: Nat
iona
l Aca
dem
y of
Sci
ence
sN
atio
nal;
esea
rch
Cou
ncil
TA
BLE
A-3
. Pop
ulat
ion,
sam
ple,
and
res
pons
e ra
tes
of 1
973
Doc
tora
l Ros
ter
Sur
vey
Doc
tora
lR
oste
rto
tal'
N
Sur
vey
sam
ple
Res
pons
e ra
tes'
Tot
alsa
mpl
eN
Res
pons
eN
Decinsed
N
Non
-re
spon
se'
N
Not
cont
acte
d'N
AB
(per
cent
)T
otal
272,
234
59,0
8642
,456
1,56
111
,683
3,38
674
.579
.0
Cat
egor
y of
doc
tora
te:
U.S
. S/E
252,
190
48,8
7035
,016
1,42
39,
916
2,51
574
.678
.6U
.S. n
on-S
/E9,
669
5,01
04,
060
81-
729
140
82.7
85.0
For
eign
10,3
755,
206
3,38
057
038
731
66.0
76.8
Sex
:
C.T
1M
ale
248,
653'
47,6
7534
,472
,210
9,9
2,62
474
.879
.2F
emal
e23
,581
11,4
1171
984
351
1476
273
.078
.3-
Siz
e of
inst
itutio
n:'
Less
than
50
15,1
906,
615
4,70
823
21,
354
321
74.7
78.5
50 to
299
98,4
0418
,479
13,2
4852
43,
842
865
74.5
78.2
Mor
e th
an 2
9913
8596
23,7
7617
,060
667
4,72
01,
329
74.6
79.0
Unc
lass
ified
20,0
4410
,216
7,44
013
81,
767
871
74.2
81.1
Fie
ld:
Mat
hem
atic
s15
,919
4,40
93,
166
8396
619
473
.777
.1
Phy
sics
/ast
rono
my
24,6
59'*
5,1
393,
670
109
1,08
727
373
.577
.7C
hem
istr
y43
,113
7,90
75.
830
202
1,46
041
576
.380
.5E
arth
sci
ence
s8,
525
1,98
61,
497
8131
593
79.5
83.4
Eng
inee
ring
38,5
186,
362
4,63
397
1,30
632
674
.378
.4B
iosc
ienc
es68
,955
17,0
9112
,368
478
3,04
41,
201
75.2
80.8
Psy
chol
ogy
30,9
837,
128
5,08
419
71,
489
358
74.1
78.0
Soc
ial s
cien
ces
40,2
658,
142
5,55
529
91,
856
432
71.9
75.9
Non
scie
nces
/un
know
n1,
297
922
653
1416
094
72.5
80.7
Yea
r of
doc
tora
te:
,
CY
193
0-35
'9,
927
2,39
31,
302
426
390
275
72.2
81.6
CY
193
6-41
12,2
592,
787
1,77
733
4 '
467
209
75.7
81.9
CY
194
2-45
6,50
11,
773
1,18
712
933
412
374
.279
.8C
Y 1
946-
4910
,088
2,35
61,
639
123
430
164
74.8
80.4
CY
195
0-53
21,7
704,
266
3,05
615
178
327
675
.280
.4C
Y 1
954-
5724
,920
4,84
73,
603
104
884
256
76.5
80.7
CY
195
8-F
Y 6
126
,039
5,73
34,
126
110
1,25
224
573
.977
:2F
Y 1
962-
6317
,711
4,69
53,
410
6999
622
074
.177
.7F
Y 1
964-
6522
,481
5,48
83,
977
361,
155
320
73.1
77.7
_
FY
196
6-67
27,5
296,
244
4,56
633
1,28
538
073
.778
.2F
Y 1
968-
69-1
-970
-71
33,4
016,
978
4,99
923
1,50
944
772
.076
.9F
Y39
,371
7,48
15,
652
151,
475
339
75.8
79.3
FY
197
219
,7Z
43,
699
2,97
55
617
102
80.6
82.8
Unk
now
n46
534
618
73
106
5054
.964
.2
Fig
ures
incl
ude
thos
e de
ceas
ed a
nd th
ose
empl
oyed
in fo
reig
n co
untr
ies
and
henc
e ex
ceed
the
tota
l pop
ulat
ion
figur
es r
epor
ted
in o
ther
tabl
es.
Incl
udes
thos
e to
who
m s
urre
y fo
rms
wer
e m
aile
d ar
id n
ot r
etur
ned
as w
ell a
sth
ose
who
indi
cate
d Ih
eir
relu
ctan
ce to
par
ticip
ate
in th
e su
rvey
Incl
udes
thos
e w
h6 w
ere
mem
bers
of t
he s
ampl
e bu
t for
who
m n
o cu
rren
t ad-
dres
ses
coul
d be
foun
d.
Bot
h re
spon
se r
ates
com
bine
the
num
ber
dece
ased
with
the
num
ber
of v
alid
resp
onse
s. R
ate
"A"
is c
alcu
late
d on
the
tota
l sam
plix
Rat
e"B
" Is
cal
cu la
ted
on o
n ly
thos
e co
ntac
ted.
!Siz
e de
term
ined
by
the
num
ber
of d
octo
rate
s gr
ante
d by
an
Inst
itutio
n du
rlhg
give
n tim
e pe
riod
(coh
ort)
.
Csr
iS
OU
RC
E: N
atio
nal A
cade
my
of S
cien
ces.
Doc
tora
l Sci
entis
ts a
nd E
ngin
eers
in th
e
iiiiii
iiim
mis
imat
ions
asin
sism
asis
siat
imis
siss
itiou
issi
gata
iiim
ossa
mm
isis
tinifi
rdS
tate
s-19
73 P
rorn
e. (
Was
hing
ton.
D.C
.), 1
974.
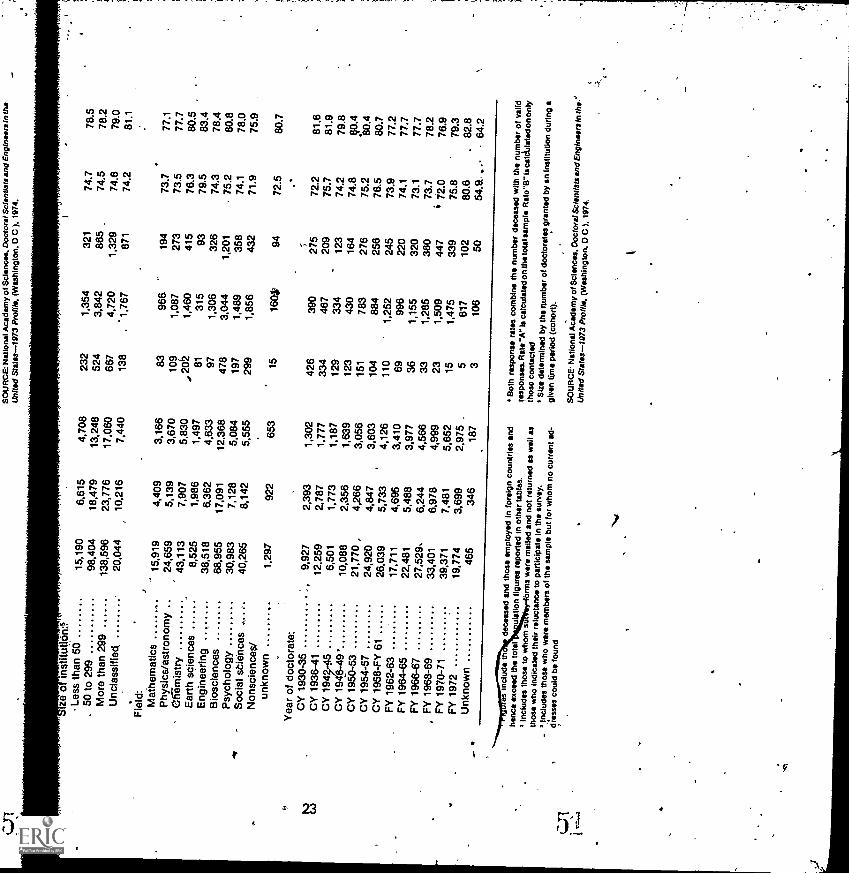
Cit
t
01
ze o
ris
titut
iOn:
1
SO
UR
CE
: Nat
iona
l Aca
dem
y of
Sci
ence
s.D
octo
ral S
cien
tists
and
Eng
inee
rs I
nU
nite
d Sl
ates
-197
3 Pr
ofile
,(W
ashi
ngto
n. O
C )
, 197
4.
Less
than
50
15,1
906,
615
4,70
823
21,
354
321
74.7
78.5
50 to
299
98,4
0418
,479
13,2
4852
43,
842
865
74.5
78.2
Mor
e th
an 2
9913
8,59
623
,776
17,0
6066
74,
720
1,32
974
.679
.0U
ncla
ssifi
ed,
20,0
4410
,216
7,44
013
8' 1,
767
871
74.2
81.1
Fie
ld:
Mat
hem
atic
s15
,919
4,40
93,
166
8396
6.19
473
.777
.1P
hysi
cs/a
stro
nom
y ..
24,6
595,
139
3,67
010
91,
087
273
73.5
77.7
Cai
mis
try
43,1
137,
907
5,83
01,
460
415
76.3
80.5
Ear
th s
cien
ces
8,52
51,
986
1,49
781
315
9379
.583
.4E
ngin
eerin
g.
38,5
186,
362
4,63
397
1,30
632
674
.378
.4B
iosc
ienc
es68
,955
17,0
9112
,368
478
3,04
41,
201
75.2
80.8
Psy
chol
ogy
30,9
837,
128
5.08
419
71,
489
358
74.1
78.0
Soc
ial s
cien
ces
40,2
658,
142
5.55
529
91,
856
432
71.9
75.9
Non
scie
nces
/un
know
n1,
297
922
653
1516
094
72.5
80.7
.Y
ear
of d
octo
rate
:C
Y 1
930-
359,
927
2,39
31,
302
426
390
275
72.2
81.8
CY
193
6-41
12,2
592,
787
1,77
733
446
720
975
.781
.9C
Y 1
946,
501
1,77
31,
187
129
334
123
74.2
79.8
CY
19d
6 -4
9'10
,088
2,35
61,
639
123
430
164
74.8
90.4
CY
195
0-53
21,7
704,
266
3,05
615
178
327
675
.280
.4C
Y 1
954-
5724
,920
4,84
73,
603
104
884
256
78.5
80.7
CY
195
8-F
Y 6
126
,039
5,73
34,
126
110
1,25
224
573
.977
.2F
Y 1
962-
6317
,711
4,69
53,
410
6999
822
074
.177
.7F
Y 1
964-
6522
,481
5,48
83,
977
361,
155
320
73.1
77.7
FY
196
6-67
27,5
29.
6,24
44,
566
331,
285
380
73.7
78.2
Pi'
1968
-69
33,4
016,
978
4,99
923
1,50
944
772
.076
.9F
Y 1
970-
7139
,371
7,48
15.
652
151,
475
339
75.8
79.3
FY
197
219
,774
3,69
92,
975
.5
617
102
80.6
82.8
Unk
now
n46
534
618
73
106
5054
.9..
64.2
incl
ude
thde
ceas
ed a
nd th
ose
empl
oyed
info
reig
n co
untr
ies
and
henc
e ex
ceed
the
tota
lul
atio
n fig
ures
rep
orte
d rn
oth
er ta
bles
.2
Incl
udes
thos
e to
who
ms
rms
war
s m
aile
d en
d no
t ret
urne
d as
wel
l as
thos
e w
ho in
dica
ted
thei
r re
luct
ance
topa
rtic
ipat
e In
the
surv
ey.
..'In
clud
es th
ose
who
war
e m
embe
rs o
f the
sam
ple
but f
or w
hom
no
curr
ent a
d-dr
esse
s co
uld
be fo
und
Bot
h re
spon
se r
ates
com
bine
the
num
ber
dece
ased
with
the
num
ber
of v
alid
resp
onse
s. R
ate
"A"
is c
alcu
late
d on
the
tota
l sam
ple
Rat
o"B
"Is
cal
ckila
ted
on o
nly
thos
e co
ntac
ted
Siz
e de
term
ined
by
the
num
ber
of d
octo
rate
sgr
ante
d by
an
Inst
itutio
n du
ring
agi
ven
time
perio
d (c
ohor
t).
SO
UR
CE
. Nat
iona
l Aca
dem
y of
Sci
ence
s.D
octo
ral S
cien
tists
and
Eng
inee
rs in
the,
'U
nite
d Sl
ates
-197
3 Pr
ofile
.(W
ashi
ngto
n. 0
C )
. 197
4.

, TABLE A-4. Science and engineeringfield classification of specialties-7,
1973 Doctoral Roster Survey
FIELD Specialty codeAll fields 000 to 799
Physical scientists 101 to 299Chemists 200 to 299 -Physicists and
astronomers 101 to 199
Mathematical scientists
Mathematicians
Statisticians
000 to 060082 to 099000 to 052 ,
060, 082 to 099 .
055
Computer specialists 080
Environmental scientists 301 to 399Earth scientists 301 to 360
388, 389, 391398. 399
Oceanographers 370,397Atmospheric scientists 380
Engineers 400 to 499
Life scientists 500 to 579Biological scientists 540 to 579Agricultural scientists 500 to 519Medical scientists 520 to 539
Psychologists 600 to 699
Social scientists 700 to 799Economists 720, 725Sociologists/
Anthropologists 700, 710Other social scientists 703, 708, 709,
729, 740 to 769Out of scope 841 to 899
24
5';!
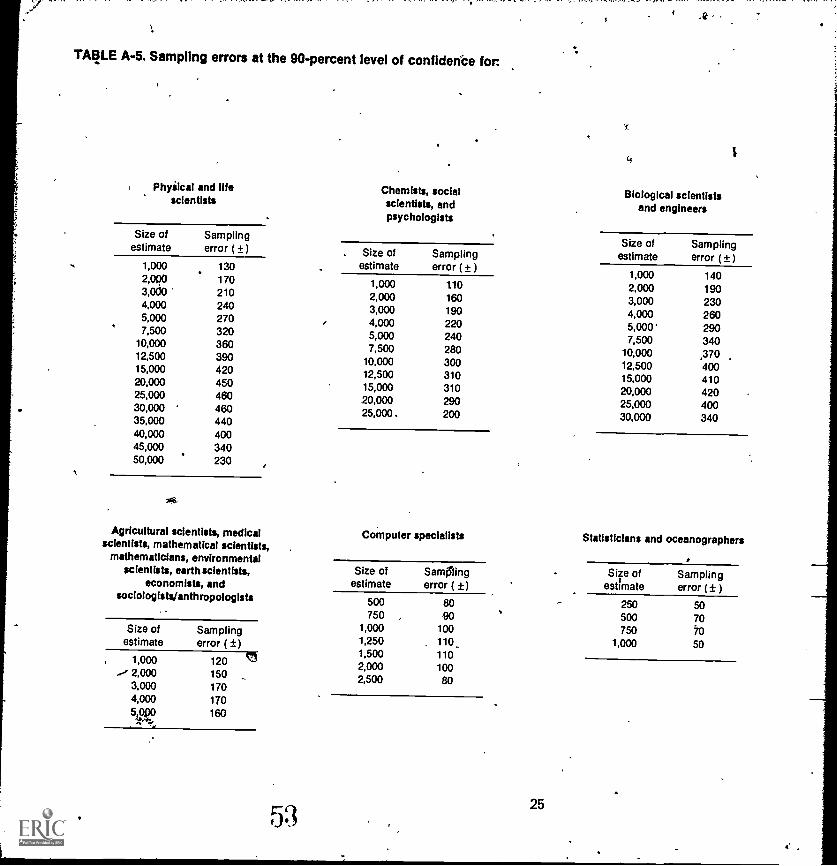
TABLE A-5. Sampling errors at the 90-percent level of confidence for
Phyiical and lifescientists
Chemists, socialscientists, andpsychologists
Biological scientistsand engineers
Size ofestimate
Samplingerror ( ±) Size of
estimateSamplingerror (±). Size of Sampling
1,000 130 estimate error ( i )1,000 1402,00 170 1,000 110 2,000 1903,000 210 2.000 160 3,000 2304,000 240 3,000 190 4,000 2605,000 270 4,000 220 5,000' 2907,500 320 5,000 240 7,500 34010,000 360 7,500 280 10,000 ,37012,500 390 10,000 300 12,500 40015,000 420 12,500 310 15,000 41020,000 450 15,000 310 20,000 42025,000 460 20,000 290 25,000 40030,000 460 25,000. 200 30,000 34035,000 440
40,000 40045,000 34050,000 230
Agricultural scientists, medicalscientists, mathematical scientists,
mathematicians, environmentalscientists, earthscientists,
economists, andsociologists/anthropologists
Size of Samplingestimate error ( ±)
1,000 120... 2,000 150
3,000 1704,000 1705,opo 160*44,
CoMputer specialists Statisticians and oceanographers
Size of Sam6ting Size of Samplingestimate error ( ±) estimate error (± )
500 80 250 50750 ao 500 70
1,000 100 750 701,250 110, 1,000 501,500 1102,000 1002,500 80
25
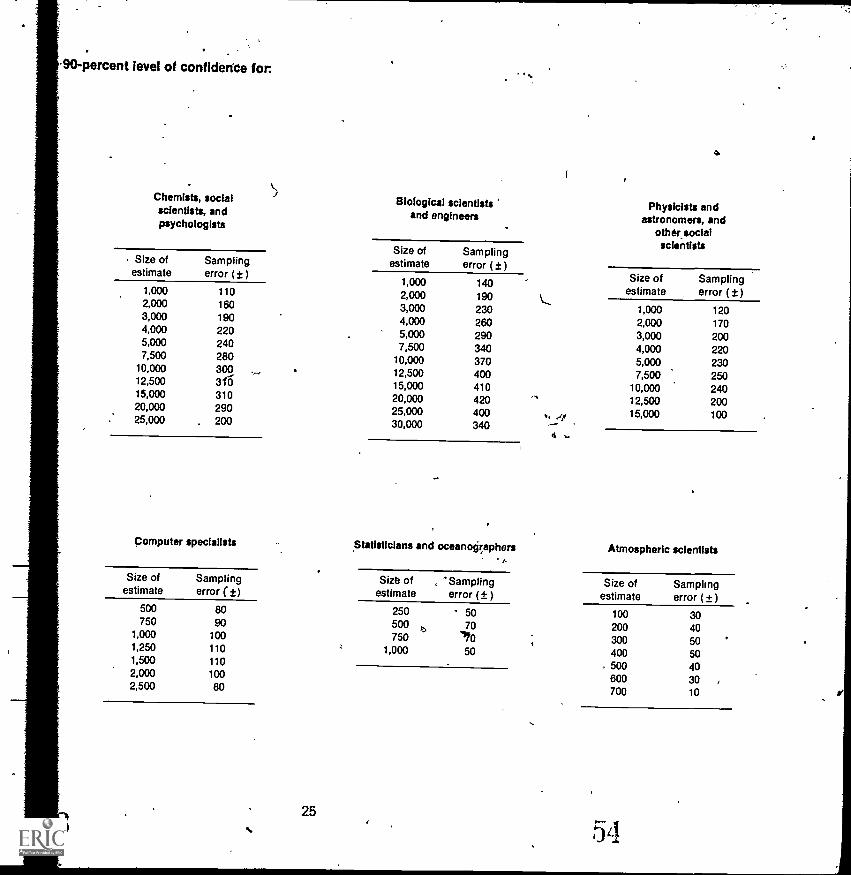
-90-percent level of confidence for.
4
Chemists, socialscientists, andpsychologists
Biological scientistsand engineers
I
Physicists andastronomers, and
other socialscientistsSize of Sampling
Size of Sampling estimate error (±)Size of
estimateSamplingerror ( ±)
estimate error (± )1000 140
1,0002,000
110160
2,0003,000
190230
\-...1,000 120
3,000 190 4,000 260 2,000 1704,000 220 5,000 290 3,000 2005,000 240 7,500 340 4,000 2207,500 280 10,000 370 5,000 23010,000 300 12,500 400 7,500 25012,500
15,0003C6310
15,00020,000
410420 -,.
10,00012,500
24020020,000 290 25,000 400 .., "If 15,000 10025,000 200 30,000 340
Computer specialists
4
Statisticians and oceanographers Atmospheric scientists
Size ofestimate
Samplingerror (4±)
Size ofestimate
, 'Samplingerror ( ± )
Size ofestimate
Samplingerror (± )
500 80 250 50 100 30750
1,00090
100500750
70'1 10
200300
4050
1,250 110 1,000 50 400 501,500 110 , 500 402,000 100 600 30 ,2,500 80 700 10
,
re
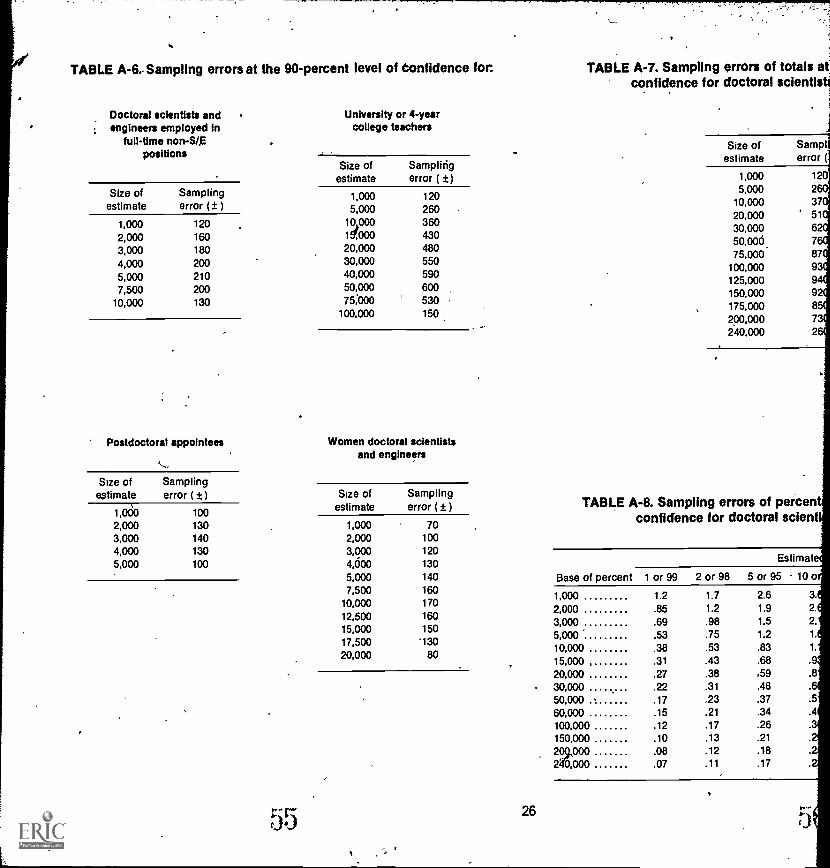
TABLE A -6.. Sampling errors at the 90-percent level of Confidence for. TABLE A-7. Sampling errors of totals atconfidence for doctoral scientis
Doctoral scientists andengineers employed In
full-time non-S/gpositions
University or 4-yearcollege teachers
Size ofestimate
Samplerror
Size ofestimate
Samplirigerror ( ±) 1,000
5,00010,00020,00030,00050,006.75,000
100,000125,000150,000175,000200,000240,000
1202 .3751
67 .8799987
Size ofestimate
Samplingerror (± )
1,0005,000
1000019,00020,00030,00040,00050,00075:000
100,000
120260360430480550590600530150
1,0002,0003,0004,0005,0007,500
10,000
120160180200210200130
Postdoctoral appointees Women doctoral scientistsand engineers
TABLE A-8. Sampling errors of percenconfidence for doctoral scienti
Size ofestimate
Samplingerror (±) Size of
estimateSamplingerror (± )
1,0002,0003,0004,0005,000
100130140130100
1,0002,0003,0004,0005,0007,500
10,00012,50015,00017,50020,000
70100120130140160170160150
13080
Estimat
Base of percent 1 or 99 2 or 98 5 or 95 10 0
1,0002,0003,0005,00010,00015,00020,00030,00050,00060,000100,000150,000
20000
000
1.2.85.69.53.38.31
.27
.22
.17
.15
.12
.10
.08
.07
1.71.2
.98.75.53.43.38.31
.23
.21
.17
.13
.12
.11
2.6 3.
1.9 2.
1.5 2.
1.2 1.
.83 1.
.68 .9
.59
.48.37.34 .4.26.21
.18
.17
re)
26pv,
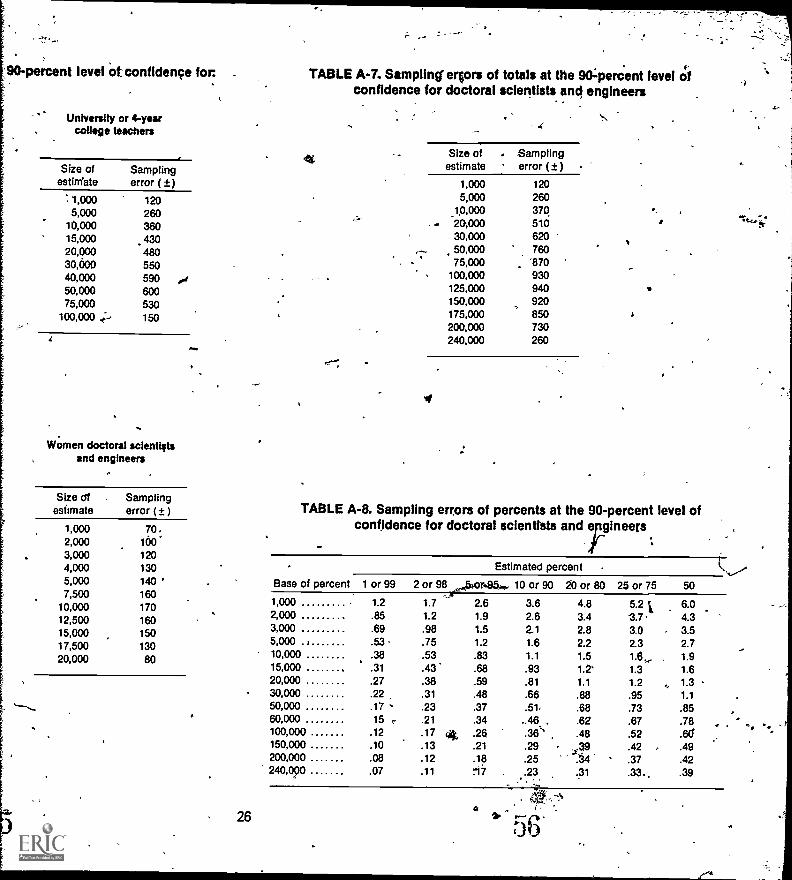
90-percent level 'of:confidence for -
University or 4-yearcollege teachers
Size of Samplingestimate error ( ±)
*. 1,000 1205,000 260
10,000 36015,000 .43020,000 48030,000 55040,000 590 oi50,000 60075,000 530
100,000 150
Women doctoral scientistsand engineers
Size clfestimate
Samplingerror ( ± )
1,000 70.2,000 1003,000 1204,000 1305,000 140 '7,500 160
10,000 17012,500 16015,000 15017,500 13020,000 80
/ma
TABLE A-7. Sampling errors of totals at the 90- percent level Ofconfidence for doctoral scientists and engineers
Size ofestimate
Samplingerror (± )
1,000 1205,000 260
10,000 370,
20;000 51030,000 62050,000 76075,000 '870
100,000 930125,000 940150,000 920175,000 850200,000 730240,000 260
TABLE A-8. Sampling errors of percents at the 90-percent level ofconfidence for doctoral scientists and
Estimated percent
Base of percent 1 or 99 2 or 98 por.96 10 or 90 20 or 80 25 or 75 50
1,000 1.2 1.7 2.6 3.6 4.8 5.2 i 6.02,000 .65 1.2 1.9 2.6 3.4 3.7 4.33,000 .69 .98 1.5 2.1 2.8 3.0 3.55,000 I .53 - .75 1.2 1.6 2.2 2.3 2.710,000 .38 .53 .83 1.1 1.5 1.6,, 1.915,000 .31 .43 .68 .93 1.2' 1.3 1.620,000 .27 .38 .59 .81 1,1 1.2 1.330,000 .22 .31 .48 .66 .88 .95 1.150,000 .17 , .23 .37 .51. .68 .73 .8560,000 15 , .21 .34 ..46 , .62 .67 .78100,000 .12 .17 cit .26 .36'" .48 .52 .6a150,000 .10 .13 .21 .29 - 39 .42 .49200,000 .08 .12 .18 .25 x34
,
34 .37 .42240,090 .07 .11 :17 .23 .31 .33., .39
26r.) 6
.
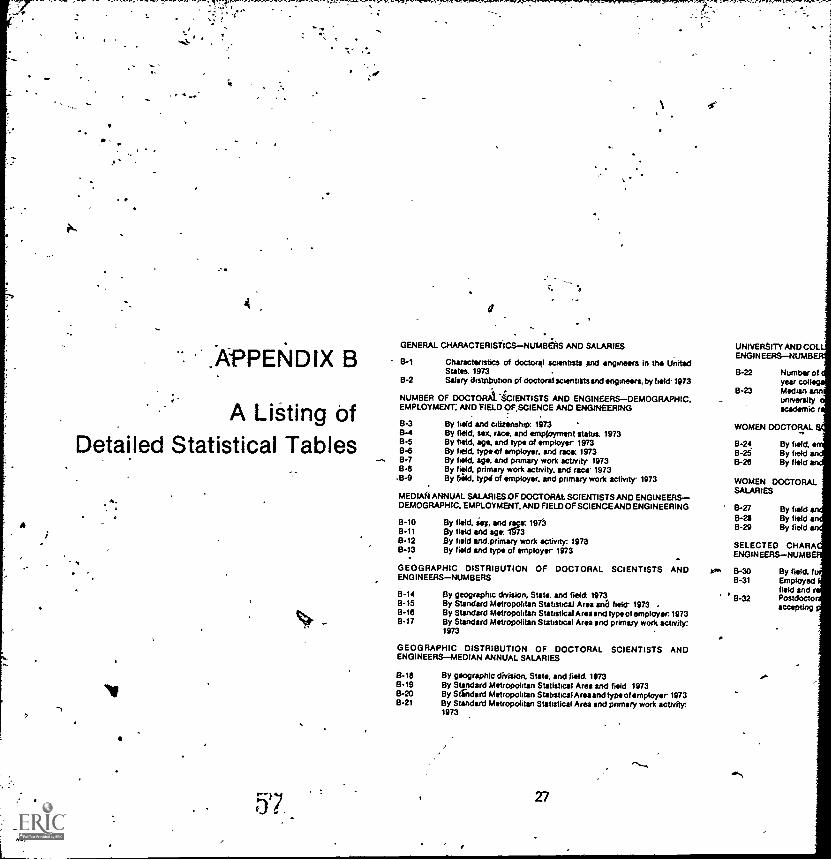
.APPENDIX B
A LiSting ofDetailed Statistical Tables
A
ti
kLj
GENERAL CHARACTERISTICS NUMBERS AND SALARIES
B-1 Characteristics of doctoral scientists and engineers in the UnitedStates. 1973
B -2 Salary dis1nbutton of doctoral scienblits and engineers, by field- 1973
NUMBER OF DOCTORA iCIENTISTS AND ENGINEERSDEMOGRAPHIC.EMPLOYMENT; AND VIED OF,SOIENCE AND ENGINEERING
B-38-4B-58-6B-7B-8
.B-9
By field and citizenship: 1973 'By field. six, race. and employment status- 1973By field, age. and type of employer 1973By field. typed employer. and race: 1973By held, age. and pnmary work activity 1973By field. primary work actrvity. and racy 1973By feed. type of employer. and pnmary work activity 1973
MEDIAN ANNUAL SALARIES OF DOCTORAL SCIENTISTS AND ENGINEERSDEMOGRAPHIC. EMPLOYMENT. AND FIELD OF SCIENCEAND ENGINEERING
B-10 By field. se;. and ive 1973B-11 By Reid and *or 1S738-12 By field and, primary work activity: 1973B-13 By field and type of employer 1973
GEOGRAPHIC DISTRIBUTION OF DOCTORAL SCIENTISTS ANDENGINEERSNUMBERS
B-14 By geographic division. State, and field: 1973B-15 By Standard Metropolitan Statistical Area and lurid- 1973 .8-16 By Standard Metropolitan Statistical Area and typaof employer 19738-17 By Standard Metropolitan Statistical Area and primary work actrvity:
1973
GEOGRAPHIC DISTRIBUTION OF DOCTORAL SCIENTISTS ANDENGINEERSMEDIAN ANNUAL SALARIES
8-16 By geographic division. State, and field. 19738-19 By Standard Metropolitan Statistical Area and field 1973B-20 By Stindard Metropolitan Statistical Areaand typeof employer 1973B-21 By Standard Metropolitan Statistical Area and primary work activity:
1973
27
.s`
UNIVERSITY AND COLENGINEERSNUMB
B-22 Number ofyear col
8-23 Median annuniversityacademic
WOMEN DOCTORAL 8
B-24 By field.B-25 By fieldB-26 By field
WOMEN DOCTORALSALARIES
B-27 By field13-2$ By fieldB-29 By field
SELECTED CHARAENGINEERSNUMB
a*. B-30 By field. fu8-31 Employed
field and r8-32 Postdocto
accepting
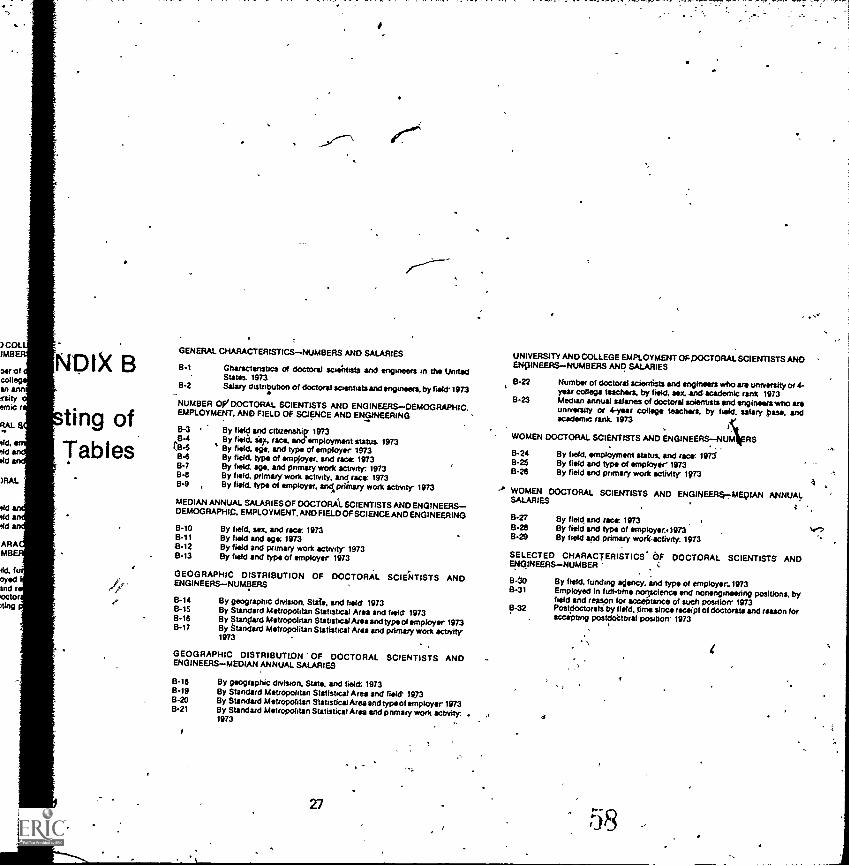
RAL
)RAL
lidhid
d
ARAMB
Ad. Idyedand rontoMC*
NDIX B
ting ofTables
GENERAL CHARACTERISTICSNUMBERS AND SALARIES
B-1
B -2
Characteristics of doctoral scientists and engineers in the UnitedStates. 1973Salary distribution of doctoral scientists and engineers, by field' 1973
NUMBER OP DOCTORAL SCIENTISTS AND ENGINEERSDEMOGRAPHIC.EMPLOYMENT, AND FIELD OF SCIENCE AND ENGINEERING
8-3B-403-5B-6B-71:1-5
B-9
By field and citizenship 1973By field, iv, rack andemployrnant status. 1973By field, age, and type of employer 1973By field type of ernplioyer. and rack 1973By held age, and primary work activity: 1973By field, primary work activity. and rack 1973
, By field, typo of employer, and primary work activity- 1973
MEDIAN ANNUAL SALARIES OF DOCTORAL SCIENTISTS AND ENGINEERSDEMOGRAPHIC, EMPLOYMENT, AND FIELD OF SCIENCE AND ENGINEERING
B-10 By field, sex, and MC* 19738-11 By field and age: 19738-12 By field and primary work activity- 19738.13 By field and typo of employer 1973
GEOGRAPHIC DISTRIBUTION OF DOCTORAL SCIENTISTS ANDENGINEERSNUMBERS
8-14 By geographic division. State, and heft,- 19738-15 By Standard Metropolitan Statistical Area and herd 1973B-16 By Stanpard Metropolitan StalisticalAres and typeof employar 1973B-17 By Standard Metropolitan Statistical As and primary work Sanity-
1973
GEOGRAPHIC DISTRIBUTION OF DOCTORAL SCIENTISTS ANDENGINEERSMEDIAN ANNUAL SALARIES
8-19 By geographic division, State, and field: 1973B-19 By Standard Metropolitan Statistical Area and Nod. 1973B-20 By Standard Metropolitan Statistical Areaand typeof employer 1973B-21 By Standard Metropolitan Statistical Area and p nmsry work activity:
1973
27
UNIVERSITY AND COLLEGE EMPLOYMENT OFOOCTORAL SCIENTISTS ANDENGINEERS NUMBERS AND SALARIES
8-22 Number of doctoral scientists and enginsars who are university or 4-year college teachers, by field. stem and academic rank 1973
13-23 Median annual salaries of doctoral soienusts end engineers who areuniversity or 4-year college tescharl, by field. salary Pat andacademic rank. 1973
iWOMEN DOCTORAL SCIENTISTS AND ENGINEERS--NUM
\RS
8-24B-258-26
By field, employment status, and rack IonBy field and typo of employer 1973By field and primary work activity- 1973
WOMEN DOCTORAL SCIENTISTS AND ENGINEERMEDIAN ANNUALSALARIES
B-278-29B-29
By field and MCC 1973By field and typo of employer..1973By field and primary work-activity: 1973
SELECTED CHARACTERISTICS* OF DOCTORAL SCIENTISTS ANDENGINEERSNUMBER
B-to By field, funding agoncy, and typo of employer-19738-31 Employed in futl-lifne ncutscierics and nonengineering positions, by
field and reason for acceptance of such position 1973B-32 Postdoctorals by field, time since receipt of doctorate and reason for
accepting postdoCtoral posniorr 1973
58
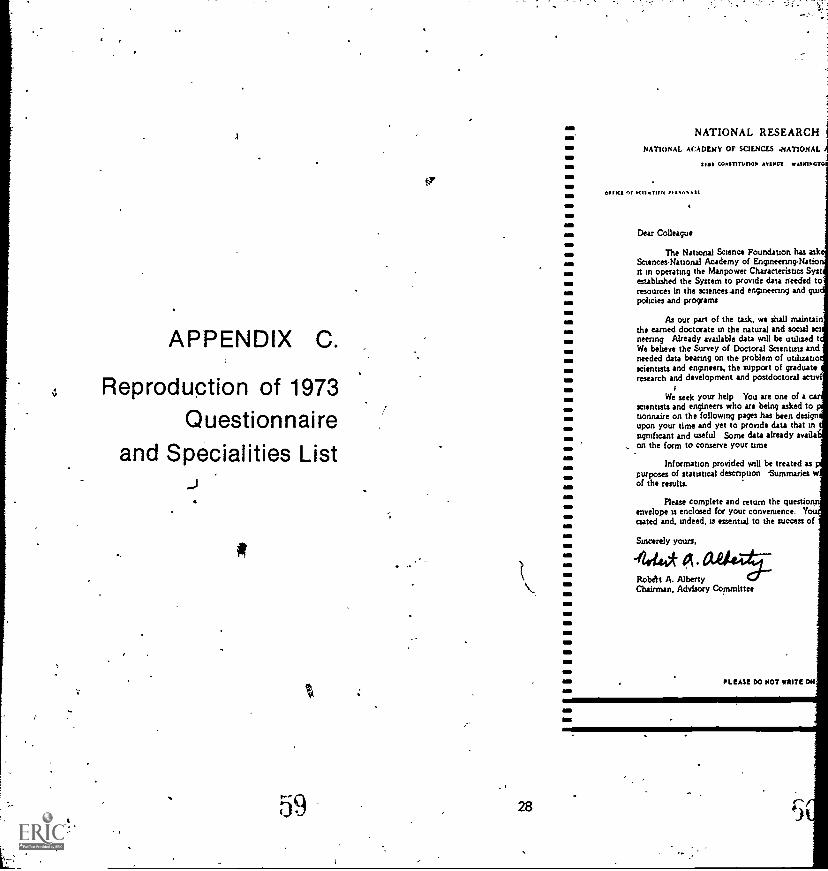
APPENDIX C.
Reproduction of 1973Questionnaire
and Specialities List
I
NATIONAL RESEARCHNATIONAL ACADEMY OF SCIENCES .NATIONAL
sloe CONSTITIMOP Lrtsea I.IMPCTO
0IIKI KlIktiell ,,.10, it
Dear Colleague
The National Science Foundation has askSciencesNational Academy of EngsneeringNatioit in operating the Manpower Characteristics Sysestablished the System to provide data needed toresources in the sciencesand engineering and quipolicies and programs
As our part of the task, we shall maintainthe earned doctorate m the natural and social soneenng Already available data will be utilized tWe believe the Survey of Doctoral Scientists andneeded data bearing on the problem of utilizatioscientists and engineers, the support of graduateresearch and development and postdoctoral amyl
We seek your help You are one of ascientists and engineers who are being asked totionnaire on the following pages.has been designupon your time and yet to provide data that msignificant and useful Some data already evadeon the form to conserve your time
Information provided will be treated aspurposes of statistical description -Summariesof the results.
Please complete and return the questioenvelope is enclosed for your convenience, Yelated and, indeed, is essential to the success of
Sincerely yours,
4444*Robett A. AlbertyChairman, Advisory Committee
PLEASE DO NOT WRITE ON
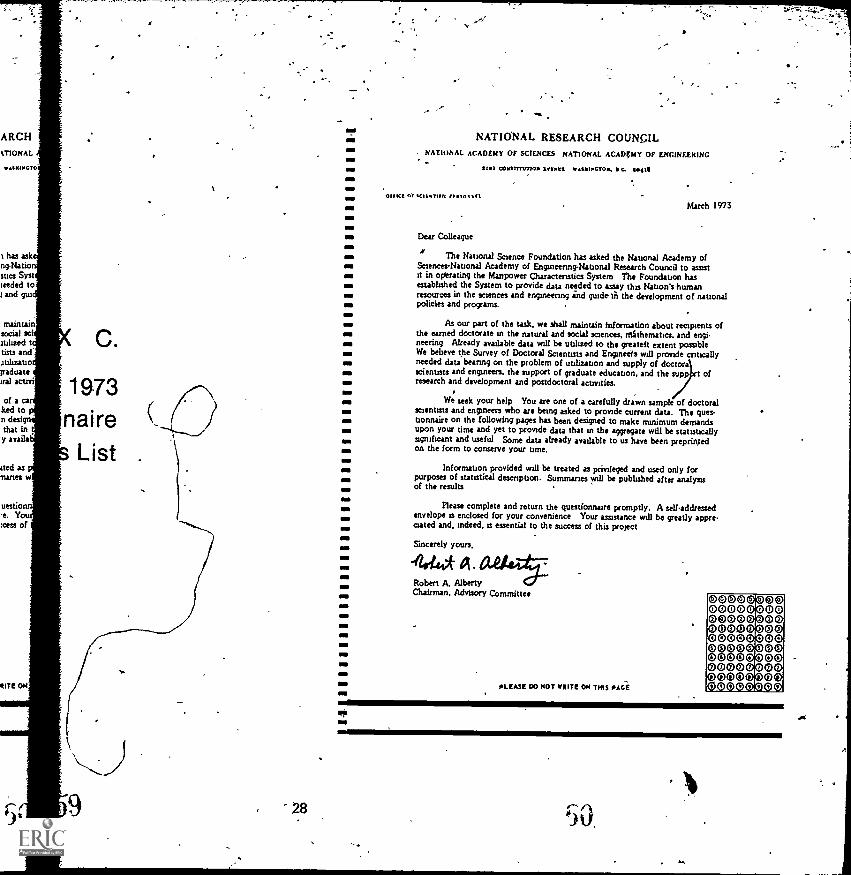
ARCHTIONAL
wIXIPCTO
has askng-Natiosues Systseeded to4 and gm
maintainsocial ammined ttists anditilizatiosraduateJral activ
of a.ked ton designthat in
'y evade
tied asmuses
'testi=e. Y:cess of
C.
1973
naireList
RITE OH
9 -28
OM
OM
OM
OM
OM
OM
WM 0111CI AY KII041111 11,5os sit
---Dear Colleague
wewe
wewe
we
we
we
esseness
es
esses Sincerely yours.
4/444*
NATIONAL RESEARCH COUNCIL- NATIONAL ACADEMY OF SCIENCES NATIONAL ACADEMY OF ENGINEERING
till comrtrnox avapr: .431cTo0, I C. sopa
March 1973
The National Science Foundation has asked the National Academy ofSmencesNational Academy of Engmeenng-National Research Council to assistit in operating the Manpower Characteristics System The Foundation hasestablished the System to provide data needed to assay this Nation's humanresources in the sciences and engineering and guideln the development of nationalpolicies and programs.
As our part of the task, we shall maintain information about recipients ofthe earned doctorate in the natural and social sciences, irilithematics, and enginetting Already available data will be utilized to the greatett extent possibleWe believe the Survey of Doctoral Scientists and Engineers will provide criticallyneeded data bearing on the problem of utilization and supply of doctorsscientists and engineers, the support of graduate education, and the supp t ofresearch and development and postdoctoral activities.
We seek your help You are one of a carefully drawn sample of doctoralscientists and engineers who are being asked to provide current data. The ques-tionnaire on the following pages has been designed to make minimum demandsupon your time and yet to provide data that in the aggregate will be statisticallysignificant and useful Some data already available to us have been preprintedon the form to conserve your time.
Information provided will be treated as privileged and used only forpurposes of statistical descnpuon. Summaries will be published after analystsof the results
Please complete and return the questionnaire promptly. A selfaddressedenvelope is enclosed for your convenience Your assistance will be greatly applemated and, indeed, is essential to the success of this project
Robert A. /libertyChairman, Advisory Committee
PLEASE DO HOT WRITE OH THIS PAGE
00)00)0000.00000000000000000000000000000000000000000000000000CK)000000000000000000
'OPims
es
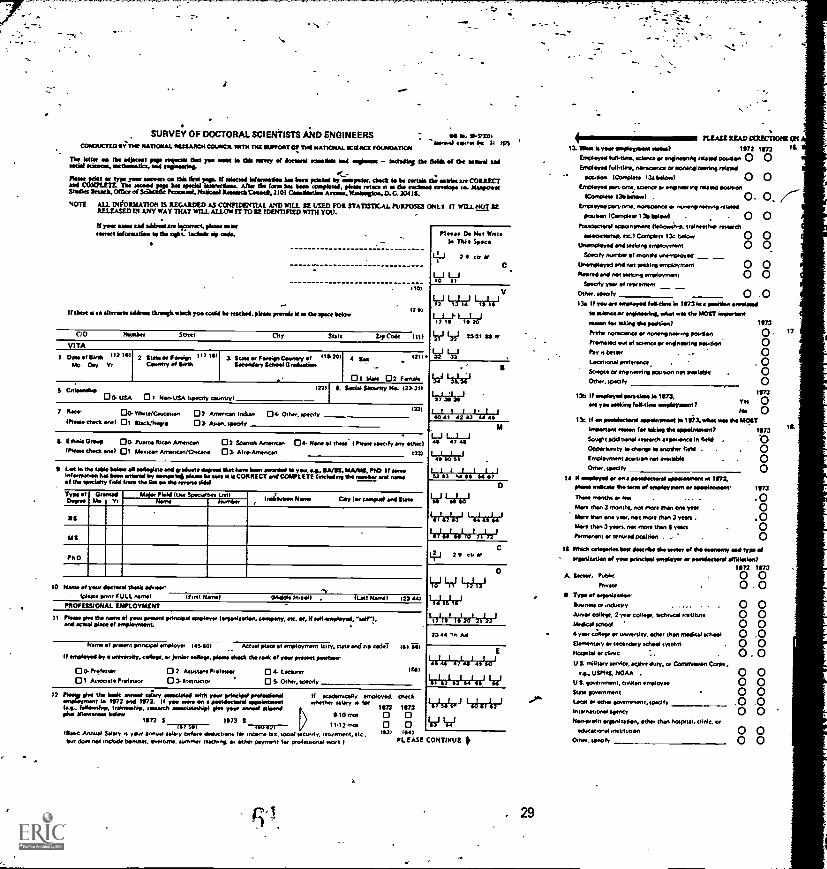
00Q
00-
oo I
.;1"
.I I
aI.
0
,99
I I 0 gr
131
.99 0
tt
0
E0
t
I i I 1 I I
4
Illiiy
tifill
ii, f
ilift
tiii
'!Fi
,!i
llifi
lriii
iliff
11.1
0,19
.41!
_pm
0111
1= I
Iiii
i fili
ilit
iiii
iiPqi
ioltl
if it
:i!ol
utio
l it i
gliil
=11
1100
1-1-
9ow
l Iif
iPi
.- ir
ri
1-1
it10
-1'1
11
141
1lli
til
.,;;
ti o_
I
!li0
fti3
tiitt
i_iii
iiI
tI
t1iii
iijit
.01
1:
itill.
111
it.
ifill
1
I. L
IM 1
11.1
rtic, lli
t,
4,,..
.
4f-
i-
i
I.I
.
i
11 1
iii
IJi
t.1
t'
400 00000
0000
00oo
21 g1
'1"
i 0 0
0 00
0 0
0 0
.ir
00 o
b000
oob
000
oot o
obob
t 000
0t o
o§00
0000
J6
oo ,0
0 0
p 0
otl.
Jr.
-9
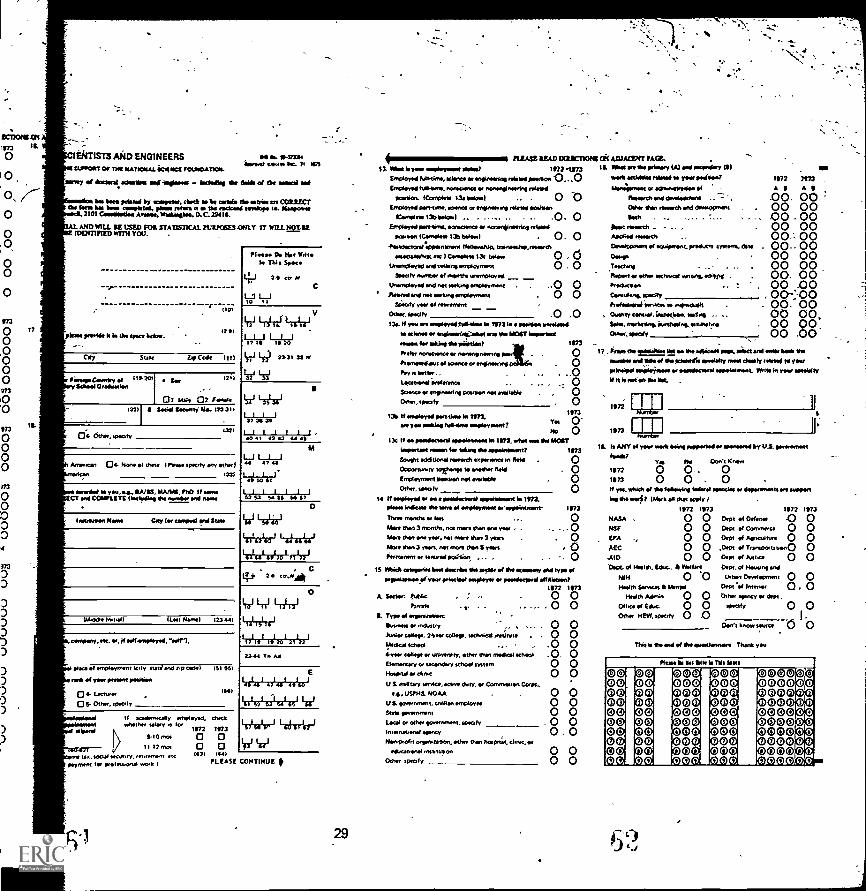
vv LA.! VU VVVVVV 00,1 00000 0000g oo3 0000003 0 00 ,00 0 0 0 03
r
I
i
0
s?110-01 it
1
sQ3 i 1.1t 3;
3 x
0
Iiii i 1 111111 II I frit 1 'filo 1
filliz11 zit i?' Plifigilip
,1 I I lit, ollialigliffi
rii 1 I 0.1111
'1 di;If
Li00 00000 000600 ooqioo 00000 '000000 oot-
0800909000ceeeeowpo.000000 0 9 00oeeeeosooe
0 J. 00000001,oeeeeoeeoet. O0 'DOON
00009890OG;000009000-co 0 o 0 coo tr
oeoefaooeeeoelooeoeeoooeeeeoeeoe000000 0001PoiggaalgggM==i6Igg'5:1
7
I
I 1I 1
U
I 11111 1111-1111-1;
litiP1 I i itI ' III 11
g" 6 00 00 0 0 o000boi 0000t oot000boot b oo oa o o b9
ntif!""i !-AI V it
-1il itooil
000toz000005! 001000 0.0000011
10012 f
Iffifflif?ittiit
ii1W41?cE
a_o 00 0000Oto'o 00 00000 I
111
Ian
;Y1111111111WI
1111 I =I! If it!
tr0 1 1 li
fe
1
1 11,-..' J
s
000000000000000.;000090000000000.4600666000600000.r000000000000000
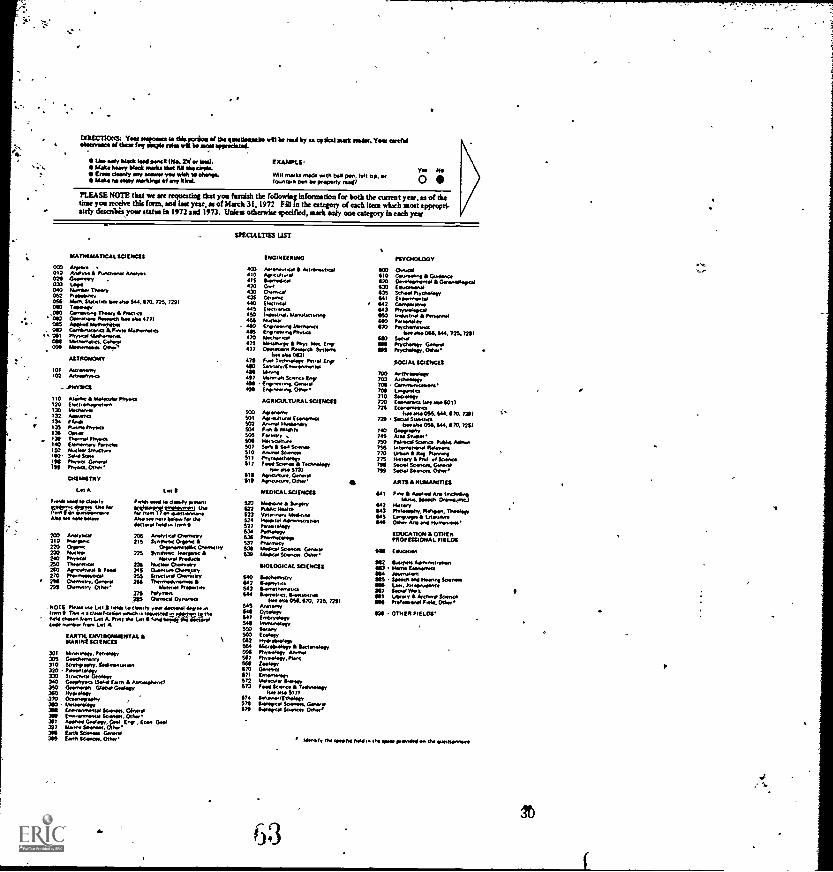
I1
tt
ti
I;
.fili,
t
11
11 i1 4 4
libli. Eili ill Q.
I.
k
41 Oft* I-
t /
112gP 11/1/ 1 ;1 .,.? ii
il 1 A. e
F1.111 hi]
ii1 Ill d 1111 1 i it
1 li 1 11 1114 1
1 Ililig i
I/
/ IlliAil
:.
1 11 III 1
il It"
.nmisme an
oRivar E REUEEFE
i Hit
I thine§ i
!t11
;$
II-
r1
I 11
10
_F1 t%.
ligft
ii
21;
g Lif
!! 1
fig
1-4 01!
111''Illi
101011111111141111
E ti
ALI :
A I Att
tt
t2iii
t2
i
matieutlif&c: 91:11
tttA2It2E2 33
Etattatttt
int 2111222ilit2t22 i!!
-t:.*
tt.'
44- 101100"P
ill
4 2-1
"Pahl
igLfflietultp
EE E Elgt EEA:!
!
/3
11
st!
11
umaggmmig
ag2gR
amm
aist4t LEL
g3 16#
671"
141
11111/1111,i
!Ili
111.11J:!!!!!::!
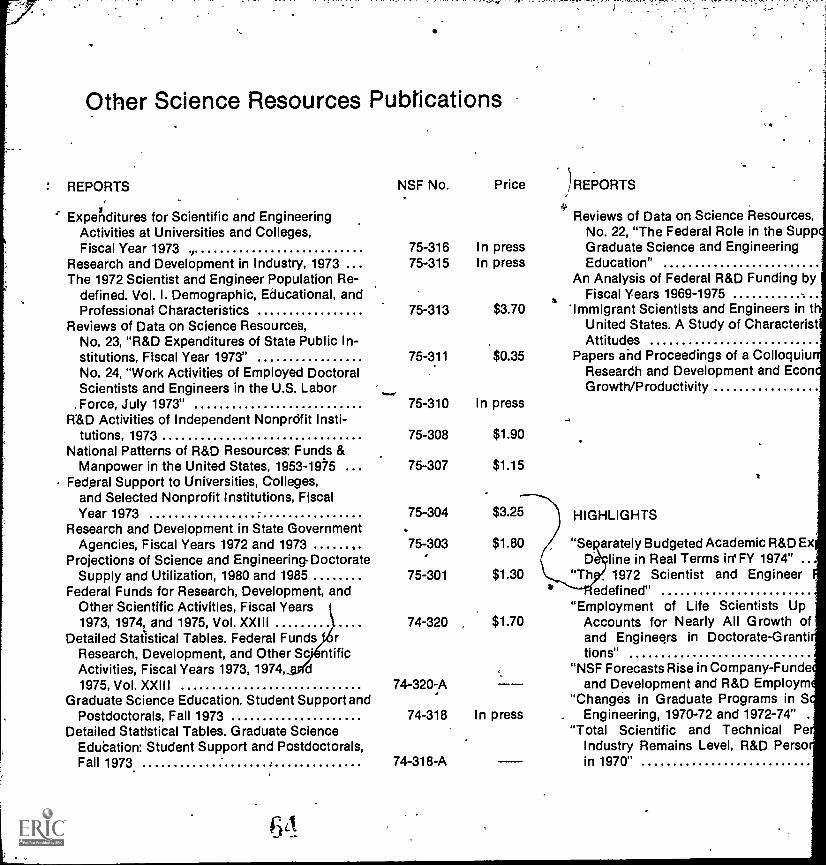
Other Science Resources Publications
REPORTS
ExpeAditures for Scientific and EngineeringActivities at Universities and Colleges,Fiscal Year 1973 ,
Research and Development in Industry, 1973The 1972 Scientist and Engineer Population Re-
defined. Vol. I. Demographic, Educational, andProfessional Characteristics
Reviews of Data on Science Resources,No. 23, "R&D Expenditures of State Public In-stitutions, Fiscal Year 1973"No. 24, "Work Activities of Employed DoctoralScientists and Engineers in the U.S. LaborForce, July 1973"
R &D Activities of Independent Nonprofit Insti-tutions, 1973
National Patterns of R&D Resources: Funds &Manpower in the United States, 1953-1975
Federal Support to Universities, Colleges,and Selected Nonprofit Institutions, FiscalYear 1973
Research and Development in State GovernmentAgencies, Fiscal Years 1972 and 1973
Projections of Science and Engineering DoctorateSupply and Utilization, 1980 and 1985
Federal Funds for Research, Development, andOther Scientific Activities, Fiscal Years1973, 1974, and 1975, Vol. XXIII
Detailed Statistical Tables. Federal Funds rResearch, Development, and Other Sc' ntificActivities, Fiscal Years 1973, 1974, d1975, Vol. XXIII
Graduate Science Education. Student Support andPostdoctorals, Fall 1973
Detailed Statistical Tables. Graduate ScienceEdudation: Student Support and Postdoctorals,Fall 1973
NSF No. Price REPORTS
Reviews of Data on Science Resources,No. 22, "The Federal Role in the Supp
75-316 In press Graduate Science and Engineering75-315 In press Education"
An Analysis of Federal R&D Funding byFiscal Years 1969-1975
75-313 $3.70 'Immigrant Scientists and Engineers in tUnited States. A Study of CharacteristAttitudes
75-311 $0.35 Papers and Proceedings of a ColloquiuReseardh and Development and EconGrowth/Productivity
75-310 In press
75-308 $1.90
75-307 $1.15
75-304 $3.25
.75-303 $1.80
75-301 $1.30
74-320 $1.70
74 -320 -A
HIGHLIGHTS
"Se, arately Budgeted Academic R&D ExD line in Real Terms in' FY 1974"
"Th 1972 Scientist and Engineeredefined"
"Employment of Life Scientists UpAccounts for Nearly All Growth ofand Engineers in Doctorate-Grantitions"
"NSF Forecasts Rise in Company-Fundeand Development and R&D Employm
"Changes in Graduate Programs in S74-318 In press Engineering, 1970-72 and 1972-74"
"Total Scientific and Technical PeIndustry Remains Level, R&D Persoin 1970"74-318-A
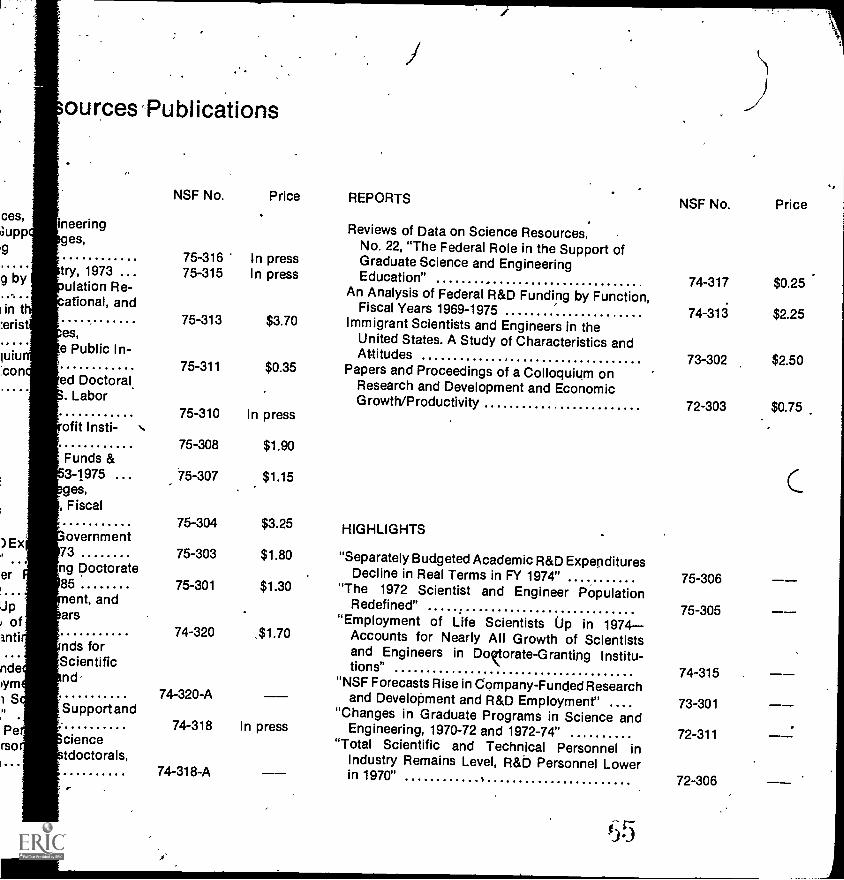
ces,Supp
g by
in terist
lulu
:co n
ources Publications
neeringges,
try, 1973 ...ulation R e-ational, and
es,e Public In-
ed Doctoral,. Labor
ofit Insti-
Funds &3-1975 ...es,
, Fiscal
) Ex
er
Jpof
anti
nde)ym
S
Perso
overnment73ng Doctorate85
ent, andars
nds forScientificnd
Support and
ciencetdoctorals,
I
NSF No. Price REPORTS
Reviews of Data on Science Resources,No. 22, "The Federal Role in the Support of
75-316 In press Graduate Science and Engineering75-315 In press Education"
An Analysis of Federal R&D Funding by Function,Fiscal Years 1969-1975
75-313 $3.70 Immigrant Scientists and Engineers in theUnited States. A Study of Characteristics andAttitudes
75-311 $0.35 Papers and Proceedings of a Colloquium onResearch and Development and EconomicGrowth/Productivity
75-310 In press
75-308 $1.90
75-307 $1.15
75-304
75-303
75-301
$3.25
$1.80
$1.30
74-320 ,$1.70
74-320-A
74-318 In press
74-318-A
HIGHLIGHTS
NSF No. Price
74-317 $0.25
74-313 $2.25
73-302 $2.50
72-303 $0.75
"Separately Budgeted Academic R&D Expe,ndituresDecline in Real Terms in FY 1974" 75-306
"The 1972 Scientist and Engineer PopulationRedefined" r 75-305
"Employment of Life Scientists Up in 1974Accounts for Nearly All Growth of Scientistsand Engineers in DoKtorate-Granting Institu-tions" 74-315
"NSF Forecasts Rise in Company-Funded Researchand Development and R&D Employment" 73-301
"Changes in Graduate Programs in Science andEngineering, 1970-72 and 1972-74" 72-311
"Total Scientific and Technical Personnel inIndustry Remains Level, R&D Personnel Lowerin 1970" 72-306
65