Embed Size (px)
Citation preview
1Characteristics of
High-Achieving and
Low-Achieving
Schools in Science
and Mathematics

Chapter 114
Overview
The purpose of this chapter is to search for indicators of school effectiveness by examining those school, class, and student character-istics that distinguish between schools with the highest averageachievement and those with the lowest average achievement in sci-ence and mathematics at the eighth grade. While variables identifiedusing this approach are not necessarily characteristics of effectiveschools, this procedure does provide an opportunity to review attrib-utes of high-achieving schools as a prelude to the more analyticapproach in Chapter 2.
What Is the Achievement Difference Between the High-Achieving and Low-Achieving Schools in each Country?
The contrast between high- and low-achieving schools is likely to bemost informative in countries where the gap between the two groupsis greatest. In countries where the differences between schools aresmall, there are likely to be few variables that can distinguish betweenhigh- and low-performing schools. Since the extent of differencesbetween schools is likely to vary across countries, this chapter beginswith a brief examination of the differences between the two groupsof schools in each country.
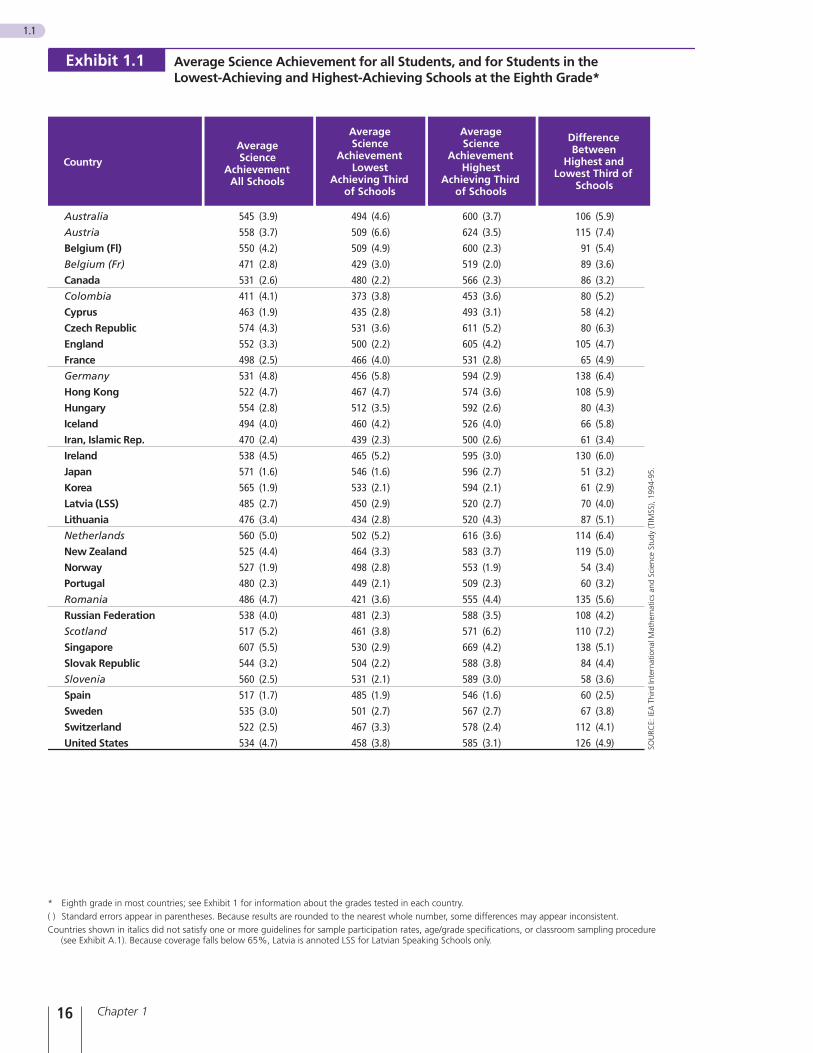
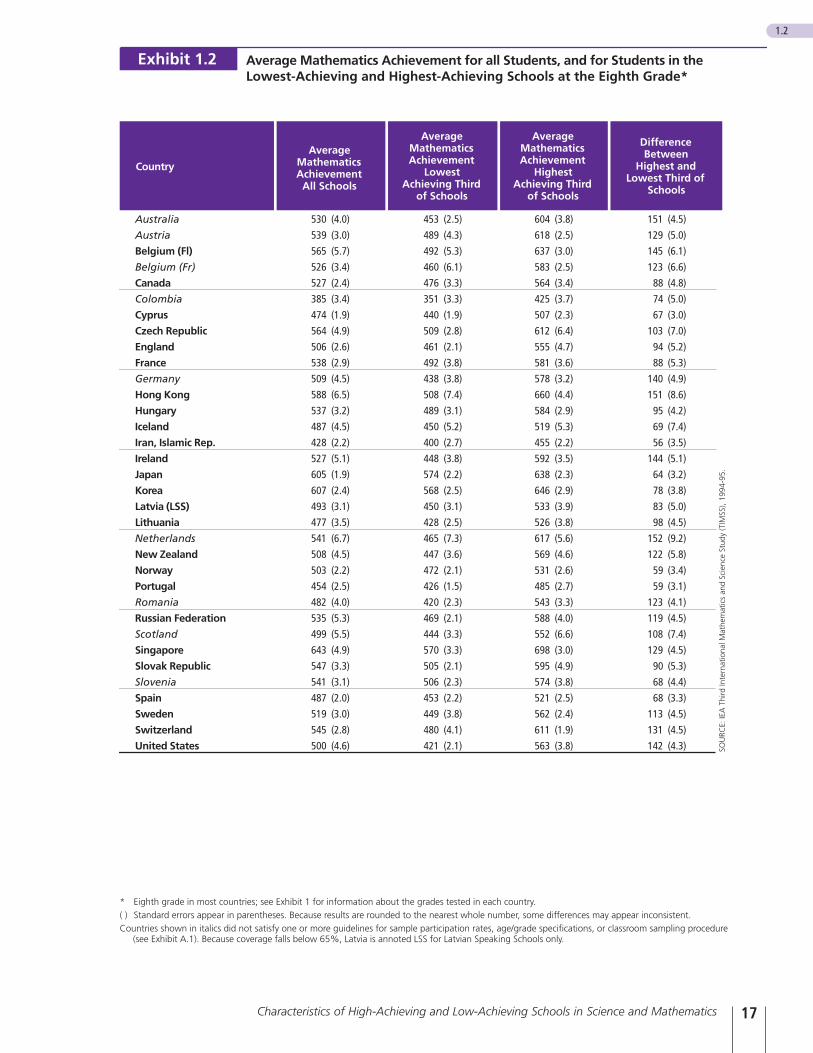
Average achievement for eighth-grade students overall, as well as themean for the highest-achieving one third and the lowest-achievingone third of the schools in the sample for each country and the dif-ference between these two groups, is shown in Exhibits 1.1 and 1.2for science and mathematics, respectively. These exhibits show thatwhile the average achievement of the high- and the low-achievingschools clearly differs in every country in both subjects, the differ-ence in some countries is very much greater than in others. In sci-ence, the difference ranges from as little as 51 scale score points inJapan to as much as 138 points in Germany and Singapore. In mathe-matics, the range is slightly greater, from a low of 56 in Iran to a highof 152 in the Netherlands. Although differences between the high-and low-achieving schools were slightly greater in mathematics thanin science, generally countries with a big difference in mathematicsalso had a big difference in science. Belgium (both French andFlemish parts) and Sweden were exceptions to this, with considerablysmaller differences in science than in mathematics.
It might be expected that the smallest differences between high- andlow-achieving schools would be in countries where the averageachievement was generally low; and while that was true in countriessuch as Colombia, Cyprus, Iran, Latvia(LSS), Lithuania, Portugal,and Romania, it was not always the case. Japan and Korea wereamong the highest-achieving countries in both mathematics and sci-
15Characteristics of High-Achieving and Low-Achieving Schools in Science and Mathematics
text continuedpage 18
Chapter 116
1.1
* Eighth grade in most countries; see Exhibit 1 for information about the grades tested in each country.( ) Standard errors appear in parentheses. Because results are rounded to the nearest whole number, some differences may appear inconsistent.Countries shown in italics did not satisfy one or more guidelines for sample participation rates, age/grade specifications, or classroom sampling procedure
(see Exhibit A.1). Because coverage falls below 65%, Latvia is annoted LSS for Latvian Speaking Schools only.
Average Science Achievement for all Students, and for Students in theLowest-Achieving and Highest-Achieving Schools at the Eighth Grade*
Exhibit 1.1
Australia
Austria
Belgium (Fl)
Belgium (Fr)
Canada
Colombia
Cyprus
Czech Republic
England
France
Germany
Hong Kong
Hungary
Iceland
Iran, Islamic Rep.
Ireland
Japan
Korea
Latvia (LSS)
Lithuania
Netherlands
New Zealand
Norway
Portugal
Romania
Russian Federation
Scotland
Singapore
Slovak Republic
Slovenia
Spain
Sweden
Switzerland
United States
106 (5.9)
115 (7.4)
91 (5.4)
89 (3.6)
86 (3.2)
80 (5.2)
58 (4.2)
80 (6.3)
105 (4.7)
65 (4.9)
138 (6.4)
108 (5.9)
80 (4.3)
66 (5.8)
61 (3.4)
130 (6.0)
51 (3.2)
61 (2.9)
70 (4.0)
87 (5.1)
114 (6.4)
119 (5.0)
54 (3.4)
60 (3.2)
135 (5.6)
108 (4.2)
110 (7.2)
138 (5.1)
84 (4.4)
58 (3.6)
60 (2.5)
67 (3.8)
112 (4.1)
126 (4.9)
600 (3.7)
624 (3.5)
600 (2.3)
519 (2.0)
566 (2.3)
453 (3.6)
493 (3.1)
611 (5.2)
605 (4.2)
531 (2.8)
594 (2.9)
574 (3.6)
592 (2.6)
526 (4.0)
500 (2.6)
595 (3.0)
596 (2.7)
594 (2.1)
520 (2.7)
520 (4.3)
616 (3.6)
583 (3.7)
553 (1.9)
509 (2.3)
555 (4.4)
588 (3.5)
571 (6.2)
669 (4.2)
588 (3.8)
589 (3.0)
546 (1.6)
567 (2.7)
578 (2.4)
585 (3.1)
494 (4.6)
509 (6.6)
509 (4.9)
429 (3.0)
480 (2.2)
373 (3.8)
435 (2.8)
531 (3.6)
500 (2.2)
466 (4.0)
456 (5.8)
467 (4.7)
512 (3.5)
460 (4.2)
439 (2.3)
465 (5.2)
546 (1.6)
533 (2.1)
450 (2.9)
434 (2.8)
502 (5.2)
464 (3.3)
498 (2.8)
449 (2.1)
421 (3.6)
481 (2.3)
461 (3.8)
530 (2.9)
504 (2.2)
531 (2.1)
485 (1.9)
501 (2.7)
467 (3.3)
458 (3.8)
545 (3.9)
558 (3.7)
550 (4.2)
471 (2.8)
531 (2.6)
411 (4.1)
463 (1.9)
574 (4.3)
552 (3.3)
498 (2.5)
531 (4.8)
522 (4.7)
554 (2.8)
494 (4.0)
470 (2.4)
538 (4.5)
571 (1.6)
565 (1.9)
485 (2.7)
476 (3.4)
560 (5.0)
525 (4.4)
527 (1.9)
480 (2.3)
486 (4.7)
538 (4.0)
517 (5.2)
607 (5.5)
544 (3.2)
560 (2.5)
517 (1.7)
535 (3.0)
522 (2.5)
534 (4.7) SOU
RCE:
IEA
Thi
rd In
tern
atio
nal M
athe
mat
ics
and
Scie
nce
Stud
y (T
IMSS
), 19
94-9
5.
AverageScience
AchievementAll Schools
Country
AverageScience
AchievementLowest
Achieving Thirdof Schools
AverageScience
AchievementHighest
Achieving Thirdof Schools
DifferenceBetween
Highest andLowest Third of
Schools
17Characteristics of High-Achieving and Low-Achieving Schools in Science and Mathematics
1.2
Average Mathematics Achievement for all Students, and for Students in theLowest-Achieving and Highest-Achieving Schools at the Eighth Grade*
Exhibit 1.2
SOU
RCE:
IEA
Thi
rd In
tern
atio
nal M
athe
mat
ics
and
Scie
nce
Stud
y (T
IMSS
), 19
94-9
5.
AverageMathematicsAchievement
All Schools
Country
AverageMathematicsAchievement
LowestAchieving Third
of Schools
AverageMathematicsAchievement
HighestAchieving Third
of Schools
DifferenceBetween
Highest andLowest Third of
Schools
Australia
Austria
Belgium (Fl)
Belgium (Fr)
Canada
Colombia
Cyprus
Czech Republic
England
France
Germany
Hong Kong
Hungary
Iceland
Iran, Islamic Rep.
Ireland
Japan
Korea
Latvia (LSS)
Lithuania
Netherlands
New Zealand
Norway
Portugal
Romania
Russian Federation
Scotland
Singapore
Slovak Republic
Slovenia
Spain
Sweden
Switzerland
United States
530 (4.0)
539 (3.0)
565 (5.7)
526 (3.4)
527 (2.4)
385 (3.4)
474 (1.9)
564 (4.9)
506 (2.6)
538 (2.9)
509 (4.5)
588 (6.5)
537 (3.2)
487 (4.5)
428 (2.2)
527 (5.1)
605 (1.9)
607 (2.4)
493 (3.1)
477 (3.5)
541 (6.7)
508 (4.5)
503 (2.2)
454 (2.5)
482 (4.0)
535 (5.3)
499 (5.5)
643 (4.9)
547 (3.3)
541 (3.1)
487 (2.0)
519 (3.0)
545 (2.8)
500 (4.6)
453 (2.5)
489 (4.3)
492 (5.3)
460 (6.1)
476 (3.3)
351 (3.3)
440 (1.9)
509 (2.8)
461 (2.1)
492 (3.8)
438 (3.8)
508 (7.4)
489 (3.1)
450 (5.2)
400 (2.7)
448 (3.8)
574 (2.2)
568 (2.5)
450 (3.1)
428 (2.5)
465 (7.3)
447 (3.6)
472 (2.1)
426 (1.5)
420 (2.3)
469 (2.1)
444 (3.3)
570 (3.3)
505 (2.1)
506 (2.3)
453 (2.2)
449 (3.8)
480 (4.1)
421 (2.1)
604 (3.8)
618 (2.5)
637 (3.0)
583 (2.5)
564 (3.4)
425 (3.7)
507 (2.3)
612 (6.4)
555 (4.7)
581 (3.6)
578 (3.2)
660 (4.4)
584 (2.9)
519 (5.3)
455 (2.2)
592 (3.5)
638 (2.3)
646 (2.9)
533 (3.9)
526 (3.8)
617 (5.6)
569 (4.6)
531 (2.6)
485 (2.7)
543 (3.3)
588 (4.0)
552 (6.6)
698 (3.0)
595 (4.9)
574 (3.8)
521 (2.5)
562 (2.4)
611 (1.9)
563 (3.8)
151 (4.5)
129 (5.0)
145 (6.1)
123 (6.6)
88 (4.8)
74 (5.0)
67 (3.0)
103 (7.0)
94 (5.2)
88 (5.3)
140 (4.9)
151 (8.6)
95 (4.2)
69 (7.4)
56 (3.5)
144 (5.1)
64 (3.2)
78 (3.8)
83 (5.0)
98 (4.5)
152 (9.2)
122 (5.8)
59 (3.4)
59 (3.1)
123 (4.1)
119 (4.5)
108 (7.4)
129 (4.5)
90 (5.3)
68 (4.4)
68 (3.3)
113 (4.5)
131 (4.5)
142 (4.3)
* Eighth grade in most countries; see Exhibit 1 for information about the grades tested in each country.( ) Standard errors appear in parentheses. Because results are rounded to the nearest whole number, some differences may appear inconsistent.Countries shown in italics did not satisfy one or more guidelines for sample participation rates, age/grade specifications, or classroom sampling procedure
(see Exhibit A.1). Because coverage falls below 65%, Latvia is annoted LSS for Latvian Speaking Schools only.
ence, and yet the high- and low-achieving schools differ very little, inrelative terms. This implies that these countries not only have highachievement on average, but that this high achievement is character-istic of most, if not all, of their schools.
Several countries with high average achievement, including Belgium(Flemish), the Czech Republic, Hong Kong, and Singapore in mathe-matics, and Austria, the Netherlands, and Singapore in science, hadcomparatively large differences in the achievement levels of the high-and low-achieving schools. All of these countries employ some formof streaming or tracking for eighth-grade students, either withinschools or between school types.
What are the Distinguishing Characteristics of High- andLow- Achieving Schools?
As described in the introduction, all TIMSS variables pertaining toschool, teacher, and student factors were first screened to identifythose that were associated with student achievement in mathematicsor science. The variables that survived this initial screening were fur-ther examined to isolate those that discriminated between high-achieving and low-achieving schools (see Appendix A for moredetails). The surviving variables were grouped into the following six categories:
• Home Background. This category consists of variables that are indica-tive of material and literacy resources in the home, including hav-ing a range of family possessions, a selection of study aids, lots ofbooks, and having parents with high levels of education.
• Home-School Interface. Included here are variables that may be influ-enced by both home and school factors, such as student aspira-tions and maternal and peer pressure for achievement.
• School Size and Location. These variables operate at the school level.They include the degree of urbanicity of the school, and the sizeof the school and of the class sampled.
• School Social Climate. The school social climate consists of factorsthat are conducive to a safe, orderly, and productive learningenvironment. Included are school discipline problems, both“administrative” problems such as dress code violations and moreserious misbehavior.
• Student Attitude towards Science or Mathematics. This category consistsof student attitudinal factors, including attitude towards science, atti-tude towards mathematics, and a belief in the efficacy of science.
Chapter 118
continued frompage 15
• Instructional Activities in Science or Mathematics Class. This includesvariables that describe aspects of classroom instruction, such as fre-quency of experiments in science, and the frequency with whichthe teacher checks homework in mathematics.
Home Background
Previous studies of schools effectiveness1 have emphasized the needto take into account the effects of student home background and thecomposition of the student body when studying the effects of schoolfactors on achievement. Student home background in this contextincludes not only socioeconomic factors, but also indices of parentalemphasis on and support for academic achievement.2
In the present study the home background category includes indica-tors of both academic emphasis and socioeconomic status. There arefive variables in all:
• number of books in the home
• presence of study aids (dictionary, study desk, computer)
• possessions in the home
• level of educational attainment of parents
• number of hours spent working at home
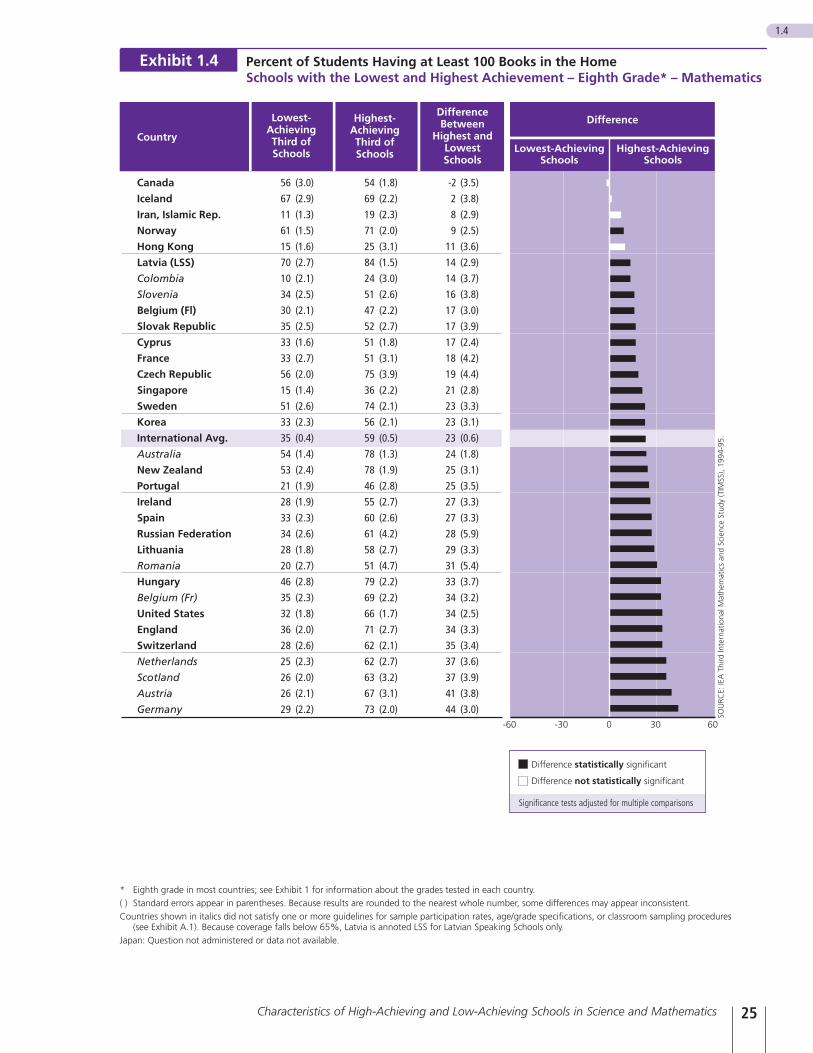
Books in the Home The number of books in the home is a very useful indicator of homeliteracy support, and is one of the few variables that correlates posi-tively with student achievement in practically all TIMSS countries.Common sense would support the notion that educational benefitsflow from the availability of a range of reading materials within stu-dents’ homes. Students can strengthen and deepen their understand-ing of concepts covered in class through the use of encyclopediasand other reference books at home; and more generally, a widerange of reading material at home can be thought to foster academicinterests and serve to encourage learning.
Students were asked to estimate the number of books in their homes.This variable discriminated very effectively between high-achievingand low-achieving schools. In almost all countries, as shown inExhibits 1.3 and 1.4, substantially greater percentages of students inthe high-achieving schools reported having at least 100 books at
19Characteristics of High-Achieving and Low-Achieving Schools in Science and Mathematics
1 Coleman, J. (1966). Equality of Educational Opportunity. Washington, U.S. Government Printing Office.
Jencks, C. S., Smith, M., Acland, H., Bane, M. J., Cohen, D., Ginter, H., Heyns, B., and Michelson, S.(1972). Inequality: A Reassessment of the Effect of the Family and Schooling in America. New York: Basic Books.
Blakey, L.S., and Heath, A.F. (1992). “Differences Between Comprehensive Schools: Some PreliminaryFindings.” In D. Reynolds and P. Cuttance (Eds.) School Effectiveness: Research, policy and practice. London:Cassell.
2 Hanson, S.L., and Ginsburg, A.L. (1988). “Gaining Ground: Values and High School Success,” AmericanEducational Research Journal, Vol. 25, 334-365.
homes. This difference was significant in all countries except Iceland,Iran, and Latvia for science, and Canada, Iceland, Iran, and HongKong for mathematics. Across countries, the average difference was23 percentage points for both mathematics and science.
In many countries, the percentage of students that reported havingat least 100 books at home was indeed much higher among high-achieving schools. For example, in Austria, England, Germany, theNetherlands, Scotland, Switzerland, and the United States, the per-centage of students in the high-achieving schools in science thatreported having at least 100 books was more than twice the percent-age in the low-achieving schools. In mathematics, the situation wassimilar, with these seven countries also among those with the greatestdifference in book ownership.
Not surprisingly, perhaps, the countries with the greatest differencein book ownership between high- and low-achieving schools also hadvery large differences in mean achievement in science and mathe-matics between the two groups of schools. Conversely, the 15 coun-tries with the smallest disparities in the percentages of students withat least 100 books also had relatively small differences between thehigh- and low-achieving schools in science achievement. A notableexception to this trend was Hong Kong.3 A similar trend was notice-able in the mathematics results, although here the exceptions wereBelgium (Flemish), the Czech Republic, Hong Kong, Singapore, andSweden, where the difference in book ownership was small, but theachievement difference was large.
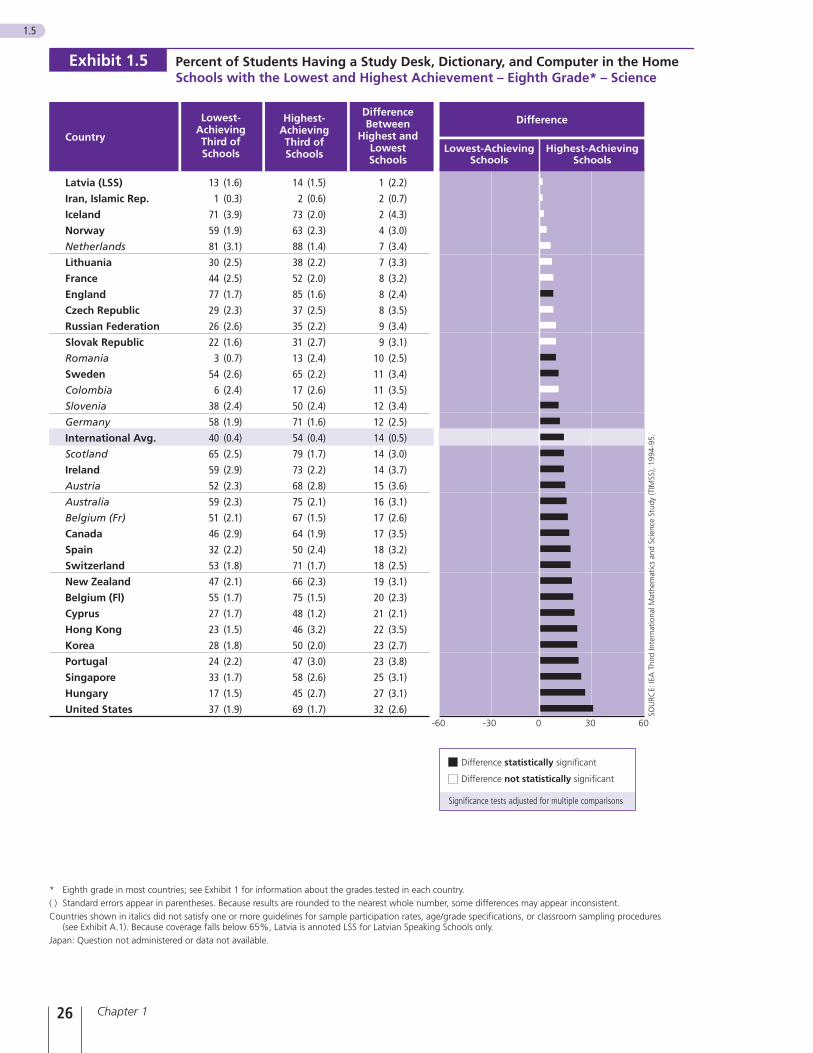
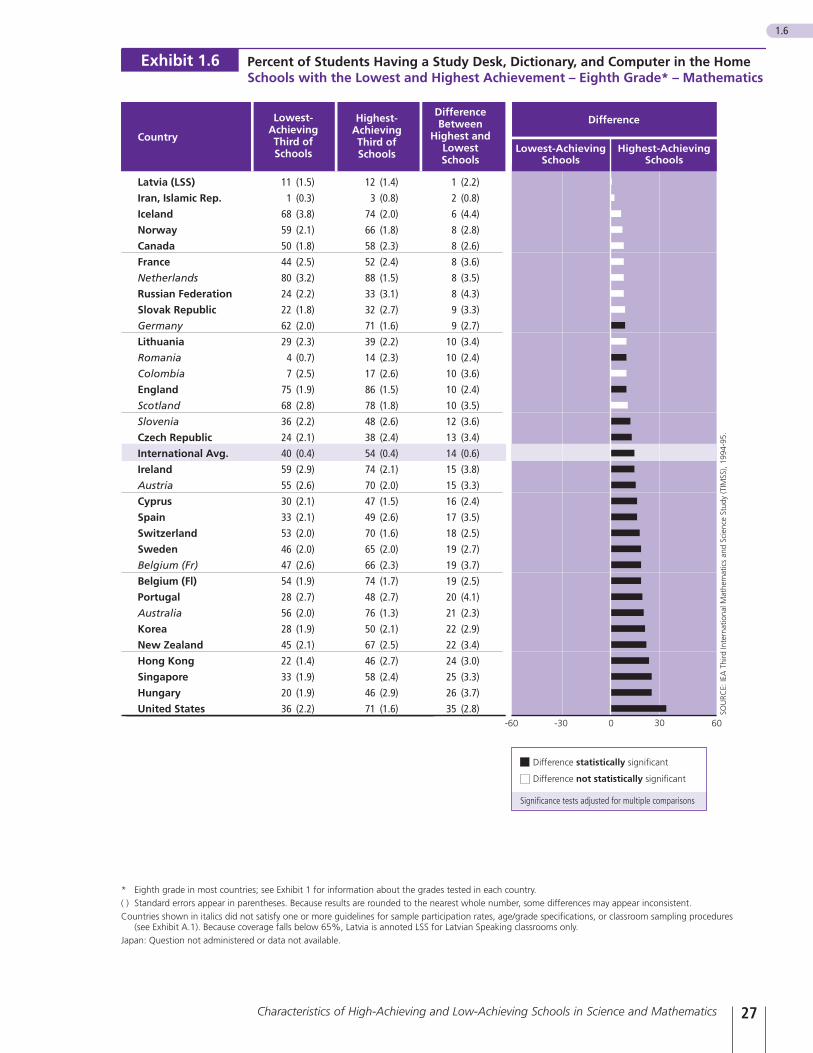
Study Aids in the Home The availability of specific resources that promote learning in thehome can help develop a positive attitude toward learning andenhance study practices. The presence of a study desk, dictionary,and computer are indicators not only of the importance placed uponeducation, but also of the economic resources available to the family.Taken together, the presence of these study aids in students’ homesserves as a powerful discriminator between high- and low-achievingschools, second only to the number of books in the family home inthis study.
The percentages of eighth-grade students having all three study aids(study desk, dictionary, and computer) in their homes are presented inExhibits 1.5 and 1.6 for science and mathematics, respectively. Formost countries, significantly greater percentages of students in thehigh-achieving schools reported having all three aids than did studentsin the low-achieving schools. The difference was most pronounced inHungary, Singapore, and the United States. The average difference was14 percentage points for both science and mathematics.
Chapter 120
3 In Hong Kong, high population density and high property values combine to keep living quarters andstorage space small, and consequently, high levels of book ownership are not usual.
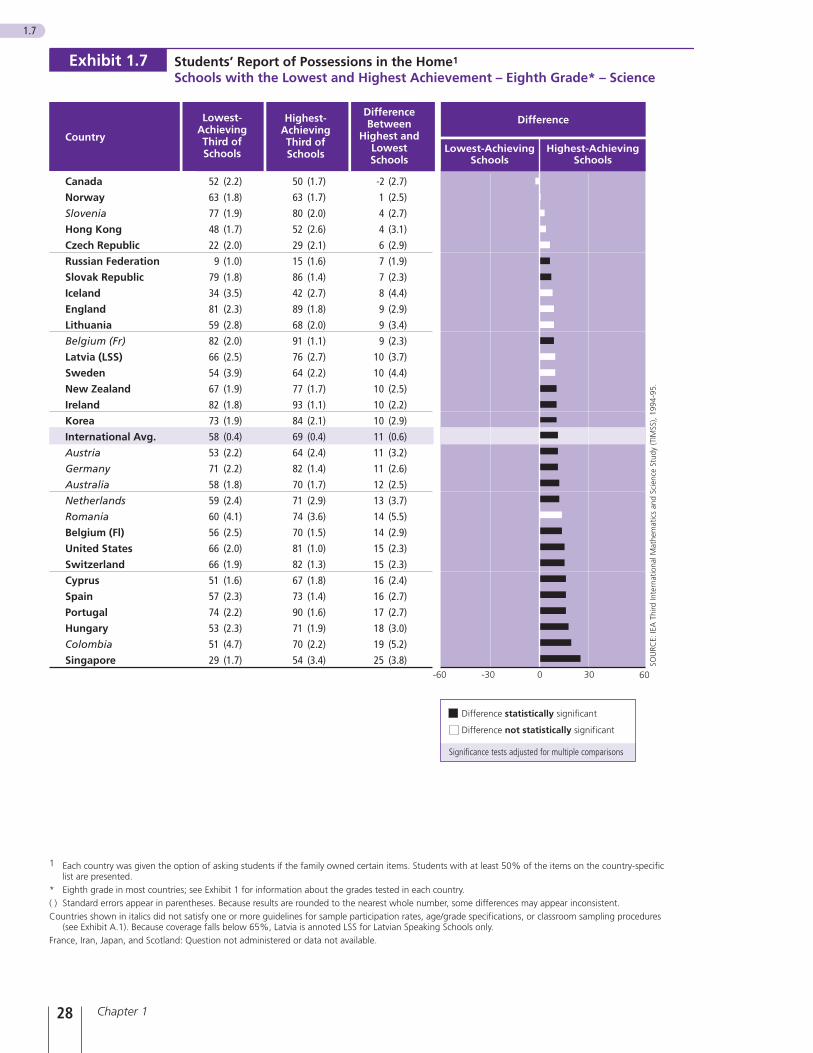
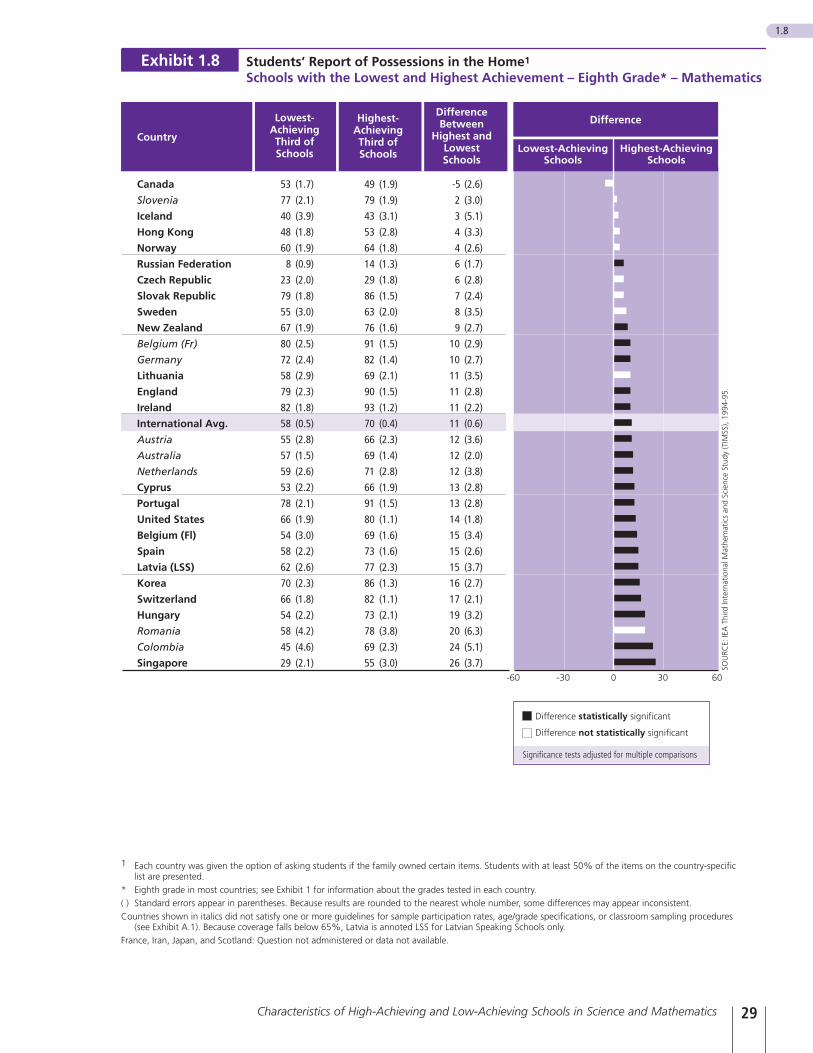
Possessions in the Home The material possessions of a family can be a useful indicator of thesocioeconomic status of the family. The student questionnaire includ-ed a section in which each country presented a list of items thatwould be likely to be found in the homes of affluent families in thatcountry. Students were asked to indicate which of the items they hadin their own homes. The list varied from country to country; forexample, the Swedish list had 12 items, including a sauna, a videocamera, a sail or motor boat, and access to a summer house. Norwayalso had 12 items, but included both educational supports (an ency-clopedia, an atlas, and a globe) and recreational elements (videocamera, more than one TV, and more than one car).
Exhibits 1.7 and 1.8 show the percentages of students in the high-and low-achieving schools in each country that reported having intheir homes at least half of the items on the list for their country.Across countries, the average difference was 11 percentage points forboth science and mathematics. The greatest differences between thehigh- and low-achieving schools were found in Colombia andSingapore. Countries with no significant difference in either scienceor mathematics included Canada, the Czech Republic, Hong Kong,Iceland, Lithuania, Norway, Romania, Slovenia, and Sweden.
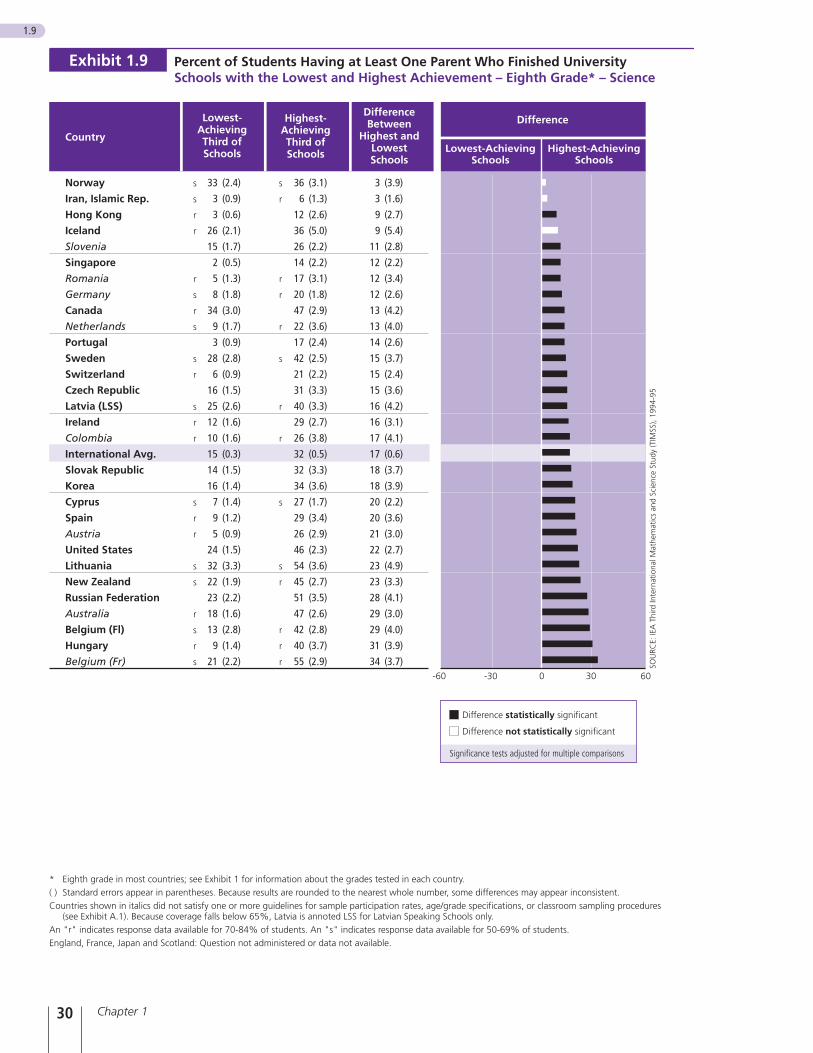
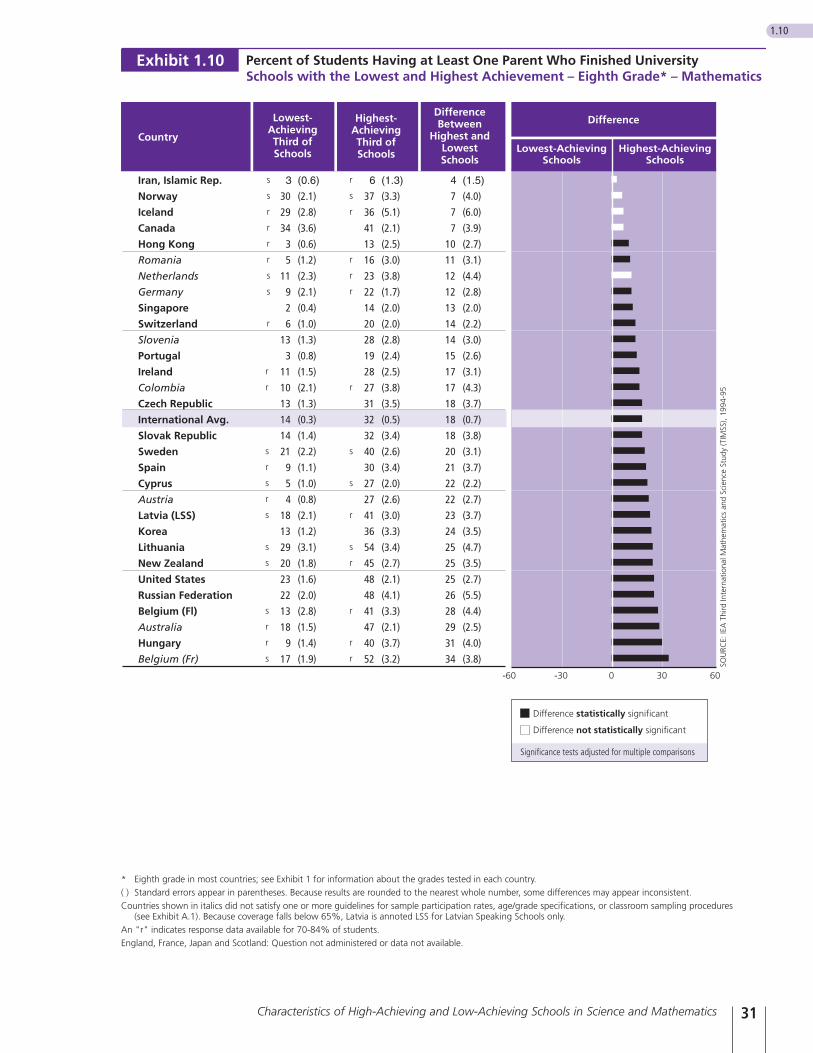
Educational Attainment of Parents Homes where parents have attained a high level of education arelikely to place high value on academic achievement in children, andto be relatively affluent. As reported in Exhibits 1.9 and 1.10, inalmost all countries significantly greater percentages of students inthe high-achieving schools reported that they had at least one parentwho had completed a university education, than did students in thelow-achieving schools. The average difference was 17 percentagepoints in science and 18 points in mathematics. The four countrieswith the greatest differences in both mathematics and science includ-ed Australia, Belgium (both Flemish and French), Hungary, and theRussian Federation. Countries with no significant difference in eithermathematics or science included Iceland, Iran, and Norway.
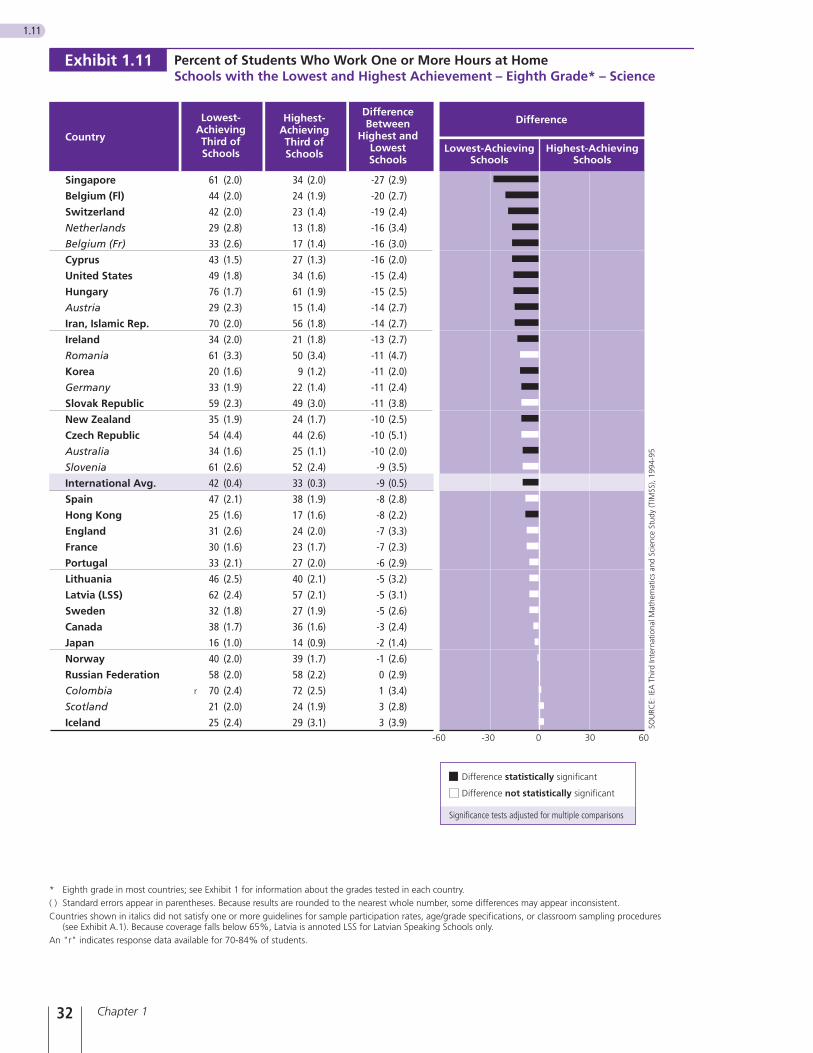
Students Doing Jobs at Home However desirable it may seem that children perform their share ofhousehold chores, and regardless of the intuitive notion that suchactivities foster children’s development, the TIMSS data show a neg-ative association in most countries between time spent on choresand student achievement. It seems that, despite the positive aspectsof children helping in the home, a student who spends consider-able time doing household chores is less likely to have time avail-able for study, and that spending as little as one hour per day insuch activities may be associated with lower achievement in mathe-matics and science.
21Characteristics of High-Achieving and Low-Achieving Schools in Science and Mathematics
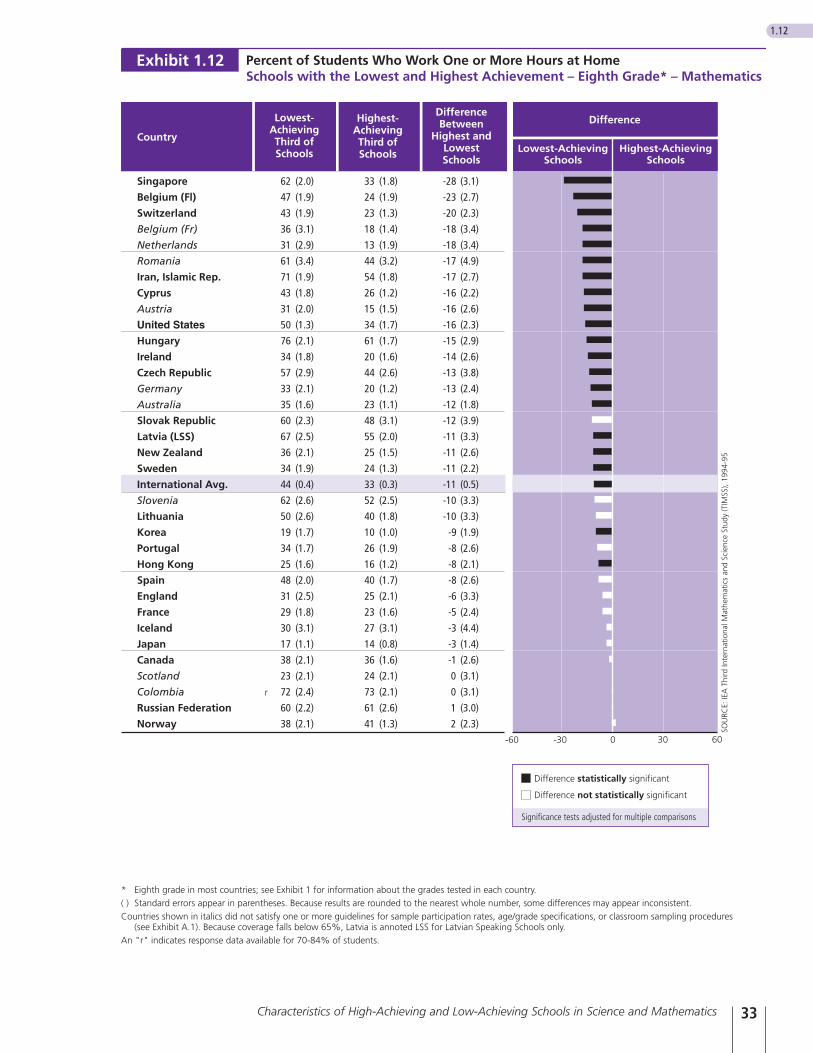
In many countries, significantly greater percentages of students inthe low-achieving schools reported that they spent one or morehours daily working at home than did students in the high-achievingschools (see Exhibits 1.11 and 1.12). On average across countries, thedifference was greater by 9 percentage points in science and 11points in mathematics. The difference was particularly pronouncedin Singapore, and was also large in Belgium (Flemish and French),the Netherlands, and Switzerland for both science and mathematics.These countries also had large differences in average mathematicsachievement (120 points or more) and at least moderate differencesin science achievement (89 points or more).
Chapter 122
23Characteristics of High-Achieving and Low-Achieving Schools in Science and Mathematics
Exhibit 1.3 - 1.12 Overleaf

Chapter 124
1.3
* Eighth grade in most countries; see Exhibit 1 for information about the grades tested in each country.( ) Standard errors appear in parentheses. Because results are rounded to the nearest whole number, some differences may appear inconsistent.Countries shown in italics did not satisfy one or more guidelines for sample participation rates, age/grade specifications, or classroom sampling procedures
(see Exhibit A.1). Because coverage falls below 65%, Latvia is annoted LSS for Latvian Speaking Schools only.Japan: Question not administered or data not available.
Percent of Students Having at Least 100 Books in the HomeSchools with the Lowest and Highest Achievement – Eighth Grade* – Science
Exhibit 1.3
SOU
RCE:
IEA
Thi
rd In
tern
atio
nal M
athe
mat
ics
and
Scie
nce
Stud
y (T
IMSS
), 19
94-9
5.
60-60 0-30 30
Country
DifferenceBetween
Highest andLowestSchools
Highest-AchievingThird ofSchools
Lowest-AchievingThird ofSchools
Iran, Islamic Rep. 12 (1.8) 18 (2.2) 6 (2.8)
Latvia (LSS) 75 (2.3) 82 (1.4) 8 (2.7)
Iceland 62 (3.4) 71 (1.9) 9 (3.9)
Norway 61 (1.4) 71 (1.9) 10 (2.3)
Hong Kong 14 (1.5) 25 (2.9) 11 (3.3)
Colombia 11 (1.9) 24 (2.9) 13 (3.5)
Slovenia 38 (2.8) 52 (2.2) 14 (3.6)
Cyprus 35 (2.0) 50 (1.5) 15 (2.5)
Sweden 56 (2.6) 71 (2.1) 15 (3.4)
Belgium (Fl) 31 (1.6) 47 (2.3) 16 (2.8)
France 34 (2.9) 50 (3.3) 16 (4.4)
Korea 37 (2.2) 53 (2.3) 17 (3.2)
Slovak Republic 34 (2.3) 51 (2.9) 17 (3.7)
Canada 48 (2.2) 65 (2.0) 18 (3.0)
Czech Republic 57 (1.7) 76 (2.6) 19 (3.1)
Romania 25 (3.2) 45 (4.8) 20 (5.8)
Australia 56 (2.0) 78 (1.4) 22 (2.5)
Singapore 15 (1.3) 37 (2.1) 22 (2.5)
International Avg. 36 (0.4) 59 (0.4) 23 (0.6)
Portugal 21 (2.0) 44 (2.9) 23 (3.5)
Spain 34 (2.6) 59 (2.3) 25 (3.5)
Russian Federation 37 (2.9) 63 (3.0) 26 (4.2)
Lithuania 31 (2.0) 58 (2.5) 26 (3.2)
Ireland 29 (1.9) 55 (2.7) 27 (3.3)
New Zealand 52 (2.2) 80 (1.6) 27 (2.7)
Belgium (Fr) 40 (1.5) 71 (2.5) 30 (2.9)
Hungary 46 (2.5) 78 (2.2) 32 (3.4)
United States 32 (2.0) 64 (1.8) 32 (2.7)
Netherlands 24 (2.2) 61 (2.9) 37 (3.6)
England 36 (2.3) 73 (2.4) 37 (3.3)
Austria 27 (2.1) 65 (3.9) 38 (4.5)
Scotland 23 (2.0) 62 (3.4) 39 (3.9)
Germany 31 (2.9) 72 (2.1) 41 (3.5)
Switzerland 27 (2.3) 68 (1.8) 41 (3.0)
Difference
Lowest-AchievingSchools
Highest-AchievingSchools
Difference statistically significant
Difference not statistically significant
Significance tests adjusted for multiple comparisons
25Characteristics of High-Achieving and Low-Achieving Schools in Science and Mathematics
1.4
* Eighth grade in most countries; see Exhibit 1 for information about the grades tested in each country.( ) Standard errors appear in parentheses. Because results are rounded to the nearest whole number, some differences may appear inconsistent.Countries shown in italics did not satisfy one or more guidelines for sample participation rates, age/grade specifications, or classroom sampling procedures
(see Exhibit A.1). Because coverage falls below 65%, Latvia is annoted LSS for Latvian Speaking Schools only.Japan: Question not administered or data not available.
Percent of Students Having at Least 100 Books in the HomeSchools with the Lowest and Highest Achievement – Eighth Grade* – Mathematics
Exhibit 1.4
SOU
RCE:
IEA
Thi
rd In
tern
atio
nal M
athe
mat
ics
and
Scie
nce
Stud
y (T
IMSS
), 19
94-9
5.
Canada 56 (3.0) 54 (1.8) -2 (3.5)
Iceland 67 (2.9) 69 (2.2) 2 (3.8)
Iran, Islamic Rep. 11 (1.3) 19 (2.3) 8 (2.9)
Norway 61 (1.5) 71 (2.0) 9 (2.5)
Hong Kong 15 (1.6) 25 (3.1) 11 (3.6)
Latvia (LSS) 70 (2.7) 84 (1.5) 14 (2.9)
Colombia 10 (2.1) 24 (3.0) 14 (3.7)
Slovenia 34 (2.5) 51 (2.6) 16 (3.8)
Belgium (Fl) 30 (2.1) 47 (2.2) 17 (3.0)
Slovak Republic 35 (2.5) 52 (2.7) 17 (3.9)
Cyprus 33 (1.6) 51 (1.8) 17 (2.4)
France 33 (2.7) 51 (3.1) 18 (4.2)
Czech Republic 56 (2.0) 75 (3.9) 19 (4.4)
Singapore 15 (1.4) 36 (2.2) 21 (2.8)
Sweden 51 (2.6) 74 (2.1) 23 (3.3)
Korea 33 (2.3) 56 (2.1) 23 (3.1)
International Avg. 35 (0.4) 59 (0.5) 23 (0.6)
Australia 54 (1.4) 78 (1.3) 24 (1.8)
New Zealand 53 (2.4) 78 (1.9) 25 (3.1)
Portugal 21 (1.9) 46 (2.8) 25 (3.5)
Ireland 28 (1.9) 55 (2.7) 27 (3.3)
Spain 33 (2.3) 60 (2.6) 27 (3.3)
Russian Federation 34 (2.6) 61 (4.2) 28 (5.9)
Lithuania 28 (1.8) 58 (2.7) 29 (3.3)
Romania 20 (2.7) 51 (4.7) 31 (5.4)
Hungary 46 (2.8) 79 (2.2) 33 (3.7)
Belgium (Fr) 35 (2.3) 69 (2.2) 34 (3.2)
United States 32 (1.8) 66 (1.7) 34 (2.5)
England 36 (2.0) 71 (2.7) 34 (3.3)
Switzerland 28 (2.6) 62 (2.1) 35 (3.4)
Netherlands 25 (2.3) 62 (2.7) 37 (3.6)
Scotland 26 (2.0) 63 (3.2) 37 (3.9)
Austria 26 (2.1) 67 (3.1) 41 (3.8)
Germany 29 (2.2) 73 (2.0) 44 (3.0)60-60 0-30 30
Difference
Lowest-AchievingSchools
Highest-AchievingSchools
Country
DifferenceBetween
Highest andLowestSchools
Highest-AchievingThird ofSchools
Lowest-AchievingThird ofSchools
Difference statistically significant
Difference not statistically significant
Significance tests adjusted for multiple comparisons
Chapter 126
1.5
* Eighth grade in most countries; see Exhibit 1 for information about the grades tested in each country.( ) Standard errors appear in parentheses. Because results are rounded to the nearest whole number, some differences may appear inconsistent.Countries shown in italics did not satisfy one or more guidelines for sample participation rates, age/grade specifications, or classroom sampling procedures
(see Exhibit A.1). Because coverage falls below 65%, Latvia is annoted LSS for Latvian Speaking Schools only.Japan: Question not administered or data not available.
Percent of Students Having a Study Desk, Dictionary, and Computer in the HomeSchools with the Lowest and Highest Achievement – Eighth Grade* – Science
Exhibit 1.5
Latvia (LSS) 13 (1.6) 14 (1.5) 1 (2.2)
Iran, Islamic Rep. 1 (0.3) 2 (0.6) 2 (0.7)
Iceland 71 (3.9) 73 (2.0) 2 (4.3)
Norway 59 (1.9) 63 (2.3) 4 (3.0)
Netherlands 81 (3.1) 88 (1.4) 7 (3.4)
Lithuania 30 (2.5) 38 (2.2) 7 (3.3)
France 44 (2.5) 52 (2.0) 8 (3.2)
England 77 (1.7) 85 (1.6) 8 (2.4)
Czech Republic 29 (2.3) 37 (2.5) 8 (3.5)
Russian Federation 26 (2.6) 35 (2.2) 9 (3.4)
Slovak Republic 22 (1.6) 31 (2.7) 9 (3.1)
Romania 3 (0.7) 13 (2.4) 10 (2.5)
Sweden 54 (2.6) 65 (2.2) 11 (3.4)
Colombia 6 (2.4) 17 (2.6) 11 (3.5)
Slovenia 38 (2.4) 50 (2.4) 12 (3.4)
Germany 58 (1.9) 71 (1.6) 12 (2.5)
International Avg. 40 (0.4) 54 (0.4) 14 (0.5)
Scotland 65 (2.5) 79 (1.7) 14 (3.0)
Ireland 59 (2.9) 73 (2.2) 14 (3.7)
Austria 52 (2.3) 68 (2.8) 15 (3.6)
Australia 59 (2.3) 75 (2.1) 16 (3.1)
Belgium (Fr) 51 (2.1) 67 (1.5) 17 (2.6)
Canada 46 (2.9) 64 (1.9) 17 (3.5)
Spain 32 (2.2) 50 (2.4) 18 (3.2)
Switzerland 53 (1.8) 71 (1.7) 18 (2.5)
New Zealand 47 (2.1) 66 (2.3) 19 (3.1)
Belgium (Fl) 55 (1.7) 75 (1.5) 20 (2.3)
Cyprus 27 (1.7) 48 (1.2) 21 (2.1)
Hong Kong 23 (1.5) 46 (3.2) 22 (3.5)
Korea 28 (1.8) 50 (2.0) 23 (2.7)
Portugal 24 (2.2) 47 (3.0) 23 (3.8)
Singapore 33 (1.7) 58 (2.6) 25 (3.1)
Hungary 17 (1.5) 45 (2.7) 27 (3.1)
United States 37 (1.9) 69 (1.7) 32 (2.6)60-60 0-30 30
Difference
Lowest-AchievingSchools
Highest-AchievingSchools
Country
DifferenceBetween
Highest andLowestSchools
Highest-AchievingThird ofSchools
Lowest-AchievingThird ofSchools
SOU
RCE:
IEA
Thi
rd In
tern
atio
nal M
athe
mat
ics
and
Scie
nce
Stud
y (T
IMSS
), 19
94-9
5.
Difference statistically significant
Difference not statistically significant
Significance tests adjusted for multiple comparisons
27Characteristics of High-Achieving and Low-Achieving Schools in Science and Mathematics
1.6
* Eighth grade in most countries; see Exhibit 1 for information about the grades tested in each country.( ) Standard errors appear in parentheses. Because results are rounded to the nearest whole number, some differences may appear inconsistent.Countries shown in italics did not satisfy one or more guidelines for sample participation rates, age/grade specifications, or classroom sampling procedures
(see Exhibit A.1). Because coverage falls below 65%, Latvia is annoted LSS for Latvian Speaking classrooms only.Japan: Question not administered or data not available.
Percent of Students Having a Study Desk, Dictionary, and Computer in the HomeSchools with the Lowest and Highest Achievement – Eighth Grade* – Mathematics
Exhibit 1.6
SOU
RCE:
IEA
Thi
rd In
tern
atio
nal M
athe
mat
ics
and
Scie
nce
Stud
y (T
IMSS
), 19
94-9
5.
Latvia (LSS) 11 (1.5) 12 (1.4) 1 (2.2)
Iran, Islamic Rep. 1 (0.3) 3 (0.8) 2 (0.8)
Iceland 68 (3.8) 74 (2.0) 6 (4.4)
Norway 59 (2.1) 66 (1.8) 8 (2.8)
Canada 50 (1.8) 58 (2.3) 8 (2.6)
France 44 (2.5) 52 (2.4) 8 (3.6)
Netherlands 80 (3.2) 88 (1.5) 8 (3.5)
Russian Federation 24 (2.2) 33 (3.1) 8 (4.3)
Slovak Republic 22 (1.8) 32 (2.7) 9 (3.3)
Germany 62 (2.0) 71 (1.6) 9 (2.7)
Lithuania 29 (2.3) 39 (2.2) 10 (3.4)
Romania 4 (0.7) 14 (2.3) 10 (2.4)
Colombia 7 (2.5) 17 (2.6) 10 (3.6)
England 75 (1.9) 86 (1.5) 10 (2.4)
Scotland 68 (2.8) 78 (1.8) 10 (3.5)
Slovenia 36 (2.2) 48 (2.6) 12 (3.6)
Czech Republic 24 (2.1) 38 (2.4) 13 (3.4)
International Avg. 40 (0.4) 54 (0.4) 14 (0.6)
Ireland 59 (2.9) 74 (2.1) 15 (3.8)
Austria 55 (2.6) 70 (2.0) 15 (3.3)
Cyprus 30 (2.1) 47 (1.5) 16 (2.4)
Spain 33 (2.1) 49 (2.6) 17 (3.5)
Switzerland 53 (2.0) 70 (1.6) 18 (2.5)
Sweden 46 (2.0) 65 (2.0) 19 (2.7)
Belgium (Fr) 47 (2.6) 66 (2.3) 19 (3.7)
Belgium (Fl) 54 (1.9) 74 (1.7) 19 (2.5)
Portugal 28 (2.7) 48 (2.7) 20 (4.1)
Australia 56 (2.0) 76 (1.3) 21 (2.3)
Korea 28 (1.9) 50 (2.1) 22 (2.9)
New Zealand 45 (2.1) 67 (2.5) 22 (3.4)
Hong Kong 22 (1.4) 46 (2.7) 24 (3.0)
Singapore 33 (1.9) 58 (2.4) 25 (3.3)
Hungary 20 (1.9) 46 (2.9) 26 (3.7)
United States 36 (2.2) 71 (1.6) 35 (2.8)60-60 0-30 30
Difference
Lowest-AchievingSchools
Highest-AchievingSchools
Country
DifferenceBetween
Highest andLowestSchools
Highest-AchievingThird ofSchools
Lowest-AchievingThird ofSchools
Difference statistically significant
Difference not statistically significant
Significance tests adjusted for multiple comparisons
Chapter 128
1.7
1 Each country was given the option of asking students if the family owned certain items. Students with at least 50% of the items on the country-specificlist are presented.
* Eighth grade in most countries; see Exhibit 1 for information about the grades tested in each country.( ) Standard errors appear in parentheses. Because results are rounded to the nearest whole number, some differences may appear inconsistent.Countries shown in italics did not satisfy one or more guidelines for sample participation rates, age/grade specifications, or classroom sampling procedures
(see Exhibit A.1). Because coverage falls below 65%, Latvia is annoted LSS for Latvian Speaking Schools only.France, Iran, Japan, and Scotland: Question not administered or data not available.
Students’ Report of Possessions in the Home1
Schools with the Lowest and Highest Achievement – Eighth Grade* – ScienceExhibit 1.7
Canada 52 (2.2) 50 (1.7) -2 (2.7)
Norway 63 (1.8) 63 (1.7) 1 (2.5)
Slovenia 77 (1.9) 80 (2.0) 4 (2.7)
Hong Kong 48 (1.7) 52 (2.6) 4 (3.1)
Czech Republic 22 (2.0) 29 (2.1) 6 (2.9)
Russian Federation 9 (1.0) 15 (1.6) 7 (1.9)
Slovak Republic 79 (1.8) 86 (1.4) 7 (2.3)
Iceland 34 (3.5) 42 (2.7) 8 (4.4)
England 81 (2.3) 89 (1.8) 9 (2.9)
Lithuania 59 (2.8) 68 (2.0) 9 (3.4)
Belgium (Fr) 82 (2.0) 91 (1.1) 9 (2.3)
Latvia (LSS) 66 (2.5) 76 (2.7) 10 (3.7)
Sweden 54 (3.9) 64 (2.2) 10 (4.4)
New Zealand 67 (1.9) 77 (1.7) 10 (2.5)
Ireland 82 (1.8) 93 (1.1) 10 (2.2)
Korea 73 (1.9) 84 (2.1) 10 (2.9)
International Avg. 58 (0.4) 69 (0.4) 11 (0.6)
Austria 53 (2.2) 64 (2.4) 11 (3.2)
Germany 71 (2.2) 82 (1.4) 11 (2.6)
Australia 58 (1.8) 70 (1.7) 12 (2.5)
Netherlands 59 (2.4) 71 (2.9) 13 (3.7)
Romania 60 (4.1) 74 (3.6) 14 (5.5)
Belgium (Fl) 56 (2.5) 70 (1.5) 14 (2.9)
United States 66 (2.0) 81 (1.0) 15 (2.3)
Switzerland 66 (1.9) 82 (1.3) 15 (2.3)
Cyprus 51 (1.6) 67 (1.8) 16 (2.4)
Spain 57 (2.3) 73 (1.4) 16 (2.7)
Portugal 74 (2.2) 90 (1.6) 17 (2.7)
Hungary 53 (2.3) 71 (1.9) 18 (3.0)
Colombia 51 (4.7) 70 (2.2) 19 (5.2)
Singapore 29 (1.7) 54 (3.4) 25 (3.8) SOU
RCE:
IEA
Thi
rd In
tern
atio
nal M
athe
mat
ics
and
Scie
nce
Stud
y (T
IMSS
), 19
94-9
5.
60-60 0-30 30
Difference
Lowest-AchievingSchools
Highest-AchievingSchools
Country
DifferenceBetween
Highest andLowestSchools
Highest-AchievingThird ofSchools
Lowest-AchievingThird ofSchools
Difference statistically significant
Difference not statistically significant
Significance tests adjusted for multiple comparisons
29Characteristics of High-Achieving and Low-Achieving Schools in Science and Mathematics
1.8
1 Each country was given the option of asking students if the family owned certain items. Students with at least 50% of the items on the country-specificlist are presented.
* Eighth grade in most countries; see Exhibit 1 for information about the grades tested in each country.( ) Standard errors appear in parentheses. Because results are rounded to the nearest whole number, some differences may appear inconsistent.Countries shown in italics did not satisfy one or more guidelines for sample participation rates, age/grade specifications, or classroom sampling procedures
(see Exhibit A.1). Because coverage falls below 65%, Latvia is annoted LSS for Latvian Speaking Schools only.France, Iran, Japan, and Scotland: Question not administered or data not available.
Students’ Report of Possessions in the Home1
Schools with the Lowest and Highest Achievement – Eighth Grade* – MathematicsExhibit 1.8
Canada 53 (1.7) 49 (1.9) -5 (2.6)
Slovenia 77 (2.1) 79 (1.9) 2 (3.0)
Iceland 40 (3.9) 43 (3.1) 3 (5.1)
Hong Kong 48 (1.8) 53 (2.8) 4 (3.3)
Norway 60 (1.9) 64 (1.8) 4 (2.6)
Russian Federation 8 (0.9) 14 (1.3) 6 (1.7)
Czech Republic 23 (2.0) 29 (1.8) 6 (2.8)
Slovak Republic 79 (1.8) 86 (1.5) 7 (2.4)
Sweden 55 (3.0) 63 (2.0) 8 (3.5)
New Zealand 67 (1.9) 76 (1.6) 9 (2.7)
Belgium (Fr) 80 (2.5) 91 (1.5) 10 (2.9)
Germany 72 (2.4) 82 (1.4) 10 (2.7)
Lithuania 58 (2.9) 69 (2.1) 11 (3.5)
England 79 (2.3) 90 (1.5) 11 (2.8)
Ireland 82 (1.8) 93 (1.2) 11 (2.2)
International Avg. 58 (0.5) 70 (0.4) 11 (0.6)
Austria 55 (2.8) 66 (2.3) 12 (3.6)
Australia 57 (1.5) 69 (1.4) 12 (2.0)
Netherlands 59 (2.6) 71 (2.8) 12 (3.8)
Cyprus 53 (2.2) 66 (1.9) 13 (2.8)
Portugal 78 (2.1) 91 (1.5) 13 (2.8)
United States 66 (1.9) 80 (1.1) 14 (1.8)
Belgium (Fl) 54 (3.0) 69 (1.6) 15 (3.4)
Spain 58 (2.2) 73 (1.6) 15 (2.6)
Latvia (LSS) 62 (2.6) 77 (2.3) 15 (3.7)
Korea 70 (2.3) 86 (1.3) 16 (2.7)
Switzerland 66 (1.8) 82 (1.1) 17 (2.1)
Hungary 54 (2.2) 73 (2.1) 19 (3.2)
Romania 58 (4.2) 78 (3.8) 20 (6.3)
Colombia 45 (4.6) 69 (2.3) 24 (5.1)
Singapore 29 (2.1) 55 (3.0) 26 (3.7) SOU
RCE:
IEA
Thi
rd In
tern
atio
nal M
athe
mat
ics
and
Scie
nce
Stud
y (T
IMSS
), 19
94-9
5.
60-60 0-30 30
Difference
Lowest-AchievingSchools
Highest-AchievingSchools
Country
DifferenceBetween
Highest andLowestSchools
Highest-AchievingThird ofSchools
Lowest-AchievingThird ofSchools
Difference statistically significant
Difference not statistically significant
Significance tests adjusted for multiple comparisons
Chapter 130
1.9
* Eighth grade in most countries; see Exhibit 1 for information about the grades tested in each country.( ) Standard errors appear in parentheses. Because results are rounded to the nearest whole number, some differences may appear inconsistent.Countries shown in italics did not satisfy one or more guidelines for sample participation rates, age/grade specifications, or classroom sampling procedures
(see Exhibit A.1). Because coverage falls below 65%, Latvia is annoted LSS for Latvian Speaking Schools only.An "r" indicates response data available for 70-84% of students. An "s" indicates response data available for 50-69% of students.England, France, Japan and Scotland: Question not administered or data not available.
Percent of Students Having at Least One Parent Who Finished UniversitySchools with the Lowest and Highest Achievement – Eighth Grade* – Science
Exhibit 1.9
SOU
RCE:
IEA
Thi
rd In
tern
atio
nal M
athe
mat
ics
and
Scie
nce
Stud
y (T
IMSS
), 19
94-9
5
Norway s 33 (2.4) s 36 (3.1) 3 (3.9)
Iran, Islamic Rep. s 3 (0.9) r 6 (1.3) 3 (1.6)
Hong Kong r 3 (0.6) 12 (2.6) 9 (2.7)
Iceland r 26 (2.1) 36 (5.0) 9 (5.4)
Slovenia 15 (1.7) 26 (2.2) 11 (2.8)
Singapore 2 (0.5) 14 (2.2) 12 (2.2)
Romania r 5 (1.3) r 17 (3.1) 12 (3.4)
Germany s 8 (1.8) r 20 (1.8) 12 (2.6)
Canada r 34 (3.0) 47 (2.9) 13 (4.2)
Netherlands s 9 (1.7) r 22 (3.6) 13 (4.0)
Portugal 3 (0.9) 17 (2.4) 14 (2.6)
Sweden s 28 (2.8) s 42 (2.5) 15 (3.7)
Switzerland r 6 (0.9) 21 (2.2) 15 (2.4)
Czech Republic 16 (1.5) 31 (3.3) 15 (3.6)
Latvia (LSS) s 25 (2.6) r 40 (3.3) 16 (4.2)
Ireland r 12 (1.6) 29 (2.7) 16 (3.1)
Colombia r 10 (1.6) r 26 (3.8) 17 (4.1)
International Avg. 15 (0.3) 32 (0.5) 17 (0.6)
Slovak Republic 14 (1.5) 32 (3.3) 18 (3.7)
Korea 16 (1.4) 34 (3.6) 18 (3.9)
Cyprus s 7 (1.4) s 27 (1.7) 20 (2.2)
Spain r 9 (1.2) 29 (3.4) 20 (3.6)
Austria r 5 (0.9) 26 (2.9) 21 (3.0)
United States 24 (1.5) 46 (2.3) 22 (2.7)
Lithuania s 32 (3.3) s 54 (3.6) 23 (4.9)
New Zealand s 22 (1.9) r 45 (2.7) 23 (3.3)
Russian Federation 23 (2.2) 51 (3.5) 28 (4.1)
Australia r 18 (1.6) 47 (2.6) 29 (3.0)
Belgium (Fl) s 13 (2.8) r 42 (2.8) 29 (4.0)
Hungary r 9 (1.4) r 40 (3.7) 31 (3.9)
Belgium (Fr) s 21 (2.2) r 55 (2.9) 34 (3.7)60-60 0-30 30
Difference
Lowest-AchievingSchools
Highest-AchievingSchools
Country
DifferenceBetween
Highest andLowestSchools
Highest-AchievingThird ofSchools
Lowest-AchievingThird ofSchools
Difference statistically significant
Difference not statistically significant
Significance tests adjusted for multiple comparisons
31Characteristics of High-Achieving and Low-Achieving Schools in Science and Mathematics
1.10
Percent of Students Having at Least One Parent Who Finished UniversitySchools with the Lowest and Highest Achievement – Eighth Grade* – Mathematics
* Eighth grade in most countries; see Exhibit 1 for information about the grades tested in each country.( ) Standard errors appear in parentheses. Because results are rounded to the nearest whole number, some differences may appear inconsistent.Countries shown in italics did not satisfy one or more guidelines for sample participation rates, age/grade specifications, or classroom sampling procedures
(see Exhibit A.1). Because coverage falls below 65%, Latvia is annoted LSS for Latvian Speaking Schools only.An "r" indicates response data available for 70-84% of students.England, France, Japan and Scotland: Question not administered or data not available.
Exhibit 1.10
SOU
RCE:
IEA
Thi
rd In
tern
atio
nal M
athe
mat
ics
and
Scie
nce
Stud
y (T
IMSS
), 19
94-9
5
Iran, Islamic Rep. 3 (0.6) 6 (1.3) 4 (1.5)
Norway 30 (2.1) 37 (3.3) 7 (4.0)
Iceland 29 (2.8) 36 (5.1) 7 (6.0)
Canada 34 (3.6) 41 (2.1) 7 (3.9)
Hong Kong 3 (0.6) 13 (2.5) 10 (2.7)
Romania 5 (1.2) 16 (3.0) 11 (3.1)
Netherlands 11 (2.3) 23 (3.8) 12 (4.4)
Germany 9 (2.1) 22 (1.7) 12 (2.8)
Singapore 2 (0.4) 14 (2.0) 13 (2.0)
Switzerland 6 (1.0) 20 (2.0) 14 (2.2)
Slovenia 13 (1.3) 28 (2.8) 14 (3.0)
Portugal 3 (0.8) 19 (2.4) 15 (2.6)
Ireland 11 (1.5) 28 (2.5) 17 (3.1)
Colombia 10 (2.1) 27 (3.8) 17 (4.3)
Czech Republic 13 (1.3) 31 (3.5) 18 (3.7)
International Avg. 14 (0.3) 32 (0.5) 18 (0.7)
Slovak Republic 14 (1.4) 32 (3.4) 18 (3.8)
Sweden 21 (2.2) 40 (2.6) 20 (3.1)
Spain 9 (1.1) 30 (3.4) 21 (3.7)
Cyprus 5 (1.0) 27 (2.0) 22 (2.2)
Austria 4 (0.8) 27 (2.6) 22 (2.7)
Latvia (LSS) 18 (2.1) 41 (3.0) 23 (3.7)
Korea 13 (1.2) 36 (3.3) 24 (3.5)
Lithuania 29 (3.1) 54 (3.4) 25 (4.7)
New Zealand 20 (1.8) 45 (2.7) 25 (3.5)
United States 23 (1.6) 48 (2.1) 25 (2.7)
Russian Federation 22 (2.0) 48 (4.1) 26 (5.5)
Belgium (Fl) 13 (2.8) 41 (3.3) 28 (4.4)
Australia 18 (1.5) 47 (2.1) 29 (2.5)
Hungary 9 (1.4) 40 (3.7) 31 (4.0)
Belgium (Fr) 17 (1.9) 52 (3.2) 34 (3.8)
60-60 0-30 30
Difference
Lowest-AchievingSchools
Highest-AchievingSchools
Country
DifferenceBetween
Highest andLowestSchools
Highest-AchievingThird ofSchools
Lowest-AchievingThird ofSchools
s
s
r
r
r
r
s
s
r
r
r
s
r
s
r
s
s
s
s
r
r
s
r
s
r
r
r
r
r
s
s
r
s
r
r
r
r
Difference statistically significant
Difference not statistically significant
Significance tests adjusted for multiple comparisons
Chapter 132
1.11
Percent of Students Who Work One or More Hours at HomeSchools with the Lowest and Highest Achievement – Eighth Grade* – Science
* Eighth grade in most countries; see Exhibit 1 for information about the grades tested in each country.( ) Standard errors appear in parentheses. Because results are rounded to the nearest whole number, some differences may appear inconsistent.Countries shown in italics did not satisfy one or more guidelines for sample participation rates, age/grade specifications, or classroom sampling procedures
(see Exhibit A.1). Because coverage falls below 65%, Latvia is annoted LSS for Latvian Speaking Schools only.An "r" indicates response data available for 70-84% of students.
Exhibit 1.11
Singapore 61 (2.0) 34 (2.0) -27 (2.9)
Belgium (Fl) 44 (2.0) 24 (1.9) -20 (2.7)
Switzerland 42 (2.0) 23 (1.4) -19 (2.4)
Netherlands 29 (2.8) 13 (1.8) -16 (3.4)
Belgium (Fr) 33 (2.6) 17 (1.4) -16 (3.0)
Cyprus 43 (1.5) 27 (1.3) -16 (2.0)
United States 49 (1.8) 34 (1.6) -15 (2.4)
Hungary 76 (1.7) 61 (1.9) -15 (2.5)
Austria 29 (2.3) 15 (1.4) -14 (2.7)
Iran, Islamic Rep. 70 (2.0) 56 (1.8) -14 (2.7)
Ireland 34 (2.0) 21 (1.8) -13 (2.7)
Romania 61 (3.3) 50 (3.4) -11 (4.7)
Korea 20 (1.6) 9 (1.2) -11 (2.0)
Germany 33 (1.9) 22 (1.4) -11 (2.4)
Slovak Republic 59 (2.3) 49 (3.0) -11 (3.8)
New Zealand 35 (1.9) 24 (1.7) -10 (2.5)
Czech Republic 54 (4.4) 44 (2.6) -10 (5.1)
Australia 34 (1.6) 25 (1.1) -10 (2.0)
Slovenia 61 (2.6) 52 (2.4) -9 (3.5)
International Avg. 42 (0.4) 33 (0.3) -9 (0.5)
Spain 47 (2.1) 38 (1.9) -8 (2.8)
Hong Kong 25 (1.6) 17 (1.6) -8 (2.2)
England 31 (2.6) 24 (2.0) -7 (3.3)
France 30 (1.6) 23 (1.7) -7 (2.3)
Portugal 33 (2.1) 27 (2.0) -6 (2.9)
Lithuania 46 (2.5) 40 (2.1) -5 (3.2)
Latvia (LSS) 62 (2.4) 57 (2.1) -5 (3.1)
Sweden 32 (1.8) 27 (1.9) -5 (2.6)
Canada 38 (1.7) 36 (1.6) -3 (2.4)
Japan 16 (1.0) 14 (0.9) -2 (1.4)
Norway 40 (2.0) 39 (1.7) -1 (2.6)
Russian Federation 58 (2.0) 58 (2.2) 0 (2.9)
Colombia r 70 (2.4) 72 (2.5) 1 (3.4)
Scotland 21 (2.0) 24 (1.9) 3 (2.8)
Iceland 25 (2.4) 29 (3.1) 3 (3.9) SOU
RCE:
IEA
Thi
rd In
tern
atio
nal M
athe
mat
ics
and
Scie
nce
Stud
y (T
IMSS
), 19
94-9
5
60-60 0-30 30
Difference
Lowest-AchievingSchools
Highest-AchievingSchools
Country
DifferenceBetween
Highest andLowestSchools
Highest-AchievingThird ofSchools
Lowest-AchievingThird ofSchools
Difference statistically significant
Difference not statistically significant
Significance tests adjusted for multiple comparisons
33Characteristics of High-Achieving and Low-Achieving Schools in Science and Mathematics
1.12
Percent of Students Who Work One or More Hours at HomeSchools with the Lowest and Highest Achievement – Eighth Grade* – Mathematics
* Eighth grade in most countries; see Exhibit 1 for information about the grades tested in each country.( ) Standard errors appear in parentheses. Because results are rounded to the nearest whole number, some differences may appear inconsistent.Countries shown in italics did not satisfy one or more guidelines for sample participation rates, age/grade specifications, or classroom sampling procedures
(see Exhibit A.1). Because coverage falls below 65%, Latvia is annoted LSS for Latvian Speaking Schools only.An "r" indicates response data available for 70-84% of students.
Exhibit 1.12
Singapore 62 (2.0) 33 (1.8) -28 (3.1)
Belgium (Fl) 47 (1.9) 24 (1.9) -23 (2.7)
Switzerland 43 (1.9) 23 (1.3) -20 (2.3)
Belgium (Fr) 36 (3.1) 18 (1.4) -18 (3.4)
Netherlands 31 (2.9) 13 (1.9) -18 (3.4)
Romania 61 (3.4) 44 (3.2) -17 (4.9)
Iran, Islamic Rep. 71 (1.9) 54 (1.8) -17 (2.7)
Cyprus 43 (1.8) 26 (1.2) -16 (2.2)
Austria 31 (2.0) 15 (1.5) -16 (2.6)
United States 50 (1.3) 34 (1.7) -16 (2.3)
Hungary 76 (2.1) 61 (1.7) -15 (2.9)
Ireland 34 (1.8) 20 (1.6) -14 (2.6)
Czech Republic 57 (2.9) 44 (2.6) -13 (3.8)
Germany 33 (2.1) 20 (1.2) -13 (2.4)
Australia 35 (1.6) 23 (1.1) -12 (1.8)
Slovak Republic 60 (2.3) 48 (3.1) -12 (3.9)
Latvia (LSS) 67 (2.5) 55 (2.0) -11 (3.3)
New Zealand 36 (2.1) 25 (1.5) -11 (2.6)
Sweden 34 (1.9) 24 (1.3) -11 (2.2)
International Avg. 44 (0.4) 33 (0.3) -11 (0.5)
Slovenia 62 (2.6) 52 (2.5) -10 (3.3)
Lithuania 50 (2.6) 40 (1.8) -10 (3.3)
Korea 19 (1.7) 10 (1.0) -9 (1.9)
Portugal 34 (1.7) 26 (1.9) -8 (2.6)
Hong Kong 25 (1.6) 16 (1.2) -8 (2.1)
Spain 48 (2.0) 40 (1.7) -8 (2.6)
England 31 (2.5) 25 (2.1) -6 (3.3)
France 29 (1.8) 23 (1.6) -5 (2.4)
Iceland 30 (3.1) 27 (3.1) -3 (4.4)
Japan 17 (1.1) 14 (0.8) -3 (1.4)
Canada 38 (2.1) 36 (1.6) -1 (2.6)
Scotland 23 (2.1) 24 (2.1) 0 (3.1)
Colombia r 72 (2.4) 73 (2.1) 0 (3.1)
Russian Federation 60 (2.2) 61 (2.6) 1 (3.0)
Norway 38 (2.1) 41 (1.3) 2 (2.3)SO
URC
E: IE
A T
hird
Inte
rnat
iona
l Mat
hem
atic
s an
d Sc
ienc
e St
udy
(TIM
SS),
1994
-95
Difference
Lowest-AchievingSchools
Highest-AchievingSchools
Country
DifferenceBetween
Highest andLowestSchools
Highest-AchievingThird ofSchools
Lowest-AchievingThird ofSchools
60-60 0-30 30
Difference statistically significant
Difference not statistically significant
Significance tests adjusted for multiple comparisons
Home-School Interface
Whereas indicators of resources in the home such as those presentedin the previous section clearly belong in the home-background cate-gory, there are other, often affective, variables that are jointly influ-enced by both home and school factors. The home-school interfacecategory represents this area of interaction between the home andschool. This category includes:
• maternal press for academic success
• student press for academic success
• student aspirations for university education
• homework frequency
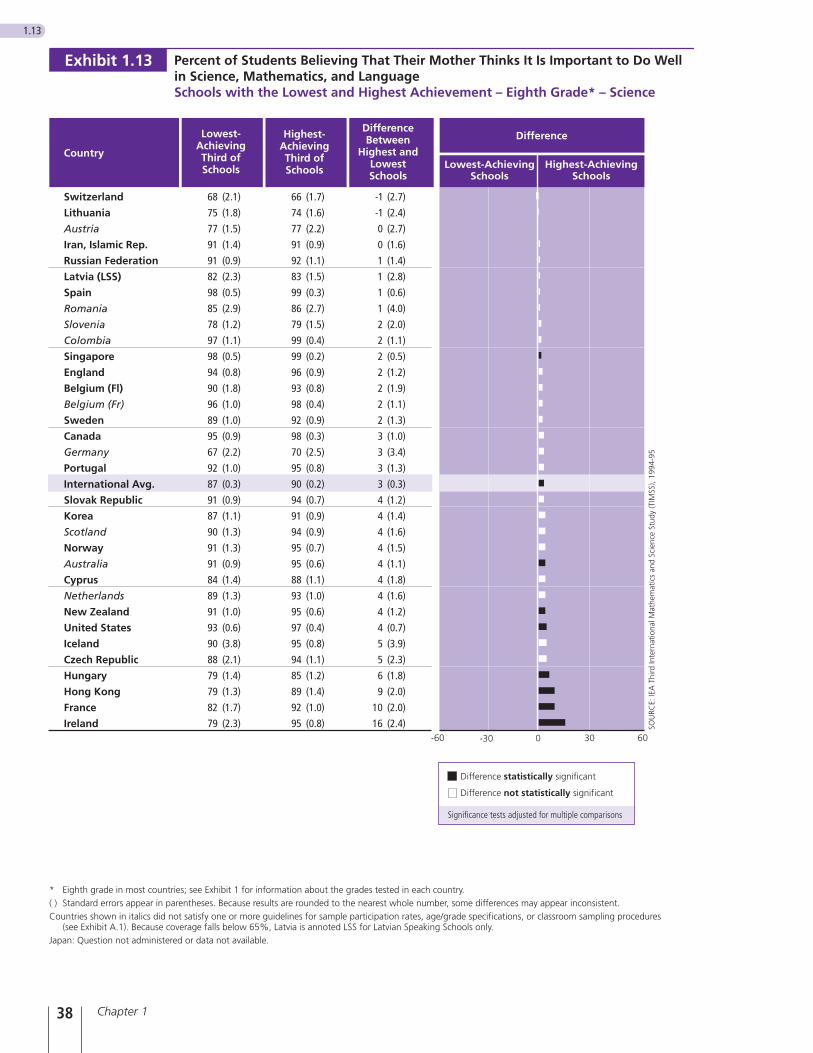
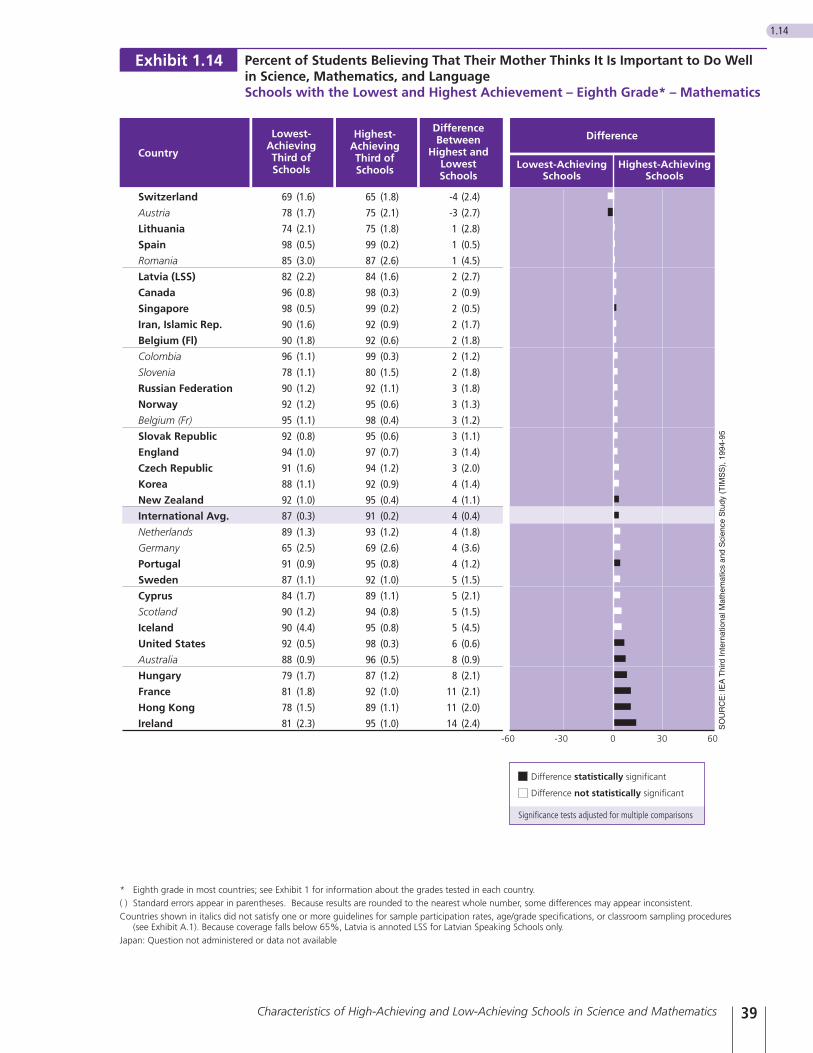
Maternal Press for Academic SuccessParents serve as the primary educators of their children. They guideand mold a student’s attitudes and work practices, and they inculcatevalues about school and learning. To probe the influence of maternalpress for academic achievement, TIMSS asked eighth-grade studentshow important their mother thought it was for them to do well in sci-ence, mathematics, and language. The percentages of students in thehigh- and low-performing schools who reported that their motherthought it was important to do well in all three areas are shown inExhibits 1.13 and 1.14.
Students’ reports of maternal press were consistently high in bothhigh- and low-achieving schools, indicating that, almost universally,students thought their mothers wanted them to do well at school. Inmany countries, more than 90% of students reported this in bothgroups of schools. Because of the generally high perception of mater-nal press among students, there was not much scope for differencesbetween the two school types. The countries with the greatest report-ed difference in both mathematics and science included France,Hong Kong, Hungary, and Ireland. Irish students (16% for scienceand 14% for mathematics) reported the largest differences.
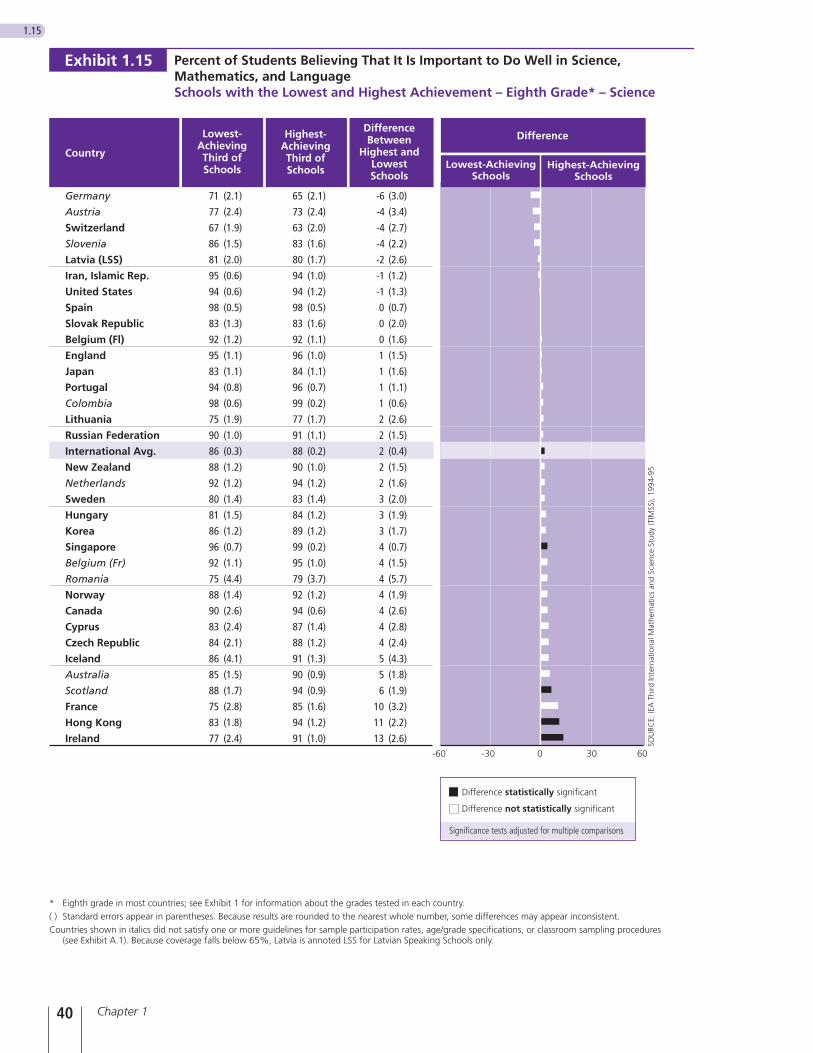
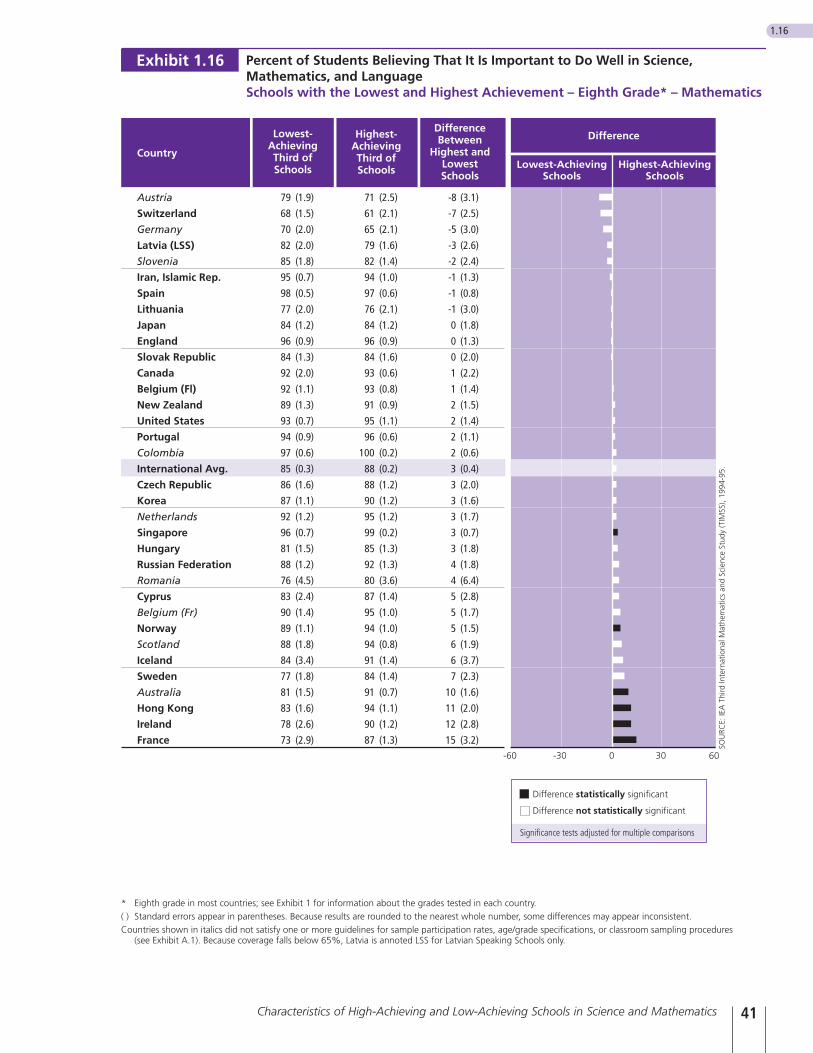
Student Press for Academic Success Although maternal press may well be influential in the initial forma-tion of student attitudes, students’ own predilections and their expe-riences in school play a major role also. As students grow older, theirown internal press for achievement more and more determines theacademic effort they invest and the choices they make. In addition tomaternal academic press, therefore, students were asked how impor-tant they themselves thought it was to do well in science, mathemat-ics, and language. Exhibits 1.15 and 1.16 present the percentages ofstudents in high- and low-achieving schools in each country thatthought it was important to do well in all three areas.
Chapter 134
As with maternal academic press, students’ reported level of academ-ic press were generally high in both groups of schools, and for mostcountries the differences between them were not statistically signifi-cant. Only in Hong Kong, Ireland, and Singapore were the differ-ences between high- and low-achieving schools significant for bothscience and mathematics. Although there was a few countries wherematernal and student academic press were fairly effective in discrimi-nating between high- and low-achieving schools, in general the levelof academic press reported was so high as to leave little scope for dif-ferences between schools. Within the home-school interface category,therefore, differences between the top and bottom one-third ofschools are better explained by students’ aspirations and homeworkpractices than by academic press (see next sections).
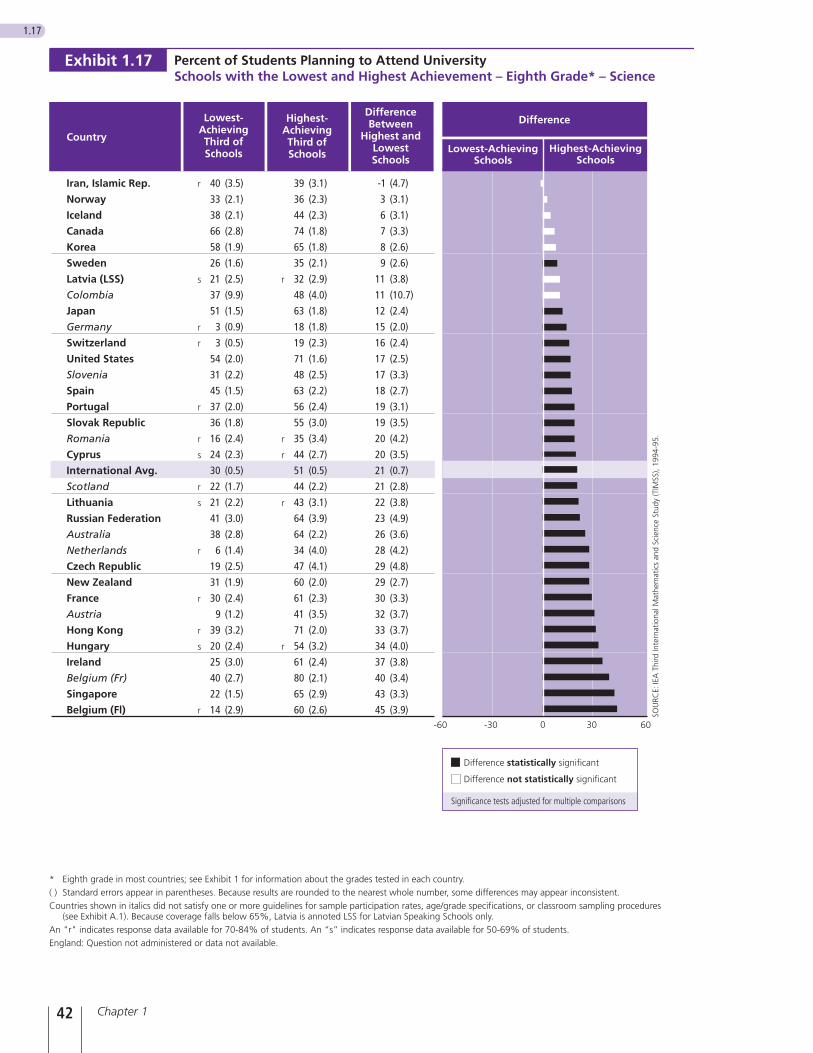
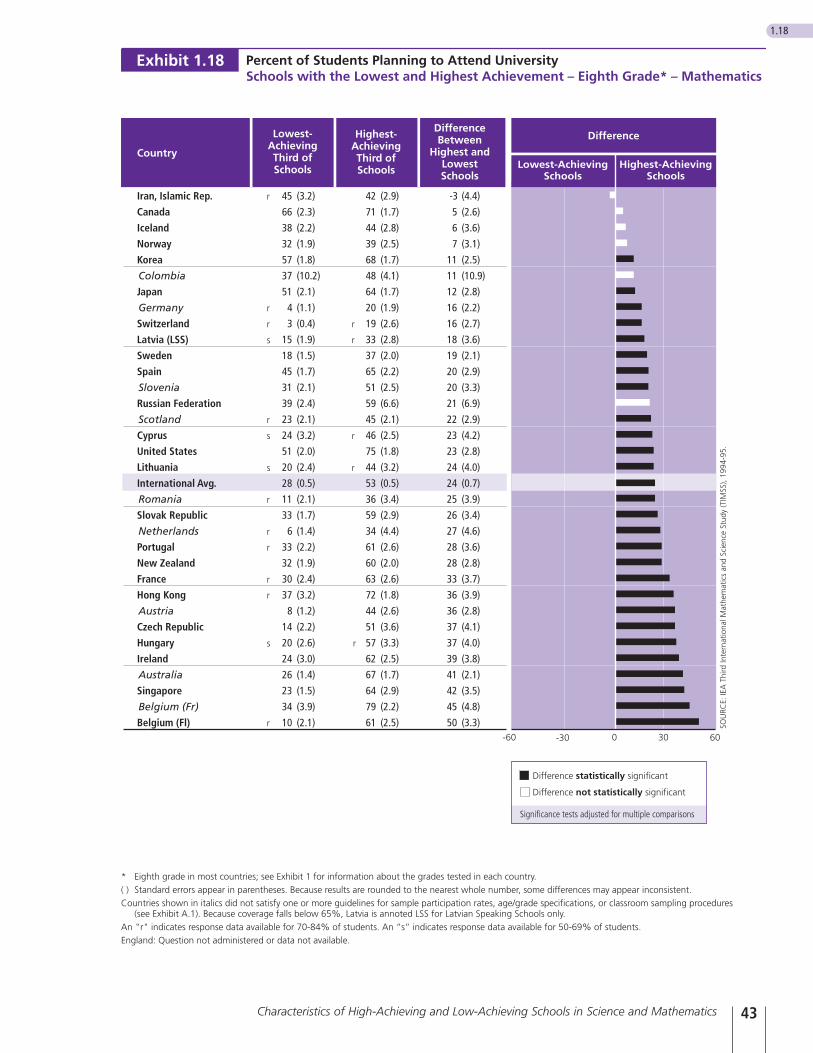
Students’ University AspirationsJust as students’ attitudes to school are likely to be shaped by a com-
bination of their experience in school and in the home, students’aspirations for further education also are likely to be influenced byboth home and school factors. Research shows that effective schoolsare characterized by high academic expectations for students,4 andthe data in Exhibits 1.17 and 1.18 seem to support this finding.These exhibits show that in most countries, the majority of eighth-grade students in the low-achieving schools do not intend to go touniversity, while many more in the high-achieving schools have uni-versity plans. On average across countries, more than half of the stu-dents in high-achieving schools reported that they are planning toattend university, compared with less than one third in low-achievingschools. This difference is even more pronounced in countries suchas Belgium (Flemish and French), Ireland, and Singapore, where thepercentage in the high-achieving schools was more than twice that inthe low-achieving schools. Countries with little or no differencebetween the two groups of schools in terms of university aspirationsincluded Canada, Colombia, Iceland, Iran, and Norway.
It is likely that students’ aspirations for university education are moredirectly influenced by tracking and streaming than any other vari-ables presented in this report, and yet it is noticeable that in severalof the countries where tracking is well established, including Austria,Germany, the Netherlands, and Switzerland, the percentage of stu-dents in the high-achieving schools planning to attend university isrelatively low. This may reflect the existence of a more differentiatedtertiary education system in these countries, and in particular a well-developed system of technical and vocational institutions that attractsa proportion of the more able students.
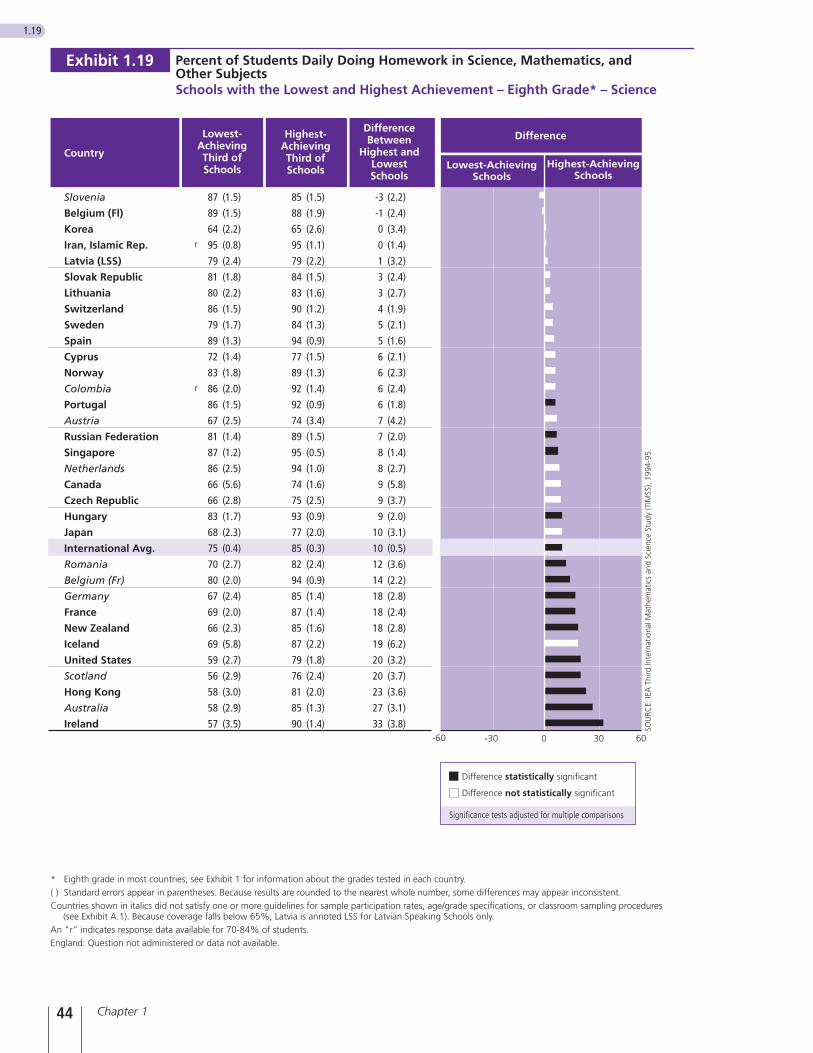
Students’ Homework PracticesThe role of homework at the eighth grade varies considerably fromcountry to country. In more than half of the TIMSS countries, veryhigh percentages of students in both high- and low-achieving schoolsreported doing daily homework in science, mathematics, and other
35Characteristics of High-Achieving and Low-Achieving Schools in Science and Mathematics
4 Purkey, S.C., and Smith, M.S. (1982). “Too Soon to Cheer? Synthesis of Research on Effective Schools,”Educational Leadership, Dec., 64-69.
subjects, and there was little or no difference between the two schooltypes. In Singapore, for example, where average student perform-ance on the TIMSS eighth-grade mathematics and science tests wasamong the highest, 87% of students in the low-achieving schoolsreported completing homework daily in all three areas. This percent-age was greater than that reported by students in high-achievingschools in many of the other TIMSS countries. By way of contrast, thepercentages of students in Japan, also a country with high averagestudent achievement, that reported doing homework in the threesubjects was lower than in most countries. Consequently, while doinghomework in a range of subjects may be important, the type, efficien-cy and amount of homework may also be important. Japanese par-ents frequently provide a specific study area, even when space is limit-ed in the family home, so that the child may complete homeworkwith minimal distractions.5
In about one third of the countries, the percentage of students thatreported doing daily homework was significantly less in the low-achieving schools (see Exhibits 1.19 and 1.20). In these countries,homework is more characteristic of the high-achieving schools.Countries with the greatest differences in both mathematics and sci-ence included Australia, Ireland, Hong Kong, and United States. Inthese countries, the difference was at least 20 percentage points ineach subject.
Chapter 136
5 Stevenson, H. W., and Stigler, J. W. (1992). The Learning Gap: Why Our Schools Are Failing and What We CanLearn from Japanese and Chinese Education, New York: Summit Books.

37Characteristics of High-Achieving and Low-Achieving Schools in Science and Mathematics
Exhibit 1.13 - 1.20 Overleaf
Chapter 138
1.13
Percent of Students Believing That Their Mother Thinks It Is Important to Do Wellin Science, Mathematics, and LanguageSchools with the Lowest and Highest Achievement – Eighth Grade* – Science
* Eighth grade in most countries; see Exhibit 1 for information about the grades tested in each country.( ) Standard errors appear in parentheses. Because results are rounded to the nearest whole number, some differences may appear inconsistent.Countries shown in italics did not satisfy one or more guidelines for sample participation rates, age/grade specifications, or classroom sampling procedures
(see Exhibit A.1). Because coverage falls below 65%, Latvia is annoted LSS for Latvian Speaking Schools only.Japan: Question not administered or data not available.
Exhibit 1.13
Difference
Lowest-AchievingSchools
Highest-AchievingSchools
Country
DifferenceBetween
Highest andLowestSchools
Highest-AchievingThird ofSchools
Lowest-AchievingThird ofSchools
Switzerland 68 (2.1) 66 (1.7) -1 (2.7)
Lithuania 75 (1.8) 74 (1.6) -1 (2.4)
Austria 77 (1.5) 77 (2.2) 0 (2.7)
Iran, Islamic Rep. 91 (1.4) 91 (0.9) 0 (1.6)
Russian Federation 91 (0.9) 92 (1.1) 1 (1.4)
Latvia (LSS) 82 (2.3) 83 (1.5) 1 (2.8)
Spain 98 (0.5) 99 (0.3) 1 (0.6)
Romania 85 (2.9) 86 (2.7) 1 (4.0)
Slovenia 78 (1.2) 79 (1.5) 2 (2.0)
Colombia 97 (1.1) 99 (0.4) 2 (1.1)
Singapore 98 (0.5) 99 (0.2) 2 (0.5)
England 94 (0.8) 96 (0.9) 2 (1.2)
Belgium (Fl) 90 (1.8) 93 (0.8) 2 (1.9)
Belgium (Fr) 96 (1.0) 98 (0.4) 2 (1.1)
Sweden 89 (1.0) 92 (0.9) 2 (1.3)
Canada 95 (0.9) 98 (0.3) 3 (1.0)
Germany 67 (2.2) 70 (2.5) 3 (3.4)
Portugal 92 (1.0) 95 (0.8) 3 (1.3)
International Avg. 87 (0.3) 90 (0.2) 3 (0.3)
Slovak Republic 91 (0.9) 94 (0.7) 4 (1.2)
Korea 87 (1.1) 91 (0.9) 4 (1.4)
Scotland 90 (1.3) 94 (0.9) 4 (1.6)
Norway 91 (1.3) 95 (0.7) 4 (1.5)
Australia 91 (0.9) 95 (0.6) 4 (1.1)
Cyprus 84 (1.4) 88 (1.1) 4 (1.8)
Netherlands 89 (1.3) 93 (1.0) 4 (1.6)
New Zealand 91 (1.0) 95 (0.6) 4 (1.2)
United States 93 (0.6) 97 (0.4) 4 (0.7)
Iceland 90 (3.8) 95 (0.8) 5 (3.9)
Czech Republic 88 (2.1) 94 (1.1) 5 (2.3)
Hungary 79 (1.4) 85 (1.2) 6 (1.8)
Hong Kong 79 (1.3) 89 (1.4) 9 (2.0)
France 82 (1.7) 92 (1.0) 10 (2.0)
Ireland 79 (2.3) 95 (0.8) 16 (2.4) SOU
RCE:
IEA
Thi
rd In
tern
atio
nal M
athe
mat
ics
and
Scie
nce
Stud
y (T
IMSS
), 19
94-9
5
60-60 0-30 30
Difference statistically significant
Difference not statistically significant
Significance tests adjusted for multiple comparisons
39Characteristics of High-Achieving and Low-Achieving Schools in Science and Mathematics
1.14
Percent of Students Believing That Their Mother Thinks It Is Important to Do Wellin Science, Mathematics, and LanguageSchools with the Lowest and Highest Achievement – Eighth Grade* – Mathematics
* Eighth grade in most countries; see Exhibit 1 for information about the grades tested in each country.( ) Standard errors appear in parentheses. Because results are rounded to the nearest whole number, some differences may appear inconsistent.Countries shown in italics did not satisfy one or more guidelines for sample participation rates, age/grade specifications, or classroom sampling procedures
(see Exhibit A.1). Because coverage falls below 65%, Latvia is annoted LSS for Latvian Speaking Schools only.Japan: Question not administered or data not available
Exhibit 1.14
Switzerland 69 (1.6) 65 (1.8) -4 (2.4)
Austria 78 (1.7) 75 (2.1) -3 (2.7)
Lithuania 74 (2.1) 75 (1.8) 1 (2.8)
Spain 98 (0.5) 99 (0.2) 1 (0.5)
Romania 85 (3.0) 87 (2.6) 1 (4.5)
Latvia (LSS) 82 (2.2) 84 (1.6) 2 (2.7)
Canada 96 (0.8) 98 (0.3) 2 (0.9)
Singapore 98 (0.5) 99 (0.2) 2 (0.5)
Iran, Islamic Rep. 90 (1.6) 92 (0.9) 2 (1.7)
Belgium (Fl) 90 (1.8) 92 (0.6) 2 (1.8)
Colombia 96 (1.1) 99 (0.3) 2 (1.2)
Slovenia 78 (1.1) 80 (1.5) 2 (1.8)
Russian Federation 90 (1.2) 92 (1.1) 3 (1.8)
Norway 92 (1.2) 95 (0.6) 3 (1.3)
Belgium (Fr) 95 (1.1) 98 (0.4) 3 (1.2)
Slovak Republic 92 (0.8) 95 (0.6) 3 (1.1)
England 94 (1.0) 97 (0.7) 3 (1.4)
Czech Republic 91 (1.6) 94 (1.2) 3 (2.0)
Korea 88 (1.1) 92 (0.9) 4 (1.4)
New Zealand 92 (1.0) 95 (0.4) 4 (1.1)
International Avg. 87 (0.3) 91 (0.2) 4 (0.4)
Netherlands 89 (1.3) 93 (1.2) 4 (1.8)
Germany 65 (2.5) 69 (2.6) 4 (3.6)
Portugal 91 (0.9) 95 (0.8) 4 (1.2)
Sweden 87 (1.1) 92 (1.0) 5 (1.5)
Cyprus 84 (1.7) 89 (1.1) 5 (2.1)
Scotland 90 (1.2) 94 (0.8) 5 (1.5)
Iceland 90 (4.4) 95 (0.8) 5 (4.5)
United States 92 (0.5) 98 (0.3) 6 (0.6)
Australia 88 (0.9) 96 (0.5) 8 (0.9)
Hungary 79 (1.7) 87 (1.2) 8 (2.1)
France 81 (1.8) 92 (1.0) 11 (2.1)
Hong Kong 78 (1.5) 89 (1.1) 11 (2.0)
Ireland 81 (2.3) 95 (1.0) 14 (2.4) SO
UR
CE
: IE
A T
hird
Inte
rnat
iona
l Mat
hem
atic
s an
d S
cien
ce S
tudy
(T
IMS
S),
199
4-95
60-60 0-30 30
Difference
Lowest-AchievingSchools
Highest-AchievingSchools
Country
DifferenceBetween
Highest andLowestSchools
Highest-AchievingThird ofSchools
Lowest-AchievingThird ofSchools
Difference statistically significant
Difference not statistically significant
Significance tests adjusted for multiple comparisons
Chapter 140
1.15
Percent of Students Believing That It Is Important to Do Well in Science,Mathematics, and LanguageSchools with the Lowest and Highest Achievement – Eighth Grade* – Science
* Eighth grade in most countries; see Exhibit 1 for information about the grades tested in each country.( ) Standard errors appear in parentheses. Because results are rounded to the nearest whole number, some differences may appear inconsistent.Countries shown in italics did not satisfy one or more guidelines for sample participation rates, age/grade specifications, or classroom sampling procedures
(see Exhibit A.1). Because coverage falls below 65%, Latvia is annoted LSS for Latvian Speaking Schools only.
Exhibit 1.15
Germany 71 (2.1) 65 (2.1) -6 (3.0)
Austria 77 (2.4) 73 (2.4) -4 (3.4)
Switzerland 67 (1.9) 63 (2.0) -4 (2.7)
Slovenia 86 (1.5) 83 (1.6) -4 (2.2)
Latvia (LSS) 81 (2.0) 80 (1.7) -2 (2.6)
Iran, Islamic Rep. 95 (0.6) 94 (1.0) -1 (1.2)
United States 94 (0.6) 94 (1.2) -1 (1.3)
Spain 98 (0.5) 98 (0.5) 0 (0.7)
Slovak Republic 83 (1.3) 83 (1.6) 0 (2.0)
Belgium (Fl) 92 (1.2) 92 (1.1) 0 (1.6)
England 95 (1.1) 96 (1.0) 1 (1.5)
Japan 83 (1.1) 84 (1.1) 1 (1.6)
Portugal 94 (0.8) 96 (0.7) 1 (1.1)
Colombia 98 (0.6) 99 (0.2) 1 (0.6)
Lithuania 75 (1.9) 77 (1.7) 2 (2.6)
Russian Federation 90 (1.0) 91 (1.1) 2 (1.5)
International Avg. 86 (0.3) 88 (0.2) 2 (0.4)
New Zealand 88 (1.2) 90 (1.0) 2 (1.5)
Netherlands 92 (1.2) 94 (1.2) 2 (1.6)
Sweden 80 (1.4) 83 (1.4) 3 (2.0)
Hungary 81 (1.5) 84 (1.2) 3 (1.9)
Korea 86 (1.2) 89 (1.2) 3 (1.7)
Singapore 96 (0.7) 99 (0.2) 4 (0.7)
Belgium (Fr) 92 (1.1) 95 (1.0) 4 (1.5)
Romania 75 (4.4) 79 (3.7) 4 (5.7)
Norway 88 (1.4) 92 (1.2) 4 (1.9)
Canada 90 (2.6) 94 (0.6) 4 (2.6)
Cyprus 83 (2.4) 87 (1.4) 4 (2.8)
Czech Republic 84 (2.1) 88 (1.2) 4 (2.4)
Iceland 86 (4.1) 91 (1.3) 5 (4.3)
Australia 85 (1.5) 90 (0.9) 5 (1.8)
Scotland 88 (1.7) 94 (0.9) 6 (1.9)
France 75 (2.8) 85 (1.6) 10 (3.2)
Hong Kong 83 (1.8) 94 (1.2) 11 (2.2)
Ireland 77 (2.4) 91 (1.0) 13 (2.6)
SOU
RCE:
IEA
Thi
rd In
tern
atio
nal M
athe
mat
ics
and
Scie
nce
Stud
y (T
IMSS
), 19
94-9
5
60-60 0-30 30
Difference
Lowest-AchievingSchools
Highest-AchievingSchools
Country
DifferenceBetween
Highest andLowestSchools
Highest-AchievingThird ofSchools
Lowest-AchievingThird ofSchools
Difference statistically significant
Difference not statistically significant
Significance tests adjusted for multiple comparisons
41Characteristics of High-Achieving and Low-Achieving Schools in Science and Mathematics
1.16
* Eighth grade in most countries; see Exhibit 1 for information about the grades tested in each country.( ) Standard errors appear in parentheses. Because results are rounded to the nearest whole number, some differences may appear inconsistent.Countries shown in italics did not satisfy one or more guidelines for sample participation rates, age/grade specifications, or classroom sampling procedures
(see Exhibit A.1). Because coverage falls below 65%, Latvia is annoted LSS for Latvian Speaking Schools only.
Percent of Students Believing That It Is Important to Do Well in Science,Mathematics, and LanguageSchools with the Lowest and Highest Achievement – Eighth Grade* – Mathematics
Exhibit 1.16
SOU
RCE:
IEA
Thi
rd In
tern
atio
nal M
athe
mat
ics
and
Scie
nce
Stud
y (T
IMSS
), 19
94-9
5.
Austria 79 (1.9) 71 (2.5) -8 (3.1)
Switzerland 68 (1.5) 61 (2.1) -7 (2.5)
Germany 70 (2.0) 65 (2.1) -5 (3.0)
Latvia (LSS) 82 (2.0) 79 (1.6) -3 (2.6)
Slovenia 85 (1.8) 82 (1.4) -2 (2.4)
Iran, Islamic Rep. 95 (0.7) 94 (1.0) -1 (1.3)
Spain 98 (0.5) 97 (0.6) -1 (0.8)
Lithuania 77 (2.0) 76 (2.1) -1 (3.0)
Japan 84 (1.2) 84 (1.2) 0 (1.8)
England 96 (0.9) 96 (0.9) 0 (1.3)
Slovak Republic 84 (1.3) 84 (1.6) 0 (2.0)
Canada 92 (2.0) 93 (0.6) 1 (2.2)
Belgium (Fl) 92 (1.1) 93 (0.8) 1 (1.4)
New Zealand 89 (1.3) 91 (0.9) 2 (1.5)
United States 93 (0.7) 95 (1.1) 2 (1.4)
Portugal 94 (0.9) 96 (0.6) 2 (1.1)
Colombia 97 (0.6) 100 (0.2) 2 (0.6)
International Avg. 85 (0.3) 88 (0.2) 3 (0.4)
Czech Republic 86 (1.6) 88 (1.2) 3 (2.0)
Korea 87 (1.1) 90 (1.2) 3 (1.6)
Netherlands 92 (1.2) 95 (1.2) 3 (1.7)
Singapore 96 (0.7) 99 (0.2) 3 (0.7)
Hungary 81 (1.5) 85 (1.3) 3 (1.8)
Russian Federation 88 (1.2) 92 (1.3) 4 (1.8)
Romania 76 (4.5) 80 (3.6) 4 (6.4)
Cyprus 83 (2.4) 87 (1.4) 5 (2.8)
Belgium (Fr) 90 (1.4) 95 (1.0) 5 (1.7)
Norway 89 (1.1) 94 (1.0) 5 (1.5)
Scotland 88 (1.8) 94 (0.8) 6 (1.9)
Iceland 84 (3.4) 91 (1.4) 6 (3.7)
Sweden 77 (1.8) 84 (1.4) 7 (2.3)
Australia 81 (1.5) 91 (0.7) 10 (1.6)
Hong Kong 83 (1.6) 94 (1.1) 11 (2.0)
Ireland 78 (2.6) 90 (1.2) 12 (2.8)
France 73 (2.9) 87 (1.3) 15 (3.2)60-60 0-30 30
Country
DifferenceBetween
Highest andLowestSchools
Highest-AchievingThird ofSchools
Lowest-AchievingThird ofSchools
Difference
Lowest-AchievingSchools
Highest-AchievingSchools
Difference statistically significant
Difference not statistically significant
Significance tests adjusted for multiple comparisons
Chapter 142
1.17
* Eighth grade in most countries; see Exhibit 1 for information about the grades tested in each country.( ) Standard errors appear in parentheses. Because results are rounded to the nearest whole number, some differences may appear inconsistent.Countries shown in italics did not satisfy one or more guidelines for sample participation rates, age/grade specifications, or classroom sampling procedures
(see Exhibit A.1). Because coverage falls below 65%, Latvia is annoted LSS for Latvian Speaking Schools only.An "r" indicates response data available for 70-84% of students. An “s” indicates response data available for 50-69% of students.England: Question not administered or data not available.
Percent of Students Planning to Attend UniversitySchools with the Lowest and Highest Achievement – Eighth Grade* – Science
Exhibit 1.17
SOU
RCE:
IEA
Thi
rd In
tern
atio
nal M
athe
mat
ics
and
Scie
nce
Stud
y (T
IMSS
), 19
94-9
5.
Iran, Islamic Rep. 40 (3.5) 39 (3.1) -1 (4.7)
Norway 33 (2.1) 36 (2.3) 3 (3.1)
Iceland 38 (2.1) 44 (2.3) 6 (3.1)
Canada 66 (2.8) 74 (1.8) 7 (3.3)
Korea 58 (1.9) 65 (1.8) 8 (2.6)
Sweden 26 (1.6) 35 (2.1) 9 (2.6)
Latvia (LSS) 21 (2.5) 32 (2.9) 11 (3.8)
Colombia 37 (9.9) 48 (4.0) 11 (10.7)
Japan 51 (1.5) 63 (1.8) 12 (2.4)
Germany 3 (0.9) 18 (1.8) 15 (2.0)
Switzerland 3 (0.5) 19 (2.3) 16 (2.4)
United States 54 (2.0) 71 (1.6) 17 (2.5)
Slovenia 31 (2.2) 48 (2.5) 17 (3.3)
Spain 45 (1.5) 63 (2.2) 18 (2.7)
Portugal 37 (2.0) 56 (2.4) 19 (3.1)
Slovak Republic 36 (1.8) 55 (3.0) 19 (3.5)
Romania 16 (2.4) 35 (3.4) 20 (4.2)
Cyprus 24 (2.3) 44 (2.7) 20 (3.5)
International Avg. 30 (0.5) 51 (0.5) 21 (0.7)
Scotland 22 (1.7) 44 (2.2) 21 (2.8)
Lithuania 21 (2.2) 43 (3.1) 22 (3.8)
Russian Federation 41 (3.0) 64 (3.9) 23 (4.9)
Australia 38 (2.8) 64 (2.2) 26 (3.6)
Netherlands 6 (1.4) 34 (4.0) 28 (4.2)
Czech Republic 19 (2.5) 47 (4.1) 29 (4.8)
New Zealand 31 (1.9) 60 (2.0) 29 (2.7)
France 30 (2.4) 61 (2.3) 30 (3.3)
Austria 9 (1.2) 41 (3.5) 32 (3.7)
Hong Kong 39 (3.2) 71 (2.0) 33 (3.7)
Hungary 20 (2.4) 54 (3.2) 34 (4.0)
Ireland 25 (3.0) 61 (2.4) 37 (3.8)
Belgium (Fr) 40 (2.7) 80 (2.1) 40 (3.4)
Singapore 22 (1.5) 65 (2.9) 43 (3.3)
Belgium (Fl) 14 (2.9) 60 (2.6) 45 (3.9)60-60 0-30 30
Country
DifferenceBetween
Highest andLowestSchools
Highest-AchievingThird ofSchools
Lowest-AchievingThird ofSchools
Difference
Lowest-AchievingSchools
Highest-AchievingSchools
r
s
r
r
r
r
s
r
s
r
r
r
s
r
r
r
r
r
r
Difference statistically significant
Difference not statistically significant
Significance tests adjusted for multiple comparisons
43Characteristics of High-Achieving and Low-Achieving Schools in Science and Mathematics
1.18
Percent of Students Planning to Attend UniversitySchools with the Lowest and Highest Achievement – Eighth Grade* – Mathematics
Exhibit 1.18
Iran, Islamic Rep. 45 (3.2) 42 (2.9) -3 (4.4)
Canada 66 (2.3) 71 (1.7) 5 (2.6)
Iceland 38 (2.2) 44 (2.8) 6 (3.6)
Norway 32 (1.9) 39 (2.5) 7 (3.1)
Korea 57 (1.8) 68 (1.7) 11 (2.5)
Colombia 37 (10.2) 48 (4.1) 11 (10.9)
Japan 51 (2.1) 64 (1.7) 12 (2.8)
Germany 4 (1.1) 20 (1.9) 16 (2.2)
Switzerland 3 (0.4) 19 (2.6) 16 (2.7)
Latvia (LSS) 15 (1.9) 33 (2.8) 18 (3.6)
Sweden 18 (1.5) 37 (2.0) 19 (2.1)
Spain 45 (1.7) 65 (2.2) 20 (2.9)
Slovenia 31 (2.1) 51 (2.5) 20 (3.3)
Russian Federation 39 (2.4) 59 (6.6) 21 (6.9)
Scotland 23 (2.1) 45 (2.1) 22 (2.9)
Cyprus 24 (3.2) 46 (2.5) 23 (4.2)
United States 51 (2.0) 75 (1.8) 23 (2.8)
Lithuania 20 (2.4) 44 (3.2) 24 (4.0)
International Avg. 28 (0.5) 53 (0.5) 24 (0.7)
Romania 11 (2.1) 36 (3.4) 25 (3.9)
Slovak Republic 33 (1.7) 59 (2.9) 26 (3.4)
Netherlands 6 (1.4) 34 (4.4) 27 (4.6)
Portugal 33 (2.2) 61 (2.6) 28 (3.6)
New Zealand 32 (1.9) 60 (2.0) 28 (2.8)
France 30 (2.4) 63 (2.6) 33 (3.7)
Hong Kong 37 (3.2) 72 (1.8) 36 (3.9)
Austria 8 (1.2) 44 (2.6) 36 (2.8)
Czech Republic 14 (2.2) 51 (3.6) 37 (4.1)
Hungary 20 (2.6) 57 (3.3) 37 (4.0)
Ireland 24 (3.0) 62 (2.5) 39 (3.8)
Australia 26 (1.4) 67 (1.7) 41 (2.1)
Singapore 23 (1.5) 64 (2.9) 42 (3.5)
Belgium (Fr) 34 (3.9) 79 (2.2) 45 (4.8)
Belgium (Fl) 10 (2.1) 61 (2.5) 50 (3.3)60-60 0-30 30
Country
DifferenceBetween
Highest andLowestSchools
Highest-AchievingThird ofSchools
Lowest-AchievingThird ofSchools
Difference
Lowest-AchievingSchools
Highest-AchievingSchools
SOU
RCE:
IEA
Thi
rd In
tern
atio
nal M
athe
mat
ics
and
Scie
nce
Stud
y (T
IMSS
), 19
94-9
5.
* Eighth grade in most countries; see Exhibit 1 for information about the grades tested in each country.( ) Standard errors appear in parentheses. Because results are rounded to the nearest whole number, some differences may appear inconsistent.Countries shown in italics did not satisfy one or more guidelines for sample participation rates, age/grade specifications, or classroom sampling procedures
(see Exhibit A.1). Because coverage falls below 65%, Latvia is annoted LSS for Latvian Speaking Schools only.An "r" indicates response data available for 70-84% of students. An “s” indicates response data available for 50-69% of students.England: Question not administered or data not available.
r
r
r
s
r
s
s
r
r
r
r
r
s
r
r
r
r
r
r
Difference statistically significant
Difference not statistically significant
Significance tests adjusted for multiple comparisons
Chapter 144
1.19
* Eighth grade in most countries; see Exhibit 1 for information about the grades tested in each country.( ) Standard errors appear in parentheses. Because results are rounded to the nearest whole number, some differences may appear inconsistent.Countries shown in italics did not satisfy one or more guidelines for sample participation rates, age/grade specifications, or classroom sampling procedures
(see Exhibit A.1). Because coverage falls below 65%, Latvia is annoted LSS for Latvian Speaking Schools only.An "r" indicates response data available for 70-84% of students.England: Question not administered or data not available.
Percent of Students Daily Doing Homework in Science, Mathematics, andOther SubjectsSchools with the Lowest and Highest Achievement – Eighth Grade* – Science
Schools
Exhibit 1.19
Difference
Lowest-AchievingSchools
Highest-AchievingSchools
Country
DifferenceBetween
Highest andLowestSchools
Highest-AchievingThird ofSchools
Lowest-AchievingThird ofSchools
Slovenia 87 (1.5) 85 (1.5) -3 (2.2)
Belgium (Fl) 89 (1.5) 88 (1.9) -1 (2.4)
Korea 64 (2.2) 65 (2.6) 0 (3.4)
Iran, Islamic Rep. 95 (0.8) 95 (1.1) 0 (1.4)
Latvia (LSS) 79 (2.4) 79 (2.2) 1 (3.2)
Slovak Republic 81 (1.8) 84 (1.5) 3 (2.4)
Lithuania 80 (2.2) 83 (1.6) 3 (2.7)
Switzerland 86 (1.5) 90 (1.2) 4 (1.9)
Sweden 79 (1.7) 84 (1.3) 5 (2.1)
Spain 89 (1.3) 94 (0.9) 5 (1.6)
Cyprus 72 (1.4) 77 (1.5) 6 (2.1)
Norway 83 (1.8) 89 (1.3) 6 (2.3)
Colombia 86 (2.0) 92 (1.4) 6 (2.4)
Portugal 86 (1.5) 92 (0.9) 6 (1.8)
Austria 67 (2.5) 74 (3.4) 7 (4.2)
Russian Federation 81 (1.4) 89 (1.5) 7 (2.0)
Singapore 87 (1.2) 95 (0.5) 8 (1.4)
Netherlands 86 (2.5) 94 (1.0) 8 (2.7)
Canada 66 (5.6) 74 (1.6) 9 (5.8)
Czech Republic 66 (2.8) 75 (2.5) 9 (3.7)
Hungary 83 (1.7) 93 (0.9) 9 (2.0)
Japan 68 (2.3) 77 (2.0) 10 (3.1)
International Avg. 75 (0.4) 85 (0.3) 10 (0.5)
Romania 70 (2.7) 82 (2.4) 12 (3.6)
Belgium (Fr) 80 (2.0) 94 (0.9) 14 (2.2)
Germany 67 (2.4) 85 (1.4) 18 (2.8)
France 69 (2.0) 87 (1.4) 18 (2.4)
New Zealand 66 (2.3) 85 (1.6) 18 (2.8)
Iceland 69 (5.8) 87 (2.2) 19 (6.2)
United States 59 (2.7) 79 (1.8) 20 (3.2)
Scotland 56 (2.9) 76 (2.4) 20 (3.7)
Hong Kong 58 (3.0) 81 (2.0) 23 (3.6)
Australia 58 (2.9) 85 (1.3) 27 (3.1)
Ireland 57 (3.5) 90 (1.4) 33 (3.8) SOU
RCE:
IEA
Thi
rd In
tern
atio
nal M
athe
mat
ics
and
Scie
nce
Stud
y (T
IMSS
), 19
94-9
5.
60-60 0-30 30
r
r
Difference statistically significant
Difference not statistically significant
Significance tests adjusted for multiple comparisons
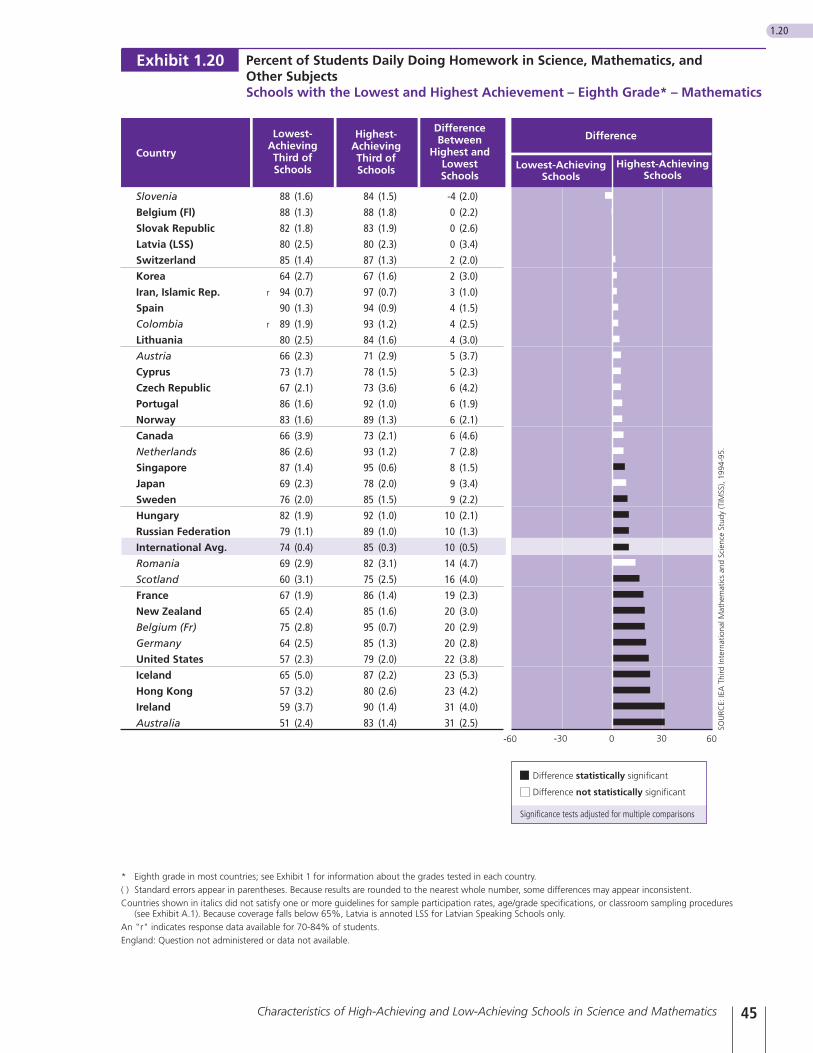
45Characteristics of High-Achieving and Low-Achieving Schools in Science and Mathematics
1.20
Percent of Students Daily Doing Homework in Science, Mathematics, andOther SubjectsSchools with the Lowest and Highest Achievement – Eighth Grade* – Mathematics
Exhibit 1.20
SOU
RCE:
IEA
Thi
rd In
tern
atio
nal M
athe
mat
ics
and
Scie
nce
Stud
y (T
IMSS
), 19
94-9
5.
Slovenia 88 (1.6) 84 (1.5) -4 (2.0)
Belgium (Fl) 88 (1.3) 88 (1.8) 0 (2.2)
Slovak Republic 82 (1.8) 83 (1.9) 0 (2.6)
Latvia (LSS) 80 (2.5) 80 (2.3) 0 (3.4)
Switzerland 85 (1.4) 87 (1.3) 2 (2.0)
Korea 64 (2.7) 67 (1.6) 2 (3.0)
Iran, Islamic Rep. 94 (0.7) 97 (0.7) 3 (1.0)
Spain 90 (1.3) 94 (0.9) 4 (1.5)
Colombia 89 (1.9) 93 (1.2) 4 (2.5)
Lithuania 80 (2.5) 84 (1.6) 4 (3.0)
Austria 66 (2.3) 71 (2.9) 5 (3.7)
Cyprus 73 (1.7) 78 (1.5) 5 (2.3)
Czech Republic 67 (2.1) 73 (3.6) 6 (4.2)
Portugal 86 (1.6) 92 (1.0) 6 (1.9)
Norway 83 (1.6) 89 (1.3) 6 (2.1)
Canada 66 (3.9) 73 (2.1) 6 (4.6)
Netherlands 86 (2.6) 93 (1.2) 7 (2.8)
Singapore 87 (1.4) 95 (0.6) 8 (1.5)
Japan 69 (2.3) 78 (2.0) 9 (3.4)
Sweden 76 (2.0) 85 (1.5) 9 (2.2)
Hungary 82 (1.9) 92 (1.0) 10 (2.1)
Russian Federation 79 (1.1) 89 (1.0) 10 (1.3)
International Avg. 74 (0.4) 85 (0.3) 10 (0.5)
Romania 69 (2.9) 82 (3.1) 14 (4.7)
Scotland 60 (3.1) 75 (2.5) 16 (4.0)
France 67 (1.9) 86 (1.4) 19 (2.3)
New Zealand 65 (2.4) 85 (1.6) 20 (3.0)
Belgium (Fr) 75 (2.8) 95 (0.7) 20 (2.9)
Germany 64 (2.5) 85 (1.3) 20 (2.8)
United States 57 (2.3) 79 (2.0) 22 (3.8)
Iceland 65 (5.0) 87 (2.2) 23 (5.3)
Hong Kong 57 (3.2) 80 (2.6) 23 (4.2)
Ireland 59 (3.7) 90 (1.4) 31 (4.0)
Australia 51 (2.4) 83 (1.4) 31 (2.5)60-60 0-30 30
Difference
Lowest-AchievingSchools
Highest-AchievingSchools
Country
DifferenceBetween
Highest andLowestSchools
Highest-AchievingThird ofSchools
Lowest-AchievingThird ofSchools
* Eighth grade in most countries; see Exhibit 1 for information about the grades tested in each country.( ) Standard errors appear in parentheses. Because results are rounded to the nearest whole number, some differences may appear inconsistent.Countries shown in italics did not satisfy one or more guidelines for sample participation rates, age/grade specifications, or classroom sampling procedures
(see Exhibit A.1). Because coverage falls below 65%, Latvia is annoted LSS for Latvian Speaking Schools only.An "r" indicates response data available for 70-84% of students.England: Question not administered or data not available.
r
r
Difference statistically significant
Difference not statistically significant
Significance tests adjusted for multiple comparisons
School Location and Size
The school location and size category includes factors that operate atthe school level. These are:
• school location
• size of school
• size of class
School Location At one time, it was accepted that schools located in urban areas,because of their proximity to educational and cultural resources such aslibraries and museums, had advantages over those situated in moreremote locations. However, with the onset of urban decay in someindustrialized countries and the migration of middle-class families tothe suburbs, the reputation of urban schools suffered, and often theschools with the best reputation were found in suburban areas. TheTIMSS countries vary a great deal in level of urbanization and in thedistribution of schools between urban and rural areas, and so the rela-tionship between student achievement and the urbanicity of the schoolcan be expected to vary also.
Principals were asked to indicate the type of community in which theschool was located: an isolated area, a village or rural area, the outskirtsof a town or city, or close to the center of a town or city. For the pur-pose of this analysis, the third and fourth categories were combined,and schools in these categories were considered to be in urban areas.Exhibits 1.21 and 1.22 show the percentages of students in high- andlow-achieving schools that were located in such an urban area.Although in several countries greater percentages of students in low-achieving schools were located in urban areas, which supports the ideathat urban schools are often disadvantaged, only for Scotland in sciencewas the difference statistically significant.6 In contrast, in seven coun-tries, Austria, Cyprus, Hungary, Iran, Korea (mathematics only), andthe Russian Federation, significantly greater percentages of students inthe high-achieving schools were in schools located in urban areas. Ofthese countries, both Iran and the Russian Federation have large tractsof remote areas, and the difference between urban and rural can bevery marked.
School SizeSince size is a school characteristic that is directly related to the cost ofeducational provision, and one that may readily be manipulated by poli-cy makers, it has received a great deal of attention over the years. Onone hand, schools must be large enough so that the necessary invest-ment in libraries, laboratories, gymnasia, and the like is economicallysound, but on the other hand, schools should not be so large that they
Chapter 146
6 School-related variables such as location and size are based on much smaller sample sizes than student-related variables, and so differences in percentages that would be significant in student samples often arenot for school variables.
are organizationally cumbersome, or that students feel isolated. Toprovide an opportunity to study how school size and student achieve-ment are related in TIMSS, school principals were asked to reportthe number of boys and girls attending their school. Exhibits 1.23and 1.24 present the percentages of students in the high- and low-achieving schools that were in large schools. Because school sizevaries greatly from country to country (in TIMSS, average school sizefor eighth-grade students ranged from about 180 students in Norwayto over 1200 in Singapore), for this report the size of a school wasdefined in relation to the average school size in each country. Largeschools were those with student enrollment greater than the averagefor the country.
It is noteworthy that in Exhibits 1.23 and 1.24, there seems to be ageneral tendency for greater percentages of students in high-achiev-ing schools to be in the larger schools in each country, although thedifference is statistically significant in less than one third of theschools. Countries where school size differentiates most betweenhigh- and low-achieving schools include Austria, Germany, Iran,Korea (mathematics only), and Singapore. These schools span almostthe full range of school sizes, from 291 in Iran to 1226 in Singapore.
Class SizeFew school characteristics have received as much attention from theresearch community as class size. Research syntheses based on rigor-ous experimental work7 confirm the commonsense view that studentsshould do better in small classes, although the results from large-scale surveys often paint a different picture. For example, the TIMSSdata for Korea show that high average achievement in mathematicsand science is possible in countries where large classes are the norm.TIMSS also shows that in many countries, average achievement ishigher among students in larger classes. This finding may owe less toany possible superiority of large classes for instruction and more tothe practice among schools of using smaller classes for weaker stu-dents or for remedial classes, but whatever the reason, the relation-ship seems to be widespread.
Exhibits 1.25 and 1.26 present the percentages of students in thehigh- and low-achieving schools that are in large classes. Again,because of the wide range of average class sizes across countries(from 15 in Iceland and Lithuania to 46 in Korea), large classes weredefined as those above the average in each country. On average, 79percent of students in high-achieving schools were in larger scienceclasses, compared with 61 percent in low-achieving schools, a differ-ence of 17 percentage points. In mathematics classes, the percent-ages in high- and low-achieving schools were 80 and 59, respectively,a difference of 21 percentage points. Significantly greater percent-ages of students in the high-achieving schools were in larger thanaverage mathematics classes in nine countries, and in larger science
47Characteristics of High-Achieving and Low-Achieving Schools in Science and Mathematics
7 Glass, G.V. and Smith, M.L. (1978). Meta-analysis of Research on the Relationship of Class-size and Achievement,Far West Laboratory for Educational Research and Development, San Francisco, CA.
classes in four countries. In Belgium (French), Belgium (Flemish),the Netherlands, and Hong Kong, at least 80% of the students in thehigh-achieving schools were in larger than average classes, while 50%or less of the students in the low-achieving schools were in large class-es. In Lithuania and Korea, all students in the high-achieving schoolswere in mathematics classes that were larger than average.
Chapter 148
49Characteristics of High-Achieving and Low-Achieving Schools in Science and Mathematics
Exhibit 1.21 - 1.26 Overleaf
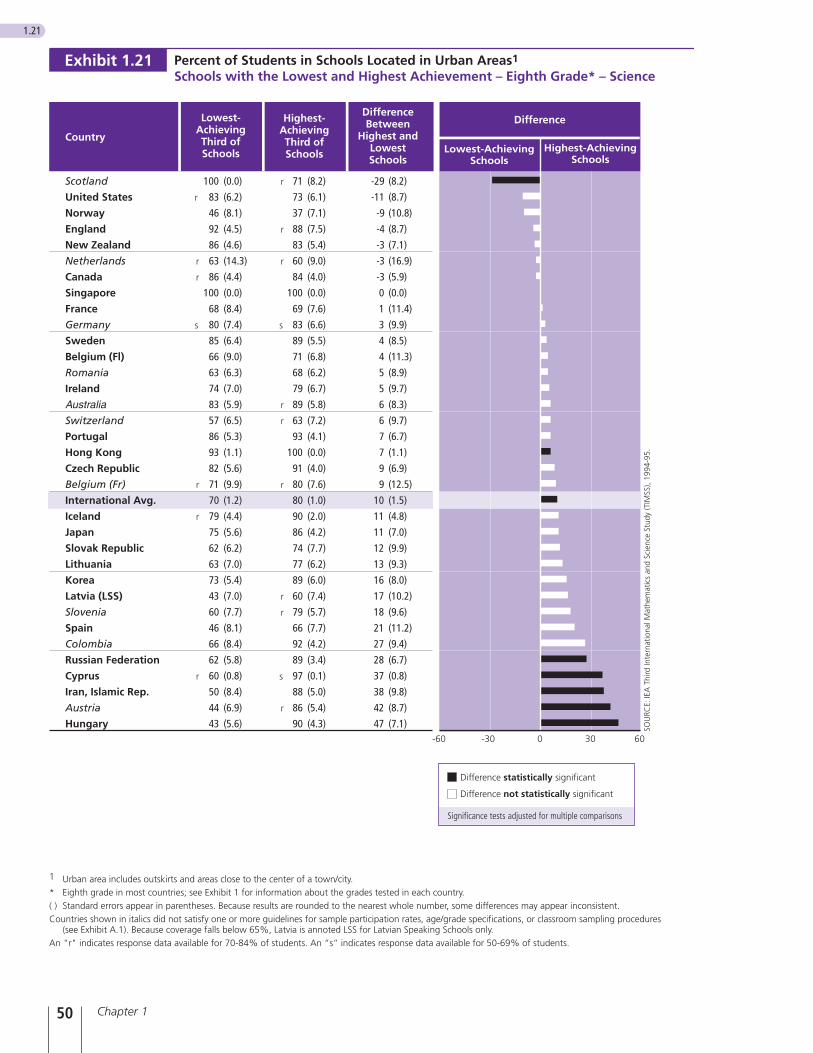
Chapter 150
1.21
1 Urban area includes outskirts and areas close to the center of a town/city.* Eighth grade in most countries; see Exhibit 1 for information about the grades tested in each country.( ) Standard errors appear in parentheses. Because results are rounded to the nearest whole number, some differences may appear inconsistent.Countries shown in italics did not satisfy one or more guidelines for sample participation rates, age/grade specifications, or classroom sampling procedures
(see Exhibit A.1). Because coverage falls below 65%, Latvia is annoted LSS for Latvian Speaking Schools only.An "r" indicates response data available for 70-84% of students. An “s” indicates response data available for 50-69% of students.
Percent of Students in Schools Located in Urban Areas1
Schools with the Lowest and Highest Achievement – Eighth Grade* – ScienceExhibit 1.21
SOU
RCE:
IEA
Thi
rd In
tern
atio
nal M
athe
mat
ics
and
Scie
nce
Stud
y (T
IMSS
), 19
94-9
5.
Difference
Lowest-AchievingSchools
Highest-AchievingSchools
Country
DifferenceBetween
Highest andLowestSchools
Highest-AchievingThird ofSchools
Lowest-AchievingThird ofSchools
Scotland 100 (0.0) 71 (8.2) -29 (8.2)
United States 83 (6.2) 73 (6.1) -11 (8.7)
Norway 46 (8.1) 37 (7.1) -9 (10.8)
England 92 (4.5) 88 (7.5) -4 (8.7)
New Zealand 86 (4.6) 83 (5.4) -3 (7.1)
Netherlands 63 (14.3) 60 (9.0) -3 (16.9)
Canada 86 (4.4) 84 (4.0) -3 (5.9)
Singapore 100 (0.0) 100 (0.0) 0 (0.0)
France 68 (8.4) 69 (7.6) 1 (11.4)
Germany 80 (7.4) 83 (6.6) 3 (9.9)
Sweden 85 (6.4) 89 (5.5) 4 (8.5)
Belgium (Fl) 66 (9.0) 71 (6.8) 4 (11.3)
Romania 63 (6.3) 68 (6.2) 5 (8.9)
Ireland 74 (7.0) 79 (6.7) 5 (9.7)
Australia 83 (5.9) 89 (5.8) 6 (8.3)
Switzerland 57 (6.5) 63 (7.2) 6 (9.7)
Portugal 86 (5.3) 93 (4.1) 7 (6.7)
Hong Kong 93 (1.1) 100 (0.0) 7 (1.1)
Czech Republic 82 (5.6) 91 (4.0) 9 (6.9)
Belgium (Fr) 71 (9.9) 80 (7.6) 9 (12.5)
International Avg. 70 (1.2) 80 (1.0) 10 (1.5)
Iceland 79 (4.4) 90 (2.0) 11 (4.8)
Japan 75 (5.6) 86 (4.2) 11 (7.0)
Slovak Republic 62 (6.2) 74 (7.7) 12 (9.9)
Lithuania 63 (7.0) 77 (6.2) 13 (9.3)
Korea 73 (5.4) 89 (6.0) 16 (8.0)
Latvia (LSS) 43 (7.0) 60 (7.4) 17 (10.2)
Slovenia 60 (7.7) 79 (5.7) 18 (9.6)
Spain 46 (8.1) 66 (7.7) 21 (11.2)
Colombia 66 (8.4) 92 (4.2) 27 (9.4)
Russian Federation 62 (5.8) 89 (3.4) 28 (6.7)
Cyprus 60 (0.8) 97 (0.1) 37 (0.8)
Iran, Islamic Rep. 50 (8.4) 88 (5.0) 38 (9.8)
Austria 44 (6.9) 86 (5.4) 42 (8.7)
Hungary 43 (5.6) 90 (4.3) 47 (7.1)60-60 0-30 30
r
r
r
s
r
r
r
r
r
r
s
r
r
r
r
r
s
r
Difference statistically significant
Difference not statistically significant
Significance tests adjusted for multiple comparisons
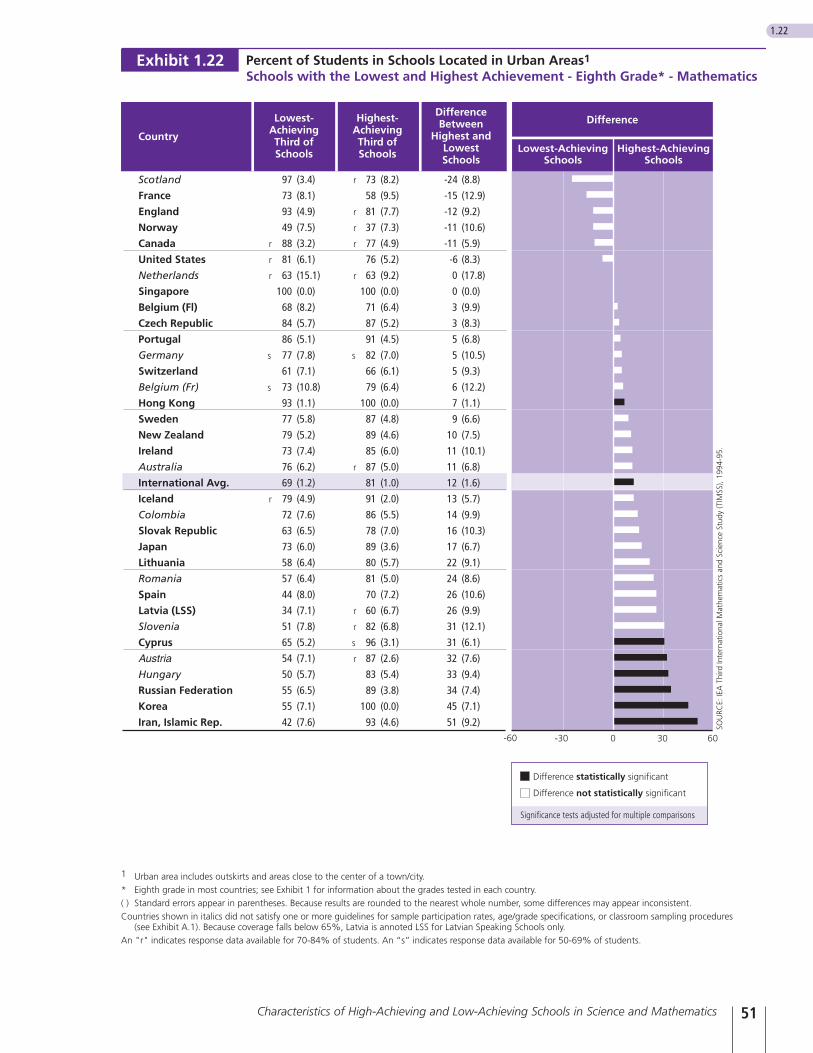
51Characteristics of High-Achieving and Low-Achieving Schools in Science and Mathematics
1.22
Percent of Students in Schools Located in Urban Areas1
Schools with the Lowest and Highest Achievement - Eighth Grade* - MathematicsExhibit 1.22
Scotland 97 (3.4) 73 (8.2) -24 (8.8)
France 73 (8.1) 58 (9.5) -15 (12.9)
England 93 (4.9) 81 (7.7) -12 (9.2)
Norway 49 (7.5) 37 (7.3) -11 (10.6)
Canada 88 (3.2) 77 (4.9) -11 (5.9)
United States 81 (6.1) 76 (5.2) -6 (8.3)
Netherlands 63 (15.1) 63 (9.2) 0 (17.8)
Singapore 100 (0.0) 100 (0.0) 0 (0.0)
Belgium (Fl) 68 (8.2) 71 (6.4) 3 (9.9)
Czech Republic 84 (5.7) 87 (5.2) 3 (8.3)
Portugal 86 (5.1) 91 (4.5) 5 (6.8)
Germany 77 (7.8) 82 (7.0) 5 (10.5)
Switzerland 61 (7.1) 66 (6.1) 5 (9.3)
Belgium (Fr) 73 (10.8) 79 (6.4) 6 (12.2)
Hong Kong 93 (1.1) 100 (0.0) 7 (1.1)
Sweden 77 (5.8) 87 (4.8) 9 (6.6)
New Zealand 79 (5.2) 89 (4.6) 10 (7.5)
Ireland 73 (7.4) 85 (6.0) 11 (10.1)
Australia 76 (6.2) 87 (5.0) 11 (6.8)
International Avg. 69 (1.2) 81 (1.0) 12 (1.6)
Iceland 79 (4.9) 91 (2.0) 13 (5.7)
Colombia 72 (7.6) 86 (5.5) 14 (9.9)
Slovak Republic 63 (6.5) 78 (7.0) 16 (10.3)
Japan 73 (6.0) 89 (3.6) 17 (6.7)
Lithuania 58 (6.4) 80 (5.7) 22 (9.1)
Romania 57 (6.4) 81 (5.0) 24 (8.6)
Spain 44 (8.0) 70 (7.2) 26 (10.6)
Latvia (LSS) 34 (7.1) 60 (6.7) 26 (9.9)
Slovenia 51 (7.8) 82 (6.8) 31 (12.1)
Cyprus 65 (5.2) 96 (3.1) 31 (6.1)
Austria 54 (7.1) 87 (2.6) 32 (7.6)
Hungary 50 (5.7) 83 (5.4) 33 (9.4)
Russian Federation 55 (6.5) 89 (3.8) 34 (7.4)
Korea 55 (7.1) 100 (0.0) 45 (7.1)
Iran, Islamic Rep. 42 (7.6) 93 (4.6) 51 (9.2)
Difference
Country
SOU
RCE:
IEA
Thi
rd In
tern
atio
nal M
athe
mat
ics
and
Scie
nce
Stud
y (T
IMSS
), 19
94-9
5.
60-60 0-30 30
Lowest-AchievingSchools
Highest-AchievingSchools
DifferenceBetween
Highest andLowestSchools
Highest-AchievingThird ofSchools
Lowest-AchievingThird ofSchools
1 Urban area includes outskirts and areas close to the center of a town/city.* Eighth grade in most countries; see Exhibit 1 for information about the grades tested in each country.( ) Standard errors appear in parentheses. Because results are rounded to the nearest whole number, some differences may appear inconsistent.Countries shown in italics did not satisfy one or more guidelines for sample participation rates, age/grade specifications, or classroom sampling procedures
(see Exhibit A.1). Because coverage falls below 65%, Latvia is annoted LSS for Latvian Speaking Schools only.An "r" indicates response data available for 70-84% of students. An “s” indicates response data available for 50-69% of students.
r
r
r
s
s
r
r
r
r
r
r
s
r
r
r
s
r
Difference statistically significant
Difference not statistically significant
Significance tests adjusted for multiple comparisons
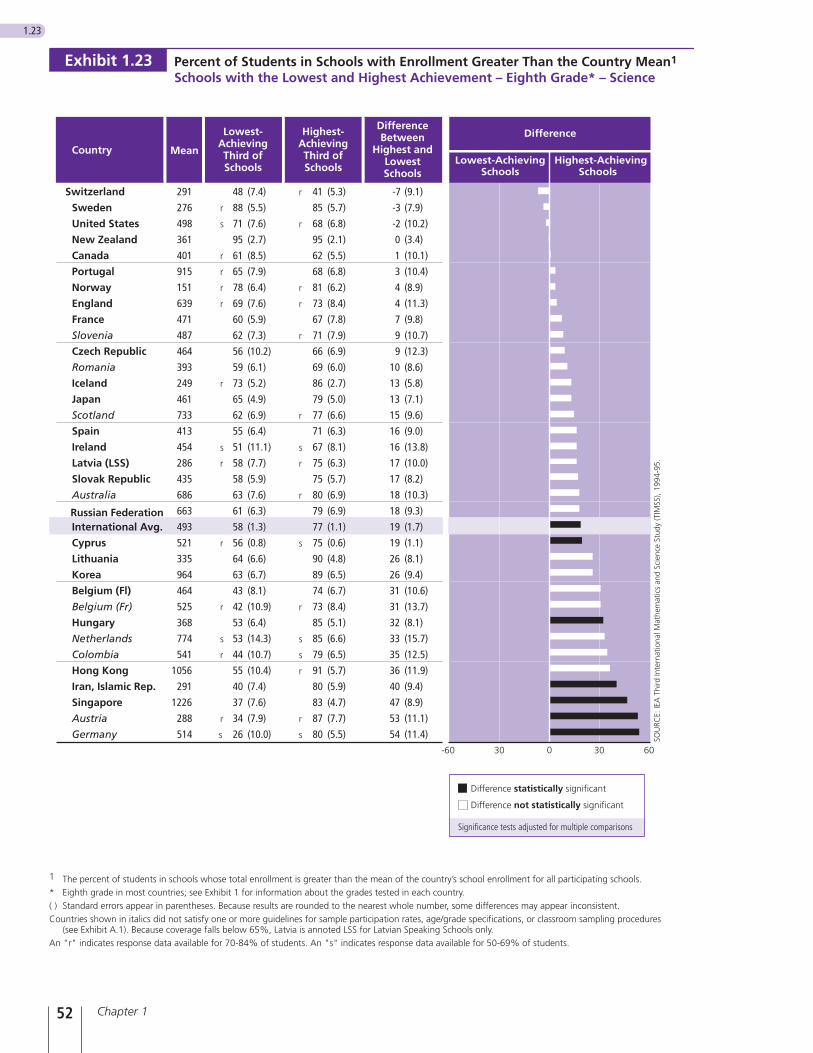
Chapter 152
1.23
1 The percent of students in schools whose total enrollment is greater than the mean of the country’s school enrollment for all participating schools.* Eighth grade in most countries; see Exhibit 1 for information about the grades tested in each country.( ) Standard errors appear in parentheses. Because results are rounded to the nearest whole number, some differences may appear inconsistent.Countries shown in italics did not satisfy one or more guidelines for sample participation rates, age/grade specifications, or classroom sampling procedures
(see Exhibit A.1). Because coverage falls below 65%, Latvia is annoted LSS for Latvian Speaking Schools only.An "r" indicates response data available for 70-84% of students. An "s" indicates response data available for 50-69% of students.
Percent of Students in Schools with Enrollment Greater Than the Country Mean1
Schools with the Lowest and Highest Achievement – Eighth Grade* – Science
Switzerland 291 48 (7.4) 41 (5.3) -7 (9.1)
Sweden 276 88 (5.5) 85 (5.7) -3 (7.9)
United States 498 71 (7.6) 68 (6.8) -2 (10.2)
New Zealand 361 95 (2.7) 95 (2.1) 0 (3.4)
Canada 401 61 (8.5) 62 (5.5) 1 (10.1)
Portugal 915 65 (7.9) 68 (6.8) 3 (10.4)
Norway 151 78 (6.4) 81 (6.2) 4 (8.9)
England 639 69 (7.6) 73 (8.4) 4 (11.3)
France 471 60 (5.9) 67 (7.8) 7 (9.8)
Slovenia 487 62 (7.3) 71 (7.9) 9 (10.7)
Czech Republic 464 56 (10.2) 66 (6.9) 9 (12.3)
Romania 393 59 (6.1) 69 (6.0) 10 (8.6)
Iceland 249 73 (5.2) 86 (2.7) 13 (5.8)
Japan 461 65 (4.9) 79 (5.0) 13 (7.1)
Scotland 733 62 (6.9) 77 (6.6) 15 (9.6)
Spain 413 55 (6.4) 71 (6.3) 16 (9.0)
Ireland 454 51 (11.1) 67 (8.1) 16 (13.8)
Latvia (LSS) 286 58 (7.7) 75 (6.3) 17 (10.0)
Slovak Republic 435 58 (5.9) 75 (5.7) 17 (8.2)
Australia 686 63 (7.6) 80 (6.9) 18 (10.3)
Russian Federation 663 61 (6.3) 79 (6.9) 18 (9.3)
International Avg. 493 58 (1.3) 77 (1.1) 19 (1.7)
Cyprus 521 56 (0.8) 75 (0.6) 19 (1.1)
Lithuania 335 64 (6.6) 90 (4.8) 26 (8.1)
Korea 964 63 (6.7) 89 (6.5) 26 (9.4)
Belgium (Fl) 464 43 (8.1) 74 (6.7) 31 (10.6)
Belgium (Fr) 525 42 (10.9) 73 (8.4) 31 (13.7)
Hungary 368 53 (6.4) 85 (5.1) 32 (8.1)
Netherlands 774 53 (14.3) 85 (6.6) 33 (15.7)
Colombia 541 44 (10.7) 79 (6.5) 35 (12.5)
Hong Kong 1056 55 (10.4) 91 (5.7) 36 (11.9)
Iran, Islamic Rep. 291 40 (7.4) 80 (5.9) 40 (9.4)
Singapore 1226 37 (7.6) 83 (4.7) 47 (8.9)
Austria 288 34 (7.9) 87 (7.7) 53 (11.1)
Germany 514 26 (10.0) 80 (5.5) 54 (11.4)
Mean
SOU
RCE:
IEA
Thi
rd In
tern
atio
nal M
athe
mat
ics
and
Scie
nce
Stud
y (T
IMSS
), 19
94-9
5.
60-60 030 30
Exhibit 1.23
CountryLowest-Achieving
SchoolsHighest-Achieving
Schools
DifferenceLowest-AchievingThird ofSchools
Highest-AchievingThird ofSchools
DifferenceBetween
Highest andLowestSchools
r
s
r
r
r
r
r
s
r
r
r
s
r
r
s
r
r
r
r
r
r
s
r
r
s
r
s
s
r
r
s
Difference statistically significant
Difference not statistically significant
Significance tests adjusted for multiple comparisons
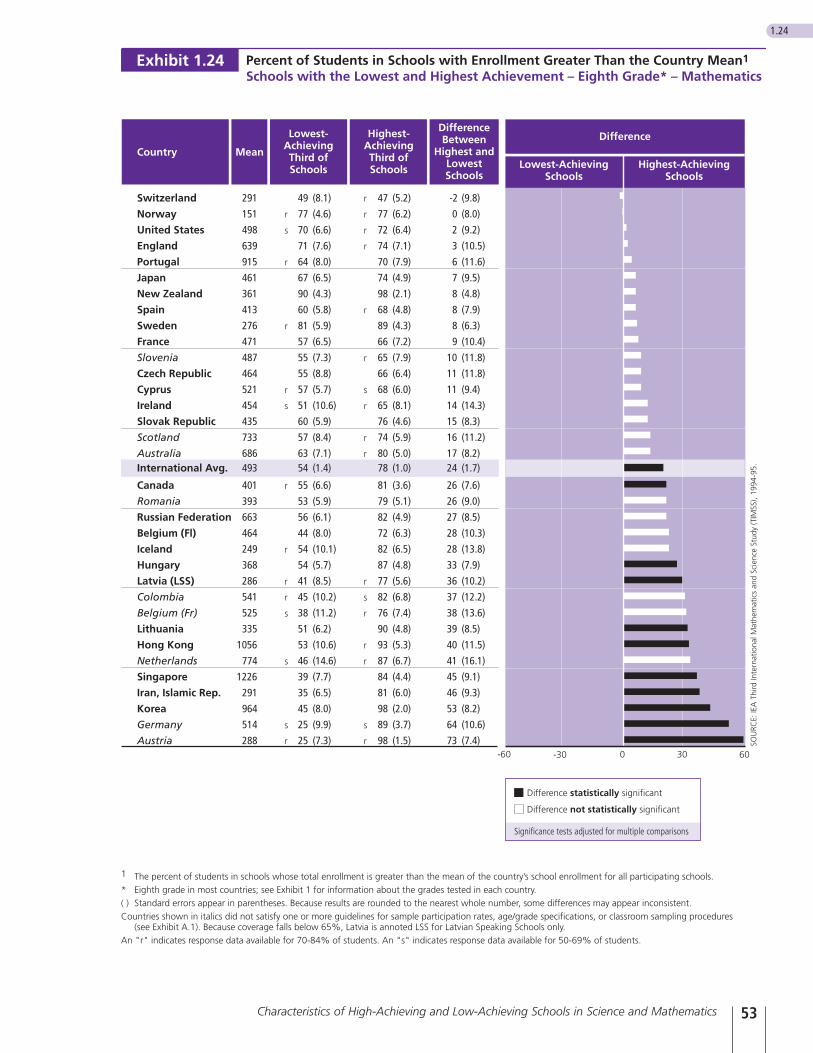
53Characteristics of High-Achieving and Low-Achieving Schools in Science and Mathematics
1.24
Country Mean
Lowest-AchievingThird ofSchools
Highest-AchievingThird ofSchools
DifferenceBetween
Highest andLowestSchools
Lowest-AchievingSchools
Highest-AchievingSchools
Difference
Percent of Students in Schools with Enrollment Greater Than the Country Mean1
Schools with the Lowest and Highest Achievement – Eighth Grade* – Mathematics
Switzerland 291 49 (8.1) 47 (5.2) -2 (9.8)
Norway 151 77 (4.6) 77 (6.2) 0 (8.0)
United States 498 70 (6.6) 72 (6.4) 2 (9.2)
England 639 71 (7.6) 74 (7.1) 3 (10.5)
Portugal 915 64 (8.0) 70 (7.9) 6 (11.6)
Japan 461 67 (6.5) 74 (4.9) 7 (9.5)
New Zealand 361 90 (4.3) 98 (2.1) 8 (4.8)
Spain 413 60 (5.8) 68 (4.8) 8 (7.9)
Sweden 276 81 (5.9) 89 (4.3) 8 (6.3)
France 471 57 (6.5) 66 (7.2) 9 (10.4)
Slovenia 487 55 (7.3) 65 (7.9) 10 (11.8)
Czech Republic 464 55 (8.8) 66 (6.4) 11 (11.8)
Cyprus 521 57 (5.7) 68 (6.0) 11 (9.4)
Ireland 454 51 (10.6) 65 (8.1) 14 (14.3)
Slovak Republic 435 60 (5.9) 76 (4.6) 15 (8.3)
Scotland 733 57 (8.4) 74 (5.9) 16 (11.2)
Australia 686 63 (7.1) 80 (5.0) 17 (8.2)International Avg. 493 54 (1.4) 78 (1.0) 24 (1.7)
Canada 401 55 (6.6) 81 (3.6) 26 (7.6)
Romania 393 53 (5.9) 79 (5.1) 26 (9.0)
Russian Federation 663 56 (6.1) 82 (4.9) 27 (8.5)
Belgium (Fl) 464 44 (8.0) 72 (6.3) 28 (10.3)
Iceland 249 54 (10.1) 82 (6.5) 28 (13.8)
Hungary 368 54 (5.7) 87 (4.8) 33 (7.9)
Latvia (LSS) 286 41 (8.5) 77 (5.6) 36 (10.2)
Colombia 541 45 (10.2) 82 (6.8) 37 (12.2)
Belgium (Fr) 525 38 (11.2) 76 (7.4) 38 (13.6)
Lithuania 335 51 (6.2) 90 (4.8) 39 (8.5)
Hong Kong 1056 53 (10.6) 93 (5.3) 40 (11.5)
Netherlands 774 46 (14.6) 87 (6.7) 41 (16.1)
Singapore 1226 39 (7.7) 84 (4.4) 45 (9.1)
Iran, Islamic Rep. 291 35 (6.5) 81 (6.0) 46 (9.3)
Korea 964 45 (8.0) 98 (2.0) 53 (8.2)
Germany 514 25 (9.9) 89 (3.7) 64 (10.6)
Austria 288 25 (7.3) 98 (1.5) 73 (7.4) SOU
RCE:
IEA
Thi
rd In
tern
atio
nal M
athe
mat
ics
and
Scie
nce
Stud
y (T
IMSS
), 19
94-9
5.60-60 0 30-30
Exhibit 1.24
1 The percent of students in schools whose total enrollment is greater than the mean of the country’s school enrollment for all participating schools.* Eighth grade in most countries; see Exhibit 1 for information about the grades tested in each country.( ) Standard errors appear in parentheses. Because results are rounded to the nearest whole number, some differences may appear inconsistent.Countries shown in italics did not satisfy one or more guidelines for sample participation rates, age/grade specifications, or classroom sampling procedures
(see Exhibit A.1). Because coverage falls below 65%, Latvia is annoted LSS for Latvian Speaking Schools only.An "r" indicates response data available for 70-84% of students. An "s" indicates response data available for 50-69% of students.
r
s
r
r
r
s
r
r
r
r
s
s
s
r
r
r
r
r
r
r
s
r
r
r
r
s
r
r
r
s
r
Difference statistically significant
Difference not statistically significant
Significance tests adjusted for multiple comparisons
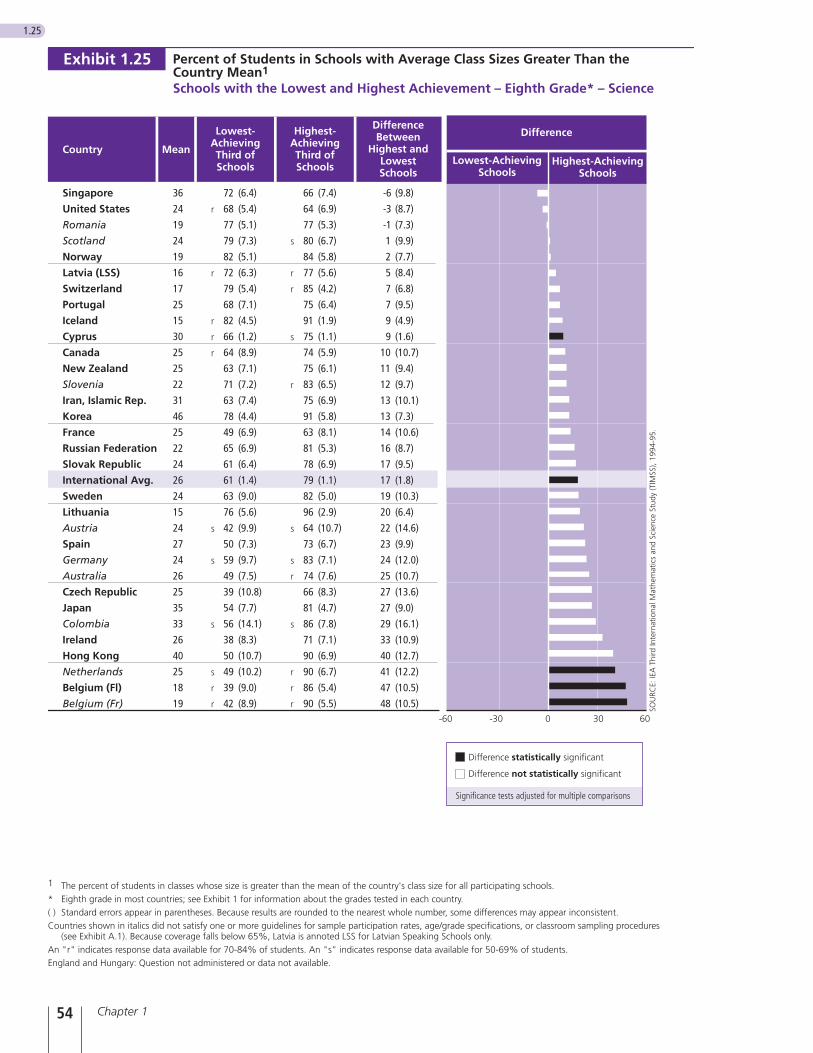
Chapter 154
1.25
1 The percent of students in classes whose size is greater than the mean of the country's class size for all participating schools.* Eighth grade in most countries; see Exhibit 1 for information about the grades tested in each country.( ) Standard errors appear in parentheses. Because results are rounded to the nearest whole number, some differences may appear inconsistent.Countries shown in italics did not satisfy one or more guidelines for sample participation rates, age/grade specifications, or classroom sampling procedures
(see Exhibit A.1). Because coverage falls below 65%, Latvia is annoted LSS for Latvian Speaking Schools only.An "r" indicates response data available for 70-84% of students. An "s" indicates response data available for 50-69% of students.England and Hungary: Question not administered or data not available.
Percent of Students in Schools with Average Class Sizes Greater Than theCountry Mean1
Schools with the Lowest and Highest Achievement – Eighth Grade* – Science
Exhibit 1.25
Lowest-AchievingSchools
Highest-AchievingSchools
Difference
Country Mean
Lowest-AchievingThird ofSchools
Highest-AchievingThird ofSchools
DifferenceBetween
Highest andLowestSchools
Singapore 36 72 (6.4) 66 (7.4) -6 (9.8)
United States 24 68 (5.4) 64 (6.9) -3 (8.7)
Romania 19 77 (5.1) 77 (5.3) -1 (7.3)
Scotland 24 79 (7.3) 80 (6.7) 1 (9.9)
Norway 19 82 (5.1) 84 (5.8) 2 (7.7)
Latvia (LSS) 16 72 (6.3) 77 (5.6) 5 (8.4)
Switzerland 17 79 (5.4) 85 (4.2) 7 (6.8)
Portugal 25 68 (7.1) 75 (6.4) 7 (9.5)
Iceland 15 82 (4.5) 91 (1.9) 9 (4.9)
Cyprus 30 66 (1.2) 75 (1.1) 9 (1.6)
Canada 25 64 (8.9) 74 (5.9) 10 (10.7)
New Zealand 25 63 (7.1) 75 (6.1) 11 (9.4)
Slovenia 22 71 (7.2) 83 (6.5) 12 (9.7)
Iran, Islamic Rep. 31 63 (7.4) 75 (6.9) 13 (10.1)
Korea 46 78 (4.4) 91 (5.8) 13 (7.3)
France 25 49 (6.9) 63 (8.1) 14 (10.6)
Russian Federation 22 65 (6.9) 81 (5.3) 16 (8.7)
Slovak Republic 24 61 (6.4) 78 (6.9) 17 (9.5)
International Avg. 26 61 (1.4) 79 (1.1) 17 (1.8)
Sweden 24 63 (9.0) 82 (5.0) 19 (10.3)
Lithuania 15 76 (5.6) 96 (2.9) 20 (6.4)
Austria 24 42 (9.9) 64 (10.7) 22 (14.6)
Spain 27 50 (7.3) 73 (6.7) 23 (9.9)
Germany 24 59 (9.7) 83 (7.1) 24 (12.0)
Australia 26 49 (7.5) 74 (7.6) 25 (10.7)
Czech Republic 25 39 (10.8) 66 (8.3) 27 (13.6)
Japan 35 54 (7.7) 81 (4.7) 27 (9.0)
Colombia 33 56 (14.1) 86 (7.8) 29 (16.1)
Ireland 26 38 (8.3) 71 (7.1) 33 (10.9)
Hong Kong 40 50 (10.7) 90 (6.9) 40 (12.7)
Netherlands 25 49 (10.2) 90 (6.7) 41 (12.2)
Belgium (Fl) 18 39 (9.0) 86 (5.4) 47 (10.5)
Belgium (Fr) 19 42 (8.9) 90 (5.5) 48 (10.5) SOU
RCE:
IEA
Thi
rd In
tern
atio
nal M
athe
mat
ics
and
Scie
nce
Stud
y (T
IMSS
), 19
94-9
5.
60-60 0-30 30
r
r
r
r
r
s
s
s
s
r
r
s
r
r
s
r
s
s
r
s
r
r
r
Difference statistically significant
Difference not statistically significant
Significance tests adjusted for multiple comparisons
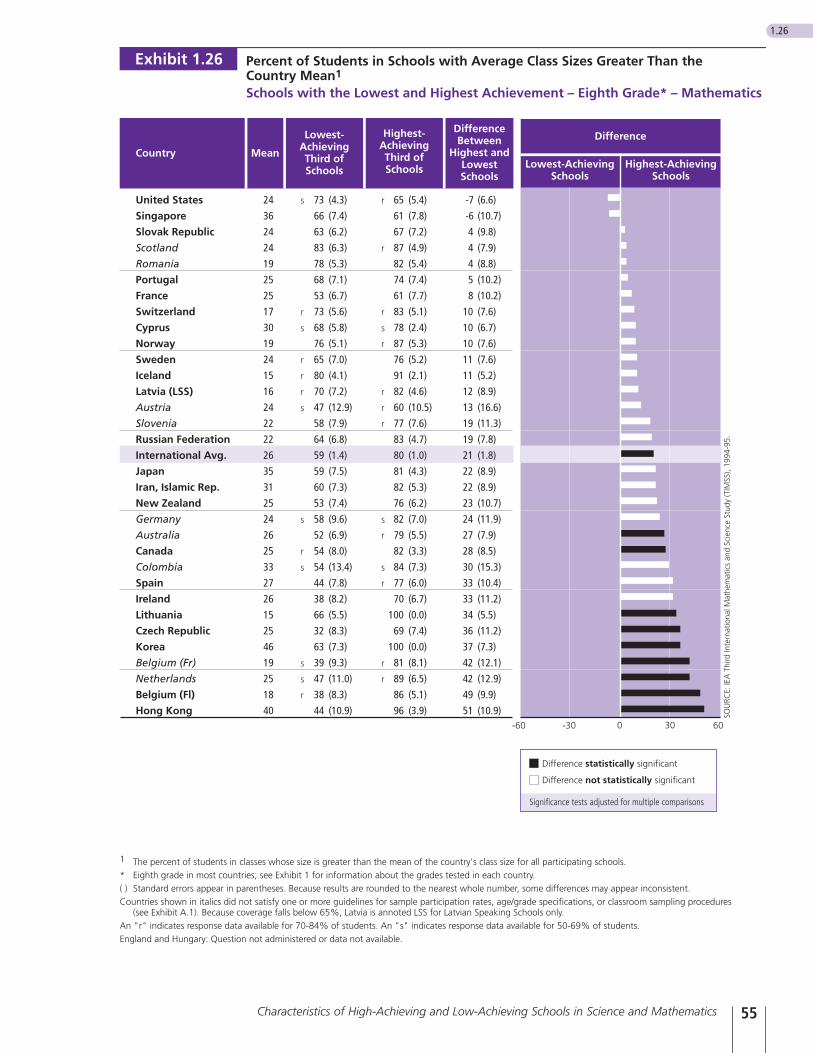
55Characteristics of High-Achieving and Low-Achieving Schools in Science and Mathematics
1.26
Percent of Students in Schools with Average Class Sizes Greater Than theCountry Mean1
Schools with the Lowest and Highest Achievement – Eighth Grade* – Mathematics
Lowest-AchievingSchools
Highest-AchievingSchools
Difference
Country Mean
Lowest-AchievingThird ofSchools
Highest-AchievingThird ofSchools
DifferenceBetween
Highest andLowestSchools
Exhibit 1.26
United States 24 73 (4.3) 65 (5.4) -7 (6.6)
Singapore 36 66 (7.4) 61 (7.8) -6 (10.7)
Slovak Republic 24 63 (6.2) 67 (7.2) 4 (9.8)
Scotland 24 83 (6.3) 87 (4.9) 4 (7.9)
Romania 19 78 (5.3) 82 (5.4) 4 (8.8)
Portugal 25 68 (7.1) 74 (7.4) 5 (10.2)
France 25 53 (6.7) 61 (7.7) 8 (10.2)
Switzerland 17 73 (5.6) 83 (5.1) 10 (7.6)
Cyprus 30 68 (5.8) 78 (2.4) 10 (6.7)
Norway 19 76 (5.1) 87 (5.3) 10 (7.6)
Sweden 24 65 (7.0) 76 (5.2) 11 (7.6)
Iceland 15 80 (4.1) 91 (2.1) 11 (5.2)
Latvia (LSS) 16 70 (7.2) 82 (4.6) 12 (8.9)
Austria 24 47 (12.9) 60 (10.5) 13 (16.6)
Slovenia 22 58 (7.9) 77 (7.6) 19 (11.3)
Russian Federation 22 64 (6.8) 83 (4.7) 19 (7.8)
International Avg. 26 59 (1.4) 80 (1.0) 21 (1.8)
Japan 35 59 (7.5) 81 (4.3) 22 (8.9)
Iran, Islamic Rep. 31 60 (7.3) 82 (5.3) 22 (8.9)
New Zealand 25 53 (7.4) 76 (6.2) 23 (10.7)
Germany 24 58 (9.6) 82 (7.0) 24 (11.9)
Australia 26 52 (6.9) 79 (5.5) 27 (7.9)
Canada 25 54 (8.0) 82 (3.3) 28 (8.5)
Colombia 33 54 (13.4) 84 (7.3) 30 (15.3)
Spain 27 44 (7.8) 77 (6.0) 33 (10.4)
Ireland 26 38 (8.2) 70 (6.7) 33 (11.2)
Lithuania 15 66 (5.5) 100 (0.0) 34 (5.5)
Czech Republic 25 32 (8.3) 69 (7.4) 36 (11.2)
Korea 46 63 (7.3) 100 (0.0) 37 (7.3)
Belgium (Fr) 19 39 (9.3) 81 (8.1) 42 (12.1)
Netherlands 25 47 (11.0) 89 (6.5) 42 (12.9)
Belgium (Fl) 18 38 (8.3) 86 (5.1) 49 (9.9)
Hong Kong 40 44 (10.9) 96 (3.9) 51 (10.9) SOU
RCE:
IEA
Thi
rd In
tern
atio
nal M
athe
mat
ics
and
Scie
nce
Stud
y (T
IMSS
), 19
94-9
5.60-60 0-30 30
1 The percent of students in classes whose size is greater than the mean of the country's class size for all participating schools.* Eighth grade in most countries; see Exhibit 1 for information about the grades tested in each country.( ) Standard errors appear in parentheses. Because results are rounded to the nearest whole number, some differences may appear inconsistent.Countries shown in italics did not satisfy one or more guidelines for sample participation rates, age/grade specifications, or classroom sampling procedures
(see Exhibit A.1). Because coverage falls below 65%, Latvia is annoted LSS for Latvian Speaking Schools only.An "r" indicates response data available for 70-84% of students. An "s" indicates response data available for 50-69% of students.England and Hungary: Question not administered or data not available.
s
r
s
r
r
r
s
s
r
s
s
s
r
r
r
r
s
r
r
r
r
s
r
s
r
r
r
Difference statistically significant
Difference not statistically significant
Significance tests adjusted for multiple comparisons
School Social Climate
The school-climate literature is concerned with the psychologicalcontext in which school behavior is embedded. School climate is con-sidered to be a relatively enduring quality of the school that is experi-enced by the teachers and students, influences their behavior, andcan be described in terms of the shared values of the school commu-nity.8 School climate has many aspects, but there is broad agreementthat a positive school climate embodies respect for the individual stu-dent and a safe and orderly learning environment. School social cli-mate, as used in this study, focuses on these factors. Research indi-cates that the safe and orderly learning environment of an effectiveschool has a positive effect on the behavior and academic perform-ance of students.9 When a school is forced to focus on keeping order,it often fails not only to achieve that goal, but also the more funda-mental goal of academic achievement.10
The school-social-climate category here consists of two indicators:
• serious student misbehavior
• administrative violations
Serious Student Misbehavior.Principals were asked to indicate the frequency of inappropriate stu-dent behavior that was directed at either another person or the prop-erty of others. Such behavior included classroom disturbance, cheat-ing, profanity, vandalism, theft, intimidation or verbal abuse of otherstudents, and physical injury to other students. TIMSS combinedthese into a single indicator of how often school principals reportedhaving to deal with serious student misbehavior. The percentages ofstudents in schools where such misconduct was reported often areshown in Exhibits 1.27 and 1.28. Although on average more princi-pals in the lowest-achieving schools reported dealing often with seri-ous student misbehavior, the difference was not statistically significantin most countries. For science achievement, the problem of seriousstudent misconduct was reported more frequently in the lower-achieving schools in Canada, Cyprus, and Hong Kong, and for math-ematics, in Hong Kong and Singapore.
Administrative Violations Frequent less serious student misbehavior can also be indicative of aschool learning environment that is less than orderly and in whichhigh levels of student achievement may be difficult to sustain. Toexamine this issue, four violations – arriving late for school, absen-teeism, skipping class, and violating the school dress code – were col-lected into a single index. This index has been labeled “administra-
Chapter 156
8 Owens, R. G. (1991). Organizational Behavior in Education, Fourth Ed., New Jersey: Prentice-Hall.
9 Witcher, A. E. (1993). “Assessing School Climate: An Important Step for Enhancing School Quality”.NASSP Bulletin, Vol. 77, No. 554, 1-5
10 Gaddy, G. D. (1988). “High School Order and Academic Achievement.” American Journal of Education, Vol. 96, No. 4, 496-518.
tive violations.” Exhibits 1.29 and 1.30 show the percentages of stu-dents who were in schools where principals reported dealing oftenwith such violations. As was the case with serious student misbehavior,on average, more principals in the low-achieving schools reporteddealing often with student administrative violations, but again the dif-ference was not statistically significant in most countries. Only inAustralia, Canada, Cyprus, and Singapore was there a significant dif-ference for science achievement, and only in Spain and Singaporefor mathematics.
57Characteristics of High-Achieving and Low-Achieving Schools in Science and Mathematics
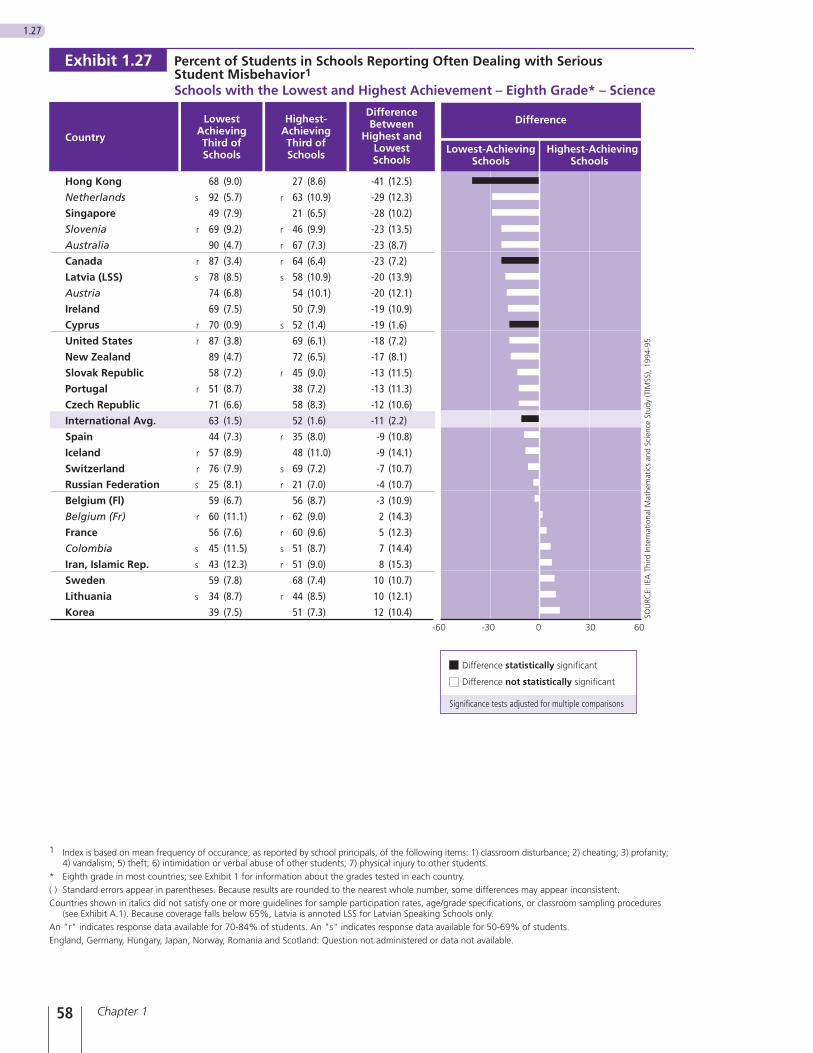
Chapter 158
1.27
SOU
RCE:
IEA
Thi
rd In
tern
atio
nal M
athe
mat
ics
and
Scie
nce
Stud
y (T
IMSS
), 19
94-9
5.
Exhibit 1.27 Percent of Students in Schools Reporting Often Dealing with SeriousStudent Misbehavior1
Schools with the Lowest and Highest Achievement – Eighth Grade* – Science
Country
LowestAchievingThird ofSchools
Highest-AchievingThird ofSchools
DifferenceBetween
Highest andLowestSchools
1 Index is based on mean frequency of occurance, as reported by school principals, of the following items: 1) classroom disturbance; 2) cheating; 3) profanity;4) vandalism; 5) theft; 6) intimidation or verbal abuse of other students; 7) physical injury to other students.
* Eighth grade in most countries; see Exhibit 1 for information about the grades tested in each country.( ) Standard errors appear in parentheses. Because results are rounded to the nearest whole number, some differences may appear inconsistent.Countries shown in italics did not satisfy one or more guidelines for sample participation rates, age/grade specifications, or classroom sampling procedures
(see Exhibit A.1). Because coverage falls below 65%, Latvia is annoted LSS for Latvian Speaking Schools only.An "r" indicates response data available for 70-84% of students. An "s" indicates response data available for 50-69% of students.England, Germany, Hungary, Japan, Norway, Romania and Scotland: Question not administered or data not available.
Lowest-AchievingSchools
Highest-AchievingSchools
Difference
Hong Kong 68 (9.0) 27 (8.6) -41 (12.5)
Netherlands 92 (5.7) 63 (10.9) -29 (12.3)
Singapore 49 (7.9) 21 (6.5) -28 (10.2)
Slovenia 69 (9.2) 46 (9.9) -23 (13.5)
Australia 90 (4.7) 67 (7.3) -23 (8.7)
Canada 87 (3.4) 64 (6.4) -23 (7.2)
Latvia (LSS) 78 (8.5) 58 (10.9) -20 (13.9)
Austria 74 (6.8) 54 (10.1) -20 (12.1)
Ireland 69 (7.5) 50 (7.9) -19 (10.9)
Cyprus 70 (0.9) 52 (1.4) -19 (1.6)
United States 87 (3.8) 69 (6.1) -18 (7.2)
New Zealand 89 (4.7) 72 (6.5) -17 (8.1)
Slovak Republic 58 (7.2) 45 (9.0) -13 (11.5)
Portugal 51 (8.7) 38 (7.2) -13 (11.3)
Czech Republic 71 (6.6) 58 (8.3) -12 (10.6)
International Avg. 63 (1.5) 52 (1.6) -11 (2.2)
Spain 44 (7.3) 35 (8.0) -9 (10.8)
Iceland 57 (8.9) 48 (11.0) -9 (14.1)
Switzerland 76 (7.9) 69 (7.2) -7 (10.7)
Russian Federation 25 (8.1) 21 (7.0) -4 (10.7)
Belgium (Fl) 59 (6.7) 56 (8.7) -3 (10.9)
Belgium (Fr) 60 (11.1) 62 (9.0) 2 (14.3)
France 56 (7.6) 60 (9.6) 5 (12.3)
Colombia 45 (11.5) 51 (8.7) 7 (14.4)
Iran, Islamic Rep. 43 (12.3) 51 (9.0) 8 (15.3)
Sweden 59 (7.8) 68 (7.4) 10 (10.7)
Lithuania 34 (8.7) 44 (8.5) 10 (12.1)
Korea 39 (7.5) 51 (7.3) 12 (10.4)60-60 0-30 30
s
r
r
s
r
r
r
r
r
s
r
s
s
s
r
r
r
r
s
s
r
r
s
r
r
r
s
r
r
Difference statistically significant
Difference not statistically significant
Significance tests adjusted for multiple comparisons
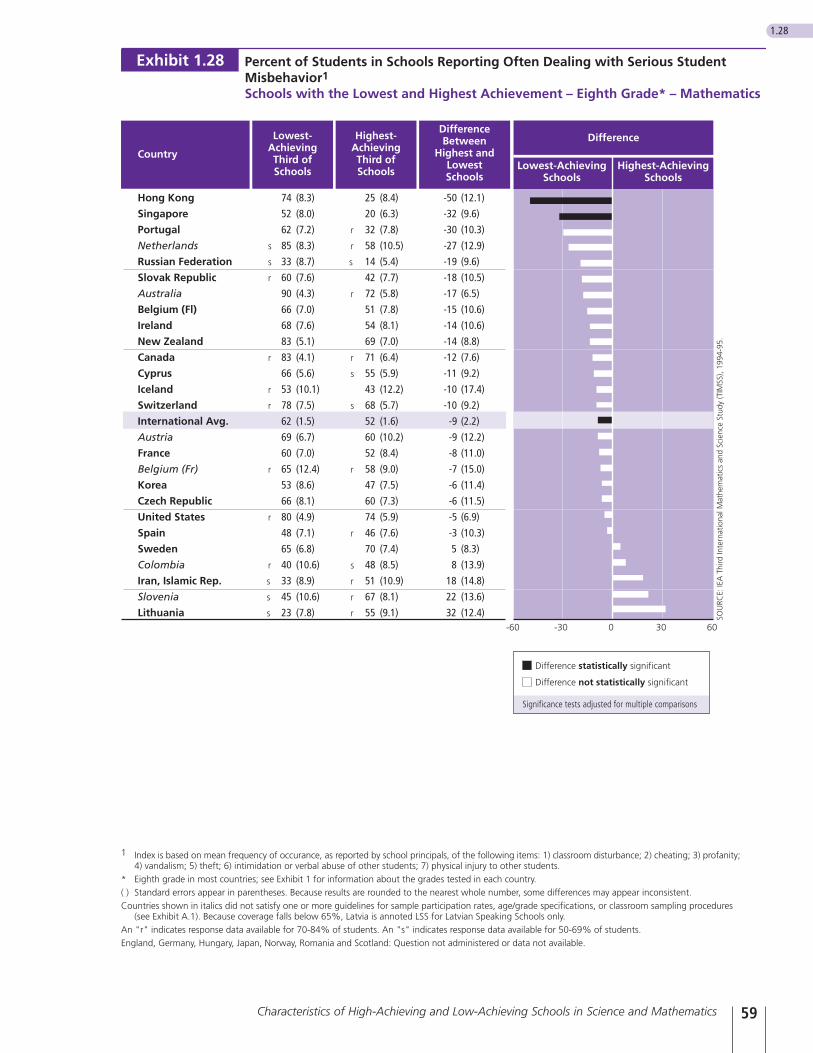
59Characteristics of High-Achieving and Low-Achieving Schools in Science and Mathematics
1.28
Exhibit 1.28 Percent of Students in Schools Reporting Often Dealing with Serious StudentMisbehavior1
Schools with the Lowest and Highest Achievement – Eighth Grade* – Mathematics
Country
Lowest-AchievingThird ofSchools
Highest-AchievingThird ofSchools
DifferenceBetween
Highest andLowestSchools
Hong Kong 74 (8.3) 25 (8.4) -50 (12.1)
Singapore 52 (8.0) 20 (6.3) -32 (9.6)
Portugal 62 (7.2) 32 (7.8) -30 (10.3)
Netherlands 85 (8.3) 58 (10.5) -27 (12.9)
Russian Federation 33 (8.7) 14 (5.4) -19 (9.6)
Slovak Republic 60 (7.6) 42 (7.7) -18 (10.5)
Australia 90 (4.3) 72 (5.8) -17 (6.5)
Belgium (Fl) 66 (7.0) 51 (7.8) -15 (10.6)
Ireland 68 (7.6) 54 (8.1) -14 (10.6)
New Zealand 83 (5.1) 69 (7.0) -14 (8.8)
Canada 83 (4.1) 71 (6.4) -12 (7.6)
Cyprus 66 (5.6) 55 (5.9) -11 (9.2)
Iceland 53 (10.1) 43 (12.2) -10 (17.4)
Switzerland 78 (7.5) 68 (5.7) -10 (9.2)
International Avg. 62 (1.5) 52 (1.6) -9 (2.2)
Austria 69 (6.7) 60 (10.2) -9 (12.2)
France 60 (7.0) 52 (8.4) -8 (11.0)
Belgium (Fr) 65 (12.4) 58 (9.0) -7 (15.0)
Korea 53 (8.6) 47 (7.5) -6 (11.4)
Czech Republic 66 (8.1) 60 (7.3) -6 (11.5)
United States 80 (4.9) 74 (5.9) -5 (6.9)
Spain 48 (7.1) 46 (7.6) -3 (10.3)
Sweden 65 (6.8) 70 (7.4) 5 (8.3)
Colombia 40 (10.6) 48 (8.5) 8 (13.9)
Iran, Islamic Rep. 33 (8.9) 51 (10.9) 18 (14.8)
Slovenia 45 (10.6) 67 (8.1) 22 (13.6)
Lithuania 23 (7.8) 55 (9.1) 32 (12.4) SOU
RCE:
IEA
Thi
rd In
tern
atio
nal M
athe
mat
ics
and
Scie
nce
Stud
y (T
IMSS
), 19
94-9
5.
60-60 0
Lowest-AchievingSchools
Highest-AchievingSchools
Difference
30-30
1 Index is based on mean frequency of occurance, as reported by school principals, of the following items: 1) classroom disturbance; 2) cheating; 3) profanity;4) vandalism; 5) theft; 6) intimidation or verbal abuse of other students; 7) physical injury to other students.
* Eighth grade in most countries; see Exhibit 1 for information about the grades tested in each country.( ) Standard errors appear in parentheses. Because results are rounded to the nearest whole number, some differences may appear inconsistent.Countries shown in italics did not satisfy one or more guidelines for sample participation rates, age/grade specifications, or classroom sampling procedures
(see Exhibit A.1). Because coverage falls below 65%, Latvia is annoted LSS for Latvian Speaking Schools only.An "r" indicates response data available for 70-84% of students. An "s" indicates response data available for 50-69% of students.England, Germany, Hungary, Japan, Norway, Romania and Scotland: Question not administered or data not available.
s
s
r
r
r
r
r
r
r
s
s
s
r
r
s
r
r
s
s
r
r
s
r
r
r
Difference statistically significant
Difference not statistically significant
Significance tests adjusted for multiple comparisons
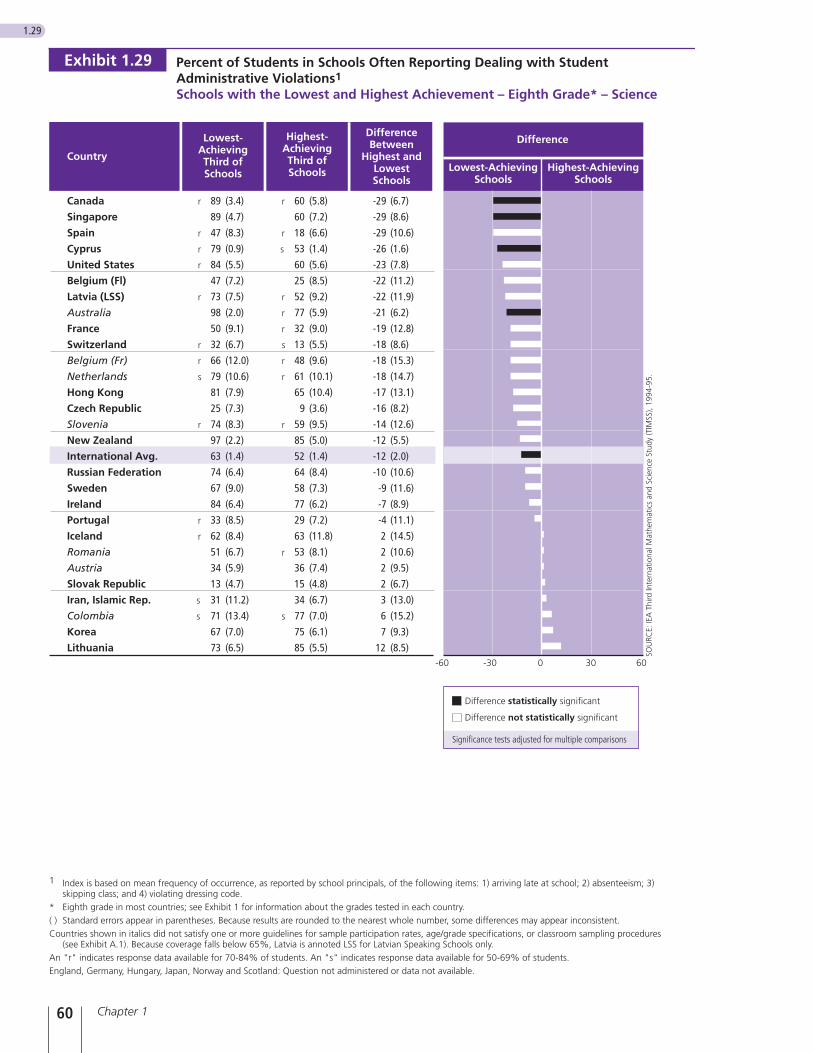
Chapter 160
1.29
Percent of Students in Schools Often Reporting Dealing with StudentAdministrative Violations1
Schools with the Lowest and Highest Achievement – Eighth Grade* – Science
Exhibit 1.29
1 Index is based on mean frequency of occurrence, as reported by school principals, of the following items: 1) arriving late at school; 2) absenteeism; 3)skipping class; and 4) violating dressing code.
* Eighth grade in most countries; see Exhibit 1 for information about the grades tested in each country.( ) Standard errors appear in parentheses. Because results are rounded to the nearest whole number, some differences may appear inconsistent.Countries shown in italics did not satisfy one or more guidelines for sample participation rates, age/grade specifications, or classroom sampling procedures
(see Exhibit A.1). Because coverage falls below 65%, Latvia is annoted LSS for Latvian Speaking Schools only.An "r" indicates response data available for 70-84% of students. An "s" indicates response data available for 50-69% of students.England, Germany, Hungary, Japan, Norway and Scotland: Question not administered or data not available.
Canada 89 (3.4) 60 (5.8) -29 (6.7)
Singapore 89 (4.7) 60 (7.2) -29 (8.6)
Spain 47 (8.3) 18 (6.6) -29 (10.6)
Cyprus 79 (0.9) 53 (1.4) -26 (1.6)
United States 84 (5.5) 60 (5.6) -23 (7.8)
Belgium (Fl) 47 (7.2) 25 (8.5) -22 (11.2)
Latvia (LSS) 73 (7.5) 52 (9.2) -22 (11.9)
Australia 98 (2.0) 77 (5.9) -21 (6.2)
France 50 (9.1) 32 (9.0) -19 (12.8)
Switzerland 32 (6.7) 13 (5.5) -18 (8.6)
Belgium (Fr) 66 (12.0) 48 (9.6) -18 (15.3)
Netherlands 79 (10.6) 61 (10.1) -18 (14.7)
Hong Kong 81 (7.9) 65 (10.4) -17 (13.1)
Czech Republic 25 (7.3) 9 (3.6) -16 (8.2)
Slovenia 74 (8.3) 59 (9.5) -14 (12.6)
New Zealand 97 (2.2) 85 (5.0) -12 (5.5)
International Avg. 63 (1.4) 52 (1.4) -12 (2.0)
Russian Federation 74 (6.4) 64 (8.4) -10 (10.6)
Sweden 67 (9.0) 58 (7.3) -9 (11.6)
Ireland 84 (6.4) 77 (6.2) -7 (8.9)
Portugal 33 (8.5) 29 (7.2) -4 (11.1)
Iceland 62 (8.4) 63 (11.8) 2 (14.5)
Romania 51 (6.7) 53 (8.1) 2 (10.6)
Austria 34 (5.9) 36 (7.4) 2 (9.5)
Slovak Republic 13 (4.7) 15 (4.8) 2 (6.7)
Iran, Islamic Rep. 31 (11.2) 34 (6.7) 3 (13.0)
Colombia 71 (13.4) 77 (7.0) 6 (15.2)
Korea 67 (7.0) 75 (6.1) 7 (9.3)
Lithuania 73 (6.5) 85 (5.5) 12 (8.5)SO
URC
E: IE
A T
hird
Inte
rnat
iona
l Mat
hem
atic
s an
d Sc
ienc
e St
udy
(TIM
SS),
1994
-95.
60-60 0-30 30
Country
Lowest-AchievingThird ofSchools
Highest-AchievingThird ofSchools
DifferenceBetween
Highest andLowestSchools
Lowest-AchievingSchools
Highest-AchievingSchools
Difference
r
r
r
r
r
r
r
s
r
r
r
s
s
r
r
s
r
r
r
s
r
r
r
r
s
Difference statistically significant
Difference not statistically significant
Significance tests adjusted for multiple comparisons
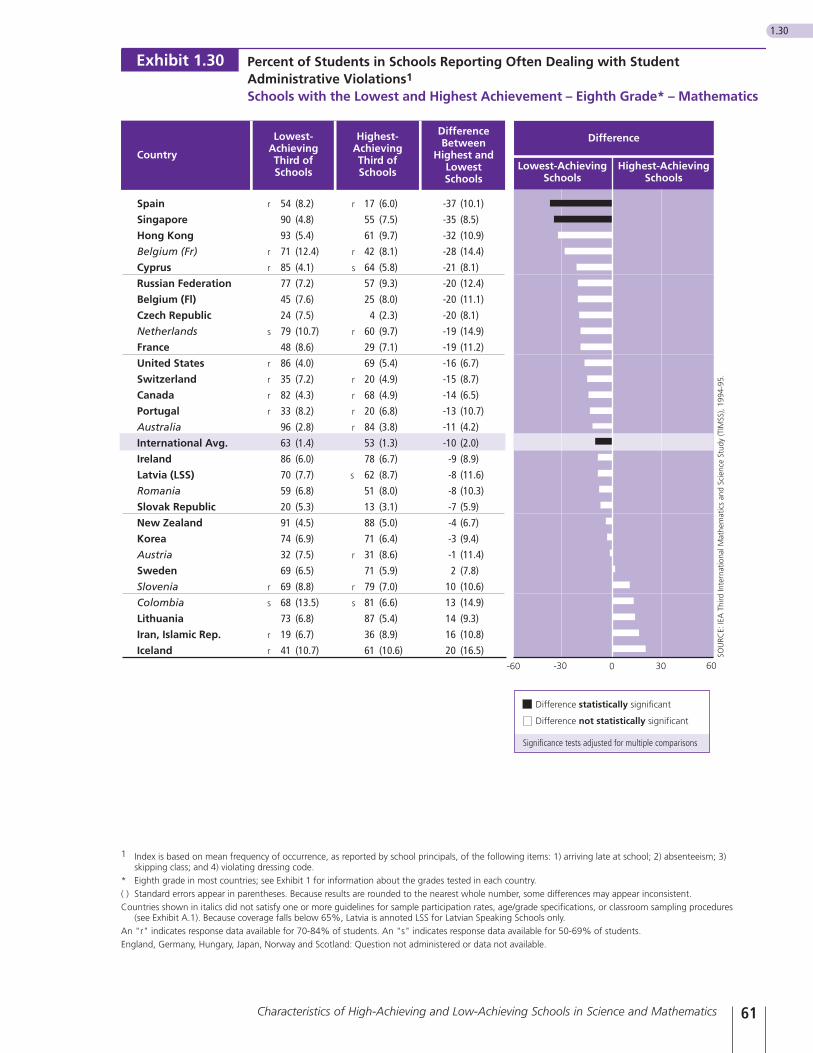
61Characteristics of High-Achieving and Low-Achieving Schools in Science and Mathematics
1.30
Percent of Students in Schools Reporting Often Dealing with StudentAdministrative Violations1
Schools with the Lowest and Highest Achievement – Eighth Grade* – Mathematics
Exhibit 1.30
SOU
RCE:
IEA
Thi
rd In
tern
atio
nal M
athe
mat
ics
and
Scie
nce
Stud
y (T
IMSS
), 19
94-9
5.
Spain 54 (8.2) 17 (6.0) -37 (10.1)
Singapore 90 (4.8) 55 (7.5) -35 (8.5)
Hong Kong 93 (5.4) 61 (9.7) -32 (10.9)
Belgium (Fr) 71 (12.4) 42 (8.1) -28 (14.4)
Cyprus 85 (4.1) 64 (5.8) -21 (8.1)
Russian Federation 77 (7.2) 57 (9.3) -20 (12.4)
Belgium (Fl) 45 (7.6) 25 (8.0) -20 (11.1)
Czech Republic 24 (7.5) 4 (2.3) -20 (8.1)
Netherlands 79 (10.7) 60 (9.7) -19 (14.9)
France 48 (8.6) 29 (7.1) -19 (11.2)
United States 86 (4.0) 69 (5.4) -16 (6.7)
Switzerland 35 (7.2) 20 (4.9) -15 (8.7)
Canada 82 (4.3) 68 (4.9) -14 (6.5)
Portugal 33 (8.2) 20 (6.8) -13 (10.7)
Australia 96 (2.8) 84 (3.8) -11 (4.2)
International Avg. 63 (1.4) 53 (1.3) -10 (2.0)
Ireland 86 (6.0) 78 (6.7) -9 (8.9)
Latvia (LSS) 70 (7.7) 62 (8.7) -8 (11.6)
Romania 59 (6.8) 51 (8.0) -8 (10.3)
Slovak Republic 20 (5.3) 13 (3.1) -7 (5.9)
New Zealand 91 (4.5) 88 (5.0) -4 (6.7)
Korea 74 (6.9) 71 (6.4) -3 (9.4)
Austria 32 (7.5) 31 (8.6) -1 (11.4)
Sweden 69 (6.5) 71 (5.9) 2 (7.8)
Slovenia 69 (8.8) 79 (7.0) 10 (10.6)
Colombia 68 (13.5) 81 (6.6) 13 (14.9)
Lithuania 73 (6.8) 87 (5.4) 14 (9.3)
Iran, Islamic Rep. 19 (6.7) 36 (8.9) 16 (10.8)
Iceland 41 (10.7) 61 (10.6) 20 (16.5)60-60 0-30 30
Country
Lowest-AchievingThird ofSchools
Highest-AchievingThird ofSchools
DifferenceBetween
Highest andLowestSchools
Lowest-AchievingSchools
Highest-AchievingSchools
Difference
1 Index is based on mean frequency of occurrence, as reported by school principals, of the following items: 1) arriving late at school; 2) absenteeism; 3)skipping class; and 4) violating dressing code.
* Eighth grade in most countries; see Exhibit 1 for information about the grades tested in each country.( ) Standard errors appear in parentheses. Because results are rounded to the nearest whole number, some differences may appear inconsistent.Countries shown in italics did not satisfy one or more guidelines for sample participation rates, age/grade specifications, or classroom sampling procedures
(see Exhibit A.1). Because coverage falls below 65%, Latvia is annoted LSS for Latvian Speaking Schools only.An "r" indicates response data available for 70-84% of students. An "s" indicates response data available for 50-69% of students.England, Germany, Hungary, Japan, Norway and Scotland: Question not administered or data not available.
r
r
r
s
r
r
r
r
r
s
r
r
r
r
s
r
r
r
r
r
s
r
r
s
Difference statistically significant
Difference not statistically significant
Significance tests adjusted for multiple comparisons
Student Attitudes towards Science and Mathematics
Positive student attitudes towards the subject matter are an importantgoal of most science and mathematics curricula, both as desirableoutcomes in their own right, and because students with positive atti-tudes are thought more likely to choose further courses in scienceand mathematics and to seek employment in related fields. Thethree factors included in this category include:
• student attitudes towards science
• student attitudes towards mathematics
• student belief in the efficacy of science
Student Attitudes towards Science An index incorporating student responses to questions about theirattitude to science was constructed using 14 items from the studentquestionnaire. Students were asked whether they liked science, andwhether they found their science subjects enjoyable or boring. Thepercentages of students in the high- and low-achieving schools thathad a positive attitude towards science are shown in Exhibit 1.31.Among the low-achieving schools, the percentage of students with apositive attitude towards science ranged from a low of 30% in Koreato a high of 84% in both the Russian Federation and Romania, whileamong the high-achieving schools, it ranged from a low of 37% inKorea to a high of 89% in Romania.
Although in quite a few countries attitudes to science were equallypositive in both high- and low-achieving schools, on average a greaterpercentage of students in the high-achieving schools had a positiveattitude towards science. In eleven countries, significantly greaterpercentages of students in the high-achieving schools reported a posi-tive attitude towards science. The largest differences were found inBelgium (Flemish) and Ireland, where the differences were 20 and21 percentage points, respectively.
Student Attitudes towards Mathematics An index of student attitude towards mathematics was constructed byaveraging student responses to five questions: (a) I like mathematics,(b) I enjoy mathematics, (c) mathematics is boring, (d) mathematicsis important to everyone’s life, and (e) I would like a job that involvesusing mathematics. In general, there was little difference in studentattitude between the low-achieving schools and high-achievingschools, with on average about 70% of the students in each groupreporting a positive attitude towards mathematics (see Exhibit 1.32).In five countries, Australia, Belgium (Flemish), Hong Kong,Singapore, and Sweden, significantly greater percentages of studentsin the high-achieving schools reported having a positive attitudetowards mathematics.
Chapter 162
Student Belief in the Efficacy of Science As a further measure of their attitude towards science, TIMSS con-structed an index of students’ belief in the efficacy of science. Theindex was based on students’ reported beliefs that science couldmake a contribution to the solution of each of the following prob-lems: air pollution, water pollution, destruction of forests, endan-gered species, damage to ozone layer, and problems with nuclearpower plants.
The percentages of students in the high- and low-achieving schoolsthat reported a belief in the efficacy of science are presented inExhibit 1.33. On average across countries, greater percentages of stu-dents in the high-achieving schools indicated that they thought thatscience could help solve the world’s environmental problems. In tencountries, including Australia, the Czech Republic, Hungary, Iran,New Zealand, Romania, Singapore, the Slovak Republic, Spain, andthe United States, students in the high-achieving schools reportedgreater belief in the efficacy of science. The highest level of beliefwas expressed by students in the high-achieving schools in the UnitedStates (77%), while the lowest level was expressed by students in thelow-achieving schools in Iran.
63Characteristics of High-Achieving and Low-Achieving Schools in Science and Mathematics
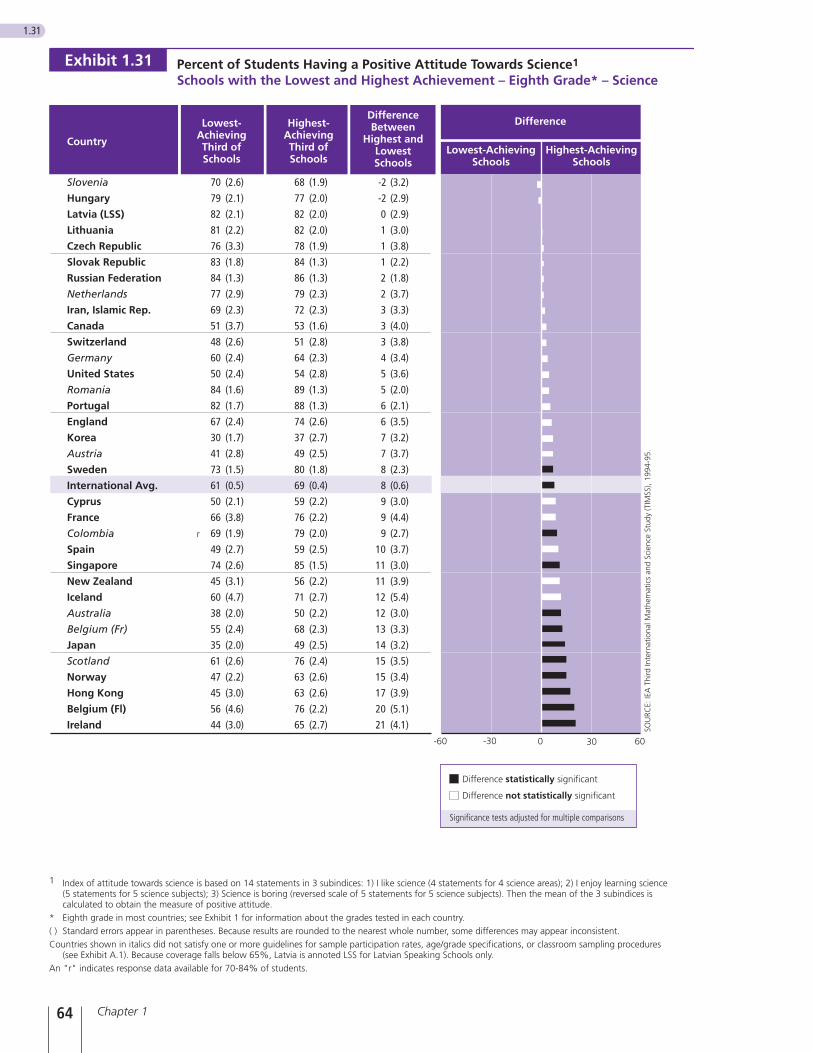
Chapter 164
1.31
Exhibit 1.31 Percent of Students Having a Positive Attitude Towards Science1
Schools with the Lowest and Highest Achievement – Eighth Grade* – Science
Slovenia 70 (2.6) 68 (1.9) -2 (3.2)
Hungary 79 (2.1) 77 (2.0) -2 (2.9)
Latvia (LSS) 82 (2.1) 82 (2.0) 0 (2.9)
Lithuania 81 (2.2) 82 (2.0) 1 (3.0)
Czech Republic 76 (3.3) 78 (1.9) 1 (3.8)
Slovak Republic 83 (1.8) 84 (1.3) 1 (2.2)
Russian Federation 84 (1.3) 86 (1.3) 2 (1.8)
Netherlands 77 (2.9) 79 (2.3) 2 (3.7)
Iran, Islamic Rep. 69 (2.3) 72 (2.3) 3 (3.3)
Canada 51 (3.7) 53 (1.6) 3 (4.0)
Switzerland 48 (2.6) 51 (2.8) 3 (3.8)
Germany 60 (2.4) 64 (2.3) 4 (3.4)
United States 50 (2.4) 54 (2.8) 5 (3.6)
Romania 84 (1.6) 89 (1.3) 5 (2.0)
Portugal 82 (1.7) 88 (1.3) 6 (2.1)
England 67 (2.4) 74 (2.6) 6 (3.5)
Korea 30 (1.7) 37 (2.7) 7 (3.2)
Austria 41 (2.8) 49 (2.5) 7 (3.7)
Sweden 73 (1.5) 80 (1.8) 8 (2.3)
International Avg. 61 (0.5) 69 (0.4) 8 (0.6)
Cyprus 50 (2.1) 59 (2.2) 9 (3.0)
France 66 (3.8) 76 (2.2) 9 (4.4)
Colombia r 69 (1.9) 79 (2.0) 9 (2.7)
Spain 49 (2.7) 59 (2.5) 10 (3.7)
Singapore 74 (2.6) 85 (1.5) 11 (3.0)
New Zealand 45 (3.1) 56 (2.2) 11 (3.9)
Iceland 60 (4.7) 71 (2.7) 12 (5.4)
Australia 38 (2.0) 50 (2.2) 12 (3.0)
Belgium (Fr) 55 (2.4) 68 (2.3) 13 (3.3)
Japan 35 (2.0) 49 (2.5) 14 (3.2)
Scotland 61 (2.6) 76 (2.4) 15 (3.5)
Norway 47 (2.2) 63 (2.6) 15 (3.4)
Hong Kong 45 (3.0) 63 (2.6) 17 (3.9)
Belgium (Fl) 56 (4.6) 76 (2.2) 20 (5.1)
Ireland 44 (3.0) 65 (2.7) 21 (4.1) SOU
RCE:
IEA
Thi
rd In
tern
atio
nal M
athe
mat
ics
and
Scie
nce
Stud
y (T
IMSS
), 19
94-9
5.
60-60 0-30 30
Country
Lowest-AchievingThird ofSchools
Highest-AchievingThird ofSchools
DifferenceBetween
Highest andLowestSchools
Difference
Lowest-AchievingSchools
Highest-AchievingSchools
1 Index of attitude towards science is based on 14 statements in 3 subindices: 1) I like science (4 statements for 4 science areas); 2) I enjoy learning science(5 statements for 5 science subjects); 3) Science is boring (reversed scale of 5 statements for 5 science subjects). Then the mean of the 3 subindices iscalculated to obtain the measure of positive attitude.
* Eighth grade in most countries; see Exhibit 1 for information about the grades tested in each country.( ) Standard errors appear in parentheses. Because results are rounded to the nearest whole number, some differences may appear inconsistent.Countries shown in italics did not satisfy one or more guidelines for sample participation rates, age/grade specifications, or classroom sampling procedures
(see Exhibit A.1). Because coverage falls below 65%, Latvia is annoted LSS for Latvian Speaking Schools only.An "r" indicates response data available for 70-84% of students.
Difference statistically significant
Difference not statistically significant
Significance tests adjusted for multiple comparisons

65Characteristics of High-Achieving and Low-Achieving Schools in Science and Mathematics
1.32
Percent of Students Having a Positive Attitude Towards Mathematics1
Schools with the Lowest and Highest Achievement – Eighth Grade* – MathematicsExhibit 1.32
SOU
RCE:
IEA
Thi
rd In
tern
atio
nal M
athe
mat
ics
and
Scie
nce
Stud
y (T
IMSS
), 19
94-9
5.
Lithuania 64 (3.0) 58 (1.8) -6 (3.5)
Austria 59 (1.8) 54 (2.2) -5 (2.8)
Slovenia 68 (2.3) 63 (2.3) -5 (2.9)
Canada 75 (1.9) 70 (1.5) -4 (2.4)
Switzerland 71 (1.9) 67 (2.4) -4 (3.1)
Germany 59 (2.3) 56 (2.1) -3 (3.1)
Czech Republic 60 (2.7) 58 (2.4) -2 (3.6)
Colombia 89 (1.4) 87 (2.5) -2 (2.8)
Spain 65 (2.3) 64 (1.9) -2 (3.0)
England 83 (1.8) 82 (1.9) -1 (2.7)
New Zealand 77 (1.8) 77 (1.4) -1 (2.5)
Latvia (LSS) 70 (2.3) 70 (1.9) -1 (3.0)
Hungary 60 (2.4) 60 (1.8) -1 (3.0)
Belgium (Fr) 70 (2.8) 71 (2.1) 2 (3.5)
International Avg. 67 (0.4) 70 (0.3) 3 (0.5)
Norway 67 (1.4) 70 (1.7) 3 (2.1)
Japan 50 (2.1) 53 (1.7) 3 (2.5)
Scotland 74 (2.5) 78 (2.1) 4 (3.2)
Iceland 72 (2.2) 76 (2.5) 4 (3.5)
Ireland 70 (2.4) 74 (2.2) 4 (3.4)
United States 68 (1.6) 73 (1.4) 4 (2.1)
Korea 48 (2.2) 52 (1.5) 4 (2.6)
Iran, Islamic Rep. 80 (2.4) 85 (1.5) 5 (3.0)
Netherlands 55 (4.3) 60 (3.5) 5 (5.5)
Romania 74 (2.5) 79 (2.0) 5 (3.4)
France 65 (2.7) 73 (2.2) 7 (3.4)
Cyprus 76 (2.6) 84 (1.2) 7 (2.9)
Slovak Republic 65 (1.8) 73 (1.7) 8 (2.5)
Russian Federation 71 (2.5) 79 (1.9) 9 (3.3)
Portugal 70 (2.3) 79 (1.9) 9 (3.0)
Singapore 77 (1.8) 87 (1.1) 10 (2.0)
Australia 58 (1.6) 68 (1.5) 10 (2.3)
Hong Kong 60 (2.7) 72 (1.8) 12 (3.2)
Sweden 58 (2.2) 70 (1.7) 12 (2.9)
Belgium (Fl) 56 (2.2) 71 (1.6) 15 (2.8)60-60 0-30 30
Country
Lowest-AchievingThird ofSchools
Highest-AchievingThird ofSchools
DifferenceBetween
Highest andLowestSchools
Lowest-AchievingSchools
Highest-AchievingSchools
Difference
1 Index of attitude towards mathematics is based on the average of five questions: 1) I like mathematics; 2) I enjoy learning mathematics; 3) Mathematicsis boring; 4) Mathematics is important to everyone's life; 5) I would like a job that involved using mathematics.
* Eighth grade in most countries; see Exhibit 1 for information about the grades tested in each country.( ) Standard errors appear in parentheses. Because results are rounded to the nearest whole number, some differences may appear inconsistent.Countries shown in italics did not satisfy one or more guidelines for sample participation rates, age/grade specifications, or classroom sampling procedures
(see Exhibit A.1). Because coverage falls below 65%, Latvia is annoted LSS for Latvian Speaking Schools only.
Difference statistically significant
Difference not statistically significant
Significance tests adjusted for multiple comparisons
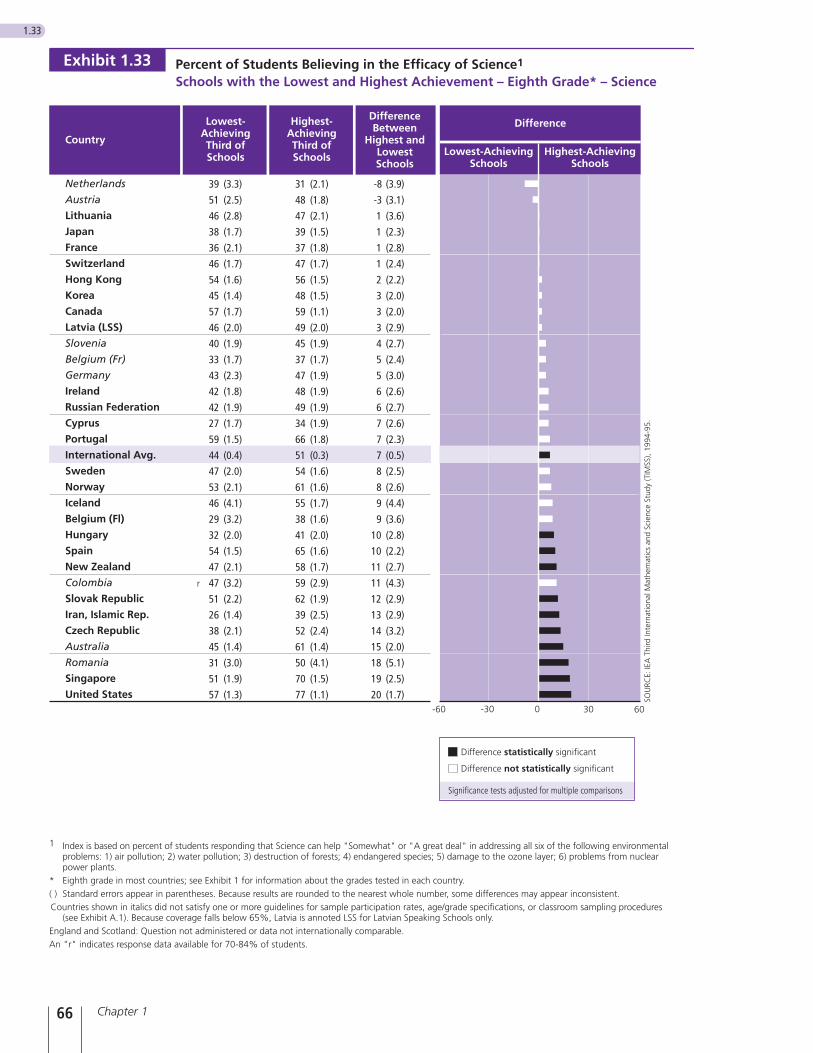
Chapter 166
1.33
Percent of Students Believing in the Efficacy of Science1
Schools with the Lowest and Highest Achievement – Eighth Grade* – Science
Exhibit 1.33
SOU
RCE:
IEA
Thi
rd In
tern
atio
nal M
athe
mat
ics
and
Scie
nce
Stud
y (T
IMSS
), 19
94-9
5.
Country
Lowest-AchievingThird ofSchools
Highest-AchievingThird ofSchools
DifferenceBetween
Highest andLowestSchools
Lowest-AchievingSchools
Highest-AchievingSchools
Difference
39 (3.3) 31 (2.1) -8 (3.9)
51 (2.5) 48 (1.8) -3 (3.1)
46 (2.8) 47 (2.1) 1 (3.6)
38 (1.7) 39 (1.5) 1 (2.3)
36 37 (1.8) 1 (2.8)
46 (1.7) 47 (1.7) 1 (2.4)
54 (1.6) 56 (1.5) 2 (2.2)
45 (1.4) 48 (1.5) 3 (2.0)
57 (1.7) 59 (1.1) 3 (2.0)
46 (2.0) 49 (2.0) 3 (2.9)
40 (1.9) 45 (1.9) 4 (2.7)
33 (1.7) 37 (1.7) 5 (2.4)
43 (2.3) 47 (1.9) 5 (3.0)
42 (1.8) 48 (1.9) 6 (2.6)
42 (1.9) 49 (1.9) 6 (2.7)
27 (1.7) 34 (1.9) 7 (2.6)
59 (1.5) 66 (1.8) 7 (2.3)
44 (0.4) 51 (0.3) 7 (0.5)
47 (2.0) 54 (1.6) 8 (2.5)
53 (2.1) 61 (1.6) 8 (2.6)
46 (4.1) 55 (1.7) 9 (4.4)
29 (3.2) 38 (1.6) 9 (3.6)
32 (2.0) 41 (2.0) 10 (2.8)
54 (1.5) 65 (1.6) 10 (2.2)
47 (2.1) 58 (1.7) 11 (2.7)
r 47 (3.2) 59 (2.9) 11 (4.3)
51 (2.2) 62 (1.9) 12 (2.9)
26 (1.4) 39 (2.5) 13 (2.9)
38 (2.1) 52 (2.4) 14 (3.2)
45 (1.4) 61 (1.4) 15 (2.0)
31 (3.0) 50 (4.1) 18 (5.1)
51 (1.9) 70 (1.5) 19 (2.5)
57 (1.3) 77 (1.1) 20 (1.7)60-60 0-30 30
1 Index is based on percent of students responding that Science can help "Somewhat" or "A great deal" in addressing all six of the following environmentalproblems: 1) air pollution; 2) water pollution; 3) destruction of forests; 4) endangered species; 5) damage to the ozone layer; 6) problems from nuclearpower plants.
* Eighth grade in most countries; see Exhibit 1 for information about the grades tested in each country.( ) Standard errors appear in parentheses. Because results are rounded to the nearest whole number, some differences may appear inconsistent.Countries shown in italics did not satisfy one or more guidelines for sample participation rates, age/grade specifications, or classroom sampling procedures
(see Exhibit A.1). Because coverage falls below 65%, Latvia is annoted LSS for Latvian Speaking Schools only.England and Scotland: Question not administered or data not internationally comparable.An "r" indicates response data available for 70-84% of students.
Netherlands
Austria
Lithuania
Japan
France
Switzerland
Hong Kong
Korea
Canada
Latvia (LSS)
Slovenia
Belgium (Fr)
Germany
Ireland
Russian Federation
Cyprus
Portugal
International Avg.
Sweden
Norway
Iceland
Belgium (Fl)
Hungary
Spain
New Zealand
Colombia
Slovak Republic
Iran, Islamic Rep.
Czech Republic
Australia
Romania
Singapore
United States
(2.1)
Difference statistically significant
Difference not statistically significant
Significance tests adjusted for multiple comparisons
Instructional Activities in Science and Mathematics Class
Of the many instructional activities in mathematics and science thatTIMSS asked about, the two most strongly related to student achieve-ment were the reported frequency of doing experiments or practicalinvestigations in science class, and the frequency with which mathe-matics teachers checked homework in class.
Students Doing Science Experiments Although large classes and scarcity of resources can limit what can beimplemented, many science educators today stress the desirability ofteaching science as a discovery activity, with great emphasis on stu-dents carrying out experiments and practical investigations. Exhibit1.34 presents the percentages of students in high- and low-achievingschools in each country that reported doing such activities often inscience class. It is clear from this exhibit that although there arecountries where many “hands-on” activities take place – for exampleEngland, Scotland, and Sweden, where more than 80% of students inboth groups of schools reported doing experiments often – in manycountries practical work in science class is relatively rare. In Austria,Belgium (French), Hungary, Iran, Korea, and Spain, less than 40% ofstudents in either group of schools reported conducting practicalwork often in science class. These differences suggest that the way sci-ence is taught in the classroom varies considerably around the world.Apart from the two extremes noted above – countries where every-body does a lot of practical work in science classes and countrieswere nobody does a lot – there were countries such as Australia,France, Hong Kong, Netherlands, New Zealand, Scotland, andSingapore, where doing experiments or practical work often wasmore frequently reported by students in the high-achieving schools.
Teacher Frequently Checks Mathematics Homework in Class The practice of giving homework and subsequently checking it inclass was reported to be widespread. In eight countries, Austria,Belgium (Flemish), the Czech Republic, England, Ireland,Latvia(LSS), Scotland and Singapore, more than 80% of students inboth high- and low-achieving schools reported that the teacher alwaysor almost always checks homework in mathematics class. Only inJapan and Korea, two of the countries with the highest averageachievement, did less than half of the students in both groups ofschools report that the mathematics teacher usually checks home-work. In several countries, including the Netherlands, Australia,Switzerland, and the United States, the practice of checking home-work in mathematics class was more frequently reported by studentsof low-achieving schools (see Exhibit 1.35).
67Characteristics of High-Achieving and Low-Achieving Schools in Science and Mathematics
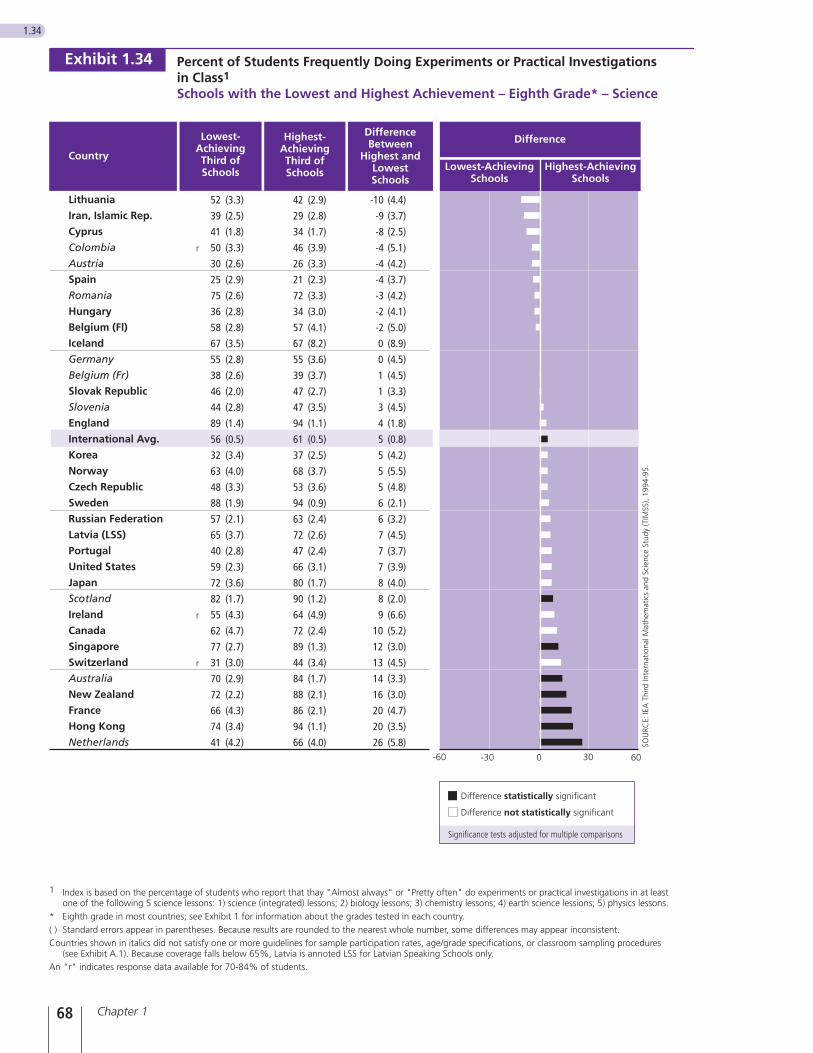
Chapter 168
1.34
Percent of Students Frequently Doing Experiments or Practical Investigationsin Class1
Schools with the Lowest and Highest Achievement – Eighth Grade* – Science
1 Index is based on the percentage of students who report that thay "Almost always" or "Pretty often" do experiments or practical investigations in at leastone of the following 5 science lessons: 1) science (integrated) lessons; 2) biology lessons; 3) chemistry lessons; 4) earth science lessions; 5) physics lessons.
* Eighth grade in most countries; see Exhibit 1 for information about the grades tested in each country.( ) Standard errors appear in parentheses. Because results are rounded to the nearest whole number, some differences may appear inconsistent.Countries shown in italics did not satisfy one or more guidelines for sample participation rates, age/grade specifications, or classroom sampling procedures
(see Exhibit A.1). Because coverage falls below 65%, Latvia is annoted LSS for Latvian Speaking Schools only.An "r" indicates response data available for 70-84% of students.
60-60 0-30 30
52 (3.3) 42 (2.9) -10 (4.4)
39 (2.5) 29 (2.8) -9 (3.7)
41 (1.8) 34 (1.7) -8 (2.5)
50 (3.3) 46 (3.9) -4 (5.1)
30 (2.6) 26 (3.3) -4 (4.2)
25 (2.9) 21 (2.3) -4 (3.7)
75 (2.6) 72 (3.3) -3 (4.2)
36 (2.8) 34 (3.0) -2 (4.1)
58 (2.8) 57 (4.1) -2 (5.0)
67 (3.5) 67 (8.2) 0 (8.9)
55 (2.8) 55 (3.6) 0 (4.5)
38 (2.6) 39 (3.7) 1 (4.5)
46 (2.0) 47 (2.7) 1 (3.3)
44 (2.8) 47 (3.5) 3 (4.5)
89 (1.4) 94 (1.1) 4 (1.8)
56 (0.5) 61 (0.5) 5 (0.8)
32 (3.4) 37 (2.5) 5 (4.2)
63 (4.0) 68 (3.7) 5 (5.5)
48 (3.3) 53 (3.6) 5 (4.8)
88 (1.9) 94 (0.9) 6 (2.1)
57 (2.1) 63 (2.4) 6 (3.2)
65 (3.7) 72 (2.6) 7 (4.5)
40 (2.8) 47 (2.4) 7 (3.7)
59 (2.3) 66 (3.1) 7 (3.9)
72 (3.6) 80 (1.7) 8 (4.0)
82 (1.7) 90 (1.2) 8 (2.0)
55 (4.3) 64 (4.9) 9 (6.6)
62 (4.7) 72 (2.4) 10 (5.2)
77 (2.7) 89 (1.3) 12 (3.0)
31 (3.0) 44 (3.4) 13 (4.5)
70 (2.9) 84 (1.7) 14 (3.3)
72 (2.2) 88 (2.1) 16 (3.0)
66 (4.3) 86 (2.1) 20 (4.7)
74 (3.4) 94 (1.1) 20 (3.5)
41 (4.2) 66 (4.0) 26 (5.8) SOU
RCE:
IEA
Thi
rd In
tern
atio
nal M
athe
mat
ics
and
Scie
nce
Stud
y (T
IMSS
), 19
94-9
5.
Country
Lowest-AchievingThird ofSchools
Highest-AchievingThird ofSchools
DifferenceBetween
Highest andLowestSchools
Difference
Lowest-AchievingSchools
Highest-AchievingSchools
Lithuania
Iran, Islamic Rep.
Cyprus
Colombia
Austria
Spain
Romania
Hungary
Belgium (Fl)
Iceland
Germany
Belgium (Fr)
Slovak Republic
Slovenia
England
International Avg.
Korea
Norway
Czech Republic
Sweden
Russian Federation
Latvia (LSS)
Portugal
United States
Japan
Scotland
Ireland
Canada
Singapore
Switzerland
Australia
New Zealand
France
Hong Kong
Netherlands
Exhibit 1.34
r
r
r
Difference statistically significant
Difference not statistically significant
Significance tests adjusted for multiple comparisons
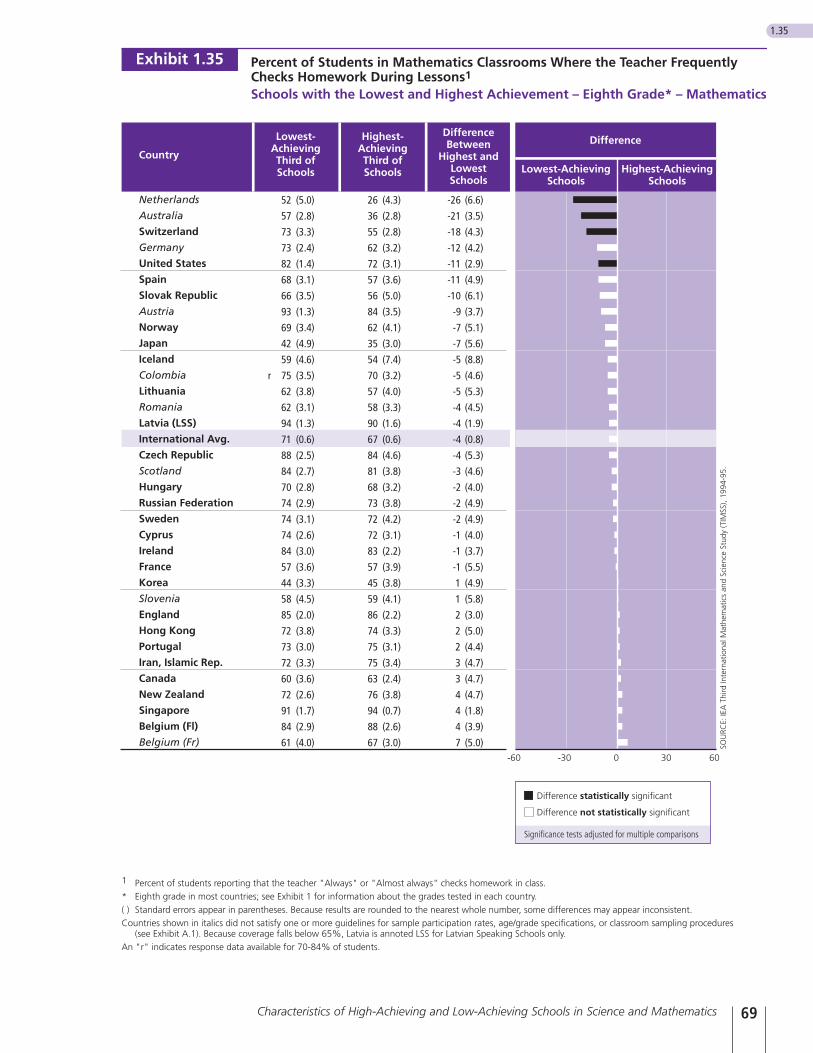
69Characteristics of High-Achieving and Low-Achieving Schools in Science and Mathematics
1.35
Percent of Students in Mathematics Classrooms Where the Teacher FrequentlyChecks Homework During Lessons1
Schools with the Lowest and Highest Achievement – Eighth Grade* – Mathematics
Exhibit 1.35
1 Percent of students reporting that the teacher "Always" or "Almost always" checks homework in class.* Eighth grade in most countries; see Exhibit 1 for information about the grades tested in each country.( ) Standard errors appear in parentheses. Because results are rounded to the nearest whole number, some differences may appear inconsistent.Countries shown in italics did not satisfy one or more guidelines for sample participation rates, age/grade specifications, or classroom sampling procedures
(see Exhibit A.1). Because coverage falls below 65%, Latvia is annoted LSS for Latvian Speaking Schools only.An "r" indicates response data available for 70-84% of students.
52 (5.0) 26 (4.3) -26 (6.6)
57 (2.8) 36 (2.8) -21 (3.5)
73 (3.3) 55 (2.8) -18 (4.3)
73 (2.4) 62 (3.2) -12 (4.2)
82 (1.4) 72 (3.1) -11 (2.9)
68 (3.1) 57 (3.6) -11 (4.9)
66 (3.5) 56 (5.0) -10 (6.1)
93 (1.3) 84 (3.5) -9 (3.7)
69 (3.4) 62 (4.1) -7 (5.1)
42 (4.9) 35 (3.0) -7 (5.6)
59 (4.6) 54 (7.4) -5 (8.8)
r 75 (3.5) 70 (3.2) -5 (4.6)
62 (3.8) 57 (4.0) -5 (5.3)
62 (3.1) 58 (3.3) -4 (4.5)
94 (1.3) 90 (1.6) -4 (1.9)
71 (0.6) 67 (0.6) -4 (0.8)
88 (2.5) 84 (4.6) -4 (5.3)
84 (2.7) 81 (3.8) -3 (4.6)
70 (2.8) 68 (3.2) -2 (4.0)
74 (2.9) 73 (3.8) -2 (4.9)
74 (3.1) 72 (4.2) -2 (4.9)
74 (2.6) 72 (3.1) -1 (4.0)
84 (3.0) 83 (2.2) -1 (3.7)
57 (3.6) 57 (3.9) -1 (5.5)
44 (3.3) 45 (3.8) 1 (4.9)
58 (4.5) 59 (4.1) 1 (5.8)
85 (2.0) 86 (2.2) 2 (3.0)
72 (3.8) 74 (3.3) 2 (5.0)
73 (3.0) 75 (3.1) 2 (4.4)
72 (3.3) 75 (3.4) 3 (4.7)
60 (3.6) 63 (2.4) 3 (4.7)
72 (2.6) 76 (3.8) 4 (4.7)
91 (1.7) 94 (0.7) 4 (1.8)
84 (2.9) 88 (2.6) 4 (3.9)
61 (4.0) 67 (3.0) 7 (5.0)
CountryHighest-Achieving
Schools
Difference
Lowest-AchievingSchools
Lowest-AchievingThird ofSchools
Highest-AchievingThird ofSchools
DifferenceBetween
Highest andLowestSchools
SOU
RCE:
IEA
Thi
rd In
tern
atio
nal M
athe
mat
ics
and
Scie
nce
Stud
y (T
IMSS
), 19
94-9
5.
60-60 0-30 30
Netherlands
Australia
Switzerland
Germany
United States
Spain
Slovak Republic
Austria
Norway
Japan
Iceland
Colombia
Lithuania
Romania
Latvia (LSS)
International Avg.
Czech Republic
Scotland
Hungary
Russian Federation
Sweden
Cyprus
Ireland
France
Korea
Slovenia
England
Hong Kong
Portugal
Iran, Islamic Rep.
Canada
New Zealand
Singapore
Belgium (Fl)
Belgium (Fr)
Difference statistically significant
Difference not statistically significant
Significance tests adjusted for multiple comparisons
Summary
The contrast between the highest- and lowest-achieving schools in science and mathematics in each country points to a number of factors that distinguish between the two groups of schools. Mostprominent of these, and most consistent across countries, were thehome background indicators of socioeconomic status and of parentalsupport for academic achievement. In almost all countries, studentsin the high-achieving schools had higher levels of book ownership,study aids, possessions in the home, and parental education, andspent less time working in the home. Another distinguishing factorrelated to the home was student aspirations for higher education. Inmost countries, plans to attend university after secondary school weremuch more frequently reported by students in the high-achievingschools. In this regard, the TIMSS results support earlier studies thatfound a close relationship between the composition of the studentbody and student achievement.
Unlike student background, factors more directly related to theschool were less uniformly effective in distinguishing between thehigh- and low-achieving schools. Although school size and location,school social climate, students’ attitude to science and mathematics,and instructional activities in science and mathematics class did dis-criminate between the high- and low-achieving schools in variouscountries, few school variables worked consistently across all coun-tries. This indicates that analyses of characteristics of effective schoolsare likely to involve different variables in different countries, orgroups of countries, rather than common variables that operate inthe same way across all countries.
The next chapter in this report provides a start to the examinationof characteristics of effective schools in the TIMSS data. For thecountries with large differences between the average achievementlevels of their schools, a series of analyses were conducted thatexplored the influence of a range of school, teacher, class, and student variables on student achievement in science and mathemat-ics, while controlling statistically for differences between schools instudent home background.
Chapter 170