Embed Size (px)
Citation preview
California State University, Sacramento (CSUS)
University of California, Davis (UCD)
California Department of Transportation (Caltrans)
Characteristics of Stormwater Runoff From Highway Construction Sites in California
Presented in: Transportation Research Record 1743, Paper No. 01-3181, National Academy Press
Authors:
Masoud Kayhanian, Caltrans/UCD Environmental Program Kevin Murphy, Caltrans/CSUS Storm Water Program Louis Regenmorter, Camp Dresser and McKee, Inc. Richard Haller, Camp Dresser and McKee, Inc.
Disclaimer:
This work reflects the author’s opinions and does not represent official policy or endorsement by the California Department of Transportation, the California State University, or the University of California.
Storm Water Program
CSUS Office of Water Programs 7801 Folsom Boulevard, Suite 102, Sacramento, CA 95826
Kayhanian et al. Page 1
CHARACTERISTICS OF STORMWATER RUNOFF FROM HIGHWAY CONSTRUCTION SITES IN CALIFORNIA
Masoud Kayhanian
Center for Environmental and Water Resources Engineering Department of Civil and Environmental Engineering
University of California Davis, CA 95616
Phone: (916)278-8112 FAX: (916)278-8140
e-mail: [email protected]
Kevin Murphy Office of Water Programs California State University Sacramento, CA 95826 Phone: (916)278-8105 FAX: (916)278-8140
e-mail: [email protected]
Louis Regenmorter and Richard Haller Camp Dresser and McKee, Inc.
2920 Inland Empire Boulevard, Suite 108 Ontario, CA 91764
Phone: (909)945-3000 FAX: (909)945-1333
e-mail: [email protected], [email protected]
Paper No. 01-3447
ABSTRACT
Fifteen highway construction sites were monitored by the California Department of Transportation
(Caltrans) to help assess the water quality of stormwater runoff exiting from the sites. This study was
conducted by Caltrans to generate sufficient water quality data to further develop management strategies
and evaluate existing best management practices (BMPs). A wide range of construction sites were
selected for monitoring throughout the State. Both flow-paced composite and single grab samples were
collected and analyzed at these sites for a total of 72 station-storm events during the 1998/99 and
1999/00 wet seasons. Results obtained during the two-year characterization study indicate that:
• Caltrans’ construction site runoff constituent concentrations detected during this study are less than typical Caltrans’ and Non-Caltrans’ highway runoff constituent concentrations with the exception of total chromium, total nickel, total phosphorus, TSS, and turbidity.
• The concentrations of TSS and turbidity are likely due to the disturbed soils present at most construction sites.
• The origin of the high concentrations of total chromium, total nickel, and total phosphorus concentrations is unknown. Concentrations of these constituents varied between sites so it is
Kayhanian et al. Page 2
possible site-specific soils and vegetative conditions may have contributed to the concentrations of these constituents.
• A correlation (R2 values greater than 0.5) was observed between TSS runoff concentrations and particulate runoff concentrations of chromium, copper, and zinc, indicating that minimizing particulate matter may reduce total metals concentrations.
INTRODUCTION
Construction is performed yearly at hundreds of Caltrans’ highway and freeway sites. Because
construction site activities differ significantly from typical highway/freeway activities, the storm water runoff
water quality characteristics are expected to differ as well.
A two-year (1998-99 and 1999-00) monitoring study was performed to evaluate the quality of
storm water runoff from a variety of Caltrans’ highway construction projects. The characterization data is
being used to estimate constituent loadings to receiving waters, and to help establish a baseline for
construction site water quality and mass loading data. Data obtained was also compared to highway
runoff data and general urban runoff data.
Stringent criteria were used to select these highway construction sites to ensure that a wide
range of Caltrans’ construction activities were represented. During the 1998-99 wet season nine sites
were monitored. Six sites were monitoring during the 1999-00 wet season. A total of 72 station-storm
events were monitored for the two-year period. Figure 1 presents the locations of the 15 construction
sites and Table 1 summarizes the physical characteristics of these sites. The main focus of this paper is
to present the storm water runoff characteristics that were obtained from the California highway
construction sites during the 1998-99 and 1999-00 wet seasons.
METHODOLOGY Site Selection Process
The following criteria were used to select the 15 construction sites that were monitored during the
1998-99 and 1999-00 wet seasons:
• The sites should represent a wide range of typical Caltrans construction projects (see Table 1 for the types of construction projects monitored);
• The sites should represent a wide range of geographic areas (see Figure 1);
• The sites should represent a wide range of hydrometeorologic conditions;
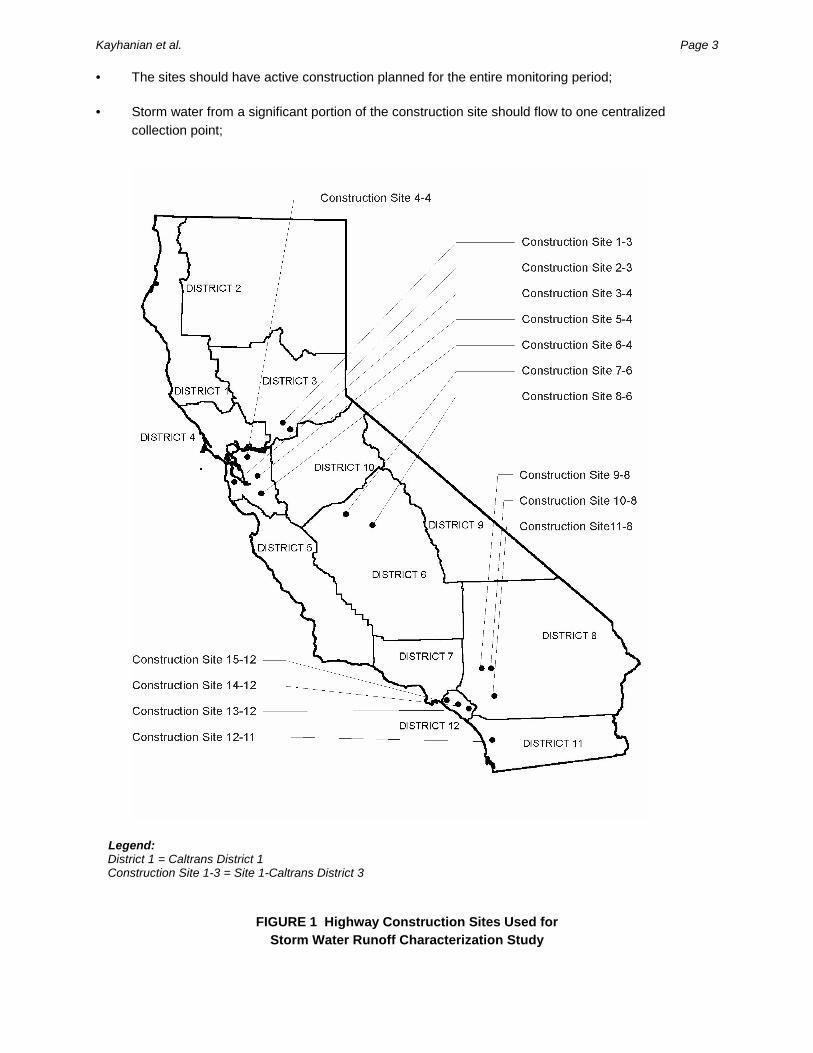
Kayhanian et al. Page 3
• The sites should have active construction planned for the entire monitoring period;
• Storm water from a significant portion of the construction site should flow to one centralized collection point;
Legend: District 1 = Caltrans District 1 Construction Site 1-3 = Site 1-Caltrans District 3
FIGURE 1 Highway Construction Sites Used for Storm Water Runoff Characterization Study
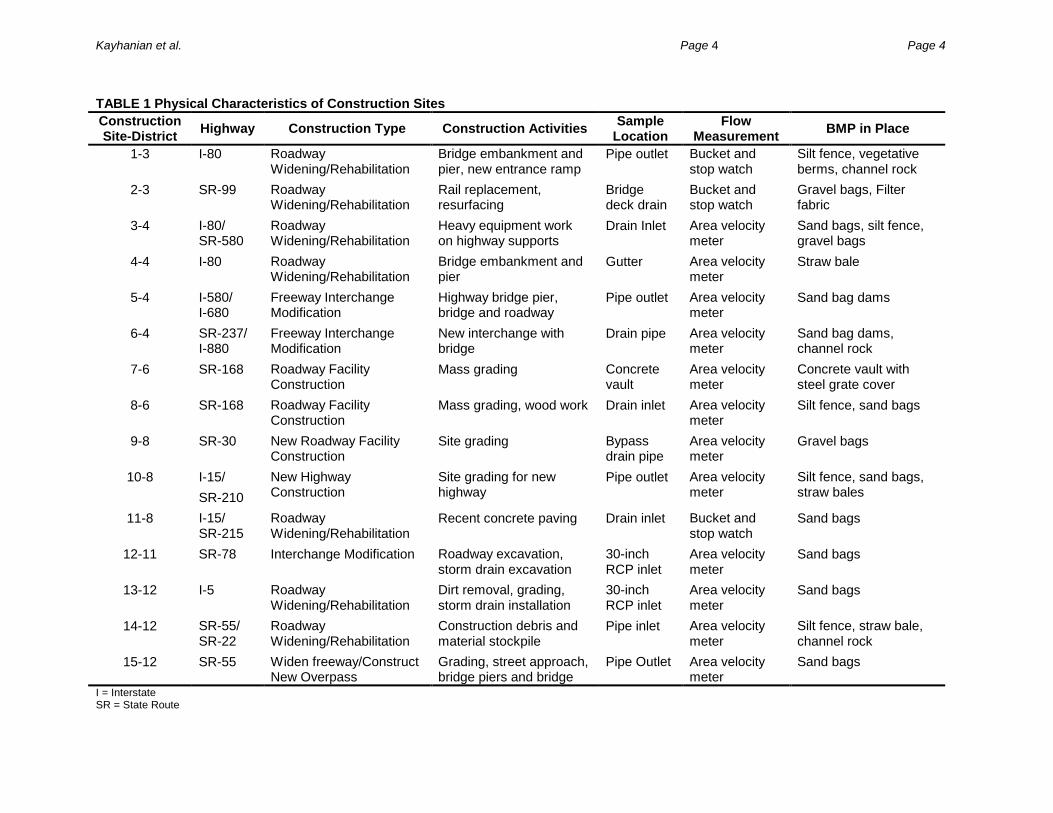
Kayhanian et al. Page 4 Page 4
TABLE 1 Physical Characteristics of Construction Sites Construction Site-District Highway Construction Type Construction Activities Sample
Location Flow
Measurement BMP in Place
1-3 I-80 Roadway Widening/Rehabilitation
Bridge embankment and pier, new entrance ramp
Pipe outlet Bucket and stop watch
Silt fence, vegetative berms, channel rock
2-3 SR-99 Roadway Widening/Rehabilitation
Rail replacement, resurfacing
Bridge deck drain
Bucket and stop watch
Gravel bags, Filter fabric
3-4 I-80/ SR-580
Roadway Widening/Rehabilitation
Heavy equipment work on highway supports
Drain Inlet Area velocity meter
Sand bags, silt fence, gravel bags
4-4 I-80 Roadway Widening/Rehabilitation
Bridge embankment and pier
Gutter Area velocity meter
Straw bale
5-4 I-580/ I-680
Freeway Interchange Modification
Highway bridge pier, bridge and roadway
Pipe outlet Area velocity meter
Sand bag dams
6-4 SR-237/ I-880
Freeway Interchange Modification
New interchange with bridge
Drain pipe Area velocity meter
Sand bag dams, channel rock
7-6 SR-168 Roadway Facility Construction
Mass grading Concrete vault
Area velocity meter
Concrete vault with steel grate cover
8-6 SR-168 Roadway Facility Construction
Mass grading, wood work Drain inlet Area velocity meter
Silt fence, sand bags
9-8 SR-30 New Roadway Facility Construction
Site grading Bypass drain pipe
Area velocity meter
Gravel bags
10-8 I-15/ SR-210
New Highway Construction
Site grading for new highway
Pipe outlet Area velocity meter
Silt fence, sand bags, straw bales
11-8 I-15/ SR-215
Roadway Widening/Rehabilitation
Recent concrete paving Drain inlet Bucket and stop watch
Sand bags
12-11 SR-78 Interchange Modification Roadway excavation, storm drain excavation
30-inch RCP inlet
Area velocity meter
Sand bags
13-12 I-5 Roadway Widening/Rehabilitation
Dirt removal, grading, storm drain installation
30-inch RCP inlet
Area velocity meter
Sand bags
14-12 SR-55/ SR-22
Roadway Widening/Rehabilitation
Construction debris and material stockpile
Pipe inlet Area velocity meter
Silt fence, straw bale, channel rock
15-12 SR-55 Widen freeway/Construct New Overpass
Grading, street approach, bridge piers and bridge
Pipe Outlet Area velocity meter
Sand bags
I = Interstate SR = State Route
Kayhanian et al. Page 5
(a)
• There should be no possibility of co-mingling construction site runoff with runoff from offsite or non-construction areas;
• The collection points should be located downstream of any BMPs commonly used at the sites.
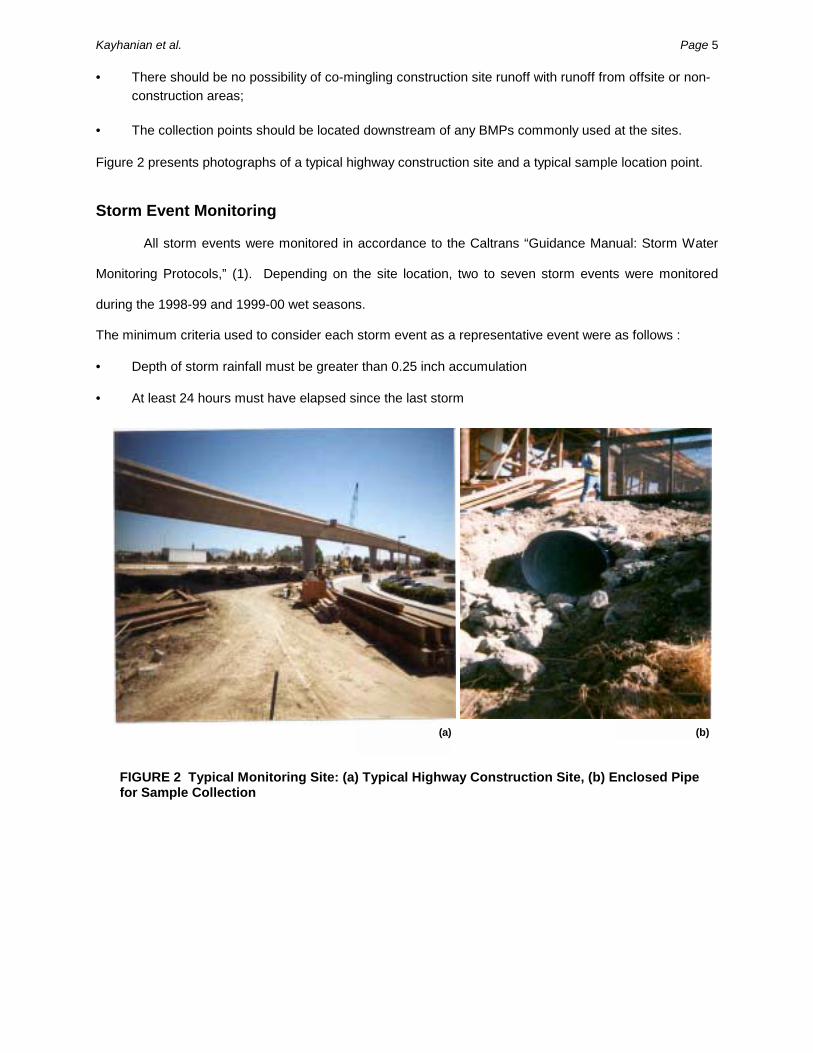
Figure 2 presents photographs of a typical highway construction site and a typical sample location point.
Storm Event Monitoring
All storm events were monitored in accordance to the Caltrans “Guidance Manual: Storm Water
Monitoring Protocols,” (1). Depending on the site location, two to seven storm events were monitored
during the 1998-99 and 1999-00 wet seasons.
The minimum criteria used to consider each storm event as a representative event were as follows :
• Depth of storm rainfall must be greater than 0.25 inch accumulation
• At least 24 hours must have elapsed since the last storm
FIGURE 2 Typical Monitoring Site: (a) Typical Highway Construction Site, (b) Enclosed Pipe for Sample Collection
(b)
Kayhanian et al. Page 6
Sample Collection
Flow-paced composite samples were collected for all constituents except for coliform and oil &
grease, which were collected as single grab samples. For storm events that lasted 8 hours or more, a
composite sample was prepared from a series of aliquot samples collected every 20 minutes for up to 8
hours. If the storm lasted less than 8 hours in duration, aliquot samples were collected every 20 minutes
until the end of storm water runoff. Manual sample collection was performed at all sites and portable
flow/velocity meters and rain gages were used to continuously measure flow rate and rainfall volume.
Composite samples were prepared on a flow proportional basis with the amount taken from each aliquot
calculated from the flow volume that occurred during each sampling interval and the percentage of total
flow volume during the storm event.
Grab samples were collected when the flow rate was typical of full site flow (when the entire
drainage area is contributing flow). Grab samples were not intended to represent first-flush conditions or
peak flow conditions.
Constituents and Analytical Methods
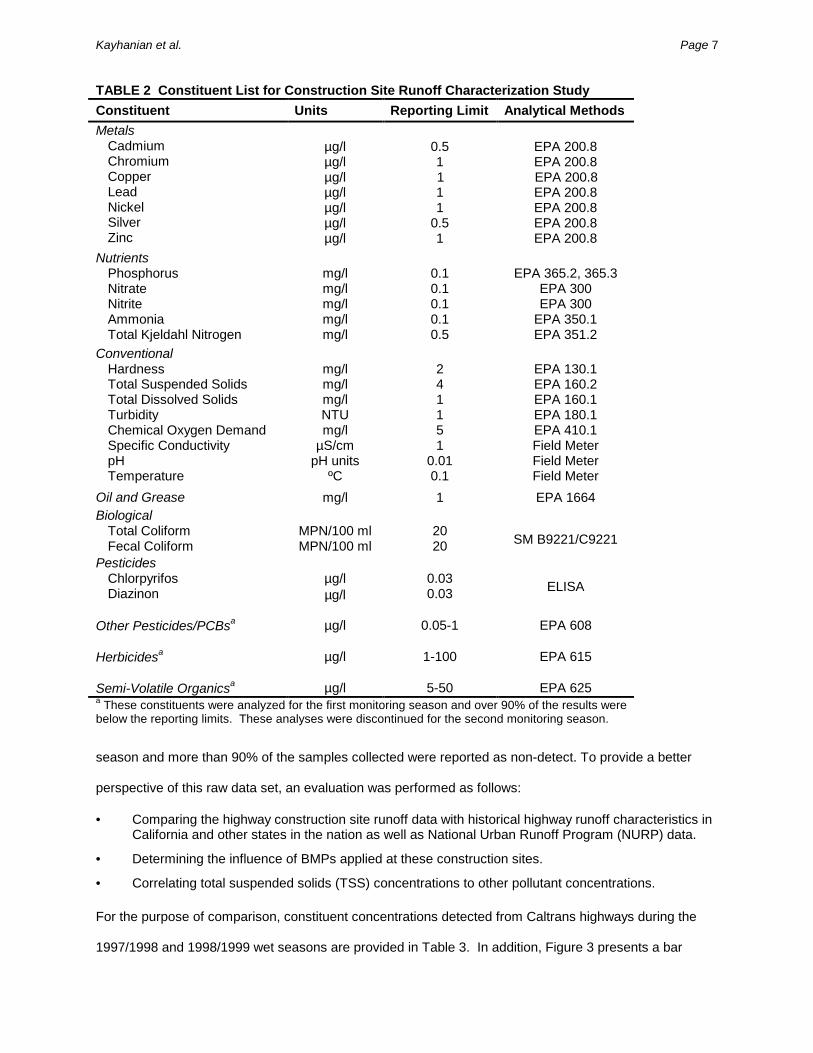
The constituents, the analytical methods and reporting limits used for this study are presented in Table 2.
As shown, the analyzed constituents were organized in six major groups: (i) metals (total and dissolved),
(ii) nutrients, (iii) conventional, (iv) oil & grease, (v) biological, and (vi) pesticides. All laboratory analyses
were conducted in accordance to Standard Methods and the USEPA analytical methods.
Standard lab QA/QC procedures were performed in accordance with the sampling and analysis
plan (2, 3). Analytical results were qualified as necessary based on the results of the QA/QC evaluations.
RESULTS AND DISCUSSION
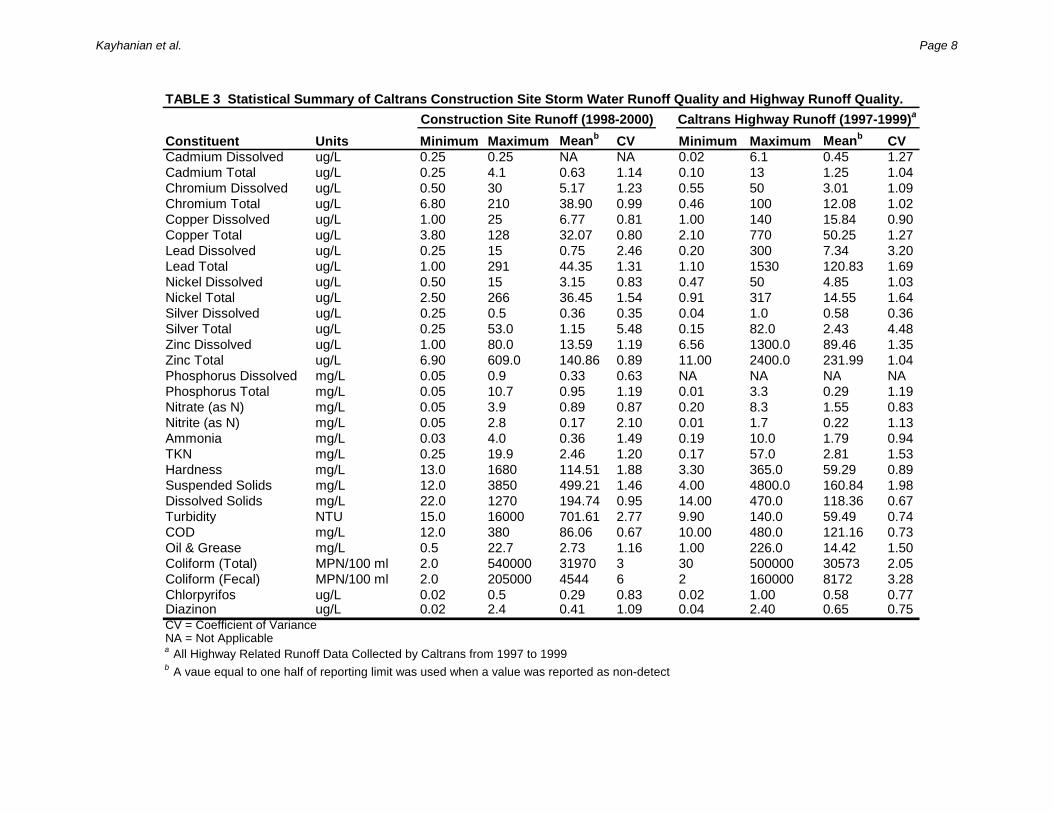
Results of the California highway construction site stormwater runoff characterization study
conducted during the 1998-99 and 1999-00 monitoring seasons are summarized in Table 3. As shown, a
simple statistical analysis was used to determine the range of values, mean, and coefficient of variance
(CV). In addition to the data presented in Table 3, herbicides, pesticides (other than diazinon and
chloropyrifos), and semi-volatile organic compounds were analyzed during the 1998/1999 monitoring
Kayhanian et al. Page 7
TABLE 2 Constituent List for Construction Site Runoff Characterization Study Constituent Units Reporting Limit Analytical Methods
µg/l 0.5 EPA 200.8 µg/l 1 EPA 200.8 µg/l 1 EPA 200.8 µg/l 1 EPA 200.8 µg/l 1 EPA 200.8 µg/l 0.5 EPA 200.8
Metals Cadmium Chromium Copper Lead Nickel Silver Zinc µg/l 1 EPA 200.8
mg/l 0.1 EPA 365.2, 365.3 mg/l 0.1 EPA 300 mg/l 0.1 EPA 300 mg/l 0.1 EPA 350.1
Nutrients Phosphorus Nitrate Nitrite Ammonia Total Kjeldahl Nitrogen mg/l 0.5 EPA 351.2
mg/l 2 EPA 130.1 mg/l 4 EPA 160.2 mg/l 1 EPA 160.1 NTU 1 EPA 180.1 mg/l 5 EPA 410.1
µS/cm 1 Field Meter pH units 0.01 Field Meter
Conventional Hardness Total Suspended Solids Total Dissolved Solids Turbidity Chemical Oxygen Demand Specific Conductivity pH Temperature ºC 0.1 Field Meter
Oil and Grease mg/l 1 EPA 1664 Biological
Total Coliform Fecal Coliform
MPN/100 ml MPN/100 ml
20 20 SM B9221/C9221
Pesticides Chlorpyrifos Diazinon
µg/l µg/l
0.03 0.03 ELISA
Other Pesticides/PCBsa µg/l 0.05-1 EPA 608
Herbicidesa µg/l 1-100 EPA 615
Semi-Volatile Organicsa µg/l 5-50 EPA 625 a These constituents were analyzed for the first monitoring season and over 90% of the results were below the reporting limits. These analyses were discontinued for the second monitoring season.
season and more than 90% of the samples collected were reported as non-detect. To provide a better
perspective of this raw data set, an evaluation was performed as follows:
• Comparing the highway construction site runoff data with historical highway runoff characteristics in California and other states in the nation as well as National Urban Runoff Program (NURP) data.
• Determining the influence of BMPs applied at these construction sites.
• Correlating total suspended solids (TSS) concentrations to other pollutant concentrations. For the purpose of comparison, constituent concentrations detected from Caltrans highways during the
1997/1998 and 1998/1999 wet seasons are provided in Table 3. In addition, Figure 3 presents a bar
Kayhanian et al. Page 8
TABLE 3 Statistical Summary of Caltrans Construction Site Storm Water Runoff Quality and Highway Runoff Quality.
Constituent Units Minimum Maximum Meanb CV Minimum Maximum Meanb CVCadmium Dissolved ug/L 0.25 0.25 NA NA 0.02 6.1 0.45 1.27Cadmium Total ug/L 0.25 4.1 0.63 1.14 0.10 13 1.25 1.04Chromium Dissolved ug/L 0.50 30 5.17 1.23 0.55 50 3.01 1.09Chromium Total ug/L 6.80 210 38.90 0.99 0.46 100 12.08 1.02Copper Dissolved ug/L 1.00 25 6.77 0.81 1.00 140 15.84 0.90Copper Total ug/L 3.80 128 32.07 0.80 2.10 770 50.25 1.27Lead Dissolved ug/L 0.25 15 0.75 2.46 0.20 300 7.34 3.20Lead Total ug/L 1.00 291 44.35 1.31 1.10 1530 120.83 1.69Nickel Dissolved ug/L 0.50 15 3.15 0.83 0.47 50 4.85 1.03Nickel Total ug/L 2.50 266 36.45 1.54 0.91 317 14.55 1.64Silver Dissolved ug/L 0.25 0.5 0.36 0.35 0.04 1.0 0.58 0.36Silver Total ug/L 0.25 53.0 1.15 5.48 0.15 82.0 2.43 4.48Zinc Dissolved ug/L 1.00 80.0 13.59 1.19 6.56 1300.0 89.46 1.35Zinc Total ug/L 6.90 609.0 140.86 0.89 11.00 2400.0 231.99 1.04Phosphorus Dissolved mg/L 0.05 0.9 0.33 0.63 NA NA NA NAPhosphorus Total mg/L 0.05 10.7 0.95 1.19 0.01 3.3 0.29 1.19Nitrate (as N) mg/L 0.05 3.9 0.89 0.87 0.20 8.3 1.55 0.83Nitrite (as N) mg/L 0.05 2.8 0.17 2.10 0.01 1.7 0.22 1.13Ammonia mg/L 0.03 4.0 0.36 1.49 0.19 10.0 1.79 0.94TKN mg/L 0.25 19.9 2.46 1.20 0.17 57.0 2.81 1.53Hardness mg/L 13.0 1680 114.51 1.88 3.30 365.0 59.29 0.89Suspended Solids mg/L 12.0 3850 499.21 1.46 4.00 4800.0 160.84 1.98Dissolved Solids mg/L 22.0 1270 194.74 0.95 14.00 470.0 118.36 0.67Turbidity NTU 15.0 16000 701.61 2.77 9.90 140.0 59.49 0.74COD mg/L 12.0 380 86.06 0.67 10.00 480.0 121.16 0.73Oil & Grease mg/L 0.5 22.7 2.73 1.16 1.00 226.0 14.42 1.50Coliform (Total) MPN/100 ml 2.0 540000 31970 3 30 500000 30573 2.05Coliform (Fecal) MPN/100 ml 2.0 205000 4544 6 2 160000 8172 3.28Chlorpyrifos ug/L 0.02 0.5 0.29 0.83 0.02 1.00 0.58 0.77Diazinon ug/L 0.02 2.4 0.41 1.09 0.04 2.40 0.65 0.75CV = Coefficient of VarianceNA = Not Applicablea All Highway Related Runoff Data Collected by Caltrans from 1997 to 1999b A vaue equal to one half of reporting limit was used when a value was reported as non-detect
Construction Site Runoff (1998-2000) Caltrans Highway Runoff (1997-1999)a
Kayhanian et al. Page 9
graph comparison of the construction site data to data available from other highway or urban runoff
characterization studies (4, 5, 6, 7, 8). As shown in Table 3 and Figure 3, Caltrans’ construction site
runoff constituent concentrations are generally less than Caltrans’ and Non-Caltrans’ highway runoff
constituent concentrations with the exception of total chromium, total nickel, total phosphorus, TSS, and
turbidity. The generally higher highway runoff constituent concentrations are assumed to be due to
typical highway activities (average daily traffic > 60,000) that are more likely to contribute pollutants than
construction activities. Likewise, the higher concentrations of TSS and turbidity are likely due to the
disturbed soils present at construction sites. The origin of the total chromium, total nickel, and total
phosphorus concentrations is unknown. Concentrations of these constituents varied between sites so it
is possible that site-specific soils and vegetative conditions may have contributed to the higher
concentrations of these naturally occurring constituents.
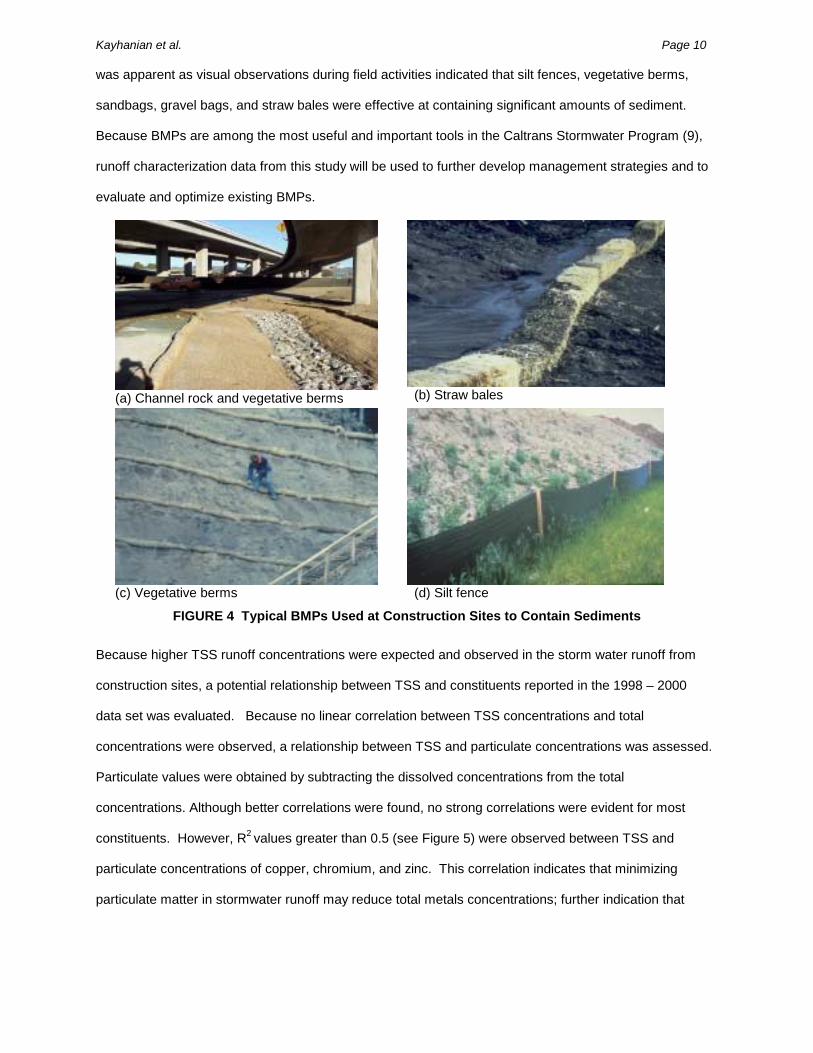
Types of best management practices (BMPs) used at each of the construction sites monitored
during this study are presented in Table 1. Photos of the typical types of BMPs used at the construction
sites are presented in Figure 4. The main purpose of these BMPs is to minimize the amount of sediment
being discharged from the sites. As expected, the TSS concentrations detected in the construction site
runoff indicate that the BMPs did not contain all of the sediment. However, the importance of these BMPs
FIGURE 3 Comparison of Construction Site and Highway Storm Water Runoff Concentration for Selected Constituents
0
100
200
300
400
500
600
COD (mg/L) TSS (mg/L) Cu (Total,ug/L)
Pb (Total,ug/L)
Ni (Total,ug/L)
Zn (Total,ug/L)
Highway Construction Runoff (Current Study)Highway Runoff (Barrett et al., 1995; Texas)Highway Runoff (Wu et al., 1998; Nort Carolina)Highway Runoff (Driscoll et al., 1990; FHWA)Highway Runoff (Caltrans, 1997-99)Urban Runoff (USEPA NURP Study, 1983)
Aver
age
Con
cent
ratio
n
Kayhanian et al. Page 10
was apparent as visual observations during field activities indicated that silt fences, vegetative berms,
sandbags, gravel bags, and straw bales were effective at containing significant amounts of sediment.
Because BMPs are among the most useful and important tools in the Caltrans Stormwater Program (9),
runoff characterization data from this study will be used to further develop management strategies and to
evaluate and optimize existing BMPs.
(a) Channel rock and vegetative berms (b) Straw bales
(c) Vegetative berms (d) Silt fence
FIGURE 4 Typical BMPs Used at Construction Sites to Contain Sediments
Because higher TSS runoff concentrations were expected and observed in the storm water runoff from
construction sites, a potential relationship between TSS and constituents reported in the 1998 – 2000
data set was evaluated. Because no linear correlation between TSS concentrations and total
concentrations were observed, a relationship between TSS and particulate concentrations was assessed.
Particulate values were obtained by subtracting the dissolved concentrations from the total
concentrations. Although better correlations were found, no strong correlations were evident for most
constituents. However, R2 values greater than 0.5 (see Figure 5) were observed between TSS and
particulate concentrations of copper, chromium, and zinc. This correlation indicates that minimizing
particulate matter in stormwater runoff may reduce total metals concentrations; further indication that
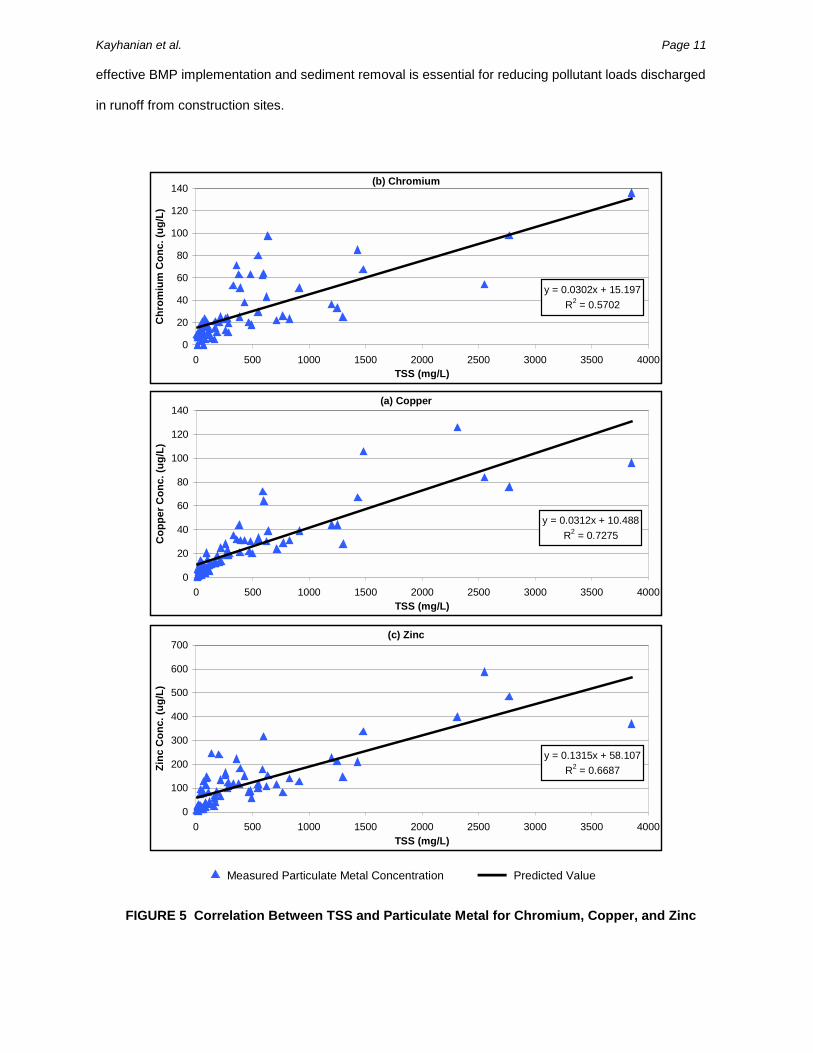
Kayhanian et al. Page 11
effective BMP implementation and sediment removal is essential for reducing pollutant loads discharged
in runoff from construction sites.
FIGURE 5 Correlation Between TSS and Particulate Metal for Chromium, Copper, and Zinc
Measured Particulate Metal Concentration Predicited Value
Measured Particulate Metal Concentration Predicted Value
(a) Copper
y = 0.0312x + 10.488R2 = 0.7275
0
20
40
60
80
100
120
140
0 500 1000 1500 2000 2500 3000 3500 4000TSS (mg/L)
Cop
per C
onc.
(ug/
L)
(b) Chromium
y = 0.0302x + 15.197R2 = 0.5702
0
20
40
60
80
100
120
140
0 500 1000 1500 2000 2500 3000 3500 4000TSS (mg/L)
Chr
omiu
m C
onc.
(ug/
L)
(c) Zinc
y = 0.1315x + 58.107R2 = 0.6687
0
100
200
300
400
500
600
700
0 500 1000 1500 2000 2500 3000 3500 4000TSS (mg/L)
Zinc
Con
c. (u
g/L)
Kayhanian et al. Page 12
CONCLUSIONS The following conclusions are based on the two years of construction site runoff water quality monitoring data discussed above:
• Caltrans’ construction site runoff constituent concentrations detected during this study are less than typical Caltrans’ and Non-Caltrans’ highway runoff constituent concentrations with the exception of total chromium, total nickel, total phosphorus, TSS, and turbidity.
• The higher concentrations of TSS and turbidity are likely due to the disturbed soils that construction site runoff is exposed to before exiting the site.
• The origin of the total chromium, total nickel, and total phosphorus concentrations is unknown. Concentrations of these constituents varied between sites so it is possible that site-specific soils and vegetative conditions may have contributed to the constituent concentrations.
• A correlation (R2 values greater than 0.5) was observed between TSS runoff concentrations and particulate runoff concentrations of chromium, copper, and zinc, indicating that minimizing particulate matter may reduce total metals concentrations.
• The correlation between TSS concentrations and constituent concentrations may be useful when further developing best management practices.
ACKNOWLEDGMENTS The authors greatly acknowledge all monitoring team members who participated in this study. First year monitoring was conducted by the Montgomery Watson/Chaudary/LAW Crandall/Kleinfelder team. The CDM/AEI CASC/TRS team conducted the second year study. The Caltrans Environmental Engineering, Stormwater Management Program under contract 43A0002A, provided funding for this project. The authors also acknowledge the assistance of Mr. David Alderete, Mr. Amardeep Singh, and Mr. Scott Meyer for the preparation of this article.
REFERENCES
1. Caltrans Environmental Program. Guidance Manual: Stormwater Monitoring Protocols. prepared by Larry walker Associates, Davis, CA, and Woodward-Clyde Consultants, Oakland, CA, 1997.
2. Caltrans Environmental Program. Sampling and Analysis Plan for Construction Site Storm Water Runoff Characterization Study. Report CTSW-RT-99-91-01, December, 1998.
3. Caltrans Environmental Program. Sampling and Analysis Plan for Construction Site Storm Water Runoff Characterization Study. Report CTSW-RT-98-069, December, 1999.
4. Driscoll, E. D., Shelly, P. E., and Strecker, E. W. Pollutant Loading and Impacts from Highway Stormwater Runoff. Vol. I: Design Procedure. Tech. Rep. FHWA/RD-88-007. Prepared for the Fed. Hwy. Admin., Washington, D.C., 1990.
5. Kayhanian, M. and S. Borroum. Characterization of the Highway Stormwater Runoff in California, 72nd Annual Conference, California Water Environment Association, Sacramento, CA, 2000, Section B.
6. Barrett, M. E., Irish, L. B., Malina, J. F. and Charbeneau, R. J. Characterization of Highway Runoff in Austin, Texas, Area. J. Envir. Engrg., ASCE, Vol. 124, No. 2, 1998, 131-137.
7. Wu, S. J., C. J. Allan, W. L. Saunders, and J. B. Evett. Characterization and Pollutant Loading Estimation for Highway Runoff. J. Envir. Engrg., ASCE, Vol 124, No. 7, 584-592, 1993.
8. USEPA. Results of the Nationwide Urban Runoff Program. National Technical Information Service (NTIS), Publication No. PB84-185552, December, 1983.
9. Borroum, S. and M. McCoy. The California Experience, Caltrans’s Storm Water Plan. Civil Engineering, July 2000.