Embed Size (px)
Citation preview
Nat. Hazards Earth Syst. Sci., 9, 947–956, 2009www.nat-hazards-earth-syst-sci.net/9/947/2009/© Author(s) 2009. This work is distributed underthe Creative Commons Attribution 3.0 License.
Natural Hazardsand Earth
System Sciences
Characteristics of the extreme rainfall event and consequent flashfloods in W Slovenia in September 2007
S. Rusjan1, M. Kobold2, and M. Miko s1
1Faculty of Civil and Geodetic Engineering, University of Ljubljana, Ljubljana, Slovenia2Environmental Agency of the Republic of Slovenia, Ministry of the Environment and Spatial Planning, Ljubljana, Slovenia
Received: 23 December 2008 – Revised: 11 May 2009 – Accepted: 8 June 2009 – Published: 23 June 2009
Abstract. During a weather front that passed over large partsof Slovenia on 18.9.2007, extreme rainfall events were trig-gered causing several severe flash floods with six casualties.Out of 210 municipalities in Slovenia, 60 were reportingflood damages, and the total economic flood damage waslater estimated at close to 200 million Euro; highest dam-age was claimed byZelezniki municipality in NW Slove-nia. The main purpose of the study presented in this paperwas to put together available meteorological and hydrologi-cal data in order to get better insight into temporal and spa-tial dynamics and variability of the flash flood event alongthe Selska Sora River flowing through the town ofZelezniki.The weather forecast by the Environmental Agency of theRepublic of Slovenia (ARSO) lead to early warning of flood-ings but has underestimated rainfall amounts by a factor of2. Also meteorological radar underestimated ground rainfallas much as by 50%. During that day, in many rainfall gaug-ing stations operated by ARSO in the area under investiga-tion, extreme rainfall amounts were measured, e.g. 303 mmin 24 h or 157 mm in 2 h. Some of the measured rainfallamounts were the highest registered amounts in Slovenia sofar. Statistical analysis using Gumble distribution was per-formed and rainfall return periods were estimated. When as-sessing rainfall return periods, a question of the sampling er-ror as a consequence of short rainfall records used was raised.Furthermore, measured rainfall data were used to reconstructhydrographs on selected water stations along the Selska SoraRiver. The cumulative areal precipitation for the Selska SoraRiver catchment upstream ofZelezniki amounted to 219 mm,while the modeled effective precipitation used to simulate thehydrograph peak was only 57 mm. The modeled direct runoffcoefficient therefore amounts to 0.26. Surprisingly low valueis mainly caused by the applied unit hydrograph method that
Correspondence to:M. Mikos([email protected])
seeks to meet the peak discharge rather than hydrograph vol-ume. However, the spatial distribution of the rainfall in thearea was highly variable and present spatial positioning ofrain gauges is obviously inadequate for proper representationof the actual spatial amount of rainfall. The study confirmedthat post-flood investigation should focus on discharges andhydrological response of the catchment rather than simplyanalyzing statistical characteristics of rainfall.
1 Introduction
Post-event analyses of extreme rainfall events are gaining im-portance in the last years trying to incorporate systemizationand standardization into the post-event surveys and investi-gations (Gaume and Borga, 2008). Information about thestatistical characteristics of the event as a part of such post-event surveys in combination with available field data pro-vides fundamental basis for designing, implementation andoperation of measures and instruments for effective and sus-tainable flood risk reduction. The evaluation of extreme floodevents is therefore an important basis for learning processesduring ex-post evaluation of interventions in support of fu-ture development of strategies and strategic options in floodrisk management (Norbiato et al., 2007). Flash floods shouldbe considered as a special case due to their characteristics;they are localized phenomena that occur in basins of fewhundred square kilometers or less, with response times ofa few hours or less (Borga et al., 2007). Owing to usualscarcity of field data for the description of the flash floodevents, rainfall frequency estimates are often used to describethe characteristics of a flash flood event. In these cases, thereturn period of the greatest point rainfall intensity withinthe storm is taken as the return period of the storm (Ramoset al., 2005). However, return periods defined in this man-ner can be very subjective and questionable as the rainfallintensity within the event can vary greatly depending on the
Published by Copernicus Publications on behalf of the European Geosciences Union.
948 S. Rusjan et al.: Characteristics of the flash floods in W Slovenia in September 2007
selection of the rainfall duration. Additional problem is thelack of reliable rain gauge coverage which frustrates the haz-ard characterization of flash flood generating storms devel-oping at space and time scales that conventional rain obser-vation system are not able to monitor (Creutin and Borga,2003). On the other hand, in the case of the flash flood events,focus is on discharges rather than rainfall rates; to evaluate aflash flood return period discharge estimates are frequentlyconsidered (e.g. Costa and Jarrett, 2008; Gaume and Borga,2008). A literature review of post-event studies can be foundin Gaume et al. (2004).
Real-time observations, combined with hydro-meteorological models, allow increasingly accurate andtimely forecasts and warnings. Meteorological features,such as precipitation intensity, distribution and amounts, aswell as hydrologic responses to these variables, are beingincorporated into models aimed at improving understandingof rainfall-runoff relationships, upon which forecasts andwarnings are based (Rochette and Moore, 1996; Schwein,1996; Montz, 2001). The more we understand these fac-tors, particularly the relationships between them in smallwatersheds, the greater the improvements in forecasts andwarnings will be. However, the straightforward descriptionof the situation is usually masked by characteristics of themeteorological and hydrological systems generating flashflood conditions. As Kelsch et al. (2001) pointed out, highintensity rainfall is more important than the total accumu-lation on small, fast-response basins. This is observed inflash floods in arid and semiarid situations (and also inurban environments). However, its generality is questionablein more humid hydroclimatic environments such as in WSlovenia (see Borga, 2007; Gaume, 2004; Delrieu et al.,2005). Basin characteristics are easily as important as therainfall characteristics for determining the nature of therunoff. In addition, the conditions creating flash floodsdiffer, even at the same location (Ogden et al., 2000). Thus,rainfall timing as well as intensity can be critical, and workmust continue towards understanding general relationshipsfrom studying specific events (Baldini et al., 1995).
Almost every year local heavy rain showers and flashfloods appear in different parts of Slovenia. Flash floodsin September 2007 caused, besides high material damage of210 million Euro, loss of six human lives. The meteorologi-cal forecast predicted precipitation for Tuesday, 18 Septem-ber, but not in the quantity and intensity as it happened.Although intense storms and resulting flash floods are notsomething new in the region considered, the knowledge oftheir physical characteristics is still very limited. Theirreduced spatial extension is often captured incorrectly byconventional observation including rain and river observa-tion networks. Moreover, similarly as discussed by Ruin etal. (2008), the reliability of the data and the integrity of themeasurement devices are often vigorously affected by highstorm intensity, which reflects on both, rainfall and dischargemeasurement accuracy.
In a climatic sense, Slovenia presents a transitional areabetween different climatic types. Alpine climatic character-istics can be found in the NW part, sub-Mediterranean cli-mate is characteristic for the SW part whereas towards theeast, the continental climatic characteristics start to prevail.The variability of climatic characteristics at relatively shortdistances can be associated especially to distinctively hightopographic variability which influences the occurrence ofheavy rainfall events. Some parallels can be drawn to theseasonal distribution of heavy rains for the Mediterraneanwhich exhibits a maximum in the late summer and duringautumn. Doswell et al. (1998) explains that this distributionis strongly determined by (1) the Mediterranean area that es-pecially in autumn is warm and wet in the lowest 2000 m,leading to convective instability, and (2) the passage of large-scale disturbances that induce vertical lifting and strong hor-izontal moisture advection that is necessary to continuouslyfeed the precipitation systems.
However, the quantitative prediction of heavy rain periodsremains a major challenge for forecasters and research me-teorologists (Fritsch et al., 1998). Maddox et al. (1979) andChappell (1986) analyzed the formation of numerous quasi-stationary convective systems in the US that produced flashflooding in terms of upper and low-level disturbances andrain generation mechanisms. As we will discuss later morein detail, in the case of Slovenia, due to high spatial topo-graphic heterogeneity, the quantification of heavy rainfallsbecomes even more challenging task.
This paper presents a description of meteorological con-ditions which led to catastrophic hydrological situation andraging power of the nature, as experienced in the large partof Slovenia in September 2007. The worst flood situationwas observed in the catchment of the Selska Sora River, andespecially in the town ofZelezniki that is discussed more indetail (Fig. 1). This area was hit by 4 floods in the last twodecades (1990, 1995, 1998, 2007) (Robic, 2008).
The main aim of the study performed was to put togetheravailable meteorological and hydrological data in order to getbetter insight into temporal and spatial dynamics and vari-ability of this flash flood event. The paper is structured asfollows: Sect. 2 is an overview of the hydrometeorologicalsituation and data assemblage: a synoptic situation, weatherforecast and rainfall estimation are given followed by a de-scription of the hydrological situation and discharge data.Section 3 brings results and discussion stressing: statisticalanalysis of the rainfall event, hydrological situation and con-sequences of the flash flood event. Section 4 completes thepaper with conclusions.
Nat. Hazards Earth Syst. Sci., 9, 947–956, 2009 www.nat-hazards-earth-syst-sci.net/9/947/2009/
S. Rusjan et al.: Characteristics of the flash floods in W Slovenia in September 2007 949
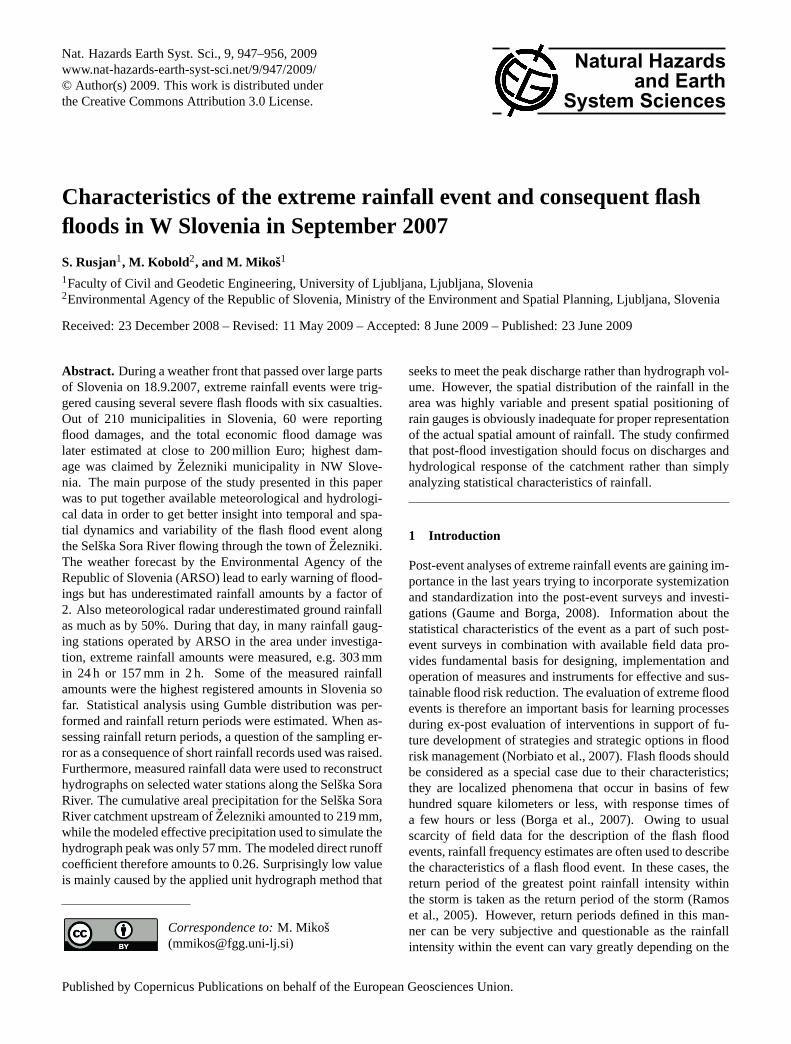
Fig. 1. Detailed map of the area around the town ofZelezniki withlocations of raingauges and water station operated by ARSO.
2 Overview of the hydrometeorological situation anddata assemblage
2.1 Synoptic situation, weather forecast and rainfall es-timation
Early on 18.9.2007, a highly baroclinic weather situation pre-vailed over Europe, and a sharp and elongated cold frontwas moving from the west towards the Alps. At 06:00 UTC(08:00 local time) on that day the prefrontal SW moist windscaused quasi-stationary convection over the north-westernparts of Slovenia that lasted for almost 12 h (Strajnar, 2008).The first precipitation zone moved over W Slovenia towardseast on 18.9.2007 between 03:00 and 05:00 UTC (05:00and 07:00 local time) followed by a short break. After8 a.m. some thunderstorms appeared in the hilly area of WSlovenia. Very heavy rain showers arisen after 9 a.m. Astrong thunderstorm line was established and located therefor nearly two hours. Next distinctive stationary thunder-storm line was built at 13:30 in a direction SW–NE over thesame, NW part of Slovenia. New thunderstorm cells wereformed over and over again during the afternoon and precip-itation spread and strengthened towards NE part of Slovenia.Wind had started to blow in lower atmosphere from north-east to northwest. New thunderstorms were formed repeat-edly when the cold front was passing and moving towardsthe south. Precipitation stopped in W part of Slovenia around9 p.m., in NW at midnight, and in SE during 2 and 3 a.m. nextmorning (Vertacnik, 2008).
During the movement of this weather front that passedover large parts of Slovenia on that day, in many rain-fall gauging stations operated by ARSO, extreme rainfallamounts were measured. The maximum measured 24 h accu-mulation was 303 mm at the Vogel Mountain in NW Slove-nia, while the most affected area was along Selska Sora Riverupstream the town ofZelezniki, where rainfall rates reachedup to 70 mm/h and 100 mm in 2 h (Fig. 1).
The operational high-resolution limited area model(LAM) hydrostatic model ALADIN/SI with a 9.5-km
19
Fig. 1. Detailed map of the area around the town of Železniki with locations of raingauges
and water station operated by ARSO.
Fig. 2. The forecast using ALADIN/SI model for the total 24-h precipitation in mm issued on
17.9.2007 0 UTC (left) and on 18.9.2007 at 0 UTC (right), in both cases given for 19.9.2007
at 6 UTC.
Fig. 2. The forecast using ALADIN/SI model for the total 24-h precipitation in mm issued on 17.9.2007 00:00 UTC left paneland on 18.9.2007 at 00:00 UTC right panel, in both cases given for19.9.2007 at 06:00 UTC.
resolution and 400 s time step is used by ARSO for fore-casting purposes. This model issued on 17.9.2007 at00:00 UTC underestimated (forecast for total 24-h precipi-tation on 18.9.2007: 144 mm/24 h) the actual measured pre-cipitation (actual rainfall rates: 25 mm/3h, 50 mm/6 h, and300 mm/24 h) in the SW part of Slovenia. Furthermore, itforecast very strong secondary rainfall maximum in the SSlovenia (133 mm) that actually did not happen (Fig. 2 left).The model issued on 18.9.2007 at 00:00 UTC was even muchworse in predicting location and rainfall amounts to happenon that day (Fig. 2 right), a situation that has already hap-pened before that a 48-h forecast turned out to be better thana 24-h one. Due to its rather coarse spatial resolution, theALADIN/SI model in its present form seemed to be unableto more accurately predict the storm development occurringat a local spatial scale.
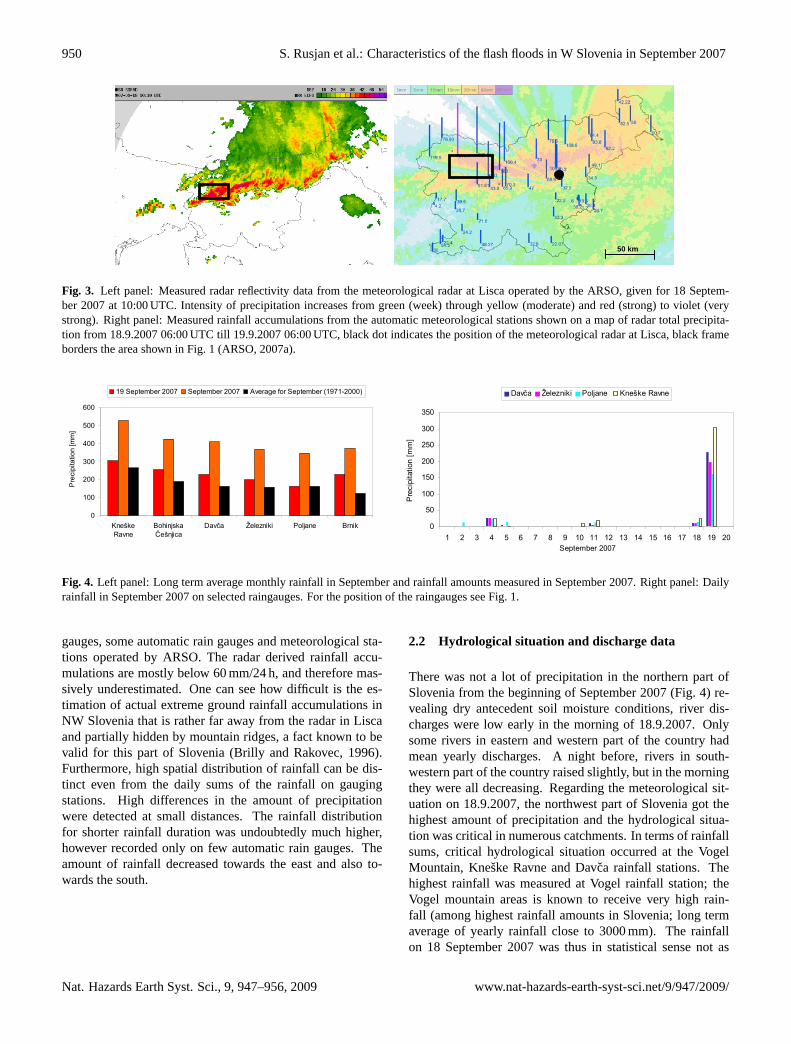
Also Poor Man’s Ensemble Prediction System using 14models probability forecast on 17.9.2007 12:00 UTC gaveonly 35% probability for 100 mm precipitation accumula-tion in 24 h for the period 18.9.2007 06:00 UTC to 19.9.200706:00 UTC (Strajnar, 2008). This Ensemble Prediction Sys-tem of meteorological models is done automatically on a reg-ular basis; therefore, no post-event recalculation of the me-teorological models was needed. The operational radar alsosubstantially underestimated the actual ground rainfall accu-mulation for 50%. A comparison between radar reflectivitydata from the meteorological radar positioned at Lisca for18.9.2007 10:00 UTC and the measured rainfall accumula-tions from the automatic meteorological stations shown ona map of radar total precipitation from 18.9.2007 06:00 UTCtill 19.9.2007 06:00 UTC is shown in Fig. 3. A study on radarobservations for this event revealed that the major sources ofradar underestimation were I) beam occlusion by orography;II) attenuation, due to the strong rainfall intensity; III) ver-tical profile of radar reflectivity, given the distance betweenthe impacted basins in W Slovenia and the radar site on Lisca(Bouilloud et al., 2009).
The extreme rainfall on 18 September 2007 was alsotracked on numerous rain gauging stations, mainly staff
www.nat-hazards-earth-syst-sci.net/9/947/2009/ Nat. Hazards Earth Syst. Sci., 9, 947–956, 2009
950 S. Rusjan et al.: Characteristics of the flash floods in W Slovenia in September 2007
20
Fig. 3. (left) Measured radar reflectivity data from the meteorological radar at Lisca operated
by the ARSO, given for September 18, 2007 at 10:00 UTC. Intensity of precipitation
increases from green (week) through yellow (moderate) and red (strong) to violet (very
strong). (right) Measured rainfall accumulations from the automatic meteorological stations
shown on a map of radar total precipitation from 18.9.2007 6 UTC till 19.9.2007 6 UTC;
black dot indicates the position of the meteorological radar at Lisca (ARSO, 2007a).
0
100
200
300
400
500
600
KneškeRavne
BohinjskaČešnjica
Davča Železniki Poljane Brnik
Pre
cipi
tatio
n [m
m]
19 September 2007 September 2007 Average for September (1971-2000)
0
50
100
150
200
250
300
350
1 2 3 4 5 6 7 8 9 10 11 12 13 14 15 16 17 18 19 20September 2007
Pre
cipi
tatio
n [m
m]
Davča Železniki Poljane Kneške Ravne
Fig. 4. (left) Long term average monthly rainfall in September (period 1971-2000) and
rainfall amounts measured in September 2007. (right) Daily rainfall in September 2007 on
selected raingauges. For the position of the raingauges see Fig. 1.
50 km
Fig. 3. Left panel: Measured radar reflectivity data from the meteorological radar at Lisca operated by the ARSO, given for 18 Septem-ber 2007 at 10:00 UTC. Intensity of precipitation increases from green (week) through yellow (moderate) and red (strong) to violet (verystrong). Right panel: Measured rainfall accumulations from the automatic meteorological stations shown on a map of radar total precipita-tion from 18.9.2007 06:00 UTC till 19.9.2007 06:00 UTC, black dot indicates the position of the meteorological radar at Lisca, black frameborders the area shown in Fig. 1 (ARSO, 2007a).
20
Fig. 3. (left) Measured radar reflectivity data from the meteorological radar at Lisca operated
by the ARSO, given for September 18, 2007 at 10:00 UTC. Intensity of precipitation
increases from green (week) through yellow (moderate) and red (strong) to violet (very
strong). (right) Measured rainfall accumulations from the automatic meteorological stations
shown on a map of radar total precipitation from 18.9.2007 6 UTC till 19.9.2007 6 UTC;
black dot indicates the position of the meteorological radar at Lisca (ARSO, 2007a).
0
100
200
300
400
500
600
KneškeRavne
BohinjskaČešnjica
Davča Železniki Poljane Brnik
Pre
cipi
tatio
n [m
m]
19 September 2007 September 2007 Average for September (1971-2000)
0
50
100
150
200
250
300
350
1 2 3 4 5 6 7 8 9 10 11 12 13 14 15 16 17 18 19 20September 2007
Pre
cipi
tatio
n [m
m]
Davča Železniki Poljane Kneške Ravne
Fig. 4. (left) Long term average monthly rainfall in September (period 1971-2000) and
rainfall amounts measured in September 2007. (right) Daily rainfall in September 2007 on
selected raingauges. For the position of the raingauges see Fig. 1.
50 km
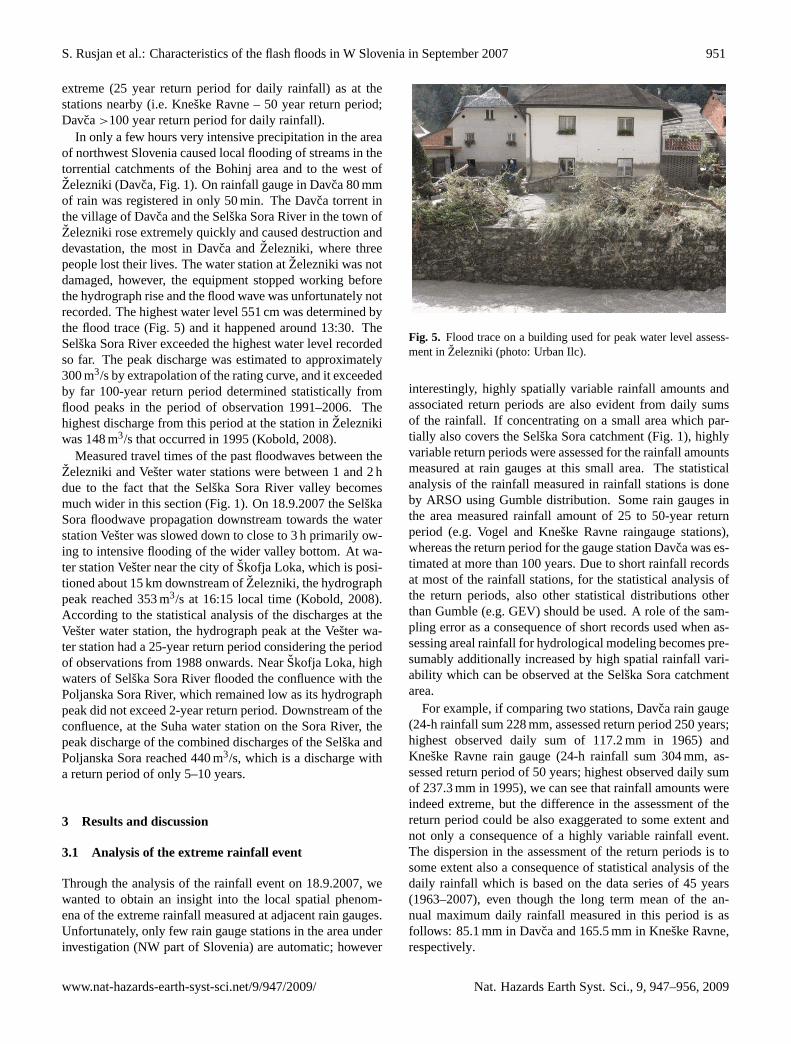
Fig. 4. Left panel: Long term average monthly rainfall in September and rainfall amounts measured in September 2007. Right panel: Dailyrainfall in September 2007 on selected raingauges. For the position of the raingauges see Fig. 1.
gauges, some automatic rain gauges and meteorological sta-tions operated by ARSO. The radar derived rainfall accu-mulations are mostly below 60 mm/24 h, and therefore mas-sively underestimated. One can see how difficult is the es-timation of actual extreme ground rainfall accumulations inNW Slovenia that is rather far away from the radar in Liscaand partially hidden by mountain ridges, a fact known to bevalid for this part of Slovenia (Brilly and Rakovec, 1996).Furthermore, high spatial distribution of rainfall can be dis-tinct even from the daily sums of the rainfall on gaugingstations. High differences in the amount of precipitationwere detected at small distances. The rainfall distributionfor shorter rainfall duration was undoubtedly much higher,however recorded only on few automatic rain gauges. Theamount of rainfall decreased towards the east and also to-wards the south.
2.2 Hydrological situation and discharge data
There was not a lot of precipitation in the northern part ofSlovenia from the beginning of September 2007 (Fig. 4) re-vealing dry antecedent soil moisture conditions, river dis-charges were low early in the morning of 18.9.2007. Onlysome rivers in eastern and western part of the country hadmean yearly discharges. A night before, rivers in south-western part of the country raised slightly, but in the morningthey were all decreasing. Regarding the meteorological sit-uation on 18.9.2007, the northwest part of Slovenia got thehighest amount of precipitation and the hydrological situa-tion was critical in numerous catchments. In terms of rainfallsums, critical hydrological situation occurred at the VogelMountain, Kneske Ravne and Davca rainfall stations. Thehighest rainfall was measured at Vogel rainfall station; theVogel mountain areas is known to receive very high rain-fall (among highest rainfall amounts in Slovenia; long termaverage of yearly rainfall close to 3000 mm). The rainfallon 18 September 2007 was thus in statistical sense not as
Nat. Hazards Earth Syst. Sci., 9, 947–956, 2009 www.nat-hazards-earth-syst-sci.net/9/947/2009/
S. Rusjan et al.: Characteristics of the flash floods in W Slovenia in September 2007 951
extreme (25 year return period for daily rainfall) as at thestations nearby (i.e. Kneske Ravne – 50 year return period;Davca>100 year return period for daily rainfall).
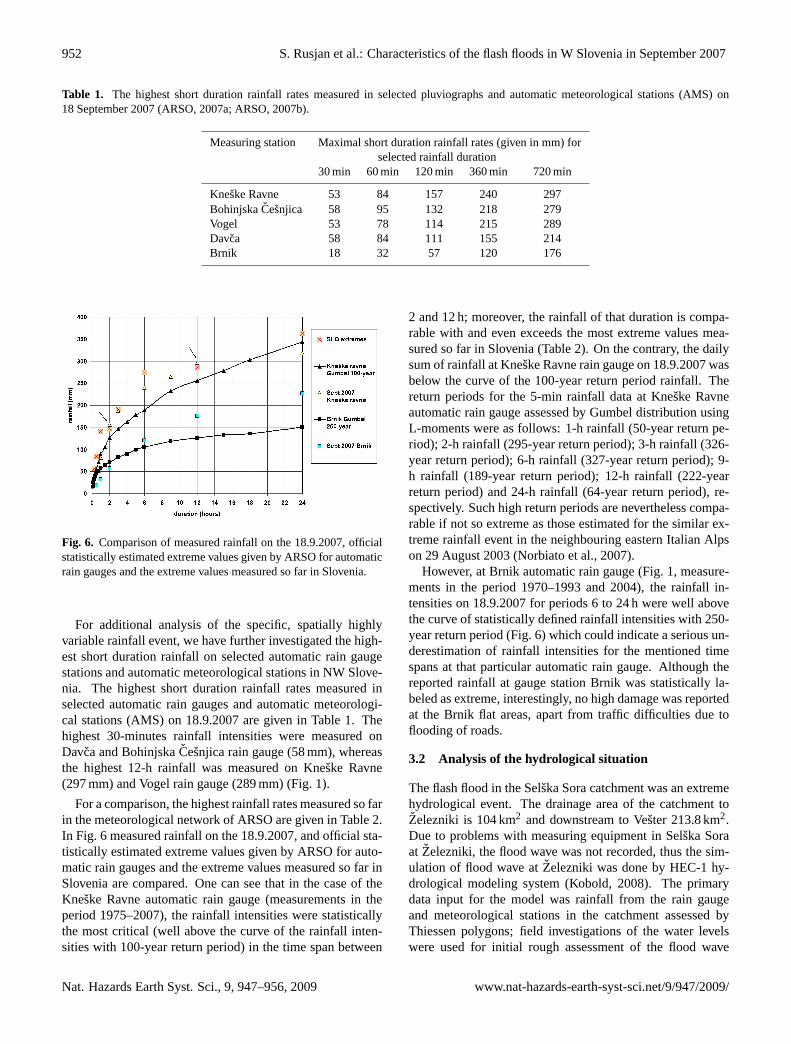
In only a few hours very intensive precipitation in the areaof northwest Slovenia caused local flooding of streams in thetorrential catchments of the Bohinj area and to the west ofZelezniki (Davca, Fig. 1). On rainfall gauge in Davca 80 mmof rain was registered in only 50 min. The Davca torrent inthe village of Davca and the Selska Sora River in the town ofZelezniki rose extremely quickly and caused destruction anddevastation, the most in Davca andZelezniki, where threepeople lost their lives. The water station atZelezniki was notdamaged, however, the equipment stopped working beforethe hydrograph rise and the flood wave was unfortunately notrecorded. The highest water level 551 cm was determined bythe flood trace (Fig. 5) and it happened around 13:30. TheSelska Sora River exceeded the highest water level recordedso far. The peak discharge was estimated to approximately300 m3/s by extrapolation of the rating curve, and it exceededby far 100-year return period determined statistically fromflood peaks in the period of observation 1991–2006. Thehighest discharge from this period at the station inZeleznikiwas 148 m3/s that occurred in 1995 (Kobold, 2008).
Measured travel times of the past floodwaves between theZelezniki and Vester water stations were between 1 and 2 hdue to the fact that the Selska Sora River valley becomesmuch wider in this section (Fig. 1). On 18.9.2007 the SelskaSora floodwave propagation downstream towards the waterstation Vester was slowed down to close to 3 h primarily ow-ing to intensive flooding of the wider valley bottom. At wa-ter station Vester near the city ofSkofja Loka, which is posi-tioned about 15 km downstream ofZelezniki, the hydrographpeak reached 353 m3/s at 16:15 local time (Kobold, 2008).According to the statistical analysis of the discharges at theVester water station, the hydrograph peak at the Vester wa-ter station had a 25-year return period considering the periodof observations from 1988 onwards. NearSkofja Loka, highwaters of Selska Sora River flooded the confluence with thePoljanska Sora River, which remained low as its hydrographpeak did not exceed 2-year return period. Downstream of theconfluence, at the Suha water station on the Sora River, thepeak discharge of the combined discharges of the Selska andPoljanska Sora reached 440 m3/s, which is a discharge witha return period of only 5–10 years.
3 Results and discussion
3.1 Analysis of the extreme rainfall event
Through the analysis of the rainfall event on 18.9.2007, wewanted to obtain an insight into the local spatial phenom-ena of the extreme rainfall measured at adjacent rain gauges.Unfortunately, only few rain gauge stations in the area underinvestigation (NW part of Slovenia) are automatic; however
Fig. 5. Flood trace on a building used for peak water level assess-ment inZelezniki (photo: Urban Ilc).
interestingly, highly spatially variable rainfall amounts andassociated return periods are also evident from daily sumsof the rainfall. If concentrating on a small area which par-tially also covers the Selska Sora catchment (Fig. 1), highlyvariable return periods were assessed for the rainfall amountsmeasured at rain gauges at this small area. The statisticalanalysis of the rainfall measured in rainfall stations is doneby ARSO using Gumble distribution. Some rain gauges inthe area measured rainfall amount of 25 to 50-year returnperiod (e.g. Vogel and Kneske Ravne raingauge stations),whereas the return period for the gauge station Davca was es-timated at more than 100 years. Due to short rainfall recordsat most of the rainfall stations, for the statistical analysis ofthe return periods, also other statistical distributions otherthan Gumble (e.g. GEV) should be used. A role of the sam-pling error as a consequence of short records used when as-sessing areal rainfall for hydrological modeling becomes pre-sumably additionally increased by high spatial rainfall vari-ability which can be observed at the Selska Sora catchmentarea.
For example, if comparing two stations, Davca rain gauge(24-h rainfall sum 228 mm, assessed return period 250 years;highest observed daily sum of 117.2 mm in 1965) andKneske Ravne rain gauge (24-h rainfall sum 304 mm, as-sessed return period of 50 years; highest observed daily sumof 237.3 mm in 1995), we can see that rainfall amounts wereindeed extreme, but the difference in the assessment of thereturn period could be also exaggerated to some extent andnot only a consequence of a highly variable rainfall event.The dispersion in the assessment of the return periods is tosome extent also a consequence of statistical analysis of thedaily rainfall which is based on the data series of 45 years(1963–2007), even though the long term mean of the an-nual maximum daily rainfall measured in this period is asfollows: 85.1 mm in Davca and 165.5 mm in Kneske Ravne,respectively.
www.nat-hazards-earth-syst-sci.net/9/947/2009/ Nat. Hazards Earth Syst. Sci., 9, 947–956, 2009
952 S. Rusjan et al.: Characteristics of the flash floods in W Slovenia in September 2007
Table 1. The highest short duration rainfall rates measured in selected pluviographs and automatic meteorological stations (AMS) on18 September 2007 (ARSO, 2007a; ARSO, 2007b).
Measuring station Maximal short duration rainfall rates (given in mm) forselected rainfall duration
30 min 60 min 120 min 360 min 720 min
Kneske Ravne 53 84 157 240 297BohinjskaCesnjica 58 95 132 218 279Vogel 53 78 114 215 289Davca 58 84 111 155 214Brnik 18 32 57 120 176
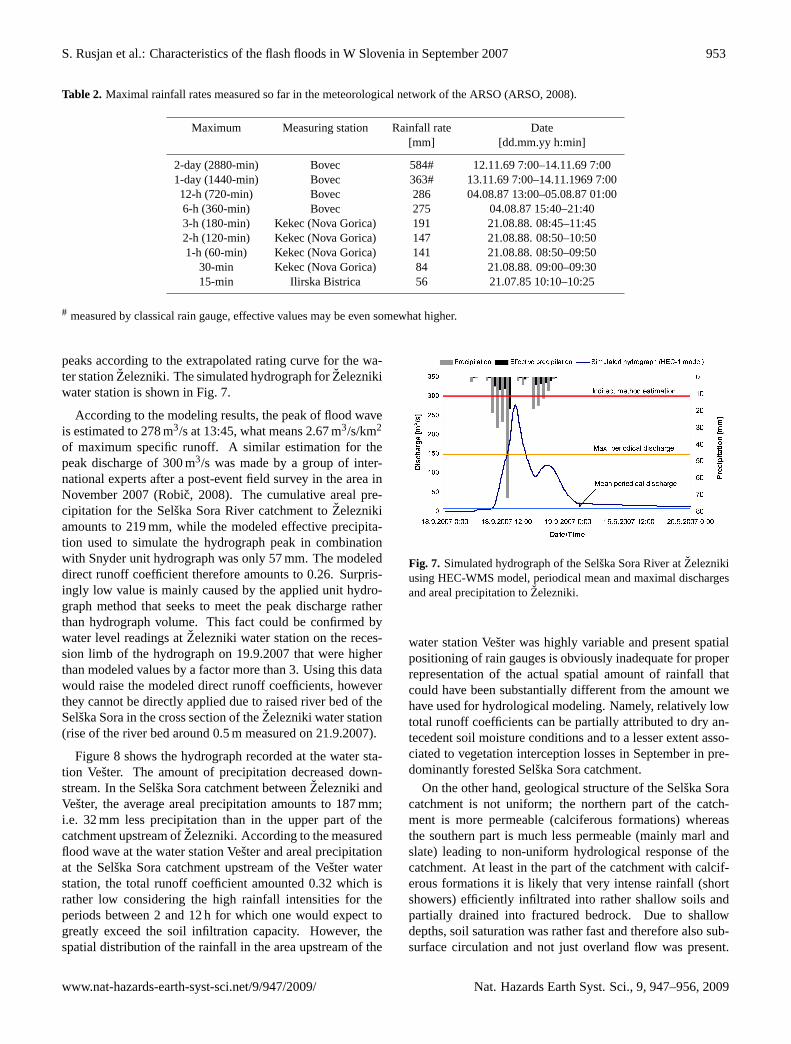
Fig. 6. Comparison of measured rainfall on the 18.9.2007, officialstatistically estimated extreme values given by ARSO for automaticrain gauges and the extreme values measured so far in Slovenia.
For additional analysis of the specific, spatially highlyvariable rainfall event, we have further investigated the high-est short duration rainfall on selected automatic rain gaugestations and automatic meteorological stations in NW Slove-nia. The highest short duration rainfall rates measured inselected automatic rain gauges and automatic meteorologi-cal stations (AMS) on 18.9.2007 are given in Table 1. Thehighest 30-minutes rainfall intensities were measured onDavca and BohinjskaCesnjica rain gauge (58 mm), whereasthe highest 12-h rainfall was measured on Kneske Ravne(297 mm) and Vogel rain gauge (289 mm) (Fig. 1).
For a comparison, the highest rainfall rates measured so farin the meteorological network of ARSO are given in Table 2.In Fig. 6 measured rainfall on the 18.9.2007, and official sta-tistically estimated extreme values given by ARSO for auto-matic rain gauges and the extreme values measured so far inSlovenia are compared. One can see that in the case of theKneske Ravne automatic rain gauge (measurements in theperiod 1975–2007), the rainfall intensities were statisticallythe most critical (well above the curve of the rainfall inten-sities with 100-year return period) in the time span between
2 and 12 h; moreover, the rainfall of that duration is compa-rable with and even exceeds the most extreme values mea-sured so far in Slovenia (Table 2). On the contrary, the dailysum of rainfall at Kneske Ravne rain gauge on 18.9.2007 wasbelow the curve of the 100-year return period rainfall. Thereturn periods for the 5-min rainfall data at Kneske Ravneautomatic rain gauge assessed by Gumbel distribution usingL-moments were as follows: 1-h rainfall (50-year return pe-riod); 2-h rainfall (295-year return period); 3-h rainfall (326-year return period); 6-h rainfall (327-year return period); 9-h rainfall (189-year return period); 12-h rainfall (222-yearreturn period) and 24-h rainfall (64-year return period), re-spectively. Such high return periods are nevertheless compa-rable if not so extreme as those estimated for the similar ex-treme rainfall event in the neighbouring eastern Italian Alpson 29 August 2003 (Norbiato et al., 2007).
However, at Brnik automatic rain gauge (Fig. 1, measure-ments in the period 1970–1993 and 2004), the rainfall in-tensities on 18.9.2007 for periods 6 to 24 h were well abovethe curve of statistically defined rainfall intensities with 250-year return period (Fig. 6) which could indicate a serious un-derestimation of rainfall intensities for the mentioned timespans at that particular automatic rain gauge. Although thereported rainfall at gauge station Brnik was statistically la-beled as extreme, interestingly, no high damage was reportedat the Brnik flat areas, apart from traffic difficulties due toflooding of roads.
3.2 Analysis of the hydrological situation
The flash flood in the Selska Sora catchment was an extremehydrological event. The drainage area of the catchment toZelezniki is 104 km2 and downstream to Vester 213.8 km2.Due to problems with measuring equipment in Selska Soraat Zelezniki, the flood wave was not recorded, thus the sim-ulation of flood wave atZelezniki was done by HEC-1 hy-drological modeling system (Kobold, 2008). The primarydata input for the model was rainfall from the rain gaugeand meteorological stations in the catchment assessed byThiessen polygons; field investigations of the water levelswere used for initial rough assessment of the flood wave
Nat. Hazards Earth Syst. Sci., 9, 947–956, 2009 www.nat-hazards-earth-syst-sci.net/9/947/2009/
S. Rusjan et al.: Characteristics of the flash floods in W Slovenia in September 2007 953
Table 2. Maximal rainfall rates measured so far in the meteorological network of the ARSO (ARSO, 2008).
Maximum Measuring station Rainfall rate Date[mm] [dd.mm.yy h:min]
2-day (2880-min) Bovec 584# 12.11.69 7:00–14.11.69 7:001-day (1440-min) Bovec 363# 13.11.69 7:00–14.11.1969 7:0012-h (720-min) Bovec 286 04.08.87 13:00–05.08.87 01:006-h (360-min) Bovec 275 04.08.87 15:40–21:403-h (180-min) Kekec (Nova Gorica) 191 21.08.88. 08:45–11:452-h (120-min) Kekec (Nova Gorica) 147 21.08.88. 08:50–10:501-h (60-min) Kekec (Nova Gorica) 141 21.08.88. 08:50–09:50
30-min Kekec (Nova Gorica) 84 21.08.88. 09:00–09:3015-min Ilirska Bistrica 56 21.07.85 10:10–10:25
# measured by classical rain gauge, effective values may be even somewhat higher.
peaks according to the extrapolated rating curve for the wa-ter stationZelezniki. The simulated hydrograph forZeleznikiwater station is shown in Fig. 7.
According to the modeling results, the peak of flood waveis estimated to 278 m3/s at 13:45, what means 2.67 m3/s/km2
of maximum specific runoff. A similar estimation for thepeak discharge of 300 m3/s was made by a group of inter-national experts after a post-event field survey in the area inNovember 2007 (Robic, 2008). The cumulative areal pre-cipitation for the Selska Sora River catchment toZeleznikiamounts to 219 mm, while the modeled effective precipita-tion used to simulate the hydrograph peak in combinationwith Snyder unit hydrograph was only 57 mm. The modeleddirect runoff coefficient therefore amounts to 0.26. Surpris-ingly low value is mainly caused by the applied unit hydro-graph method that seeks to meet the peak discharge ratherthan hydrograph volume. This fact could be confirmed bywater level readings atZelezniki water station on the reces-sion limb of the hydrograph on 19.9.2007 that were higherthan modeled values by a factor more than 3. Using this datawould raise the modeled direct runoff coefficients, howeverthey cannot be directly applied due to raised river bed of theSelska Sora in the cross section of theZelezniki water station(rise of the river bed around 0.5 m measured on 21.9.2007).
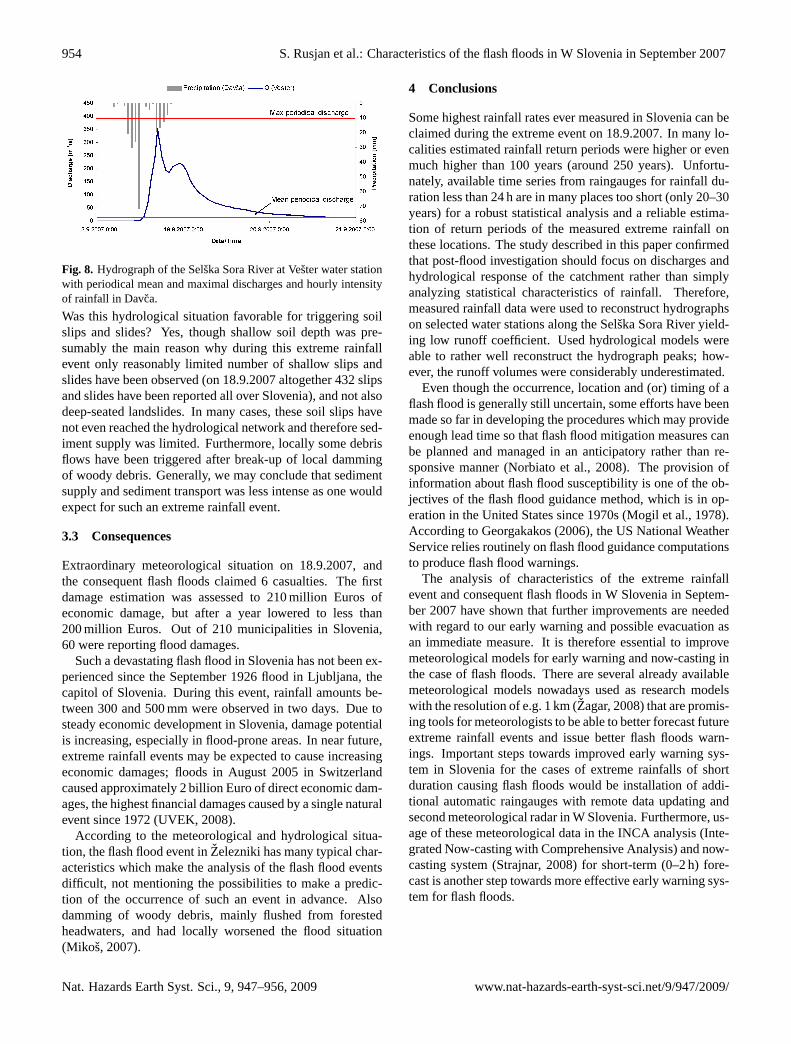
Figure 8 shows the hydrograph recorded at the water sta-tion Vester. The amount of precipitation decreased down-stream. In the Selska Sora catchment betweenZelezniki andVester, the average areal precipitation amounts to 187 mm;i.e. 32 mm less precipitation than in the upper part of thecatchment upstream ofZelezniki. According to the measuredflood wave at the water station Vester and areal precipitationat the Selska Sora catchment upstream of the Vester waterstation, the total runoff coefficient amounted 0.32 which israther low considering the high rainfall intensities for theperiods between 2 and 12 h for which one would expect togreatly exceed the soil infiltration capacity. However, thespatial distribution of the rainfall in the area upstream of the
Fig. 7. Simulated hydrograph of the Selska Sora River atZeleznikiusing HEC-WMS model, periodical mean and maximal dischargesand areal precipitation toZelezniki.
water station Vester was highly variable and present spatialpositioning of rain gauges is obviously inadequate for properrepresentation of the actual spatial amount of rainfall thatcould have been substantially different from the amount wehave used for hydrological modeling. Namely, relatively lowtotal runoff coefficients can be partially attributed to dry an-tecedent soil moisture conditions and to a lesser extent asso-ciated to vegetation interception losses in September in pre-dominantly forested Selska Sora catchment.
On the other hand, geological structure of the Selska Soracatchment is not uniform; the northern part of the catch-ment is more permeable (calciferous formations) whereasthe southern part is much less permeable (mainly marl andslate) leading to non-uniform hydrological response of thecatchment. At least in the part of the catchment with calcif-erous formations it is likely that very intense rainfall (shortshowers) efficiently infiltrated into rather shallow soils andpartially drained into fractured bedrock. Due to shallowdepths, soil saturation was rather fast and therefore also sub-surface circulation and not just overland flow was present.
www.nat-hazards-earth-syst-sci.net/9/947/2009/ Nat. Hazards Earth Syst. Sci., 9, 947–956, 2009
954 S. Rusjan et al.: Characteristics of the flash floods in W Slovenia in September 2007
Fig. 8. Hydrograph of the Selska Sora River at Vester water stationwith periodical mean and maximal discharges and hourly intensityof rainfall in Davca.
Was this hydrological situation favorable for triggering soilslips and slides? Yes, though shallow soil depth was pre-sumably the main reason why during this extreme rainfallevent only reasonably limited number of shallow slips andslides have been observed (on 18.9.2007 altogether 432 slipsand slides have been reported all over Slovenia), and not alsodeep-seated landslides. In many cases, these soil slips havenot even reached the hydrological network and therefore sed-iment supply was limited. Furthermore, locally some debrisflows have been triggered after break-up of local dammingof woody debris. Generally, we may conclude that sedimentsupply and sediment transport was less intense as one wouldexpect for such an extreme rainfall event.
3.3 Consequences
Extraordinary meteorological situation on 18.9.2007, andthe consequent flash floods claimed 6 casualties. The firstdamage estimation was assessed to 210 million Euros ofeconomic damage, but after a year lowered to less than200 million Euros. Out of 210 municipalities in Slovenia,60 were reporting flood damages.
Such a devastating flash flood in Slovenia has not been ex-perienced since the September 1926 flood in Ljubljana, thecapitol of Slovenia. During this event, rainfall amounts be-tween 300 and 500 mm were observed in two days. Due tosteady economic development in Slovenia, damage potentialis increasing, especially in flood-prone areas. In near future,extreme rainfall events may be expected to cause increasingeconomic damages; floods in August 2005 in Switzerlandcaused approximately 2 billion Euro of direct economic dam-ages, the highest financial damages caused by a single naturalevent since 1972 (UVEK, 2008).
According to the meteorological and hydrological situa-tion, the flash flood event inZelezniki has many typical char-acteristics which make the analysis of the flash flood eventsdifficult, not mentioning the possibilities to make a predic-tion of the occurrence of such an event in advance. Alsodamming of woody debris, mainly flushed from forestedheadwaters, and had locally worsened the flood situation(Mikos, 2007).
4 Conclusions
Some highest rainfall rates ever measured in Slovenia can beclaimed during the extreme event on 18.9.2007. In many lo-calities estimated rainfall return periods were higher or evenmuch higher than 100 years (around 250 years). Unfortu-nately, available time series from raingauges for rainfall du-ration less than 24 h are in many places too short (only 20–30years) for a robust statistical analysis and a reliable estima-tion of return periods of the measured extreme rainfall onthese locations. The study described in this paper confirmedthat post-flood investigation should focus on discharges andhydrological response of the catchment rather than simplyanalyzing statistical characteristics of rainfall. Therefore,measured rainfall data were used to reconstruct hydrographson selected water stations along the Selska Sora River yield-ing low runoff coefficient. Used hydrological models wereable to rather well reconstruct the hydrograph peaks; how-ever, the runoff volumes were considerably underestimated.
Even though the occurrence, location and (or) timing of aflash flood is generally still uncertain, some efforts have beenmade so far in developing the procedures which may provideenough lead time so that flash flood mitigation measures canbe planned and managed in an anticipatory rather than re-sponsive manner (Norbiato et al., 2008). The provision ofinformation about flash flood susceptibility is one of the ob-jectives of the flash flood guidance method, which is in op-eration in the United States since 1970s (Mogil et al., 1978).According to Georgakakos (2006), the US National WeatherService relies routinely on flash flood guidance computationsto produce flash flood warnings.
The analysis of characteristics of the extreme rainfallevent and consequent flash floods in W Slovenia in Septem-ber 2007 have shown that further improvements are neededwith regard to our early warning and possible evacuation asan immediate measure. It is therefore essential to improvemeteorological models for early warning and now-casting inthe case of flash floods. There are several already availablemeteorological models nowadays used as research modelswith the resolution of e.g. 1 km (Zagar, 2008) that are promis-ing tools for meteorologists to be able to better forecast futureextreme rainfall events and issue better flash floods warn-ings. Important steps towards improved early warning sys-tem in Slovenia for the cases of extreme rainfalls of shortduration causing flash floods would be installation of addi-tional automatic raingauges with remote data updating andsecond meteorological radar in W Slovenia. Furthermore, us-age of these meteorological data in the INCA analysis (Inte-grated Now-casting with Comprehensive Analysis) and now-casting system (Strajnar, 2008) for short-term (0–2 h) fore-cast is another step towards more effective early warning sys-tem for flash floods.
Nat. Hazards Earth Syst. Sci., 9, 947–956, 2009 www.nat-hazards-earth-syst-sci.net/9/947/2009/
S. Rusjan et al.: Characteristics of the flash floods in W Slovenia in September 2007 955
Acknowledgements.This research was funded by the Ministryof Higher Education, Science and Technology of the Republic ofSlovenia, research programme No. P2-180-0792 “Hydrotechnics,Hydraulics, and Geotechnics”. The rainfall data measured inselected gauging stations and used in this study for the statisticalanalysis of the event were kindly provided by the EnvironmentalAgency of the Republic of Slovenia. The authors thank twoanonymouos reviewers that help to substantially improve the paper.
Edited by: R. KirnbauerReviewed by: two anonymous referees
References
ARSO: Izjemen padavinski dogodek 18. septembra 2007(Extreme rainfall event on 18.9.2007 – in Slovenian),http://www.arso.gov.si/vreme/poro%c4%8dila%20in%20projekti/padavine18sep07.pdf, last access: 13.11.2007,Environmental Agency of the Republic of Slovenia, Ljubljana,17 p., 2007a.
ARSO: Porocilo o vremenski in hidroloski situaciji 18. septem-bra 2007 (A report on the meteorological and hydro-logical situation on 18. September 2007 – in Slove-nian), http://www.arso.gov.si/vode/publikacije%20in%20poro%c4%8dila/visokevode20070918.pdf, last access: 24.9.2007, En-vironmental Agency of the Republic of Slovenia, Ljubljana, 23p., 2007b.
ARSO: Slovenski vremenski rekordi (Slovenian meteorologicalrecords – in Slovenian),http://www.arso.gov.si/vreme/podnebje/slo vremenskirekordi.pdf, (access: 23.12.2008) EnvironmentalAgency of the Republic of Slovenia, Ljubljana, 5 p., 2008.
Baldini, L., Facheris, L., Giuli, D., Caporali, E., and Palmisano,E.: Analysis of radar and raingage measurements for a criticalmeteorological event in Tuscany, Surv. Geophys., 16, 253–264,1995.
Borga, M., Boscolo, P., Zanon, F., and Sangati, M.: Hydrometeoro-logical analysis of the August 29, 2003 flash flood in the easternItalian Alps. J. Hydrometeorol., 8(5), 1049–1067, 2007.
Bouilloud, L., Delrieu, G., Boudevillain, B., Zanon, F., and Borga,M.: Radar rainfall estimation for the post-event analysis of aSlovenian flash-flood case: application of the mountain referencetechnique at C-band frequency, Hydrol. Earth Syst. Sci. Discuss.,6, 667–696, 2009,http://www.hydrol-earth-syst-sci-discuss.net/6/667/2009/.
Brilly, M. and Rakovec, J.: Use of radar for flood forecasting. ActaHydrotechnica, 14(12), 123–136, 1996.
Chappell, C. F.: Quasi-stationary convective events, in: MesoscaleMeteorology and Forecasting edited by: Ray, P. S., Amer. Me-teor. Soc., 289–310, 1986.
Costa, J. E. and Jarrett, R. D.: An evaluation of selected extraordi-nary floods in the United States reported by the US, GeologicalSurvey and implications for future advancement of flood science,USGS, Scientific investigations, Report 2008–5160, Reston, Vir-ginia, 2008.
Creutin, J. D. and Borga, M.: Radar hydrology modifies the mon-itoring of flash flood hazard. Invited commentary, Hydrol. Pro-cess., 17(7), 1453–1456, 2003.
Delrieu, G., Ducrocq, V., Gaume, E., Nicol, J., Payrastre, O.,Yates, E., Kirstetter, P.-E., Andrieu, H., Ayral, P.-A., Bouvier,
C., Creutin, J.-D., Livet, M., Anquetin, S., Lang, M., Neppel, L.,Obled, C., Parent-du-Chatelet, J., Saulnier, G.-M., Walpersdorf,A., and Wobrock, W.: The Catastrophic Flash-Flood Event of8–9 September 2002 in the Gard Region, France: A First CaseStudy for the Cevennes–Vivarais Mediterranean Hydrometeoro-logical Observatory, J Hydrometeorol., 6, 34–52, 2005.
Doswell, III, C. A., Ramis, C., Romero, R., and Alonso, S.: A diag-nostic study of three heavy precipitation episodes in the westernMediterranean, Weather Forecast., 13, 102–124, 1998.
Fritsch, J. M., Houze, R. A., Adler, R., Bluestein, H., Bosart, L.,Brown, J., Carr, F., Davies, C., Johnson, R. H., Junker, N., Kuo,Y.-H., Rutledge, S., Smith, J., Toth, Z., Wilson, J. W., Zipser,E., Zrnic, D.: Quantitative precipitation forecasting: report ofthe eighth prospectus development team, US weather researchprogram, B. Am. Meteorol. Soc., 79, 285–299, 1998.
Gaume, E., Livet, M., Desbordes, M., and Villeneuve, J.-P.: Hy-drological analysis of the River Aude flash-flood on 12 and13 November 1999, J. Hydrol., 286, 135–154, 2004.
Gaume, E. and Borga, M.: Post-flood field investigations in uplandcatchments after major flash floods: proposal of a methodologyand illustrations, J. Flood Risk Manag., 1, 175–189, 2008.
Georgakakos, K. P.: Analytical results for operational flash floodguidance, J. Hydrol., 317(1–2), 81–103, 2006.
Kelsch, M., Caporali, E., and Lanza, L. G.: Hydrometeorology offlash floods, in: Coping with Flash Floods, edited by: Gruntfest,E. and Handmer, J., Kluwer Academic Publishers, Dordrecht,Nato Science Series 2 – Environmental security, 77, 19–35, 2001.
Kobold, M.: High waters and floods of 18 September 2007, Ujma,http://www.sos112.si/slo/tdocs/ujma/2008/065.pdf, last access:19.12.2008, 22, 65–75, 2008.
Maddox, R. A., Chappell, C. F., and Hoxit, L. R.: Synoptic andmeso-alpha scale aspects of flash flood events, B. Am. Meteorol.Soc., 60, 115–123, 1979.
Mikos, M., Cetina, M., and Brilly, M.: Hydrologic conditionsresponsible for triggering the Stoze landslide, Slovenia, Eng.Geol., 73, 193–213, 2004.
Mikos, M.: Upravljanje tveganj in nova Evropska direktiva opoplavnih tveganjih (Risk management and the new EuropeanDirective on flood risks), Gradbeni vestnik, 56, 278–285, 2007.
Mogil, H. M., Monro, J. C., and Groper, H. S.: NWS’s flash floodwarning and disaster preparedness programs, B. Am. Meteorol.Soc., 59, 690–699, 1978.
Montz, B. E.: Assessing the effects and effectiveness of flash floodmitigation strategies, in: Coping with Flash Floods, edited by:Gruntfest, E. and Handmer, J., Kluwer Academic Publishers,Dordrecht, Nato Science Series 2 –Environmental security, 77,123–134, 2001.
Norbiato, D., Borga, M., Sangati, M., and Zanon, F.: Regional fre-quency analysis of extreme precipitation in the eastern ItalianAlps and the August 29, 2003 flash flood, J. Hydrol., 345, 149–166, 2007.
Norbiato, D., Borga, M., Esposti, S. D., Gaume, E., Anquetin, E.:Flash flood warning based on rainfall thresholds and soil mois-ture conditions: An assessment for gauged and ungauged basins,J. Hydrol., 362, 274–290, 2008.
Ogden, F. L., Sharif, H. O., Senarath, S. U. S., Smith, J. A., Baeck,M. L., and Richardson, J. R.: Hydrologic analysis of the FortCollins, Colorado, flash flood of 1997, J. Hydrol., 228, 82–100,2000.
www.nat-hazards-earth-syst-sci.net/9/947/2009/ Nat. Hazards Earth Syst. Sci., 9, 947–956, 2009
956 S. Rusjan et al.: Characteristics of the flash floods in W Slovenia in September 2007
Ramos, M. H., Creutin, J. D., and Leblois, E.: Visualization ofstorm severity, J. Hydrol., 315, 295–307, 2005.
Robic, M.: Investigating floods in the Selska Sora Valley,on 18 September 2007, with Hydrate international group,http://www.sos112.si/slo/tdocs/ujma/2008/111.pdf, last access:19.12.2008, Ujma, 22, 111–116, 2008.
Rochette, S. M. and Moore, J. T.: Initiation of an elevated mesoscaleconvective system associated with heavy rainfall, Weather Fore-cast., 11(4), 443–457, 1996.
Ruin, I., Creutin, J. D., Anquetin, S., and Lutoff, C.: Human ex-posure to flash floods – Relation between flood parameters andhuman vulnerability during a storm of September 2002 in South-ern France, J. Hydrol., 361, 199–213, 2008.
Schwein, N. O.: The Effect of Quantitative Precipitation Forecastson River Forecasts, NOAA Technical Memorandum NWS-CR-110, National Weather Service, Washington DC, 1996.
Strajnar, U.: Forecasting of Extreme Stationary Convection –18/9/2007 Zelezniki Flash Flood,http://ams.confex.com/ams/pdfpapers/140913.pdf, last access: 24.7.2008, Extended Ab-stracts of the 13th Conference on Mountain Meteorology, 2008.
UVEK: Hochwasser 2005 in der Schweiz – Synthesisbericht zurEreignisanalyse, http://www.umwelt-schweiz.ch/div-7529-d,last access: 19.12.2008, Eidgenossiches Departement furUmwelt, Verkehr, Energie und Kommunikation, Bern, 2008.
Vertacnik, G.: Climatological description of the exceptional pre-cipitation event of 18 September 2007,http://www.sos112.si/slo/tdocs/ujma/2008/058.pdf, last access: 19.12.2008, Ujma, 22, 58–64, 2008.
Zagar, M.: Analysis of causes and numerical modeling of heavyprecipitation on 18 September 2007,http://www.sos112.si/slo/tdocs/ujma/2008/101.pdf, last access: 19.12.2008, Ujma, 22,101–104, 2008.
Nat. Hazards Earth Syst. Sci., 9, 947–956, 2009 www.nat-hazards-earth-syst-sci.net/9/947/2009/